charge #1 - united states department of the treasury · pdf fileus treasury bills are critical...
TRANSCRIPT

Charge #1 Treasury bill supply as a percentage of the total Treasury debt outstanding is currently about 11%, a multi-decade low. At the same time, with $1.4 trillion in Treasury bills outstanding, the total volume of Treasury bills outstanding remains near historically high levels. What are the drivers of potential demand for high-quality, short-dated securities? Given these considerations, should the Treasury either increase or decrease Treasury bill issuance in the coming year?
1

Introduction
Current developments in market structure, regulations, and policy have the potential to change significantly the supply and demand in the market for short-end, high-quality assets where Treasury Bills are centric. US Treasury Bills are critical to the financial ecosystem, as they are the closest substitute to cash given strong liquidity, no credit risk, and minimal duration risk.
2

What makes T-bills special? T-bills are considered the safest short-term assets available to all investors. They are particularly important to those who • do not have access to currency in
large denominations, • do not have access to reserves at
the central banks (only banks do), • do not have access to Reverse Repo
with the Fed (as do banks, dealers, MFs, and FX reserve managers),
• are too large for insured deposits.
3
• T-bills are highly liquid compared to other non-insured deposit short term assets.
• Demand for T-bills and short -term High Quality Liquid Assets (HQLA) has increased due to capital and Dodd-Frank related regulations.
• T-bills are generally able to maintain their liquidity. While other markets may be more challenged as a result of leverage ratio constraints, making it more difficult to make markets or maintain a large balance sheet, T-bills appear to have been immune to such issues .
Who Can Access What? T-Bills Short TSY Coupons Commercial Paper Tri-Party Repo Fed RRP Fed Account earning IOER
MMMF X X X X X Asset Managers X X X X Corporates X X X X Municipalities X X X Banks X X X X X X Broker/Dealers X X X X X Size ($bn)* 1,458 1,404 1,014 1,495** 397 2,503***
Sources: SIFMA, Federal Reserve, US Treasury *As of December 31, 2014 unless otherwise noted ** Excludes Fed RRP, as of December 9, 2014 ***Excess reserves

T-bill substitutes Short Coupons • Price discovery challenges – no
weekly new issues, only monthly maturities, smaller sizes , and less liquidity
Repo • Best substitute for T-bills ,as they
trade at a discount • Deep and liquid market for
overnights, but subject to seasonal balance sheet constraints
• Mature daily (or on a specific day) rather than waiting for Thursday T-bill settlement
Treasury FRNs • WAL issues for 2a7 funds until they
roll down the curve • Awkward index to hedge Agency D/Ns & Short coupons • Excludes Treasury-only investors • Market shrinking as Agency
balance sheets are reduced 4
Dec-07 Dec-10 Dec-14 T-Bills 1,004 1,773 1,458 Treasury Coupons <1y 616 835 1,404 Agency Debt <1y 834 565 629 Total S.T. HQLA (ex reserves) 2,453 3,172 3,491 Financial CP 815 530 530 Non-Fin CP 163 128 261 ABCP 803 379 224 Total CP 1,781 1,037 1,014 TSY Repo (Tri-Party)1 1,135 616 679 Non-TSY Repo (Tri-Party)1 667 1,083 960 Total Repo 1,802 1,699 1,639 Short IG Corp coupons 149 147 285 Total 6,185 6,056 6,428
Outstanding Short-End Supply ($bn)
Sources: SIFMA, Federal Reserve, ICI, Credit Suisse Liquid US Corp Index+ 1 2007 is estimated

Short-end, high-quality asset supply has remained stable post-crisis Aggregate amounts of short-end, high-quality assets have remained relatively stable since 2012.
Short-end senior agency debt has fallen to pre-crisis levels, and although it has climbed from recent lows , it is not expected to grow significantly as a result of operational constraints.
T-bills outstanding have fallen by over 25% from the 2009 peak, but Treasury coupons within one year have risen dramatically.
5
400
500
600
700
800
900
1,000
1,100
1,200
Jan-07 Jan-08 Jan-09 Jan-10 Jan-11 Jan-12 Jan-13 Jan-14 Jan-15
All GSE Short Term Debt ($bn)
Sources: US Treasury Department, ICI, Federal Reserve, Company reports
0
500
1,000
1,500
2,000
2,500
3,000
3,500
Jan-07 Jan-08 Jan-09 Jan-10 Jan-11 Jan-12 Jan-13 Jan-14
Holders of Bills and Treasury Coupons <1y ($bn)Everyone else (ex MMMF and FX reserve managers)FX Reserve ManagersMFs

Regulatory Changes Impacting Demand for T-Bills
• Money Fund Reforms – Investors are reassessing Prime funds as a liquidity vehicle, with estimates of a $300
billion reallocation from Prime to Government funds. – Funds are in the process of announcing changes to structure, most notably with Fidelity
re-classifying certain Prime funds as Government funds,
• Changes in Bank Capital Rules – Liquidity Coverage Ratio (LCR) and Net Stable Funding Ratio (NSFR)
– Banks have to hold more high-quality liquid assets (HQLA) and/or shorter-duration assets while extending the maturity of their borrowing.
– This increases demand for a while, decreasing supply of short-term HQLA.
• Leverage Ratios – Smaller balance sheets on the whole diminish borrowing in repo.
• Dodd-Frank – More HQLA Needed for Collateral Posting – Bills receive favorable haircut treatment; therefore, they are generally the preferred
security for margin posting.
6
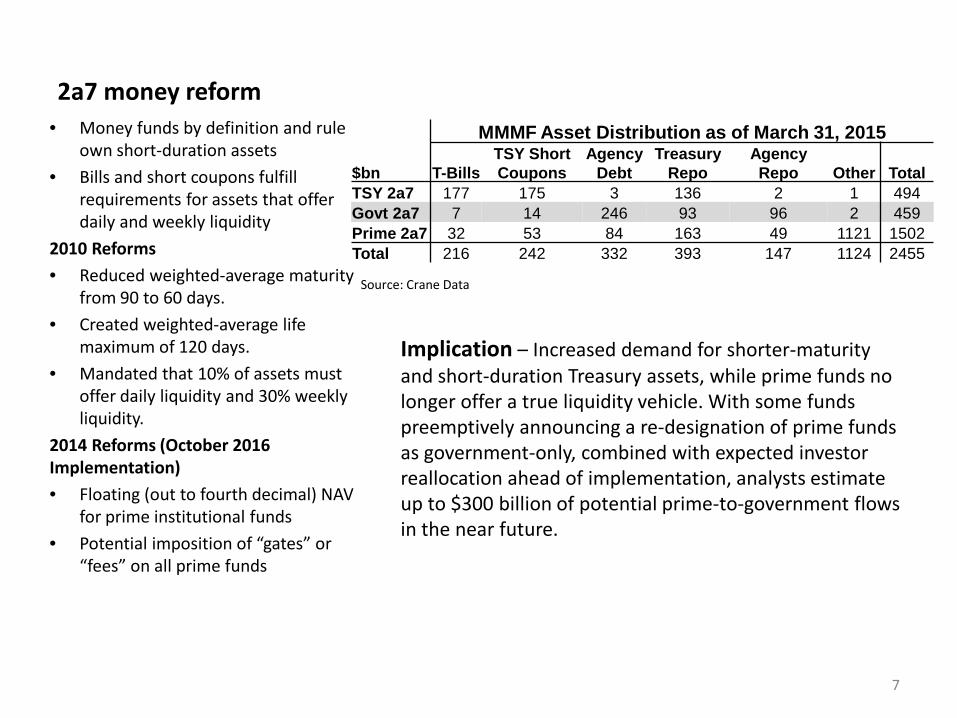
2a7 money reform • Money funds by definition and rule
own short-duration assets • Bills and short coupons fulfill
requirements for assets that offer daily and weekly liquidity
2010 Reforms • Reduced weighted-average maturity
from 90 to 60 days. • Created weighted-average life
maximum of 120 days. • Mandated that 10% of assets must
offer daily liquidity and 30% weekly liquidity.
2014 Reforms (October 2016 Implementation) • Floating (out to fourth decimal) NAV
for prime institutional funds • Potential imposition of “gates” or
“fees” on all prime funds
7
Source: Crane Data
Implication – Increased demand for shorter-maturity and short-duration Treasury assets, while prime funds no longer offer a true liquidity vehicle. With some funds preemptively announcing a re-designation of prime funds as government-only, combined with expected investor reallocation ahead of implementation, analysts estimate up to $300 billion of potential prime-to-government flows in the near future.
MMMF Asset Distribution as of March 31, 2015
$bn T-Bills TSY Short Coupons
Agency Debt
Treasury Repo
Agency Repo Other Total
TSY 2a7 177 175 3 136 2 1 494 Govt 2a7 7 14 246 93 96 2 459 Prime 2a7 32 53 84 163 49 1121 1502 Total 216 242 332 393 147 1124 2455

Capital rules
8
Bank holdings of Treasuries have increased over $200 billion since 2012 as result of regulatory developments. Under various rules, banks are required to hold additional HQLA. • Liquidity coverage ratio (LCR)
requires large banks to hold HQLA equal to 30 days of peak cumulative cash outflow.
• Under LCR rules, Treasuries receive no haircut, while other assets (Agency MBS) have >15% haircuts.
• Net stable funding ratio (NSFR) rules will incentivize holding Treasury securities and shorter-term assets.
On the liabilities side, the LCR and NSFR encourage banks to extend the maturity profile of funding. • Banks funding less short-term. • Banks actively discouraging large,
non-operational deposits.
Sources: Federal Reserve, FDIC

Capital and leverage ratios
9 10%
13%
16%
19%
22%
25%
28%
1993 1994 1996 1998 2000 2001 2003 2005 2007 2008 2010 2012 2014
Non-Deposit Liabilities as percent ofNon-Reserve Assets
Bank capital rules have caused firms to reduce leverage throughout the system. • Balance sheet reduction has often
come with reduced repo books. • The easiest means for financial
firms to increase ratios is to shrink assets and corresponding liabilities.
Balance sheet reduction has been broad based – causing a reduction in liabilities that were instruments available to investors. • Deposits as a share of liabilities
has increased given their favorable treatment.
• Bank non-deposit liabilities have declined significantly as a source of funding non-reserve assets.
Sources: Credit Suisse
Sources: FDIC

Dodd-Frank impacts Dodd-Frank/Central Clearing • T-bills receive the most favorable
treatment of securities for posting, with haircuts for T-bills 0.5% at CME, compared to 2% for 1- to 3-year Treasury securities.
It was estimated in the Q2 2013 TBAC discussion that as a result of the pro-cyclical demand for high-quality collateral (HQC), a stressed scenario could result in incremental demand from clearing, bilateral margining, and flight to quality flows that approaches $10 trillion.
10
Sources: http://www.cmegroup.com/clearing/financial-and-collateral-management/#Tbills
Source: Q2 2013 TBAC

Additional Market Developments Impacting Bill Supply and Demand
• Trajectory of deficits/ fiscal policy – The budget outlook is positive for the next several years. – The Treasury could fund much of the expected deficit through T-bills without changing
coupon sizes, as they remain regular and predictable.
• Increasing cash balances – The Treasury could inexpensively fund increased cash balances by issuing a modest
amount of T-bills. – Demand for short-term Treasuries should remain robust; therefore, adding a new
maturity should not be disruptive. – A new short-term maturity could help increase front-end liquidity by creating a shorter-
term primary market to “prove the level” where T-bills are trading.
11

Deficits could largely be addressed by adjusting T-bill issuance Deficits should begin to rise after FY 2016, particularly in FY 2019. Bills should be used in their traditional function as stabilizer.
Ultimately, coupon issuance might also need to be increased, but if the Fed continues to reinvest, this would be far into the future.
The entirety of the incremental deficit could be financed by increased T-bill issuance to the public (provided that the Fed reinvests 100%).
As deficits rise and if the roll-off of SOMA Treasury holdings is low, T-bills as a portion of the market can grow during the first few years.
12
8%
13%
18%
23%
28%
33%
38%
43%
Jul-52 Jul-58 Jul-64 Jul-70 Jul-76 Jul-82 Jul-88 Jul-94 Jul-00 Jul-06 Jul-12 Jul-18
Bills as % of Marketable Debt Forecast
(2,500)
(1,500)
(500)
500
1,500
2,500
2015 2016 2017 2018 2019 2020 2021 2022 2023
Redemptions Gross Issuance Net T-Bill GrowthUS$bn
*Available to the market, assumes 100% Fed Treasury reinvestment
Source: US Treasury, estimates after March 2015

Treasury increasing cash balances could be funded through increase in bills Current coupon and FRN issuance levels over the next two years could fund a significant portion of cash balance increase.
Should the Treasury wish to increase cash balance beyond coupons, there is scope to increase T-bill issuance.
Creation of a 1- or 2-week and an 8-week bill could generate several hundred billion that could be rolled.
Banks are now net lenders into cash markets as regulations force them to borrow term and less wholesale, meaning funds need more front-end collateral.
The Treasury could increase cash balance to the $200 billion to $250 billion range without adjusting coupon issuance.
13
0
50
100
150
200
250
300
350
12/12 12/13 12/14 12/15 12/16 12/17
Ending Cash Balance
Source: US Treasury, estimates after March 2015
Source: FDIC
Federal Reserve Rate Normalization and Reverse Repo Facility
• System Open Market Account (SOMA) Treasury Securities During “Normalization” – Fed may not roll off any SOMA Treasury securities. – Should the FOMC decide to allow Treasury securities to roll off, the Treasury would have
to increase issuance to the market in relatively short order, likely requiring increased coupon sizes while also driving T-bill supply higher.
• Reverse Repo Facility a Useful Tool for Front-End Liquidity – This facility allows non-dealer short-end market participants to access the SOMA
collateral pool. – It creates short-term supply on demand, helping financial stability beyond its monetary
policy uses.
14

The elephant in the room is monetary, fiscal interactions Reserves, Fed’s RRP facility, dealer and tri-party repo, and T-bills are substitutes. They are money or have high moneyness. • The supply of these assets
depends on policy choices and elasticities influenced by regulation and monetary policy.
If the RRP facility grows to be large, money market government funds should grow substantially. • This is the end result of a
transition from high repo to high reserve balances to large government money market funds holding T-bills or RRP.
• RRP supply should have a major impact on the demand for bills. RRP also should help re-shape the system in a way that might guarantee strong T-bill demand in the future, especially if the Fed shrinks its balance sheet.
15
Source: the BLOOMBERG PROFESSIONALTM service
Duration Risk
Credit RiskLiquidity Risk
Cash10 year TreasuryIGABS
Moneyness = Low Duration, Liquidity, and Credit Risk
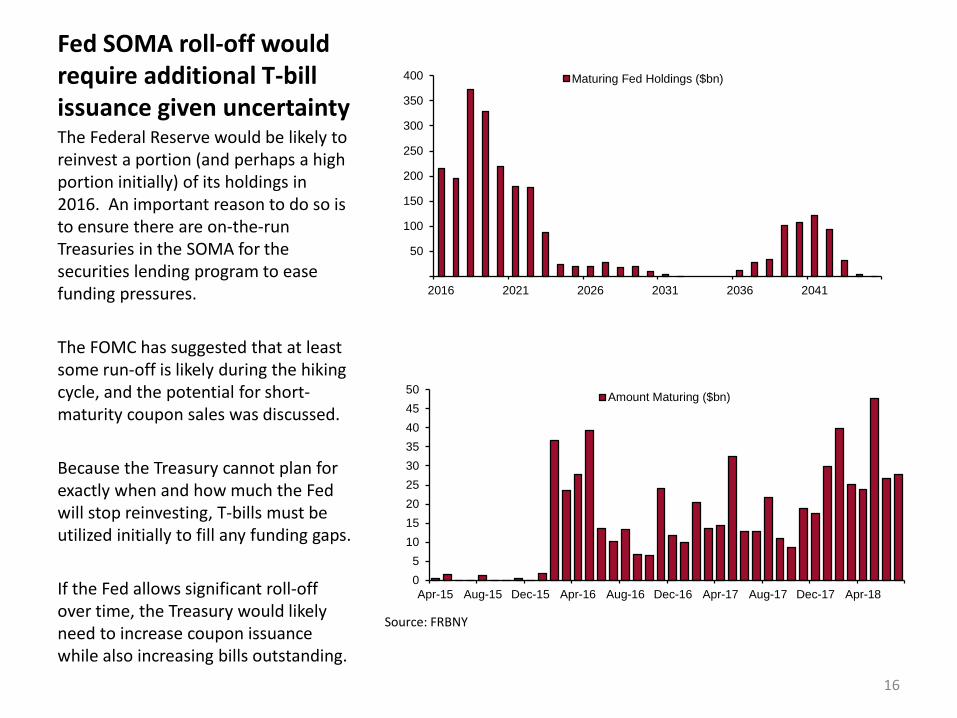
Fed SOMA roll-off would require additional T-bill issuance given uncertainty The Federal Reserve would be likely to reinvest a portion (and perhaps a high portion initially) of its holdings in 2016. An important reason to do so is to ensure there are on-the-run Treasuries in the SOMA for the securities lending program to ease funding pressures. The FOMC has suggested that at least some run-off is likely during the hiking cycle, and the potential for short-maturity coupon sales was discussed. Because the Treasury cannot plan for exactly when and how much the Fed will stop reinvesting, T-bills must be utilized initially to fill any funding gaps. If the Fed allows significant roll-off over time, the Treasury would likely need to increase coupon issuance while also increasing bills outstanding.
16
05
101520253035404550
Apr-15 Aug-15 Dec-15 Apr-16 Aug-16 Dec-16 Apr-17 Aug-17 Dec-17 Apr-18
Amount Maturing ($bn)
50
100
150
200
250
300
350
400
2016 2021 2026 2031 2036 2041
Maturing Fed Holdings ($bn)
Source: FRBNY
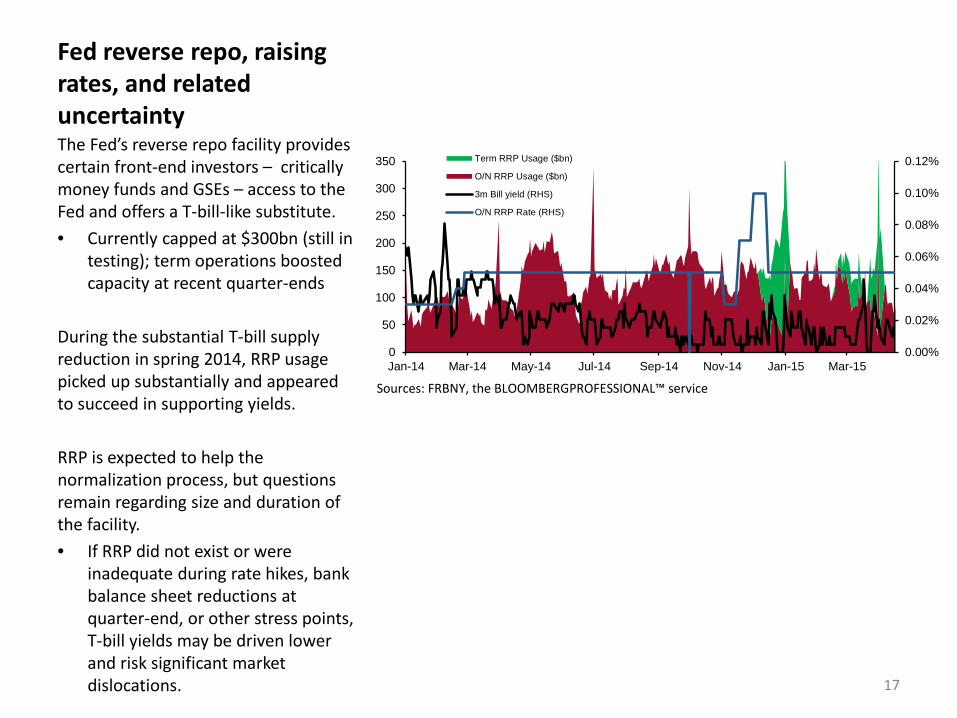
Fed reverse repo, raising rates, and related uncertainty The Fed’s reverse repo facility provides certain front-end investors – critically money funds and GSEs – access to the Fed and offers a T-bill-like substitute. • Currently capped at $300bn (still in
testing); term operations boosted capacity at recent quarter-ends
During the substantial T-bill supply reduction in spring 2014, RRP usage picked up substantially and appeared to succeed in supporting yields. RRP is expected to help the normalization process, but questions remain regarding size and duration of the facility. • If RRP did not exist or were
inadequate during rate hikes, bank balance sheet reductions at quarter-end, or other stress points, T-bill yields may be driven lower and risk significant market dislocations. 17
Sources: FRBNY, the BLOOMBERGPROFESSIONAL™ service
0.00%
0.02%
0.04%
0.06%
0.08%
0.10%
0.12%
0
50
100
150
200
250
300
350
Jan-14 Mar-14 May-14 Jul-14 Sep-14 Nov-14 Jan-15 Mar-15
Term RRP Usage ($bn)
O/N RRP Usage ($bn)
3m Bill yield (RHS)
O/N RRP Rate (RHS)

Conclusion • In order to satisfy demand and ensure market function, we suggest that the Treasury at least maintains
the current level of T-bills outstanding over the next 12 months. This would require either maintaining a larger cash balance or reducing coupon issuance.
– If possible, the Treasury should consider increasing the level of T-bills outstanding. – Otherwise, T-bills outstanding would likely decline over the coming quarters as funding needs will be smaller than
cash raised by coupon issuance.
• Demand for short-term, HQLA is increasing as a result of structural market changes stemming from bank capital rules, 2a-7 reform, and growing clearing/ margin needs.
• T-bill substitutes are either stagnating or declining in size as a result of developments such as shrinking bank balance sheets or have drawbacks such as failing to offer truly comparable liquidity.
• These dual dynamics suggest that appetite exists for greater T-bill supply and that there is relatively little risk of crowding out other short-term products.
• From the Treasury’s perspective, increasing T-bill issuance now could help it maintain a larger cash balance and would afford flexibility in navigating uncertain monetary policy periods ahead.
• The Fed’s reverse repo facility is providing a key vehicle for front-end investors, in the event of a stress event or if the facility isn’t sufficiently large to absorb funds, potentially overwhelming flows into T-bills and resulting in dislocations .
• The Treasury could approach increasing supply either by increasing current auction sizes or introducing regular 1-week and 2-month issuance.
– If the Treasury increases current auction sizes, we recommend that those adjustments be made primarily to 4-week and 13-week bills, as structural, regulatory-driven demand is highest for shorter-dated paper.
– Alternatively, considering new auction tenors could provide additional points of price discovery, enhancing liquidity and avoiding ballooning individual auction sizes, particularly down the road as deficits grow.
18

Mix of T-bill issuance – possible increases to current tenors If the Treasury increases current auction sizes, we recommend that those adjustments be made primarily to 4-week and 13-week T-bills, as structural, regulatory-driven demand is highest for shorter-dated paper. A recent survey of primary dealers suggests that 4-week T-bill auctions could grow to ~$56bn and 13-week bill auctions to ~$39bn – increases of $20bn and $14bn, respectively, from the last quarter’s average auction size – without significant yield deviations from fair value. The same survey also suggests that the Treasury could make these adjustments relatively quickly.
19
Tranche
Minimum auction size needed to
maintain benchmark
liquidity ($bil)
Maximum auction size that could be
issued without causing significant
yield deviations from fair value ($bil)
Maximum change (+/-) per
quarter in auction size
($bil)
Auction size over last 13 weeks
MEAN STD MEAN STD MEAN STD MEAN Max/Min
4-week 22 4.5 56 5.4 17 7.8 36.2 40 / 30
13-week 20 2.7 39 6.5 11 5.2 25.1 26 / 24
26-week 19 2.5 37 4.5 10 5 25.1 26 / 24
52-week 17 2.6 32 4.3 6 2.3 25 25 / 25
-
50
100
150
200
250
Nov-14 Dec-14 Jan-15 Feb-15 Mar-15 Apr-15
Recent mix of Bill Issuance by month ($bn)
4-week 13-week 26-week 52-week
Sources: Primary Dealer Auction Size Survey, the BLOOMBERG PROFESSIONAL™ service
Source: the BLOOMBERG PROFESSIONAL™ service

Mix of T-bill issuance – possible to consider 1-week and 2-month Alternatively, considering new auction tenors could provide additional points of price discovery, enhancing liquidity and avoiding ballooning individual auction sizes, particularly down the road as deficits grow. Aggregate demand for T-bills is very short as short tenors are most cash-like and fit the demand from some of the larger investor classes. • 2a7 funds demand for shorter
assets increases as maturities shorten. This pivots at about 30 days (4-5 weeks).
The Treasury could adjust sizes based on near-term demand, reduce them into quarter-end if necessary, and use them in place of CMBs for short-term borrowing needs.
20
Sources: Crane Data, the BLOOMBERG PROFESSIONLTM service
20
40
60
80
100
120
140
160
180
Apr-15 May-15 Jun-15 Jul-15 Aug-15 Sep-15 Oct-15 Nov-15 Dec-15 Jan-16 Feb-16 Mar-16 Apr-16
2a7 Treasury Holdings by Maturity ($bn, as of March 31, 2015)
Coupons
Bills
0%
5%
10%
15%
20%
25%
30%
5
10
15
20
25
30 2a7 Bill Holdings (as of March 31, 2015)
Par Amount ($bn)
Holdings as % outstanding

Pros and Cons of More T-Bill Issuance as a Portion of Treasury Debt Issuance
Pros of Issuing More T-Bills Cons of Issuing More T-Bills T-bills offer lower borrowing costs for taxpayers on average over time
Rollover risk in the future may be more challenging
Demand is likely to be higher as banks’ need for short-term HQLA is likely to increase
If more bills are issued in lieu of long-term Treasury benchmarks , the liquidity of fixed income assets may be significantly reduced
Demand is likely to be higher as new Money Fund regulations increase demand for short-end government paper
Balance sheet constraints (leverage ratios) may make market making more difficult, subsequently challenging bill liquidity, in particular around quarter-end
Fewer bill substitutes are likely as outstanding amounts of other short-term alternatives are generally flat or shrinking, which also poses little risk of T-bills crowding out other HQLA
The Treasury could maintain a higher cash balance while maintaining coupon sizes
21

Appendix: A Study of T-Bill Market Liquidity
• T-bills compared to short coupons – T-bill sizes tend to be larger than individual coupons – Dealers appear unwilling to buy short coupons, meaning that offers can remain
competitive, while bids are very wide compared to those for T-bills
• T-bill turnover tends to be much higher than for short coupons • Dealers tend to bid on bills, but foreigners own a substantial amount • The special place for bills becomes more acute during crises
22

T-bill versus short coupon – liquidity bill premium Short coupons are not cheap given market technicals ,as some suggest – just more illiquid. • Offers for short coupons are
generally similar to T-bills, bids are not.
T-bill liquidity tends to better because short-coupon sizes are relatively small and disconnected, while T-bill sizes increase at each auction.
The bid/offer spread on short coupons is wider as they can sit on dealers’ balance sheets and prove more difficult to sell.
Regular T-bill Issuance allows for better price discovery, while short coupons do not have similar instruments issued within two years to maturity.
23
Source: the BLOOMBERG PROFESSIONALTM service
May 2015 Maturities, as of 24 Apr 2015
Bid/Offer Spread (bps) Bid (bps) Offer (bps)
Bills (May 14) 0.005 0.015 0.010 Old 3y Note 0.135 0.115 -0.019 Old 10y Note 0.132 0.149 0.017 Bills (May 21) 0.005 0.010 0.005 Bills (May 28) 0.005 0.015 0.010 Old 2y Note 0.077 0.096 0.019 Old 5y Note 0.076 0.087 0.011
0
10
20
30
40
50
60
70
80
90
Bills 5/14 Old 3y Note Old 10y Note Bills 5/21 Bills 5/28 Old 2y Note Old 5y Note
Amount Outstanding, May Maturities ($bn)

T-bill versus short coupon – turnover has favored T-bills Since the end of the financial crisis, T-bill turnover has increased and remains higher than that of short coupons.
Bank trading assets have generally been declining, with value-at-risk falling even faster.
Less flexible balance sheets may lead to market volatility, not only in longer-maturity Treasury securities but also T-bills – particularly around changes in expectations for monetary policy.
24
Sources: Federal Reserve Bank of New York
Source: Company reports
Ten of the Largest Banks Globally
13,000,000
13,500,000
14,000,000
14,500,000
15,000,000
15,500,000
16,000,000
16,500,000
17,000,000
Mar-09 Mar-10 Mar-11 Mar-12 Mar-13 Mar-14
Total Assets ($mm,10 GSIBs)
0
200
400
600
800
1,000
1,200
1,400
1,600
1,800
2,000
Mar-09 Mar-10 Mar-11 Mar-12 Mar-13 Mar-14
Total Rate Risk ($mm, 10 GSIBs)

Other demand for and ownership of T-bills
25
Source: US Treasury
Dealers and investment funds are dominant in the primary market for 4-week and 13-week T-bills. • At auction, they have combined to
take down 97% of the 4-week T-bills and 94% of the 13-week T-bills over the last 12 months.
Foreign investors hold a substantial portion of the T-bill market, with their primary market activity more concentrated in the 26-week and 52-week issuance. • Foreign investors have been
awarded 32% of 26-week issuance and nearly 22% of the 52-week auctions over the last year.
0%
10%
20%
30%
40%
50%
60%
70%
80%
90%
Dealers Investment Funds Foreign
Bill Auction Allotments (last 12 months)
4-week
13-week
26-week
52-week
0%
10%
20%
30%
40%
50%
60%
0
200,000
400,000
600,000
800,000
1,000,000
2002 2003 2004 2005 2006 2007 2008 2009 2010 2011 2012 2013 2014
Foreign Holdings of Treasury Bills (Mil.$)
Foreign Bill holdings as % of Outstanding

T-bills relative to other markets T-bill yields already trade below the fixed rate and other money market rates; Fed hikes may cause investors to shorten assets’ duration, creating additional T-bill demand. The relative behavior of other rates versus bills could offer a gauge of market stresses and function. • Spreads of other front-end rates
widened noticeably during the crisis.
26
-0.05
0.05
0.15
0.25
0.35
0.45
0.55
0.65
0.75
Apr-09 Apr-10 Apr-11 Apr-12 Apr-13 Apr-14 Apr-15
3-Month AA Financial Commercial Paper (% per annum)DTCC GCF Repo Index: Treasury Weighted Average (%)3-Month Treasury Bill On the Run: Yield (%)
Source: Haver Analytics®
Source: the BLOOMBERG PROFESSIONAL™ service
As of April 24, 2015 As of October 15, 2008
Instrument Yield 3m Average Spread to Bills (bps)
3m Avg Spread To Bills (bps) Yield 3m Average
Spread to Bills (bps)
3m Avg Spread To Bills (bps)
3m Bill 0.015% 0.014% - - 0.213% 1.264% - - Fixed O/N RRP Rate 0.050% 0.050% 3.5 3.6 Fed Funds Effective 0.130% 0.120% 11.5 10.6 1.040% 1.860% 82.7 59.7 GCF Repo 0.152% 0.173% 13.7 15.9 3m OIS 0.135% 0.130% 12.0 11.6 1.097% 1.855% 88.4 59.1 3m LIBOR 0.279% 0.267% 26.4 25.4 4.550% 3.228% 433.7 196.5 3m Financial CP 0.120% 0.140% 10.5 12.6 3.950% 2.920% 373.7 165.7