characterizing the structural influence of electromagnetic field application geometry ... ·...
TRANSCRIPT

Characterizing the Structural Influence of Electromagnetic Field Application Geometry on
Biological Systems
By
Trevor N. Carniello
A thesis submitted in partial fulfillment
of the requirements for the degree of
Doctor of Philosophy (PhD) in Biomolecular Sciences
The Faculty of Graduate Studies
Laurentian University
Sudbury, Ontario, Canada
© Trevor N. Carniello, 2020

ii
THESIS DEFENCE COMMITTEE/COMITÉ DE SOUTENANCE DE THÈSE
Laurentian Université/Université Laurentienne
Faculty of Graduate Studies/Faculté des études supérieures
Title of Thesis
Titre de la thèse Characterizing the Structural Influence of Electromagnetic Field Application
Geometry on Biological Systems
Name of Candidate
Nom du candidat Carniello, Trevor
Degree
Diplôme Doctor of Philosophy
Department/Program Date of Defence
Département/Programme Biomolecular Sciences Date de la soutenance January 14, 2020
APPROVED/APPROUVÉ
Thesis Examiners/Examinateurs de thèse:
Dr. Robert Lafrenie
(Supervisor/Directeur de thèse)
Dr. Blake Dotta
(Committee member/Membre du comité)
Dr. Jeffrey Gagnon
(Committee member/Membre du comité)
Approved for the Faculty of Graduate Studies
Approuvé pour la Faculté des études supérieures
Dr. David Lesbarrères
Monsieur David Lesbarrères
Dr. Rodney O'Connor Dean, Faculty of Graduate Studies
(External Examiner/Examinateur externe) Doyen, Faculté des études supérieures
Dr. Joy Gray-Munro
(Internal Examiner/Examinateur interne)
ACCESSIBILITY CLAUSE AND PERMISSION TO USE
I, Trevor Carniello, hereby grant to Laurentian University and/or its agents the non-exclusive license to archive and
make accessible my thesis, dissertation, or project report in whole or in part in all forms of media, now or for the
duration of my copyright ownership. I retain all other ownership rights to the copyright of the thesis, dissertation or
project report. I also reserve the right to use in future works (such as articles or books) all or part of this thesis,
dissertation, or project report. I further agree that permission for copying of this thesis in any manner, in whole or in
part, for scholarly purposes may be granted by the professor or professors who supervised my thesis work or, in their
absence, by the Head of the Department in which my thesis work was done. It is understood that any copying or
publication or use of this thesis or parts thereof for financial gain shall not be allowed without my written
permission. It is also understood that this copy is being made available in this form by the authority of the copyright
owner solely for the purpose of private study and research and may not be copied or reproduced except as permitted
by the copyright laws without written authority from the copyright owner.

iii
Abstract
There is growing literature that describes the effects that exposures to different forms of
magnetic and electromagnetic fields have on biological systems. Some robust effects have been
reported when the temporal structure of the electromagnetic field is patterned after what has
been observed biologically. However, there has been little effort devoted to ascertaining the
role for that physical application geometry, the structure through that current is presented, plays
in the bio-effectivity of patterned EMF. Here we devised a series of investigations that
compared 4 unique geometric organizations of copper wire based application devices to
generate patterned EMFs in order to discern if application geometry has any impact on
biological responses from cell systems treated with exposure to EMF. Furthermore, we
examined the structural pattern of a burst-firing EMF in order to characterize that parameters
are important in optimizing the proportion of cells that can be induced to bear plasma
membrane extensions in a cell model of induced neuritogenesis. Results of the experiments
conducted within this thesis show that the pattern of the EMF applied to PC-12 cells is the most
important factor to promote neurite outgrowth. Other parameters such as: the intensity of the
applied field, the timing of the field, exposure duration, and whether or not the pattern in
constantly or intermittently (i.e., rotated) exposed to PC-12 cells treated with forskolin do not
appreciably impact the growth of neurites. Investigations using different magnetic geometries
(e.g., structures around that copper wire is wound) were able to show that the physical structure
of the EMF-generating device contribute to the efficacy of neurogenesis of PC-12 cells exposed
to burst-firing pattern. Furthermore, unique EMF-generating devices influenced spectral
profiles of ultra-weak photons emitted from B16-BL6 cells. The differences obtained between
magnetic field generating devices suggest that the more heterogeneous the patterned EMF the
more impactful it is on the structural and functional aspects of the biological system under
investigation. Rigorous physical experimentation examining the features associated with

iv
unique structures around that copper wire is wound, showed that if the EMF-generating device
approaches the structure of a dome, it has the capacity to reduce background magnetic field
intensity and may provide insight (e.g., a mechanism) as to the efficaciousness of observed
effects when a patterned EMF is generated through this device.
Keywords
Electromagnetic fields, pheochromocytoma (PC-12), B16-BL6, ultra-weak photon emission,
neuritogenesis, application geometry.

v
Co-Authorship (where applicable)
The candidate acknowledges that written work is the product of the individual whose name is
attached to this dissertation. We do not disclose any additional authorship, nor contribution
outside of the primary author, in the formalization of this document.

vi
Acknowledgements
The actualization of a Ph.D. thesis requires the dedication of not only the student who aims to
bring their labours to fruition, but also the unrelenting support offered by their colleagues,
mentors, and supervisors. For the continued positive support offered by members of Laurentian
University’s Neuroscience Research Group, past and present, I am forever grateful. I have been
fortunate to have been engrossed in a creative, intelligent, and challenging environment that
has fostered an insatiable pursuit of the unknown that has highlighted my experience as a
graduate student. Furthermore, to all my graduate and ungraduated colleagues with whom I
have had the pleasure of becoming acquainted and with whom I have grown, I am immensely
thankful. It was our deep, creative, esoteric, and dare I say fringe, conversations that served as
my source of motivation to continue my pursuits regardless of the trials and tribulations they
offered. I have been, and will continue to be, inspired by the insights and creativity of my
colleagues.
The course of development from an undergraduate and even graduate student into a Ph.D.,
involves the investment, care, and nurturance of an excellent committee. I could not have asked
for a better group of doctors to join me on this journey and to facilitate these pursuits. To my
supervisors, Dr. Lafrenie and Dr. Dotta, the amount of time and encouragement that was
provided by you over this transformative experience, coming at a time of departmental
reorganization, was well beyond what any other supervisor would have done. I appreciate the
structure and positive reinforcement that our weekly meetings provided, as well as the
challenging feedback necessary to appropriately capture the essence that this storied thesis
encompasses. I am indebted to you for our lengthy office discussions related to personal
development beyond the laboratory and academia. I have come to value of the benefit of life
experience and the wisdom it offers and am glad have been able to gain this insight from the

vii
two of you. Dr. Gagnon, your insight in terms of addressing aspects of mechanism of action
and offers to collaborate greatly assisted in tackling the nuances of this project. It is my
intention to continue to collaborate with you and your lab and enjoy the inquiry of scientific
discovery. Finally, to my mentor Dr. Michael Persinger, I wish to extend a most heartfelt thank
you for taking a risk on me as a student. I was able to experience a lot of learning from you,
doc, and I will cherish our corrective feedback chats, philosophical discussions, chalkboard
sessions, and a good King Fish and Lilly-fly joke. Many thanks for emphasizing the power of
the scientific method, challenging preconceived notions, and promoting the pursuit of the
unknown.
viii
Table of Contents
Abstract .................................................................................................................................... iii
Co-Authorship (where applicable) ............................................................................................. v
Acknowledgements ................................................................................................................... vi
List of Figures ........................................................................................................................... xi
List of Tables ......................................................................................................................... xiii
List of Appendices .................................................................................................................. xiv
List of Abbreviations .............................................................................................................. xvi
Chapter 1 .................................................................................................................................... 1
1.1 Non-Ionizing, Electromagnetic Field Effects on Biological Systems: An Introduction ............... 1
1.2 Static MF ....................................................................................................................................... 4
1.3 Rotating MF .................................................................................................................................. 6
1.4 Propagating EMF .......................................................................................................................... 8
1.4.1 DC-EMF ................................................................................................................................ 9
1.4.2 ELF-EMF ............................................................................................................................. 11
1.4.3. HF-EMF .............................................................................................................................. 23
1.4.4 Naturally Occurring EMF ........................................................................................................ 28
1.5 Light/EM radiation: .................................................................................................................... 32
1.6 References: .................................................................................................................................. 38
Chapter 2 .................................................................................................................................. 79
2. Parameterizing the Influence of Physiologically Patterned EMF on Forskolin Induced
Pheochromocytoma Plasma Membrane Extensions ................................................................ 79
2.1 Abstract ....................................................................................................................................... 79
2.2. Introduction ................................................................................................................................ 80
2.3. Methods...................................................................................................................................... 84
2.3.1. Cell culturing and induction of plasma membrane extensions ........................................... 84
2.3.3. Cell morphological measures .............................................................................................. 90
2.3.4. Ultra-Weak Photon emission .............................................................................................. 91
2.3.5. Methods of analyses ............................................................................................................ 93
2.4. Results: ....................................................................................................................................... 94
2.4.1. Effect of burst-firing EMF and rotating EMF exposure duration on forskolin induced PC-
12 plasma membrane extensions ................................................................................................... 94
2.4.2. Determining the difference between rotational or constant application of burst-firing EMF
generated through the 4-D exposure application .......................................................................... 98
2.4.3. The influence of point duration of burst-firing EMF on PC-12 plasma membrane
extensions ...................................................................................................................................... 99
2.4.4. Intensity dependence of burst-firing EMF on induced plasma membrane extensions in PC-
12 cultures ................................................................................................................................... 100

ix
2.4.5. Pattern specificity of EMF application on forskolin induced PC-12 plasma membrane
extensions .................................................................................................................................... 101
2.4.6. Identifying the potential biomolecular pathway for the action of burst-firing EMF on
forskolin induced plasma membrane extensions in PC-12 cell cultures using an inhibitor series
.................................................................................................................................................... 103
2.5. Discussion ................................................................................................................................ 105
2.6. References: ............................................................................................................................... 111
Chapter 3 ................................................................................................................................ 123
3 The Influence of Physical Application Geometry on PC-12 Cell Morphology and B16-BL6
Ultra-Weak Photon Emission Spectra ................................................................................... 123
3.1 Abstract: .................................................................................................................................... 123
3.2. Introduction: ............................................................................................................................. 123
3.3. Methods.................................................................................................................................... 128
3.3.1. Cell culture and induction of plasma membrane extensions in PC-12 cells ..................... 128
3.3.2. EMF exposure conditions for PC-12s ............................................................................... 128
3.3.3. Cell morphological measures ............................................................................................ 129
3.3.4. Ultra-Weak Photon emission measurements for PC-12 cells ........................................... 129
3.3.5. Cell culture of B16-BL6 mouse melanoma cells .............................................................. 131
3.3.6. EMF exposure conditions for B16-BL6 cells ................................................................... 131
3.3.7. Ultra-Weak Photon Emission Measurements for B16-BL6 cells ..................................... 132
3.3.8. Methods of analyses .......................................................................................................... 133
3.4. Results ...................................................................................................................................... 135
3.4.1. PC-12 Cell morphology .................................................................................................... 135
3.4.2. Ultra-Weak Photon emission measurements for PC-12 cells ........................................... 143
3.4.3. Ultra-Weak Photon Emission Measurements for B16-BL6 cells ..................................... 145
3.5. Discussion: ............................................................................................................................... 152
3.6. References: ............................................................................................................................... 156
Chapter 4 ................................................................................................................................ 161
4 Physical Characterization of the Nature of Electromagnetic Field Application Geometry ......... 161
4.1 Abstract: .................................................................................................................................... 161
4.2. Introduction: ............................................................................................................................. 161
4.3. Methods: .................................................................................................................................. 165
4.3.1. Physical Description of the Electromagnetic Application Geometries: .......................... 165
4.3.2. Determining The Change in the Earth’s Static Magnetic Field Intensity as a Function of
Physical Application Geometry: ................................................................................................. 168
4.3.3. Determining the Change in the Static Vectorial Intensity of an Incident, Time-Varying
EMF as a Function of Physical Application Geometry .............................................................. 169

x
4.3.4. Assessing the Change in Induced Voltage through Various Physical Application
Geometries in a Faraday Cage and Acoustic Chamber ............................................................... 171
4.3.5. Characterizing the Change in the Static EM Background Intensity as a Function of
Application Geometry in a Standard Incubator .......................................................................... 172
4.3.6. Methods of analyses: ......................................................................................................... 173
4.4. Results ...................................................................................................................................... 176
4.4.1. Determining The Change in Earth’s Static Magnetic Field Intensity as a Function of
Physical Application Geometry: ................................................................................................. 176
4.4.2. Determining the Change in the Static Vectorial Intensity of an Incident, Time-Varying
EMF as a Function of Physical Application Geometry .............................................................. 180
4.4.3. Assessing the Change in Induced Voltage through Various Physical Application
Geometries in a Faraday Cage and Acoustic Chamber ............................................................... 182
4.4.4. Characterizing the Change in the Static EM Background Intensity as a Function of
Application Geometry in a Standard Incubator .......................................................................... 184
4.5. Discussion: ............................................................................................................................... 186
4.6 References: ................................................................................................................................ 192
Chapter 5 ................................................................................................................................ 197
5.1 General Discussion ................................................................................................................... 197
5.2 Implications and Future Directions ........................................................................................... 200
5.3 References ................................................................................................................................. 204
Appendices ............................................................................................................................. 207

xi
List of Figures
Figure 2.4.1.1: Interaction of field generating device and the proportion of Plasma membrane
extensions…………………………………………………………………………………….95
Figure 2.4.1.2: Burst-firing EMF generated through the 4-D geometry and its impact on PC-12
neurite growth……………………………………………………………………………….96
Figure 2.4.1.3: Measures of PME proportion after 1 and 3 hour exposures to the Resonator
device………………………………………………………………………………………...97
Figure 2.4.2.1: Rotated v. constant application of burst-firing EMF on neurite outgrowth…98
Figure 2.4.3.1: The effect of different point durations and inter-stimulus intervals of the burst-
firing pattern on PME and multipolar outgrowths…………………………………………….99
Figure 2.4.4.1: Intensity of burst-firing EMF on PME and multipolar production…………100
Figure 2.4.5.1: Assessment of different patterns of EMF application on neurite outgrowth in
PC-12
cells…………………………………………………………………………………...102
Figure 2.4.6.2.1: Differences in deviation of spectral power density in cells treated with burst-
firing EMF………………………………………………………………………………….104
Figure 3.4.1.1: Differences in the proportion of multipolar extensions from PC-12 cells treated
with burst-firing EMF generated through unique geometries………………………………136
Figure 3.4.1.2: Ratio of multipolar cells to PME-bearing cells as a function of exposure device
generating burst-firing EMF………………………………………………………………...137
Figure 3.4.1.3: Morphological differences in PC-12 cells exposed to burst-firing EMF
generated through the Helmholtz
coil………………………………………………………………….139
Figure 3.4.1.4: Morphological differences in PC-12 cells exposed to burst-firing EMF
generated through the Hoberman
coil…………………………………………………………………140
Figure 3.4.1.5: Morphological differences in PC-12 cells exposed to burst-firing EMF
generated through the Rodin
coil……………………………………………………………………….141
Figure 3.4.1.6: Morphological differences in PC-12 cells exposed to burst-firing EMF
generated through the Toroid coil
…………………………………………………………………….142
Figure 3.4.2: PMT emission differences between distinct EMF-generating devices after
exposure to burst-firing EMF………………………………………………………………144

xii
Figure 3.4.3.1: Mean photon counts emitted from PC-12 cells as a function of geometry
following burst-firing EMF exposure……………………………………………………....146
Figure 3.4.3.2: Differences in the standard deviation of ultra-weak photon emission across
measurement periods as a function of different EMF exposure equipment………………….147
Figure 3.4.3.3: Spectral power differences of ultra-weak photon emission as a function of EMF
exposure equipment during pre-exposure conditions ……………………………………….149
Figure 3.4.3.4: Spectral power differences of ultra-weak photon emission as a function of EMF
exposure equipment during Thomas-EMF exposure………………………………………150
Figure 4.4.1.1: The change in intensity (nT) of the X, Y, Z, and resultant coordinates for Earth’s
static magnetic field as a function of magnetic geometry.…………………………….........178
Figure 4.4.1.2: The change of RMS intensity in the rectangular coordinates (X, Y, Z, and
Resultant) of Earth’s static magnetic field as a function of
geometry…………………………….……………………………………………………...179

xiii
List of Tables
Table 3.4.3.1: Discrimination between EMF application geometries using ultra-weak photon
emission measures………………………………………………………………………......152
Table 4.4.2.1: Measures of change in intensity and variability of ambient EMF intensity as a
function of geometry in the presence of an inducing field…………………………………...181
Table 4.4.2.2: Difference in background intensity contained within different magnetic
application geometries following the presence of an inducing EMF………………………...182
Table 4.4.3.1: Power and frequency measured from different magnetic field generating devices
placed in a Faraday cage and acoustic chamber…………………………………………….183
Table 4.4.4.1: Difference in background intensity when burst-firing EMF was generated in a
standard incubator…………………………………………………………………………...185
Table 4.4.4.2: Intensity measures in a standard incubator when burst-firing EMF was generated
through different devices………………………………………………………………........185

xiv
List of Appendices
Appendix A1: Photographic representation of the 4-D exposure apparatus from different points
of view………………………………………………………………………………………207
Appendix A2: Photographic representation of the 4-D application geometry with
corresponding computer generated patterned EMF (computer) and custom built digital-to-
analog converter (DAC; blue box) …………………………………………………………208
Appendix B1: Photo of the Resonator………………………………………………………209
Appendix B2: Technical specifications for the Resonator………………………………….210
Appendix C: Graphical representation of the burst-firing EMF pattern……………………230
Appendix D: Graphical representation of the burst-firing, reverse burst firing, Thomas, and 7-
Hz burst patterns……………………………………………………………………………231
Appendix E1: Photographic representation of the Helmholtz geometry from various
perspectives…………………………………………………………………………………232
Appendix E2: Photographic representation of the Hoberman geometry taken from various
perspectives…………………………………………………………………………………233
Appendix E3: Photographic representation of the Rodin geometry taken from different
perspectives…………………………………………………………………………………234
Appendix E4: Photographic representation of the Toroid geometry taken from different
perspectives…………………………………………………………………………………235
Appendix E5: Pictographic representation of PC-12 exposure conditions to various magnetic
field generating devices (i.e., application geometries). The example provided demonstrates the
Hoberman geometry in the context of the experimental set-up……………………………236
Appendix F: Photographs of the Faraday-bowls. Weavemesh (top row) and fly mesh (bottom
row) constructs ranging from left-to-right in terms of overall coverage……………………237
Appendix G: Photographic representation of experimental set-up for the measurement of
background, ambient fluctuations in the Earth’s magnetic field with the Hoberman geometry
as an example………………………………………………………………………………238
Appendix H1: Graphical representation of the Thomas-EMF pattern……………………….239
Appendix H2: Photographic representation of the experimental set-up for exogenous field
induction trials with the Hoberman geometry serving as an example………………………240
Appendix I: Photograph of the experimental set-up for the measurement of background voltage
fluctuations induced the various EMF coils in a Faraday cage and acoustic chamber……….241

xv
Appendix J: Photograph of the experimental set-up for measuring fluctuations in static
magnetic field measures in a standard incubator when the burst-firing EMF is generated
through different application geometries……………………………………………………242

xvi
List of Abbreviations
AC (alternating current); AM (amplitude modulated); BDNF (brain-derived neurotrophic
factor); cAMP (cyclic adenosine monophosphate); CREB (cAMP response element binding
protein); DAC (digital-to-analog converter); DC (direct current); EAE (experimental allergic
encephalomyelitis); EEG (electroencephalograph); ELF (extremely-low frequency); EMF
(electromagnetic field); ERK (extracellular signal-regulated kinase); FM (frequency
modulated); HF (high frequency); IR (infrared); ISI (inter-stimulus interval); LSD (lysergic
acid diethylamide); LTP (long-term potentiation); MAPK (mitogen activated protein kinase);
MF (magnetic field); NGF (nerve growth factor); PC-12 (pheochromocytoma); PD (point
duration); PME (plasma membrane extension); PKA (cAMP dependent protein kinase A); rMF
(rotating magnetic field); SEM (standard error of the mean); UPE (ultra-weak photon
emission); UV (ultraviolet)

1
Chapter 1
1.1 Non-Ionizing, Electromagnetic Field Effects on Biological Systems: An Introduction
Electromagnetic fields used in research can be dichotomized as either 1) static or 2) dynamic
(time-varying). Each subdivision has its own unique features that contribute to the efficacy of
the field under examination. A static magnetic field, as exemplified by a bar magnet, is
generated by the alignment of magnetic moments/dipoles that are contained within the material
of the magnetic body. The greater the homogeneity of magnetic moment alignment, the greater
the intensity that is generated from the material and ultimately experienced by whatever matter
(system) is interposed within the magnetic lines of force. The alignment of magnetic moments
can be used to explain a number of observed phenomena associated with exposures to a static
magnet including polarity and the consequences of bifurcating the material. Magnetic polarity
is the result of having a magnetic dipole whose force lines, that are representations of magnetic
force, extend from one pole of the particle (i.e., North pole) and bends to return to the other,
opposite, pole (i.e., South pole). Secondly, the act of bisecting a bar magnet results in the
formation of 2 smaller, equally intense magnets that observe a conserved polarity (i.e., North
and South poles). In actual fact, what happens when one bisects a bar magnet is that the
available aligned magnetic moments are equally divided and distributed into separated halves
provided that the material is a homogenous substrate and if we were able to re-fuse the halves,
the intensity and polarity would be restored.
The second category of magnetic field, that of dynamic or time-varying magnetic fields, is not
generated by the alignment of magnetic moments but rather by the movement (rate of change)
of charged particles. Displacement of a charged particle as a function of some temporal
increment (time) generates a current. According to the Biot-Savart law, a current generated in

2
a conducting wire generates a perpendicularly radiating magnetic field around that wire in a
direction parallel to the axis of current flow. The relationship between the movement of a
charged particle and the generation of a perpendicular magnetic field is exemplified by the
description provided by a Lorenz force, or more colloquially electromagnetic force (Dahl,
1997; Burke 2012). The electromagnetic force comprises 1 of the 4 fundamental forces known
in our Universe and results from the interaction between electrically charged particles and is
carried by the electromagnetic field.
The relationship between electricity and magnetism has been extensively researched by Volta,
Ampere, Gauss, and most notably, Faraday. Maxwell summarized Faraday’s findings that
mathematically describe the operation of electromagnetic fields. Dynamic (time-varying)
magnetic fields can be further sub-categorized into 1) rotating magnetic (rMF) fields and 2)
propagating electromagnetic fields (EMF). rMF are created by the axial rotation of a static
magnetic. Consider the case of 2 horseshoe magnets that are being rotated in a counter
clockwise fashion by way of a rotary motor. Field lines are described as being attractive
between opposing poles and repulsive when presented with paired polarity. When we activate
the rotary device, the field lines are torqued and twisted alternating between periods of
attraction and repulsion generating regions of amplified and depressed intensity with the
potential of even creating magnetic “dead zones” (nodes) when the 2 horseshoe magnets are
oriented perpendicularly. The complex interaction between rotating magnetic material not only
creates opposing and attractive forces but alterations in the experienced intensity of any object
that is placed within their rotational space. The rate at that the magnets are rotated, a feature
that we operationalize as frequency or pattern, also contributes to the experienced intensity and
potential for biologically-relevant field effects. A second method of generating a rMF is by
rotating a propagating EMF. Consider an array of equally spaced solenoids arranged
3
circumferentially (i.e., in a circular array). When current is supplied to each of the solenoids
they will generate a magnetic field. Now, consider that if we were to delay the presentation of
current to each subsequent solenoid sequentially by some arbitrary temporal increment such
that all of the solenoids are not presented simultaneously, then we will have created an
artificially rotating electromagnetic field. Furthermore, we would be able to visualize the
rotational component of the magnetic field by placing a metal spinning top in the center of the
apparatus and initializing the delayed-sequence field presentation to the series of solenoids. A
similar piece of equipment as described, has been developed by Persinger and Koren and has
been used to experimentally elicit excess correlation between human pairs, physiochemical
reactions, and pH deviations in aqueous solutions (Persinger et al., 2003; Richards et al., 2002;
Dotta et al., 2012; Persinger and Koren, 2016).
Propagating EMFs result from current injections into a magnetic field-generating device,
typically composed of a series of wires wound in a particular geometry (i.e., solenoid, toroid,
etc.), in that the presentation of the respective current is varied in terms of frequency (time of
presentation) and amplitude (amount of current presented). Most electronic devices in North
America generate a 60 Hz, patterned EMF as the result of the standard alternating current
supplied by electrical power grids. An EMF generated by the application of a sine wave is
categorized as a symmetrically patterned EMF whose rate of change between adjacent points,
or rise time, is gradual. Conversely, when the increment of time (frequency) between
successive current applications or the intensity (amplitude) of successive current injections are
variable and abrupt, the patterned EMF is defined as being asymmetrical. Notably, changing
the frequency of current presentation or the amount of current being supplied to the field-
generating device would be likened to frequency and amplitude modulations for a given EMF,
a feature that is central to radio communication systems. Amplitude and frequency modulation,

4
static versus dynamic, propagating versus rotating, and the concept of symmetrical versus
asymmetrical constructs of EMF represent features that can comprise the “application
geometry” of EMF research. Additional features that can be categorized in terms of application
geometry include the physical apparatus through that the resulting EMF has been generated
and phase modulation of the resulting EMF.
Little evidence has been gathered to address the impact that EMF application geometry has on
biological systems or to address the contribution of physical application geometry as a variable
in EMF research. In biology, structure is said to dictate function as evidenced by the
development/differentiation of specialized cells (i.e., neurons, neutrophils, macrophages,
erythrocytes, etc.) that are designed to execute specific function(s). In this chapter, the evidence
that different forms (sources) of MF/EMF energy can elicit different effects on cells will be
reviewed. In addition, research suggests that even though the exposure apparatus may be the
same, different temporal organizations (patterns) of stimulus presentations can also produce
different effects. Both the source of the MF/EMF energy and temporal construction of the
stimulus can be argued to be forms of “structure” of an EMF. In later chapters, we will
investigate the bio-effectivity provided by the physical structure of EMF-generating devices in
terms of EMF effects on cell systems.
1.2 Static MF
The characteristics of MF/EMF applications are of importance in order to differentiate their
effects. In this section, we categorize static MF as being derived from the alignment of
magnetic domains (clusters of magnetic moments) that are contained within the structure of a
material. Static MF effects are derived from the application of traditional bar magnets or their
equivalents. Persinger (1976) summarized a number of effects that were associated with the

5
application of a static MF, whose intensities ranged from 10 G to 5 kG. For example, rats
exposed to static MF showed differences in the mass of visceral organs, disease susceptibility,
and endocrine physio-chemistry. Furthermore, Pelyhe et al., (1973) demonstrated that exposure
to static MF applications (8 kG) affected conditioned avoidance training in rats. It was
determined that there was a delay in criterion learning for those animals that were exposed to
the static MF conditions as compared to their sham-exposed counterparts. In addition, the
orientation of migratory birds can be altered when they are exposed to strong static MFs
(Ossenkopp and Barbeito, 1978; Saunders, 2005).
Static MFs have been shown to impact cell structure and function. For instance, exposures to
a strong, static MF of Tesla level intensities (10 kG) can regulate orientation of matrix proteins,
such as collagen and fibrin fibers, as well as cells (Bigham et al., 2009; Leesungbok et al.,
2013) while higher intensity fields (8 T) have been shown to impact osteoblastic cell formation
(Kotani et al., 2002). Kotani et al., (2002) observed the presence of rod-like osteoblastic cell
formations aligned in the direction of the field and concomitant cell differentiation and matrix
synthesis pathway activation following 60-hour exposures to static MF in in vitro and in vivo
models of bone formation. Bidal (2018) demonstrated that prolonged exposure to static MFs
(0.16 T) can alter calcium crystal formation in samples of spring water that were maintained in
darkened environments. Time-dependent changes in membrane structure (i.e., cell surface
damage) and E. coli colony formation following exposure to static MF were observed by Ji et
al., (2009). Weaker static MF intensities (0 – 118 µT) were shown by Binhi et al., (2001) to
promote anomalous viscosity time-dependencies in ion-protein complexes. The authors
determined that there were differences in this measure when the specimens were rotated at 18
Hz while being exposed to the field. Exposures to a 220 mT static MF increased ethanol
production by 3.4-fold in fermenting S. cerevisiae (da Motta et al., 2004; Muniz et al., 2007).

6
The authors also reported a 2.5-fold increase in biomass associated with static MF treatment
and ethanol production.
1.3 Rotating MF
For the purpose of this thesis, we defined a rotating MF (rMF) as falling under the umbrella of
a static (bar) magnet, or equivalent, that has been subjected to concentric displacement (i.e.,
rotation). Therefore, the discussion herein is limited to the biological effects observed
following exposure to a rMF and excludes experiments and observations made on biological
substrates subjected to rotation within a static field.
Rotating MFs have been shown to successfully impact functional (behavioural) and structural
aspects of animals when exogenous fields are applied during natal development. For example,
Persinger (1969) demonstrated a reduction in the ambulatory behaviour of rats that had been
continuously exposed to a 0.5 Hz rMF of intensity 3-30 G as compared to sham-treated
controls. Additionally, Persinger and Pear (1971) demonstrated statistically significant
suppression of response rates in a conditioned suppression test specifically for those animals
with a history of rMF exposure as compared to control-treated animals. The authors suggested
that the data supported the concept that rMF-treated animals are more reactive to aversive
stimuli. In a series of investigations, Kavaliers and Ossenkopp (1985, 1986) examined the
synergism between rMF treatment and analgesic responses in mice. They determined that mice,
both the CF1 and C57-BL strains, treated for 60 min with 0.5 Hz rMF (intensity: 0.5 G, 1-90
G) had reduced locomotion and analgesia produced by morphine. The observed changes were
dose-dependent and were maintained in both day-time analgesia and nocturnal analgesia
(Ossenkopp and Kavaliers, 1983; Kavaliers and Ossenkopp, 1984; Kavaliers and Ossenkopp,
1985). The authors were able to demonstrate that application of EGTA (a calcium chelator)

7
removed field effects while administration of a calcium ionophore A21387 potentiated
inhibition. Similarly, mice exposed to 0.5 Hz rMF (1 – 8 G) demonstrated a significant
reduction in analgesic effects mediated by µ and κ opiate agonists in a manner similar to
naloxone, as well as an inhibition in the endogenous opioid mediated responses, to warm- and
cold-stress induced nociception. No effects were observed for animals treated with saline
solutions (Kavaliers and Ossenkopp, 1987). These data support Persinger and Pear’s
hypothesis that rMF enhances behavioural reactivity in animals. One possibility that may arise
from a decreased threshold for reactivity is the enhanced capacity to discern discrete stimuli.
Investigations conducted by Blomme and colleagues (1990) demonstrated that pigeons could
accurately discriminate between the presence or absence of an rMF and that task accuracy
could be interrupted by sudden changes in ambient lighting, an alternative form of
electromagnetic radiation. Accuracy of discrimination was a function of individual differences.
Mulligan and Persinger (1998) exposed rats to 0.5 Hz rMF at 3 – 30 G prenatally, and showed
reduced cell density in the medial preoptic nucleus of the male, but not the female rats,
suggesting that prenatal rMF exposure may alter sexually dimorphic characteristics and
circadian cycle features. Reductions in pineal melatonin, a neurohormone associated with
circadian cycle and sleep-wakefulness, was demonstrated in rats who were continuously
exposed to a 50 Hz rMF at 1, 5, 50, and 250 µT for 6 weeks (Kato et al., 1993). Ossenkopp et
al., (1972) demonstrated intensity- and duration-dependent changes in testicular and thyroid
weights in adult male rats that had been prenatally exposed to 0.5 Hz rMF at 0.5-3 and 3-15 G
intensities. Furthermore, prolonged exposure to 0.5 Hz rMF, with intensities of 0.5 – 3 and 3 –
30 G, resulted in progressive changes in body weight, thyroid weight, water consumption,
adrenal weight, and circulating eosinophil counts (Persinger et al., 1972). Persinger et al.,
(1972) further explored these changes by exposing rats continuously to 2 field intensities (0.5

8
– 3 G, 3 – 30 G) of 0.5 Hz rMF for 5, 10, or 26 days. Water consumption was greater in rats
exposed for longer durations (10 and 26 days versus 5 days) while increased weight gains and
decreased thyroid weight was observed in animals exposed for 10 days or less while longer
exposure durations were associated with increased testicular weight.
Structural and functional changes secondary to rMF exposure have been observed in bacterial
cultures. In one experiment, Fijalowski et al., (2013) showed frequency-dependent changes in
growth rates, metabolic activity, and biofilm formation in E. coli and S. aureus cultures
following 60-min exposures to rMFs ranging in frequency between 1 – 50 Hz and intensities
of 22-34 µT. These same biological features were measured following a 60 min rMF exposure
of 8 different bacterial species (S. aureus, E. coli, A. bauminnii, P. aeruginosa, S. marcessans,
S. mutans, K. oxytoca, and S xylosus). Results indicated that field treatment stimulated growth,
biofilm formation, and metabolism in 6 of the 8 species with inhibition of metabolism and
biofilm production also observed in A. bauminnii and P. aeruginosa (Fijalowski et al., 2015).
rMF exposures have differential impacts on different biological systems that are contingent on
the duration of exposure and the frequency of rotation.
1.4 Propagating EMF
Propagating EMF is defined as a field generated by the movement of charge (current or voltage)
presented through a material designed to serve as the EMF application device. The creation of
time-varying electric fields are able to generate a changing magnetic field in accordance with
Maxwell’s descriptions. This section is divided into sub-categories based upon the parameters
of manipulation.

9
1.4.1 DC-EMF
We define DC-EMF as belonging to one of two categorical constructs; those that result from
the constant application of non time-varying (static) current and those where the current’s rate
of change is less than 1 Hz in frequency. Exposures to DC-EMF has been shown to impact
motor activity in a number of animals especially when intensities fall within the range of 10s
of mT (Kholodov, 1967, 1969, 1975, 1979). Reductions in excitation thresholds and slowing
of action potentials were reported by Volobuev et al. (1985) when samples of sciatic nerves
were exposed to 5.5 mT DC-EMF. Altering the intensity of DC-EMF, to between 0.8 and 2.0
T resulted in alterations in fluorescein transport in nervous tissues (Bresler et al., 1978).
Additional alterations at the level of the nervous system were observed when the intensity of
the DC-EMF fell within 20 – 30 mT and when exposures lasted for 1 hour as described by
Aleksandrovsknja and Kholodov (1966). The authors reported an increase in the number of
stained astroglia, oligodendrocytes, and microglia in the sensorimotor neocortex of rabbits,
sparring an impact on the structure of neurons. Artjwikhina (1988) showed that daily, 2-hour
exposures to DC-EMF for 1, 3, 6, 14, and 21 days caused animals to show alterations of neuron,
glial, vasculature, and synapse morphology. The structural alterations were determined to be a
function of exposure duration, or the number of exposures. The impact of DC-EMF on the
functional activity in the brain was assessed by Luk’janova (1969) who exposed rabbits to 90
mT DC-EMF and measured activity in neurostructural aggregates (e.g., hippocampus,
thalamus, etc.) that showed an inhibitory action on the pulse rate of these structures. For human
brain activity, electroencephalographic (EEG) slow wave and alpha spindles were recorded by
Shpil’berg and Vjalov (1972) after prolonged exposure to DC-EMF whose intensity was
greater than 10 mT. Prolonged, systemic, exposure to DC-EMF in the 10s of mT range, is
associated with fatigue, dizziness, sleeplessness, headache, and somatic symptoms in workers
in industrial settings as documented by Vjalov (1971). Others showed that short-term exposure

10
(~10 min) of humans to 93 µT DC-EMF increased EEG delta activity (0-3 Hz) over central
parietal channels (Bell et al. 1991). Fuller et al., (1995) measured increased epileptiform
activity (i.e., aberrant electrical activity) over the medial temporal lobe of individuals that were
exposed to 1-2 mT DC-EMF for 5 min.
In cell models, exposure to DC-EMF for 2 – 4 min at an intensity of 20 – 200 µT reduced
antibody secretion from spleen cell suspensions with maximal inhibition observed at an
intensity of 50 µT (Podkolzin and Dontsov, 1994). Exposures to DC-EMF at 1.1 T intensity
was determined to orchestrate the formation of an artificial lipid bilayer from egg lecithin in
such a way that the field oriented parallel to the substrate negatively impacted bilayer formation
while bilayer formation was facilitated when the field was oriented perpendicular to the
substrate. In terms of cancer treatment, Anisimov et al. (1996) reported that exposures to a 300
µT DC-EMF promoted mammary carcinogenesis in outbred female rats provided that
exposures were presented for 3 hours a day for 14 days.
Synergisms are observed when DC-EMF are coupled to AC fields. Shuvalova et al., (1991)
showed that the rates of calmodulin-dependent phosphorylation of myosin by light chains
myosin kinase could be altered, when exposed for 20 minutes, to 20.9 µT DC-EMF coupled to
20.9 µT, 8 – 20 Hz AC EMF. Regenerating planarian exposed to 20.9 µT DC-EMF and 38.6
uT, 16 Hz AC EMF for 4 – 240 hours showed increased mitosis rates in postblastema and an
acceleration of blastemal growth (Tiras et al., 1996). Shorter duration exposures (~20 min) to
21 mT DC-EMF and 140 uT, 16 Hz AC EMF maximized heart beat power spectra in Daphnia
magna at the 16 Hz frequency if and only if the 2 fields were presented simultaneously
(Chemeris and Safranova, 1993). Blackman et al., (1994) and Lednev (1996) suggested that
the existence of amplitude windows, described as alternating between strengthening and

11
weakening of the effects when the amplitude of the AC modulation was increased, as a possible
source of variance to describe the observed results.
1.4.2 ELF-EMF
Extremely-low frequency (ELF) EMFs are defined as those EMFs whose frequency
component, presented through an EMF-generating device, falls within the range of 1 – 100 Hz.
Included in this sub-section are those EMFs that have been amplitude modulated (AM) or
frequency modulated (FM) provided that the frequency range is restricted to the 1 – 100 Hz
bin. Special attention is paid when describing AM features.
There is evidence to suggest that exposures to ELF-EMF, either sinusoidally patterned or
organized in a way to reflect the activity of biological systems, can affect chemical and cellular
processes. For instance, Lazar and Barca (1969) found that exposures to a weak intensity-
pulsated magnetic field increased uptake of potassium ions and decreased uptake of sodium
ions in tissue compared to exposure to a static magnet that demonstrated an opposite effect.
Charge transfer and reaction rates for Na, K-ATPase and cytochrome oxidase can be modulated
in response to ELF-EMF application (Blank, 1992; Blank and Soo, 1993; Blank and Soo, 1998;
Blank and Soo 1998a; Blank and Soo, 1998b; Blank and Soo, 2001a). Blank and Soo (2001b),
found that the presence of a 60 Hz, 28 µT ELF-EMF altered a Belousov-Zhanotinski reaction.
Under normal conditions, the rate of the reaction is positively correlated to temperature while
in the presence of the EMF an increase in the temperature decreased the overall rate of reaction
in a model consistent with Moving Charge Interaction model. When samples of spring water
are exposed to a bulk angular decelerating/accelerating velocity EMF with
accelerating/decelerating phase velocity EMFs the latency of the response to injections of a
weak proton donor is increases (it takes longer to respond) (Dotta et al., 2013). Exposure of

12
spring water to a different patterned EMF (Thomas) caused an increase in alkalinity over the
course of a 12-hour exposure regimen (Murugan et al., 2014). Cultured cells have shown
alterations in cAMP levels caused by exposure to ELF-EMF in a duration-specific manner
(Schimmelpfeng and Dertinger, 1993). Exposures to pulsated fields between 130 µsec to 3
secs, at intensities up to 200 G for periods of 1.5 hrs per day for 30 days, and to more continuous
exposures, have been reported to affect Glucose-6-Phosphate activity, ATP/ADP ratios, serum
glutamic oxalacetic transaminase levels, and follicle size (Proumb, 1971; Neaga and Lazar,
1972). Furthermore, exposures to ELF-EMF have been reported to mitigate the effects of
ionizing radiation (Barnothy 1963a; Amer and Tobias, 1965; Zecca et al., 1984). Additional
evidence suggests that weak (less than 1 G), low frequency fields can influence bone healing
(Basset, 1994), regeneration of peripheral nerves (Sisken et al., 1993; Sisken et al., 1995),
alterations in cellular levels of calcium (Liburdy, 1992; Liburdy et al., 1993), increases in
transcript levels of the early response genes myc, jun, and fos (Lin et al., 1994; Lin and
Goodman, 1995; Lin et al., 1996; Jin et al., 1997; Phillips et al., 1992; Rao and Henderson,
1996), HSP-70 (Goodman and Blank, 1998), and electron-transfer rates (Blank and Goodman,
2004).
Buckner et al., (2015, 2017, 2018) demonstrated that daily 1-hour exposure of cultured cells to
an ELF-EMF, Thomas-EMF, was able to inhibit the growth of malignant, but not non-
malignant, cells in vitro and in vivo. Further investigations were able to demonstrate an increase
in calcium influx by activation of voltage-gated T-type calcium channels as the driving force
behind the observed Thomas-EMF effect. Using the same target field, Dotta et al., (2014)
demonstrated reliable differences in spectral power densities of ultra-weak photon emission
from B16-BL6 cells corresponding to intensities of 0.9 and 1.8 µT but not others. These
differences were enhanced when samples were pre-exposed to a complex patterned EMF for 4

13
min prior to exposure to Thomas-EMF. The authors indicated that the peak frequencies affected
by the application of these EMF sequences correspond to the energy difference obtained
between the orbital-spin magnetic moment as derived from the Rydberg atoms corresponding
to these intensities. Employing this target pattern (i.e., Thomas-EMF) in more complex
biological systems, Tessaro and Persinger (2013) demonstrated an enhancement in the rate of
regeneration of bisected planaria. Conversely, exposure of whole planaria to the combination
of Thomas-EMF (0.1 to 2 uT) for 6.5 hours per day for 5 days followed by an exposure for an
additional 6.5 hours to a complex, amplitude modulated EMF (0.5 to 5 uT) with exponentially
increasing spectral power, designed to mimic sudden-storm onset of the Earth’s geomagnetic
field, was able to elicit complete fragmentation of the planaria (Murugan et al., 2013).
Exposures to different field configurations can lead to differential effects. For example,
Piacentini et al., (2008) exposed differentiating neural stem/progenitor cells to a 1 mT 50 Hz
EMF and observed increased spontaneous firing of voltage-gated calcium channels in response
to treatment with KCl. Murugan et al., (2014b) exposed human breast cancer cells to either
morphine or burst-firing EMF at an intensity of 1 µT and demonstrated, by systematic
investigations with chemical inhibitors, that both treatments affected mu opioid receptors and
could be blocked by classical antagonists, but only morphine was able to activate molecular
pathways associated with cell proliferation. Exposure to 50 Hz EMF for two months resulted
in more sensitive responses of catalases, glutathione reductase, and the overall capability to
neutralize peroxyl radicals in the land snail Helix aspersa (Regoli et al., 2005). Blackman et
al., (1993a) reported enhanced neurite outgrowth of differentiated PC-12 cells exposed to a 50
Hz, 7.9 µT EMF for 22 hours. However, in another cell isolate of PC-12s, the same exposure
conditions reduced neurite outgrowth (Blackman et al., 1993b). Investigations using isolated
microtubule preparations revealed spectral power density changes in biophoton emission, and
14
not mean number of photons emitted, when exposed to a patterned EMF designed to facilitate
LTP in hippocampal slices (Dotta et al., 2014b). Work examining the utility of simultaneously
exposing pairs of either cell cultures or human beings to the same complex pattern of
accelerating/decelerating bulk angular velocity field with contradictory or opposing
(decelerating/accelerating) phase velocity fields, revealed coherent responses to light flashes
in both pairs, when only 1 target received light application although they were spatially isolated
(Dotta et al., 2011).
In bacteria, ELF-EMF exposures have been shown to alter chromatin conformation in E. coli
and stimulate growth especially when the frequency of the applied EMF fell within the range
of 7 – 11 Hz (Belyaev, 2011; Alipov and Belyaev, 1996). Other investigations by Belyaev and
Alipov, (2001) demonstrated that exposures to 9 and 16 Hz resonant frequencies were observed
for E coli (GE499), while 8.5 Hz was effective for the GE500 strain. In human cells, the
frequency windows for resonant-like features were determined to be within the 8 and 58 Hz
frequency bands. It was suggested that the data supported the ion cyclotron resonance model,
where the angular frequency response of acceleration that is experienced when ions are placed
in a magnetic field driven by the Lorenz force, for several biologically relevant ions. Tessaro
et al., (2015) exposed 4 species of bacteria (2 gram-positive and 2 gram-negative) to 6 EMF
conditions: 3 variations of the Thomas-EMF, strong static magnets (5000 G), oppositely
rotating strong magnets (5000 G, 30 rpm), and a strong dynamic MF generator (Resonator,
average intensity ~ 250 uT) all exposures were maintained for 12-hour durations. ELF-EMF
treatments significantly impacted the growth rates of bacterial cultures while the static magnets
did not. The Resonator increased growth in 3 of the selected bacterial species but slowed the
growth rates of S. marcescens.

15
Exposure of organisms to ELF-EMF has been shown to be associated with a variety of
behavioural changes (Persinger, Ossenkopp, & Glavin, 1972: Ludwig et al., 1968; Friedman,
Becker, & Bachman, 1967; Reiter, 1964; Konig, 1962) and have been implicated as possible
“zeitgebers” for circadian rhythms in man (Wever, 1967, 1968). Intermittent exposure to ELF-
EMF have been shown to delay hatching in ducks and produce unfavourable albumin
biosynthesis as compared to exposure to a static MF of the same intensity that had no effects
(Ossenkopp and Shapiro, 1973). Reille (1968) reported that pigeons exposed for 5 sec to 0.15
G at 0.3 Hz, 0.5 Hz, and higher frequency fields before the onset of an electric shock, began to
show increases in heart rate after the presentation of the field but before the shock. Similar
findings were reported by Yakovleva and Medvedeva (1974). Neurodevelopmental changes in
the hippocampus, as well as in contextual fear learning in response to ELF-EMF administration
in rats was investigated by Fournier et al., (2012). Rats were exposed to 4 different intensities
of complex patterned EMF (5 – 20 nT, 30 – 50 nT, 90 – 580 nT, and 590 – 1200 nT) that was
designed specifically to interfere with brain development during gestation and their
histochemistry was examined. The results indicated that a narrow band intensity was capable
of reducing cell density in the CA1 and CA3 hippocampal subfields. Conversely, Dupont et
al., (2004) demonstrated some alterations in cell density within the parasolitary nucleus
following treatment with a 0.5 Hz square wave complex magnetic fields with hourly alterations
in amplitude and intensity ranges falling within the nT spectrum.
Seizures have been described as aberrant electrical discharges within specific brain structures
(Bodde et al., 2009), ultimately altering their electrical sensitivity (Varro et al., 2009;
Csernansky et al., 1988; Gaetz, 2004). ELF-EMFs have been shown to induce increased
electrical lability in treated cells and it should be possible to disrupt or affect the function of
these more labile structures and observe large scale behavioural changes. Bureau and Persinger

16
(1995) demonstrated a reduction (68% as compared to 100%) of overt behavioural displays
contingent on lithium-pilocarpine-induced stage 5 seizures for animals that received 20
pairings of 4-min of burst-firing EMF for 1s every 4 seconds. Another study with 24 male rats
with histories of limbic seizures, involved exposures to 10 different variations of point duration
and inter-stimulus interval in two different, patterned EMFs (Thomas and burst-firing) for 5
min and revealed that animals receiving treatments of the Thomas pattern with point duration
and inter-stimulus interval set to 3 msec, displayed significantly more Racine level 5 seizures
(Persinger and Belanger-Chellew, 1999). Furthermore, application of a 7 Hz, 5 nT ELF-EMF
to rats during prenatal development impacted post-seizure mortality when ELF-EMF treated
rats were adults (St-Pierre et al., 2007).
The perception of nociceptive stimuli (i.e., pain) has implications for learning and survival,
while pain, secondary to organic or non-organic (psychogenic) conditions, can negatively
impact the quality of life (Weich et al., 2008; Bär et al., 2005). The potential to mitigate the
perception of nociceptive stimuli with ELF-EMF treatment has received great attention. Del
Sepia (2007) reviewed evidence that exposure to weak, time-varying ELF-EMF can elevate
nociceptive thresholds, alternatively producing analgesia, in a variety of vertebrates and
invertebrates. Fleming et al., (1994) experimentally compared the effectiveness of morphine
(4mg/kg), naloxone (10 mg/kg), and exposure to burst-firing EMF (5 µT for 1 sec every 4
seconds) across 3 successive days and found that the burst-firing pattern elicited a more
prolonged and larger analgesic effect than the other treatments. The effect size obtained was
argued to be therapeutically relevant for potential clinical interventions. Ryczko and Persinger
(2002), compared the latency of nociceptive responses in female Wistar rats at 30 and 60
minutes following a 30 min exposure to either; 1) burst-firing EMF or 2) Activity Pulse by
Emmers (another patterned EMF theoretically designed to produce analgesia) at an intensity of

17
1 µT. Results indicated relative increases in nociceptive response latencies for animals treated
with the burst-firing EMF but not the Activity Pulse EMF at 30 and 60 minutes after exposure.
The effectiveness of the burst-firing patterns was significantly greater than the effects observed
for naloxone or naloxone in combination field-treated animals. In a series of experiments
spanning 2 years, Martin and colleagues further described the specificity, timing, application
geometry, intensity, and most effective patterns of ELF-EMF to induce analgesia. Martin and
Persinger’s (2003) first endeavour compared the efficacy of 2 different EMF patterns (burst-
firing and Thomas) generated from either a heterogeneous EMF-generating device (solenoid)
or a homogeneous source generator (Helmholtz coil) to produce analgesia in response to
thermal nociception. Results indicated that those animals receiving EMF treatment generated
from a heterogeneous application device exhibited strong analgesia immediately and 30
minutes following ELF-EMF treatment. These authors also demonstrated that treatment with
clonidine in the presence of a 1 µT burst-firing ELF-EMF enhanced analgesic responses in
animals challenged with thermal nociceptive stimulation in a dose-dependent manner, while
the same EMF configuration in combination with prazosin, phenylephrine, and yohimbine had
no effect (Martin and Persinger, 2004). Subsequently, Martin et al., (2004a) systematically
investigated the potential of polarity (positive, negative, bipolar) of the burst-firing EMF to
reduce nociceptive responses to thermal insult, and demonstrated that the burst-firing EMF
presented with positive polarity or bipolar organizations had the strongest analgesic responses
when presented over 30 min for 1 sec every 4 sec. Further investigations demonstrated an
intensity dependence, and augmentation of analgesic responses associated with pre-injections
of morphine (4mg/kg) or agmatine (10mg/kg) but was blocked by naloxone (1 mg/kg) in rats
treated with burst-firing EMF for 1 sec every 4 sec over the duration of 30 min (Martin et al.,
2004b). The observed effects were conserved when using the Thomas-EMF, that is also capable
of eliciting analgesia, albeit with an onset occurring much more quickly. In a follow-up study

18
comparing the most effective ELF-EMF capable of producing analgesia in rats, burst-firing
EMF (that mimics LTP) in combination with nimodipine, but not when presented in
combination with Haldol, Chlorpromazine, and prednisolone (Martin and Persinger, 2005)
Finally, Martin et al., (2005) altered the parameters of magnetic field stimulation to determine
that components were important to maximize the effectiveness of the analgesic response in
male rats: the successive time delay of burst-firing presentations, the total exposure duration,
and the point duration (i.e., the length of time each current value was presented) that composed
the pattern were systematically investigated. Results demonstrated that maximum analgesia
was produced when the combination of 30 min exposures with presentations lasting 690 msec
presented ever 4 seconds. Further findings demonstrated elevated nociceptive thresholds in
seized rats for at least one week after a single exposure. Two other fields, the Thomas EMF
and a chaos pattern derived from the May algorithm, produced similar levels of analgesia
(Martin et al. 2005).
One structure that has been associated with remarkable sensitivity to electrical insult has been
the hippocampus (Andersen et al., 2006). The underlying function of the hippocampus is
concerned with the formation of new and retrieval of old memories (Andersen et al., 2006;
Crosby et al., 1962). The antecedent processes that convert newly acquired memory into longer
term representations within the interconnections between dendritic spines has been reported to
be affected by electrical and magnetic mechanisms (McFadden, 2013). An ELF-EMF modeled
after theta burst-firing neurons in the hippocampus (a pattern of activity that can induce LTP
in hippocampal slices (Rose, Diamond, Pang, & Dunwiddie, 1988), had powerful effects on
learning. Data collected from rats exposed to low intensity (200 to 500 nT) theta-burst EMF
modelled after current equivalents demonstrated the capacity to induce long-term potentiation
in hippocampal slices either immediately before or after training using a radial arm maze task.

19
Results were suggestive of an impairment in spatial memory (commissions of reference errors)
in animals that were exposed to the LTP-patterned EMF immediately after training (McKay
and Persinger, 2000). Conversely, an observed reduction in the speed of responding was
associated with animals that had received ELF-EMF exposure prior to training. Using the same
patterned ELF-EMF presented for 30-min either before or following fear conditioning resulted
in a marked attenuation of freezing behaviour during contextual extinction 24 hours later,
specifically for those animals that had received the treatment following training (McKay et al.,
2000). In an experiment aimed to ascertain potential synergisms between treatment with ELF-
EMF and with chemical stimulation on disrupting contextual fear learning, McKay and
Persinger (2003) reported that the combination of 4mg/kg amagmatine and 30 min exposures
to LTP EMF immediately following learning significantly decreased freezing behaviour.
Increased performance in radial arm maze cued recall, where the cue was a static magnet, was
reported in rats exposed to LTP ELF-EMF when the inter-stimulus interval was set to 4000
msec (McKay and Persinger, 2005). Delparte and Persinger (2007) found that exposures to
LTP patterned ELF-EMF elicited amnesic effects for contextual stimuli in rats that were
exposed to LTP ELF-EMF for 15 min per day for 6 days in a paradigm of food-induced
conditioned place preference. Rats exposed to LTP patterned ELF-EMF for 30 min before
training displayed impairments in memory performance in operant tasks while a facilitation of
performance on a timed inhibitory task was observed in animals that were exposed to this
pattern during task acquisition (Mach and Persinger, 2009). Animals that have been induced to
have chronic (limbic) seizures followed by treatment with ketamine behave similarly to
controls although the underlying structure of the brain demonstrates distinct alterations
(McKay and Persinger, 2004; Fournier and Persinger, 2004). When ketamine-treated lithium-
pilocarpine seized rats were exposed to a complex sequence of magnetic fields during 8 days
of radial arm maze acquisition, followed by 14 days of constant exposure to the Thomas pattern

20
before retention testing, where no training occurred, there was a slower response duration as
compared to all other treatment conditions (McKay and Persinger, 2006). If alterations in
hippocampal structure are associated with the acquisition of memories (und Halbach, 2009;
Geinisman, 2009), then any change that positively or negatively impacts the encoding of new
information should also elicit structural changes in the hippocampus. Whissel et al., (2009)
demonstrated that acquisition of conditioned fear was inhibited in animals exposed to a LTP
patterned ELF-EMF, with a concomitant decrease in cell density in the CA2 hippocampal sub-
field when intensities were greater than 10 nT while there was an increase in cell density in
Somer’s sector (the CA1 hippocampal sub-field) when intensity ranged from 10 – 50 nT as
well as reduction in cell density in the medial preoptic nucleus that was linearly dependent on
field intensity.
In humans, exposures to ELF-EMF have been reported to impact measures of
electroencephalographic activity, sensation, subjective and empirical measures of mood and
performance. Ruttan et al., (1990) exposed human participants to pulsed EMFs with
frequencies of 4, 9, and 16 Hz with intensities between 0.3 to 1.0 mG (100 nT) at the level of
the temporal lobes. Participants receiving field applications displayed enhanced vestibular,
depersonalization, and imagining experiences, as well as an increased number of temporal lobe
spikes correlated with self-reported pleasantness scores. Using a different EMF configuration,
Glover and colleagues (2007) were able to produce vertigo in 30% of their participants.
Volunteers exposed to successive 3-min bursts of different types of weak, patterned EMF
reported the sense of a presence while an exceptional subject with a history of accurately
discerning the health and history of people when handling their photos also reported an
increased number of events associated with this capacity when the fields were present (Cook
and Persinger, 1997). In a study examining 50 men and 50 women exposed to 5-min-off and

21
10-min-on cycles of burst-firing EMF for 35 min, Persinger (2003) demonstrated significantly
more experiences of a sensed presence for women, as compared to men, while the men were
more likely to consider these experiences as “intrusions” from an external source. The
possibility that exposures to ELF-EMF can enhance intrinsic features in a unique individual
was investigated with the artist Ingo Swann, who is reported to recreate and describe randomly
selected photos that were sealed in envelopes and placed in another location. Koren and
Persinger (2002) assessed the ability of Swann to accurately depict target photographs that
were treated with repeated presentations of ELF-EMF of 1) a sine wave of decreasing
amplitude or 2) a sequence based upon the Fibonacci series, generated from either 1)
WINDOWS or 2) DOS systems, at intensities that were less than 20 nT over the target image.
Results revealed that WINDOWS, but not DOS, generated patterns significantly and negatively
impacted Mr. Swann’s reporting accuracy.
Alterations in human brain electroencephalographic power in response to exposures to ELF-
EMF application was conducted by Richards et al., (2002). The experiment consisted of the
application of Thomas-EMF across an 8 solenoid array placed circumferentially around the
head of volunteers and the target ELF-EMF pattern was presented sequentially between the 8
solenoids with a rotation duration of 20 msec. Results indicated a 30% increase in spectral
power density in the transcerebral EEG theta band, with a 20% increase in right hemispheric
power as compared to the left. The capacity of ELF-EMF as a therapeutic for mood disorders
has been demonstrated to be effective in normal individuals and in those who have sustained a
head injury. In one study, Baker-Price and Persinger (1996) examined the treatment efficacy
of weekly, 30 min exposure to weak (1 uT) burst-firing EMF across the temporal lobes for a
duration 5 weeks in 4 depressed patients who had sustained traumatic brain injuries and
exhibited mild-to-moderate brain impairment (as assessed with standardized tests). The results

22
described significant improvements in depression and a reduction in phobias but not in the
physical symptoms or other complaints. In a second study, Baker-Price and Persinger (2003),
examined the differences in depression scores for 14 patients that reported chronic depression
lasting for more than 1 year following a closed head injury, after being exposed to burst-firing
EMF (1 uT) either over the frontal or temporal lobes (bilaterally) for 30 min sessions once a
week for 6 weeks. Clients treated with burst-firing ELF-EMF reported a significant reduction
in depression scores as compared to those receiving no ELF-EMF intervention. The changes
in depression scores were present irrespective of location of application. Also salient was a
concomitant reduction in complex partial epileptic-like experiences, only from those
individuals that received burst-firing ELF-EMF treatments that were directed over their
temporal lobes, while EEG measures that assessed the spectral power over the frontal,
temporal, and occipital lobes showed increased power within the 16 – 18 Hz range 6 weeks
after treatment cessation. Corradini and Persinger (2013) exposed normal individuals to burst-
firing EMF for 30 – 60 min and measured alterations in quantitative electroencephalographic
profiles and correlated these features with psychometric measures of depression. Results
indicated that exposure to burst-firing EMF significantly reduced subjective measures of
depression in normal individuals while concomitant increases in EEG beta power over the
prefrontal regions and left temporo-parietal regions were observed. Tsang et al., (2009),
reported that individuals exposed to ELF-EMF lowered levels of self-reported psychometric
fatigue after 20 min exposures, 1 time per week over three sessions to either burst-firing,
complex sequence, or LTP EMFs, while only exposures to burst-firing was determined to
improve mood and vigour scores.

23
1.4.3. HF-EMF
High frequency (HF) EMFs are operationalized as an EMF whose frequency characteristics
exceed 100 Hz.
High frequency EMFs have been demonstrated to affect chemical and cellular dynamics. For
instance, Mudrick et al., (1995) investigated the effect of the application of 42.19, 46.84, and
53.53 GHz, 1 mW/cm2 EMF for 30 min on the intensity of barium sulphate-induced luminol
chemoluminescence in human erythrocytes. Exposures to 42.19 GHz HF-EMF had maximal
effects showing that the phenomenon was frequency-dependent. Adey and colleagues (1982)
observed increased calcium efflux from the cortical cells of anesthetized cat cortices after 60
min exposures to 450 MHz, sinusoidally, amplitude-modulated EMF at 16 Hz. Intensity-
dependent changes in c-fos gene expression were observed in PC-12 cells treated for 20 min
with packet-modulated radio frequency EMF in combination with nerve growth factor (NGF;
Ivaschuk et al., 1997). Bioluminescent intensities of the Photobacterim leiognathi
demonstrated frequency-dependent suppression (~15%) when exposed to HF-EMF between
36.2 and 55.9 GHz, and intensities of 1.3 to 48.0 µW/cm2 (Berzhanskaya et al., 1995).
Changes in cell growth, chemical resistance, and survivability have also been demonstrated to
be impacted by HF-EMF treatment. Grundler and colleagues (1977, 1982, 1988) demonstrated
that HF-EMF frequency, and not intensity, was important in the enhancement or inhibition of
S. cerevisiae growth when they were exposed to EMF whose frequency swept between 41.8 –
42.0 GHz. S. cerevisiae showed similar synchronous fluctuations in growth rates and bud

24
formation in response to treatment with 0.03, W/cm2, 46 GHz EMF for 50 min (Golant et al.,
1994). Bulgakova et al., (1996) exposed S. aureus to either 54 or 42.195 GHz, or 66-78 GHz
band EMF with 1 GHz steps at 10 mW/cm2 for 1.5 to 60 minutes. In over 1000 experiments
examining 14 different antibiotic agents, these researchers were able to demonstrate differences
in growth when cells were exposed to EMF and antibiotics that affect cell membrane but not
when the inhibitors altered cell wall synthesis, DNA-dependent RNA synthesis, RNA
polymerase and RNA synthesis, or protein biosynthesis. While Levina et al., (1989)
demonstrated that Spirostum spirulina cell populations could be affected by exposures to a 7.1-
mm wavelength of HF-EMF at an intensity of 1.5 mW/cm2 when exposures were conducted
between days 2 and 11 of growth. Cultures exposed to EMF on days 2, 4, or 7 entered the
stationary growth phase on day 9, while exposures on day 9 and 11 postponed population death
by 5 days. Exposures occurring on day 2 increased the proliferation rate and by day 7 cell
density had doubled. In the yeast, C. albicans, narrow band frequency and modulation-
dependent changes in growth (i.e., 15% reduction) was observed when exposures consisted of
72 GHz fields that were modulated at 1 kHz (Dardononi et al., 1985). Exposure of ultraviolet
light treated E. coli to 61 GHz, 1 mW/cm2 EMF increased cell survival (Rojavin and Ziskin,
1995).
Exposure of animals and plants to HF-EMF have revealed some interesting results. Mahmoudi
et al., (2018) demonstrated that short (2 hour) exposures of rats treated with pentylentetrazol
(in a model of epilepsy), to 2.65 GHz EMF from Wi-Fi sources produced an enhancement in
seizure activity, although the authors cautioned the interpretation of these results. Brovkovich
et al., (1991) reported that exposures to a 61 GHz 4 mW/cm2 HF-EMF can activate calcium
pumps in the sarcoplasmic reticulum of skeletal and heart muscle cells in rats. Chromosomal
changes were identified in Acricotopus lucidus salivary glands following exposure to 67.2 and

25
68.2 GHz EMF at an intensity of 5 mW/cm2 (Kremer et al., 1988). With respect to plants,
Tambiev and colleagues (1989) found that treatment with 2.2 mW/cm2, 7.1-mm wavelength
EMF for 30 min enhanced growth in blue-green algae Spirulina platensis by 50%. Barley seeds
exposed to 61.5 GHz 0.1mW/cm2 EMF for 20 min demonstrated an increase in synchronization
of cell division of about 36% (Shestopalova et al., 1995).
Exposure to HF-EMF has been demonstrated to affect human task performance and EEG
measures. For instance, Preece (1999) found that exposures to 915 MHz continuous wave HF-
EMF at 1 W intensity, did not impact immediate word recall and picture presentation tasks.
However, exposures to a 915 MHz HF-EMF pulsed at 217 Hz with an intensity of 0.125 W
was found to negatively impact performance of choice reaction times, although it did not affect
simple reaction time, digit vigilance, spatial working memory, numeric working memory,
delayed word recall, delayed word recognition, or delayed picture recognition. In two
experiments, Koivisto et al., (2000a; 2000b) showed that exposure to a 2.0 W, 902 MHz HF-
EMF pulsed at 217 Hz resulted in a decrease in reaction time performance (i.e., longer response
times) and a decrease in false alarms in a vigilance task when exposures lasted 30 min, while
60 min exposures only negatively affected reaction time. Using a similar methodology,
Koivisto et al., (2001) found that self-report measures of somatic symptom severity from
individuals was not impacted by experimental HF-EMF treatment.
Alterations in EEG activity have been reported during and following prolonged periods of
exposure to low-level sinusoidally and pulse-modulated radio- and microwave fields (Servantie
et al., 1975; Bawin et al., 1973; Bawin et al., 1975 Takashima et al., 1979). Eulitz et al., (1998)
used a 917.2 MHz field modulated at 217 Hz at an intensity of 2.8 W, and demonstrated a
reduction in the P300 event-related potential over the central parietal region. Adding to this,

26
Freude (1998; 2000) and colleagues exposed individuals to a 916.2 MHz field with 217 Hz
modulation at an intensity of 2.0 W for 3 – 5 min, and demonstrated a reduction in EEG slow-
wave potentials over the central parietal, temporal, and occipital regions but not over the frontal
regions. Krause et al., (2000a) found an increase in relative EEG power within the 8 – 10 Hz
band associated with the retrieval portion of working memory in individuals exposed to a 902
MHz EMF pulsed at 217 Hz with an intensity of 2.0 W for 30 min. In a follow-up study, Krause
et al., (2000b) demonstrated that event-related potential alpha activity was modulated when
subjects were exposed to 903 MHz HF-EMF pulsed at 217 Hz at a 2.0 W intensity for 30 min.
However, no effects on reaction time or on the performance of tasks of visual working memory
were observed. In contrast, Roschke et al., (1997) observed significant changes in event-related
potentials (ERP) and tasks related to EEG in individuals exposed to a 900 MHz, 8.0 W EMF
with 217 Hz modulation for 3.5 min.
There is some evidence to support the use of specific configurations of HF-EMF as a
therapeutic intervention for radiation contamination, tumorigenesis, and wound healing.
Detalvs et al., (1993, 1994, 1995, 1996) rigorously studied the effects of exposures to HF-EMF
on wound healing by assessing the degree of granulation fibrous tissue formation. Data
suggested that 30 min daily exposure to 53.53 or 42.19 GHz continuous wave EMF or 42.19
GHz with 200 MHz modulation significantly decreased granulation fibrous tissue formation
and suppressed the inflammatory process in the former cases, while the latter application
enhanced inflammation. Further, Zemskov et al., (1998) investigated the potential of HF-EMF
treatment to enhance wound healing in septic conditions. Animals exposed to 37 or 46 GHz
continuous wave EMF for 30 min twice daily for 5 days had decreased swellings, enhanced
leukocyte infiltration, and a rapidly reduced wound area in the first 24 hours, as well as
increased phagocytosis and reduced bacterial contamination. Peripheral nerve regeneration

27
was enhanced by 20-day treatment course with 54 GHz HF-EMF for 10 minutes every third
day that demonstrated a statistically greater regeneration length, greater conduction velocity,
but no change in the amplitude or duration of the action potential, in regenerating peripheral
nerves (Kolosova et al., 1996). Chernov et al., (1989) demonstrated that rats inoculated with
Walker 256 tumor cells and exposed to 8-mm wavelength EMF pulsed 43 times at 40-s
intervals had a 1.5-fold reduction in tumor size and an increased lifespan (17-25 days).
Previous research has shown that exposure to low-intensity HF-EMF could mitigate the impact
of X-ray radiation (Gubkina et al., 1996). HF-EMF exposure consisted of a frequency-sweep
(38-53 GHz) at 7 mW/cm2 for 30 min/day over the course of 23 days. Rats were then exposed
to keV X-rays during the last 8 days of treatment up to a total dose of 24 Roentgens (3.0·10-3
C/kg). X-rays treatment alone enhanced serum glucose levels, but when animals were
presented with prophylactic EMF glucose levels returned to normal. Similar effects were
determined for soluble and fibrillary forms of the acidic glial fibrillary protein. Kuzmanova
and Ivanov (1995) studied changes in the surface electrical charge of erythrocytes after HF-
EMF and gamma-ray exposure in rats. Animals were exposed to 5.6-mm wavelength EMF for
10 days, for a duration of 20 minutes per day at an intensity of 1.1 mW/cm2 followed by 6 Gy
whole body exposures to Cobalt 137 gamma-rays. Exposure to gamma-rays alone altered
erythrocyte surface charge while treatment with HF-EMF radiation prior to gamma-ray
exposure returned these measures to control levels. Finally, Tstutsaeva et al., (1995) found that
treatment with HF-EMF increased survivability of mice following a lethal dose of X-rays. The
HF-EMF was pulse modulated at 1 µW/cm2 and presented either 80 or 24 hours prior to the X-
ray exposure. Exposures occurring 80-h prior to ionizing radiation treatment delayed X-ray
related death until day 14 as compared to ~7 days without prophylactic intervention, with a
50% mortality seen on day 30 and 100% mortality by day 96. Prophylactic treatment 24-hours

28
prior to X-ray exposure did not increase the longevity of animals as defined as the date of first
death (day 8) with 50% of animals dying within the first 30 days, however animals that survived
until day 30 were still alive at the termination of the experiment. Simultaneous exposure of
HF-EMF and lethal X-ray resulted in a fivefold increase in mouse survival and longevity.
1.4.4 Naturally Occurring EMF
The effects of manipulating the intensity of Earth’s ambient magnetic field have been studied.
In addition, applied exogenous fields designed to mimic magnetic perturbations that naturally
occur in the geomagnetic field have been examined. Geomagnetic field effects have been
associated with a disturbance in human embryonic fibroblast division (Kaznacheev and
Mikhajliva, 1985), as well as with increased sensitivity of cells challenged with poisoning
agents (Kanacheev et al., 1989). The amplitude and duration of incurrent geomagnetic storms
have been associated with bacterial bioluminescence intensity (Berzhanskaja et al., 1995).
Work by Brown et al., (1967) demonstrated that maximal alterations in snail behaviour
occurred at EMF intensities that were close to that of the geomagnetic field while Becker
(1963) found similar changes in animal behaviour. Orientation to the geomagnetic field is
widely observed in birds (Yeagley, 1947; Kholodov, 1975; Kirschvink et al., 1985; Barnes,
1996), that can be disrupted by marked alterations in field intensity. Other authors have
observed that the geomagnetic field, and associated disruptions, are associated with plant root
system development (Bogatina et al., 1986), root metabolism (Beljavaskaja et al., 1992), cell
proliferation (Fomichjova, 1992), and plant branching (Govorun et al., 1992). Alterations in
geomagnetic activity may be amplified and maintained in unique geographic locations and
could be dependent upon local geological and physical properties. For instance, Persinger and
Dotta (2011) observed a protracted 150 – 200 nT increase in the orthogonal magnetic vector
following a geomagnetic storm (K-index = 7), in the Sudbury basin. These alterations were

29
maintained and may contribute to unique experiences by different individuals and social groups
that may be reflected in local culture.
Natural periodicities in geomagnetic activity have also been demonstrated to impact the
behaviour of animals. Bureau and Persinger (1995) identified a relationship between the
latency of overt behavioural displays corresponding to limbic seizures and increases in
geomagnetic intensity (nT), associated with geomagnetic storms, with a 12% decrease in the
onset time when global geomagnetic activity exceeded 20-25 nT. There was an increase in
occurrence of sudden unexpected deaths by lithium-pilocarpine seized rats with chronic limbic
seizures provided that the daily measure of geomagnetic activity exceeded 50 nT, especially at
night (Persinger, 1995).
The presence of geomagnetic storm occurrence was associated with changes in human
behaviour that was correlated with an increased number of mistakes committed by pilots
(Derjapa et al., 1986; Usenko et al., 1989), an increased number of instantaneous deaths from
cardiovascular disease, (Gnevyshev et al., 1982) and the promoting of anxiety, irritability,
lower attention, and accuracy at work leading to an increase in motor vehicle accidents
(Ashikaliev et al., 1995). Persinger (1995b) demonstrated that an increase in individual self-
reports of “leaving” or being detached from one’s body by 128 men and women, that were
exposed only once to an experimental manipulation that enhances awareness of cognitive
processes, was correlated with changes in geomagnetic intensity. More specifically, greater
reports and experiences were reported when the geomagnetic activity on the day of the
experiment was greater than 15 nT but did not exceed 45 nT. The most intense experiences of
detachment were observed in individuals who had the greatest proportion of complex partial
epileptic-like signs. Factors that contribute to geomagnetic periodicities (e.g., solar cycles)

30
were associated with deterioration of the human nervous system (Belisheva et al., 1995),
increased psychotic episodes (Rudakov et al., 1984), and hospitalization for schizophrenia,
alcohol induced psychosis, and epileptic patients (Samokhvalov, 1989). Geomagnetic
periodicities were also associated with the risk of breast cancer in women (Rjabykh and
Bodrova, 1992), sudden infant death (Zaĭtseva and Pudovkin, 1995). criminal offences
(Chibirkin et al., 1995a), volumes of issued currency (Chibrikin et al., 1995b), sociopolitical
events (e.g., wars, economy, crises, etc.), and intellectual creativity (Vladimirsky and
Kislovsky, 1995).
Human brains fixed in preparations of formaldehyde and ethanol-formalin-acetic acid were
able to show specific release of biophotons in response to ambient geomagnetic field
intensities. Even though metabolic activity had ceased, aggregates of nervous tissue in a quasi-
stable geomagnetic environment demonstrated conserved reactivity to fluctuations in
geomagnetic intensity. Costa et al., (2016) demonstrated increased photon emission from the
right hemisphere, but not the left, when fixed post-mortem human brains were dark adapted,
exposed to ambient light conditions, assessed, and responded with right hemispheric photon
emission that was strongly correlated to geomagnetic field intensity. Similar alterations in right
hemispheric photon emission and quantitative electroencephalographic measures were
observed in living humans (Mulligan et al., 2010; Mulligan and Persinger, 2012). Asymmetry
in cellular organizations of the parasolitary nucleus were observed in rats that were exposed to
EMF whose strength and frequency components were correlated with the geomagnetic field
configurations associated with sudden infant death syndrome (Dupont et al., 2004).
Fluctuations and enhancements of ambient geomagnetic intensity are capable of impacting
aspects of biological structure and function. Depression of the geomagnetic field intensity, by

31
shielding in Faraday cages, can also promote unique changes in biological responses.
Podkhovin (1995) observed an increase in epinephrine and histamine levels with a concomitant
decrease in serotonin levels in Guinea pigs following 30 min exposures to weakened (1/10)
geomagnetic field intensities. Shielding of the geomagnetic field has also been related to a risk
of embryological teratomas (Shibab et al., 1987; Asashima et al., 1991). Exposures to a
weakened geomagnetic environment was shown to affect the building behaviour of termites
(Becker, 1976), Several authors have remarked on the depression of vital functions of bacteria
when the geomagnetic environment was dampened (Achkasova, 1972; Alfjorov and
Kuznetsova, 1981).
Although changes in geomagnetic activity can be correlated with changes in behaviour, this
does not support the idea that the changes cause the observation. Therefore, rigorous scientific
experimentation with successive approximation, allows us to collect enough data to support
the idea that the relationship is being driven by one factor. Mulligan et al., (2012) demonstrated
a synergistic relationship between sub-micromolar and micromolar concentrations of
melatonin and an experimental EMF designed to mimic geomagnetic activity in their ability to
reduce planaria motility. The exposure protocol was such that the experimental field was
presented once an hour for 6 min over 8 successive hours. The relationship between
geomagnetic activity and seizure behaviour was investigated by Persinger (1996) who
intermittently exposed chronic (limbic) epileptic rats to experimental EMFs (for one to three
nights consecutively) designed to simulate geomagnetic activity with 2 different intensities (
50 nT and 500 nT) and ripple frequencies (7 and 40 Hz) over a 200-day period Results indicated
a 3.1 fold increase in overt seizures following food presentation when the field was
administered for 1 or 2, but not 3, nights.

32
Geomagnetic activity has been associated with the onset, progression, and symptom severity
of multiple sclerosis (Papathanasopoulos et al., 2016; Persinger, 2006; Resch, 1995). Cook and
Persinger (2000) exposed female Lewis rats subjected to protocols to induce experimental
allergic encephalomyelitis (EAE) to either a 7 or 40 Hz amplitude-modulated EMF whose
temporal structure was designed to mimic geomagnetic sudden storm commencement at 2
intensities (30 – 50 nT and 500 nT) for 6 minutes every hour for 8 hours across 2 weeks and
demonstrated reductions in overt EAE signs. These reductions were specific to the 30-50 nT,
7 Hz pattern. Histological analysis revealed a reduction in mononuclear cell infiltration foci in
animals exposed to the most effective configuration of intensity and pattern. Additional
analysis indicated that the 50 nT, 7 Hz EMF treatments were associated with a greater cell
infiltration in the left thalamus while the 500 nT, 40 Hz EMF had more right thalamic foci.
Alteration in the presence of mast cells in the thalamus were observed as a function of
treatment. Following these initial studies, Kinoshemeg and Persinger (2004), exposed female
Lewis rats to 50 nT, 7 Hz amplitude-modulated EMF for 6 minutes an hour for 8 hours, after
induction of EAE across days 1-7, days 8-16, days 1-16, or days 9 and 10 following EAE
induction. Results suggested that animals exposed to EMF on nights 1-7 and on days 9 and 10
displayed more severe clinical symptoms of EAE as compared to animals receiving treatments
on nights 8-16 and nights 1-16. The authors discussed the importance of the timing of
intervention following the onset of diseased states in affecting the therapeutic value of the
treatment.
1.5 Light/EM radiation:
Here we aim to examine data generated from the direct application of light emitting units or
EMFs generated by current presentations that correspond to frequencies that fall within the
infra-red (IR) to ultraviolet (UV) spectrum of electromagnetic radiation.

33
The hypothesis that applied EMF corresponding to UV-visible spectrum wavelengths can be
generated by biological systems has long been theorized since the initial investigations
conducted by Gurwitsch who observed that mitotic radiation can be induced by adjacent cells
(Cifra et al., 2014; Gurwitsch and Gurwitsch, 1959; Gurwitsch, 1988). Light as a measure of
biological function/change has been heavily researched (Popp et al., 1988; Popp 2003a; Popp,
2003b; VanWijk, 2001). For instance, it is possible to discriminate between malignant and non-
malignant cell lines based on the differences in the spectral power density profiles emitted by
cells (Dotta et al, 2016).
The use of photo-multiplier tubes to detect the quantity of light being emitted, has allowed the
detection of magnetically coupled physio-chemical reactions (Dotta and Persinger, 2012) and
demonstrated a doubling of ultra-weak emission, when samples were exposed to a unique
configuration of bulk accelerating/decelerating EMFs with decelerating/accelerating phase
velocities (Dotta et al., 2013). In terms of biology, Cosic et al., (1991) demonstrated that
specific wavelengths of light corresponded to specific protein-protein and protein-DNA
interactions as derived by assigning amino acid sequences pseudo-potentials.
Experimental verification that light could impact cell or protein activity would be directly
relevant. Choi et al., (2012) applied a brief 710 nm LED treatment to the eyes of patients
following ischemia and demonstrated neurite outgrowth that was associated with enhancement
of mitogen-activated protein kinase (MAPK) pathways, while retinal wound healing was
observed subsequent to 670 nm, light therapy that was associated with activation of signal
transduction (Eells et al., 2004). Conversely, Masoumipoor et al., (2013) demonstrated that
neuropathic pain could be attenuated in patients treated with low-level laser therapy at a

34
wavelength of 660 nm, a 10 nm difference in wavelength from that which promoted peripheral
neurogenesis. Wu and Persinger (2011) showed that only applications of 880 nm light at an
intensity of 1 mW/m2 increased mobility and regeneration rates in amputated planaria. Folta
and Childers (2008) examined the potential of artificial light applications to enhance growth of
plants, observing that those specimens that received a mixture of red and blue light had greater
total fresh weight, root mass, and vegetative growth.
While light alone demonstrates bio-effectivity, combinations of light coupled to the presence
of other forms of EM stimuli may elicit unique synergies. Olcese and Reuss (1986) found that
rats exposed to a weak (1 lux) red light enhanced the animal’s ability to discriminate between
the presence or absence of an ELF-EMF. Karbowski et al., (2016) reported that cells treated
with a combination of pulsed blue light (470 nm; 1 msec durations) and the presentation of a
weak, complex EMF for 1 hour promoted light production with spectral characteristics
demonstrating a 102-103fold increase in power, peaking approximately 70 min following
exposure and decreasing after 100 min. The authors quantified the energy of the emitted light
as being equal to the energy stored within the applied EMF and was emitted at a wavelength
of 470 nm, as assessed by spectrophotometry. Murugan et al., (2017) examined the effect of
the combination of 3 different wavelengths (blue, green, red) coupled to a weak physiologically
patterned EMF (Thomas-EMF) on both planaria regeneration and on the suppression of
melanoma cell proliferation. Results suggested that the combination of blue light and Thomas-
EMF was able to enhance melanoma cell growth suppression while red light (alone), blue light
(alone), Thomas-EMF, and the combination of the Thomas-EMF with both red and blue light
facilitated planaria regeneration. Conversely, treatment with green light (alone) did not
appreciably alter melanoma cell proliferation and eliminated the growth suppression elicited
by Thomas-EMF when presented together. Meli and Persinger (2009) examined the

35
effectiveness of combining different wavelengths of light and the degree of spectrum saturation
(red, green, white) with exposure to a burst-firing patterned EMF in a protocol that has been
shown to reliably elicit a sensed presence in participants. Results were suggestive of increased
visual sensations along the right side for participants exposed to red light, as well as more
reports of dizziness, sensed presence, “ego-alien” thoughts, and detachment from body.
Meanwhile, green light facilitated more left-sided visual sensations in participants.
The previous chapter was devoted to reviewing the effects that magnetic and electromagnetic
field exposures have on biological systems. This is important because any system under
observation is continually subjected to natural and artificial MF/EMFs present in the
environment. It has been previously demonstrated that experimental and ambient MF/EMF
exposures can affect biological systems with the different sources used to generate these fields
leading to distinct outcomes. Furthermore, the response of biological systems to MF/EMF
exposure is maximized when the structure of the applied field (i.e., the pattern) mimics what is
observed biologically in a manner similar to the way that psychotropic drugs affect behaviour.
Consider the activation of the nervous system in response to psychedelics (e.g., lysergic acid
diethylamide; LSD). The mechanism of action by that LSD produces its effects is the result of
receptor activation by endogenous neurotransmitters that the psychotropic mimics. In this
example, the resultant experiential changes associated with LSD only occur because the
structure of the molecule resembles the structure of naturally occurring neurotransmitters (i.e.,
serotonin). In fact, if there was no exclusive receptor for LSD to act on and therefore its effects,
mediated by endogenous receptors that bind neurotransmitter with structures that mimic LSD,
would not occur. Similarly, patterned EMFs designed to mimic what is occurring biologically
are efficacious, while those EMFs whose patterns are different from naturally occurring
processes, do not elicit a response or result in a response that is different.

36
We can liken effects observed as a consequence of EMF exposure, at least partially, as being
similar to the effects observed when the system is presented with pharmacological
interventions. As in the development of novel pharmaceutical therapies, it is important to
understand the mechanisms through that EMFs work in order to produce their effects, as well
as that components of EMFs are important to initiate or sustain the mechanism of action.
Identifying the structural components of the EMF that most contribute to any change would be
similar to identifying functional groups of chemicals. In order to demonstrate the mechanism
through that EMFs produce their effects we must identify a system(s) that reliably and
consistently responds to a particular EMF configuration. Identifying these model systems
would provide a basis to allow for systematic experimentation to investigate the functional
salience of distinct EMF parameters including pattern, intensity, modulation (amplitude,
frequency, phase), exposure duration, equipment, etc. In our review, we have found that B16-
BL6 cells reliably respond to a frequency-modulated EMF (i.e., Thomas-EMF) and these
responses can be measured in a number of different ways (i.e., ultra-weak photon emission,
proliferation, calcium uptake). In this thesis, we will develop another cell system to evaluate
the mechanisms underlying EMF effects.
Having knowledge that exposure to a particular EMF configuration can result in unique
outcomes does not provide us with an understanding of the mechanism of action. It would be
prudent to associate known structural and functional changes (e.g., changes in protein kinetics,
protein channel activation, conformational of receptors, etc.) at the level of the cell and provide
a series of events that results from EMF exposure in order to effectively identify a mechanism
of action. Understanding the molecular mechanisms associated with EMF exposure would

37
provide the unique opportunity to examine pharmaco-magneto synergisms, that could be used
to develop alternative and cost-effective treatments for a myriad of health concerns.

38
1.6 References:
Achkasova YuN. 1973. Metabolism and rate of reproduction of microorganisms developing at
shielding electric and magnetic fields. In: Effects of weak electromagnetic fields on biological
objects. Kharkov: Kharkov Medical Institute. p 51-52.
Adey, W. R., Bawin, S. M., & Lawrence, A. F. (1982). Effects of weak amplitude‐modulated
microwave fields on calcium efflux from awake cat cerebral cortex. Bioelectromagnetics:
Journal of the Bioelectromagnetics Society, The Society for Physical Regulation in Biology
and Medicine, The European Bioelectromagnetics Association, 3(3), 295-307.
Aleksandrovskaia, M. M., & Kholodov, I. (1966). The possible role of the neuroglia in the
formation of a bioelectric reaction of the brain to a constant magnetic field. Doklady Akademii
nauk SSSR, 170(2), 482.
Alfjorov, O. A., & Kuznetsova, T. V. (1981). Influence of weakened geomagnetic field on the
stability of Escherichia coli to ultraviolet rays. Kosmicheskaja Biologija i Aviakosmicheskaja
Meditsina (Cosmic biology and aviation and cosmic medicine), 4, 57-58.
Alipov, Y. D., & Belyaev, I. Y. (1996). Difference in frequency spectrum of extremely‐low‐
frequency effects on the genome conformational state of AB1157 and EMG2 E. coli
cells. Bioelectromagnetics: Journal of the Bioelectromagnetics Society, The Society for
Physical Regulation in Biology and Medicine, The European Bioelectromagnetics
Association, 17(5), 384-387.

39
Amer NM, Tobias CA. 1965. Analysis of the combined effect of magnetic fields, temperature,
and radiation on development. Radiat Res 25:172a.
Andersen, P., Morris, R., Amaral, D., Bliss, T., & O'Keefe, J. (Eds.). (2006). The hippocampus
book. Oxford university press.
Anisimov, V. N., Zhukova, O. V., Veniashvili, D., Bilanishvili, V. G., Menabde, M. Z., &
Gupta, D. (1996). Effect of the light regime and electromagnetic fields on mammary
carcinogenesis in female rats. Biofizika, 41(4), 807-814.
Artjukhina, NI. (1988). Reactions of structural elements of the rat’s brain to the action of
magnetic fields. In: Kholodov YuA, lebedeva, NN, editors. Problems of electromagnetic
neurobiology. Moscow: Nauka (Science). p 48-64.
Asashima M, Shimada K, Pfeiffer CJ. 1991. Magnetic shielding induces early developmental
abnormalities in the newt. Bioelectromagnetics 12:215–224.
Ashikaliev YaF, Drob'jev VI, Somsikov VM, Turkeeva VA, Yakovets TK. 1995. The influence
of heliogeophysical parameters on ecology. Biofizika (Biophysics) 40: 1031-1037.
Baker-Price, L. A., & Persinger, M. A. (1996). Weak, but complex pulsed magnetic fields may
reduce depression following traumatic brain injury. Perceptual and motor skills, 83(2), 491-
498.

40
Baker-Price, L., & Persinger, M. A. (2003). Intermittent burst-firing weak (1 microTesla)
magnetic fields reduce psychometric depression in patients who sustained closed head injuries:
A replication and electroencephalographic validation. Perceptual and Motor Skills, 96(3), 965-
974.
Bär, K. J., Brehm, S., Boettger, M. K., Boettger, S., Wagner, G., & Sauer, H. (2005). Pain
perception in major depression depends on pain modality. Pain, 117(1-2), 97-103.
Barnes FS. 1996. Interaction of DC and ELF electric fields with biological materials and
systems. In: Polk C, Postow E, editors. The CRC handbook on biological effects of
electromagnetic fields. Boca Raton, Florida: CRC Press. p 103-147.
Barnothy MF. 1963. Reduction of radiation mortality through magnetic pre-treatment. Nature
200:279–280.
Barnwell, F. H., & Brown, F. A. (1964). Responses of planarians and snails. In Biological
effects of magnetic fields (pp. 263-278). Springer, Boston, MA.
Bassett, A. (1994). Therapeutic uses of electric and magnetic fields in orthopedics. Biological
effects of electric and magnetic fields—beneficial and harmful effects, 2, 13-48.
Bawin, S. M., Gavalas-Medici, R. J., & Adey, W. R. (1973). Effects of modulated very high
frequency fields on specific brain rhythms in cats. Brain Research, 58(2), 365-384.
Bawin, S. M., Kaczmarek, L. K., & Adey, W. R. (1975). Effects of modulated VHF fields on
the central nervous system. Annals of the New York Academy of Sciences, 247(1), 74-81.

41
Becker, R. O. (1963). Relationship of geomagnetic environment to human biology. New York
state journal of medicine, 63, 2215.
Becker, G. (1967). Die Temperatur-Abhangigkeit der Frasstatigkeit einiger Termitenarten.
Zeitschrift fur Angewandte Entomologie 60, 90 – 123.
Becker, G. (1971). Physiological influences on wood-destroying insects of wood compounds
and substances produced by microorganisms. Wood science and technology, 5(3), 236-246.
Belisheva NK, Popov AN, Petukhova NV, Pavlova LP, Osipov KS, Tkachenko SE, Baranova
TI. 1995. Qualitative and quantitative estimation of influence of geomagnetic field variations
on functional state of the human brain. Biofizika (Biophysics) 40:1005±1012.
Beljavskaja, N. A., Fomichjova, V. N., Govorun, R. D., & Danilov, V. I. (1992). Structural and
functional organization of meristem cells of pea, flax and lentil roots under conditions of the
geomagnetic field shielding. Biofizika (Biophysics), 37, 745-749.
Belyaev, I. (2011). Toxicity and SOS-response to ELF magnetic fields and nalidixic acid in E.
coli cells. Mutation Research/Genetic Toxicology and Environmental Mutagenesis, 722(1),
56-61.
Belyaev, I. Y., & Alipov, E. D. (2001). Frequency-dependent effects of ELF magnetic field on
chromatin conformation in Escherichia coli cells and human lymphocytes. Biochimica et
Biophysica Acta (BBA)-General Subjects, 1526(3), 269-276.

42
Bell, G. B., Marino, A. A., & Chesson, A. L. (1992). Alterations in brain electrical activity
caused by magnetic fields: detecting the detection process. Electroencephalography and
clinical Neurophysiology, 83(6), 389-397.
LYu, B., Berzhanskii, V. N., & OYu, B. (1995). Effect of electromagnetic fields on the activity
of bioluminescence in bacteria. Biofizika, 40, 974-977.
Berzhanskaja LYu, Berzhansky VN, Beloplotova OYu, Pil'nikova TG, Metljaev TN. 1995.
Bioluminescent activity of bacteria as an indicator of geomagnetic disturbances. Biofizika
(Biophysics) 40:778-781.
Bidal. R. (2018). Spontaneous aggregation of non-living and living matter in aqueous
environments subjected to a static electromagnetic field: potential link to the next step of
abiogenesis (Master’s of Science in Biology). Laurentian University. Sudbury, Canada.
Bigham, A. S., Shadkhast, M., & Dehghani, S. N. (2009). Autogenous bone marrow concurrent
with static magnetic field effects on bone-defect healing: radiological and histological
study. Comparative Clinical Pathology, 18(2), 163.
Binhi, V. N., Alipov, Y. D., & Belyaev, I. Y. (2001). Effect of static magnetic field on E. coli
cells and individual rotations of ion–protein complexes. Bioelectromagnetics: Journal of the
Bioelectromagnetics Society, The Society for Physical Regulation in Biology and Medicine,
The European Bioelectromagnetics Association, 22(2), 79-86.

43
Blackman, C. F., Benane, S. G., & House, D. E. (1993a). Evidence for direct effect of magnetic
fields on neurite outgrowth. The FASEB journal, 7(9), 801-806.
Blackman, C. F., Benane, S. G., House, D. E., & Pollock, M. M. (1993b). Action of 50 Hz
magnetic fields on neurite outgrowth in pheochromocytoma cells. Bioelectromagnetics, 14(3),
273-286.
Blackman, C. F., Blanchard, J. P., Benane, S. G., & House, D. E. (1994). Empirical test of an
ion parametric resonance model for magnetic field interactions with PC‐12
cells. Bioelectromagnetics: Journal of the Bioelectromagnetics Society, The Society for
Physical Regulation in Biology and Medicine, The European Bioelectromagnetics
Association, 15(3), 239-260.
Blank, M., & Goodman, R. (2004). Initial interactions in electromagnetic field‐induced
biosynthesis. Journal of cellular physiology, 199(3), 359-363.
Blank, M., Soo, L., & Abbott, R. E. (1979). Erythrocyte membrane proteins: a modified Gorter-
Grendel experiment. The Journal of membrane biology, 47(2), 185-193.
Blank, M. A. R. T. I. N. (1992). Na, K-ATPase function in alternating electric fields. The
FASEB journal, 6(7), 2434-2438.
Blank, M., & Soo, L. (1992). The threshold for alternating current inhibition of the Na, K-
ATPase. Bioelectromagnetics, 13, 329-333.

44
Blank, M., & Soo, L. (1993). The Na, K-ATPase as a model for electromagnetic field effects
on cells. Bioelectrochemistry and bioenergetics, 30, 85-92.
Blank, M., & Soo, L. (1998a). Enhancement of cytochrome oxidase activity in 60 Hz magnetic
fields. Bioelectrochemistry and bioenergetics, 45(2), 253-259.
Blank, M., & Soo, L. (1998b). Frequency dependence of cytochrome oxidase activity in
magnetic fields. Bioelectrochemistry and Bioenergetics, 46(1), 139-143.
Blank, M., & Soo, L. (2001a). Optimal frequencies for magnetic acceleration of cytochrome
oxidase and Na, K-ATPase reactions. Bioelectrochemistry, 53(2), 171-174.
Blank, M., & Soo, L. (2001b). Electromagnetic acceleration of electron transfer
reactions. Journal of cellular biochemistry, 81(2), 278-283.
Blomme, C. G., Parker, G. H., & Persinger, M. A. (1990). Operant Detection of Extremely
Low Frequency Magnetic Fields by the Domestic Pigeon Columba livia. Bird Behavior, 8(2),
73-78.
Bogatina NI, Litvin VM, Travkin MP. 1986. Wheat roots orientation under the effect of
geomagnetic field. Biofizika (Biophysics) 31:886-890.
Bresler, S. E., Bresler, V. M., Vasil'eva, N. N., & Kazbekov, E. N. (1978). Effect of strong
magnetic fields on active transport in the choroid plexus. Dokl. Biol. Sci. (Engl. Transl.)
;(United States), 242.

45
Brovkovich, V. M., Kurilo, N. B., & Barishpol'ts, V. L. (1991). Action of millimeter-range
electromagnetic radiation on the Ca pump of sarcoplasmic reticulum. Radiobiologiia, 31(2),
268-271.
Brown Jr, F. A., Barnwell, F. H., & Webb, H. M. (1964). Adaptation of the magnetoreceptive
mechanism of mud-snails to geomagnetic strength. The Biological Bulletin, 127(2), 221-231.
Brown Jr, F. A., & Park, Y. H. (1967). Association-formation between photic and subtle
geophysical stimulus patterns—a new biological concept. The Biological Bulletin, 132(3),
311-319.
Buckner, C. A., Buckner, A. L., Koren, S. A., Persinger, M. A., & Lafrenie, R. M. (2015).
Inhibition of cancer cell growth by exposure to a specific time-varying electromagnetic field
involves T-type calcium channels. PLoS One, 10(4), e0124136.
Buckner, C. A., Buckner, A. L., Koren, S. A., Persinger, M. A., & Lafrenie, R. M. (2017). The
effects of electromagnetic fields on B16‐BL6 cells are dependent on their spatial and temporal
character. Bioelectromagnetics, 38(3), 165-174.
Buckner, C. A., Buckner, A. L., Koren, S. A., Persinger, M. A., & Lafrenie, R. M. (2018).
Exposure to a specific time‐varying electromagnetic field inhibits cell proliferation via cAMP
and ERK signaling in cancer cells. Bioelectromagnetics, 39(3), 217-230.
46
Bulgakova, V. G., Grushina, V. A., Orlova, T. I., Petrykina, Z. M., Polin, A. N., Noks, P. P.,
... & Rubin, A. B. (1996). The effect of millimeter-band radiation of nonthermal intensity on
sensitivity of Staphylococcus to various antibiotics. Biofizika, 41(6), 1289-1293.
Bureau, Y. R. J., & Persinger, M. A. (1995). Decreased incidence of limbic motor seizures
following twenty pairings of subclinical lithium-pilocarpine injections and a complex “burst-
firing” magnetic field. Electro-and Magnetobiology, 14(1), 1-6.
Bureau, Y. R. J., & Persinger, M. A. (1995). Decreased latencies for limbic seizures induced
in rats by lithium-pilocarpine occur when daily average geomagnetic activity exceeds 20
nanoTesla. Neuroscience letters, 192(2), 142-144.
Burke, H. E. (2012). Handbook of magnetic phenomena. Springer Science & Business Media.
Chemeris, N. K., & Safronova, V. G. (1993). A weak low-frequency magnetic field initiates
the frequency dependent fluctuations of Daphnia magna heart contraction
period. Biofizika, 38(3), 511-519.
Chernov, Z. S., Faikin, V. V., & Bernashevskii, G. A. (1989). Experimental study of the effect
of nanosecond EHF pulses on malignancies. Millimeter Waves in Medicine and Biology.”
Moscow: Radioelectronica, 121-127.
Chibrikin VM, Samovichev EG, Kashinskaja IV, Udal'tsova NY. 1995a. Dynamics of social
processes and geomagnetic activity. 1. Periodic components in variations of the number of
crimes registered in Moscow. Biofizika (Biophysics) 40:1050-1053.

47
Chibrikin VM, Kashinskaja IV, Udal'tsova NY. 1995b. Dynamics of social processes and
geomagnetic activity. 2. Geomagnetic response in money issue. Biofizika (Biophysics)
40:1054-1059.
Choi, D. H., Lee, K. H., Kim, J. H., Kim, M. Y., Lim, J. H., & Lee, J. (2012). Effect of 710 nm
visible light irradiation on neurite outgrowth in primary rat cortical neurons following ischemic
insult. Biochemical and biophysical research communications, 422(2), 274-279.
Cifra, M., & Pospíšil, P. (2014). Ultra-weak photon emission from biological samples:
definition, mechanisms, properties, detection and applications. Journal of Photochemistry and
Photobiology B: Biology, 139, 2-10.
COSIC, I., HODDER, A. N., AGUILAR, M. I., & HEARN, M. T. (1991). Resonant
recognition model and protein topography: model studies with myoglobin, hemoglobin and
lysozyme. European journal of biochemistry, 198(1), 113-119.
Cook, C. M., & Persinger, M. A. (1997). Experimental induction of the “sensed presence” in
normal subjects and an exceptional subject. Perceptual and Motor Skills, 85(2), 683-693.
Cook, L. L., & Persinger, M. A. (2000). Suppression of experimental allergic
encephalomyelitis is specific to the frequency and intensity of nocturnally applied, intermittent
magnetic fields in rats. Neuroscience letters, 292(3), 171-174.

48
Corradini, P. L., & Persinger, M. A. (2013). Brief Cerebral Applications of Weak,
Physiologically-patterned Magnetic Fields Decrease Psychometric Depression and Increase
Frontal Beta Activity in Normal Subjects. J Neurol Neurophysiol, 4, 175.
Costa, J. N., Rouleau, N., & Persinger, M. A. (2016). Differential spontaneous photon
emissions from cerebral hemispheres of fixed human brains: Asymmetric coupling to
geomagnetic activity and potentials for examining post-mortem intrinsic photon
information. Neuroscience and Medicine, 7(02), 49.
Crosby, E. C. T., Humphrey and EW Lauer 1962 Correlative Anatomy of the Nervous System.
Csernansky, John G., Julia Mellentin, Linda Beauclair, and Leon Lombrozo. "Mesolimbic
dopaminergic supersensitivity following electrical kindling of the amygdala." Biological
psychiatry 23, no. 3 (1988): 285-294.
Dahl, P. F. (1997). Flash of the Cathode Rays: A History of JJ Thomson's Electron. CRC Press.
da Motta MA, Muniz JBF, Schuler A, Da Motta M. Static magnetic fields enhancement of
Saccharomyces cerevisae ethanolic fermentation. Biotechnol Prog. 2004; 20:393–6.
Dardanonl, L., Torregrossa, M. V., & Zanforlin, L. (1985). Millimeter-wave effects on Candida
albicans cells. Journal of Bioelectricity, 4(1), 171-176.

49
Delparte, J. J., & Persinger, M. A. (2007). Brief exposures to theta-burst magnetic fields impair
the consolidation of food-induced conditioned place preference. International Journal of
Neuroscience, 117(2), 295-299.
Del Seppia, C., Ghione, S., Luschi, P., Ossenkopp, K. P., Choleris, E., & Kavaliers, M. (2007).
Pain perception and electromagnetic fields. Neuroscience & Biobehavioral Reviews, 31(4),
619-642.
Derjapa NR, Kopanev CI, Usenko GA. 1986. Effects of factors of solar flares and geomagnetic
disturbance on the functional and physiological possibilities of a pilot. Bjulleten' SO AMN
SSSR (Bulletin of the Siberian Department of the Academy of Science of the USSR) 5:83±88.
Detlav, I. E., Shkirmante, B. K., Dombrovska, L. E., Pahegle, I. V., & Slutskii, L. I. (1993).
Biochemical parameters of developing granulo-fibrous tissue after the effect of an extremely
high-frequency electromagnetic field. Millimetrovie Volni v Biologii i Meditcine, 2, 43-50.
Detlavs, I., Dombrovska, L., Klavinsh, I., Turauska, A., Shkirmante, B., & Slutskii, L. (1994).
Experimental study of the effect of electromagnetic fields' in the early stage of wound
healing. Bioelectrochemistry and Bioenergetics, 35(1-2), 13-17.
Detlavs, I., Dombrovska, L., Shkirmante, B., Turauska, A., & Slutskii, L. (1995). Some
biological effects of mm-wave electromagnetic fields on the granulation-fibrous tissue in a
healing wound. In Moscow, Russia: 10th Russian Symposium “Millimeter Waves in Medicine
and Biology,” April (pp. 117-119).

50
Detlavs, I., Dombrovska, L., Turauska, A., Shkirmante, B., & Slutskii, L. (1996). Experimental
study of the effects of radiofrequency electromagnetic fields on animals with soft tissue
wounds. Science of the total environment, 180(1), 35-42.
Dotta, B. T., Buckner, C. A., Cameron, D., Lafrenie, R. M., & Persinger, M. A. (2011).
Biophoton emissions from cell cultures: biochemical evidence for the plasma membrane as the
primary source. General Physiology and Biophysics, 30(3), 301.
Dotta, B. T., & Persinger, M. A. (2012). “Doubling” of local photon emissions when two
simultaneous, spatially-separated, chemiluminescent reactions share the same magnetic field
configurations. Journal of Biophysical Chemistry, 3(01), 72.
Dotta, B. T., Koren, S. A., & Persinger, M. A. (2013). Demonstration of entanglement of
“pure” photon emissions at two locations that share specific configurations of magnetic
fields: implications for translocation of consciousness. Journal of Consciousness Exploration
& Research, 4(1).
Dotta, B. T., Murugan, N. J., Karbowski, L. M., & Persinger, M. A. (2013). Excessive
correlated shifts in pH within distal solutions sharing phase-uncoupled angular accelerating
magnetic fields: macro-entanglement and information transfer. International Journal of
Physical Sciences, 8(36), 1783-1787.
Dotta, B. T., Lafrenie, R. M., Karbowski, L. M., & Persinger, M. A. (2014a). Photon emission
from melanoma cells during brief stimulation by patterned magnetic fields: is the source

51
coupled to rotational diffusion within the membrane. General Physiology and Biophysics, 33,
63-73.
Dotta, B. T., Vares, D. A., Buckner, C. A., Lafrenie, R. M., & Persinger, M. A. (2014b).
Magnetic field configurations corresponding to electric field patterns that evoke long-term
potentiation shift power spectra of light emissions from microtubules from non-neural
cells. Open Journal of Biophysics, 4(04), 112.
Dotta, B. T., Karbowski, L. M., Murugan, N. J., Vares, D. A. E., & Persinger, M. A. (2016).
Ultra-weak Photon Emissions Differentiate Malignant Cells from Non-Malignant Cells In
Vitro. Archives of Cancer Res, 4(2).
Dupont, M. J., McKay, B. E., Parker, G., & Persinger, M. A. (2004). Geophysical variables
and behavior: XCIX. Reductions in numbers of neurons within the parasolitary nucleus in rats
exposed perinatally to a magnetic pattern designed to imitate geomagnetic continuous
pulsations: implications for sudden infant death. Perceptual and motor skills, 98(3), 958-966.
Eells, J. T., Wong-Riley, M. T., VerHoeve, J., Henry, M., Buchman, E. V., Kane, M. P., ... &
Margolis, D. (2004). Mitochondrial signal transduction in accelerated wound and retinal
healing by near-infrared light therapy. Mitochondrion, 4(5-6), 559-567.
Eulitz, C., Ullsperger, P., Freude, G., & Elbert, T. (1998). Mobile phones modulate response
patterns of human brain activity. Neuroreport, 9(14), 3229-3232.

52
Fijalkowski, K., Nawrotek, P., Struk, M., Kordas, M., & Rakoczy, R. (2013). The effects of
rotating magnetic field on growth rate, cell metabolic activity and biofilm formation by
Staphylococcus aureus and Escherichia coli. Journal of Magnetics, 18(3), 289-296.
Fijałkowski, K., Nawrotek, P., Struk, M., Kordas, M., & Rakoczy, R. (2015). Effects of rotating
magnetic field exposure on the functional parameters of different species of
bacteria. Electromagnetic biology and medicine, 34(1), 48-55.
Fleming, J. L., Persinger, M. A., & Koren, S. A. (1994). Magnetic pulses elevate nociceptive
thresholds: Comparisons with opiate receptor compounds in normal and seizure-induced brain-
damaged rats. Electro-and Magnetobiology, 13(1), 67-75.
Folta, K. M., & Childers, K. S. (2008). Light as a growth regulator: Controlling plant biology
with narrow-bandwidth solid-state lighting systems. HortScience, 43(7), 1957-1964.
Fomichjova, V. M. (1992). Proliferation activity and cell reproduction in meristems of root
seedlings of pea, flax and lentil under conditions of shielding the geomagnetic
field. Biofizika, 37, 745-749.
Fournier, N. M., & Persinger, M. A. (2004). The neuromatrix and the epileptic brain:
behavioral and learning preservation in limbic epileptic rats treated with ketamine but not
acepromazine. Epilepsy & Behavior, 5(1), 119-127.

53
Fournier, N. M., Mach, Q. H., Whissell, P. D., & Persinger, M. A. (2012). Neurodevelopmental
anomalies of the hippocampus in rats exposed to weak intensity complex magnetic fields
throughout gestation. International Journal of Developmental Neuroscience, 30(6), 427-433.
Friedman, H., Becker, R. O., & Bachman, C. H. (1967). Effect of magnetic fields on reaction
time performance. Nature, 213(5079), 949-950.
Freude, G., Ullsperger, P., Eggert, S., & Ruppe, I. (1998). Effects of microwaves emitted by
cellular phones on human slow brain potentials. Bioelectromagnetics: Journal of the
Bioelectromagnetics Society, The Society for Physical Regulation in Biology and Medicine,
The European Bioelectromagnetics Association, 19(6), 384-387.
Freude, G., Ullsperger, P., Eggert, S., & Ruppe, I. (2000). Microwaves emitted by cellular
telephones affect human slow brain potentials. European journal of applied physiology, 81(1-
2), 18-27.
Fuller, M., Dobson, J., Wieser, H. G., & Moser, S. (1995). On the sensitivity of the human
brain to magnetic fields: evocation of epileptiform activity. Brain research bulletin, 36(2),
155-159.
Gaetz, M. (2004). The neurophysiology of brain injury. Clinical neurophysiology, 115(1), 4-
18.
Geinisman, Y. (2000). Structural synaptic modifications associated with hippocampal LTP and
behavioral learning. Cerebral Cortex, 10(10), 952-962.

54
Glover, P. M., Cavin, I., Qian, W., Bowtell, R., & Gowland, P. A. (2007). Magnetic‐field‐
induced vertigo: a theoretical and experimental investigation. Bioelectromagnetics: Journal of
the Bioelectromagnetics Society, The Society for Physical Regulation in Biology and Medicine,
The European Bioelectromagnetics Association, 28(5), 349-361.
Golant, M. B., Kuznetsov, A. P., & Bozhanova, T. P. (1994). The mechanism of synchronizing
yeast cell cultures with EHF-radiation. Biofizika, 39(3), 490-495.
Goodman R, Blank M. 1998. Magnetic field stress induces expression of hsp70. Cell Stress
Chap 3:74–88.
Govorun, R. D. (1992). Influence of geomagnetic field fluctuations and its shielding on early
periods of higher plant germination. Biofizika, 37, 738-744.
Gnevyshev MN, Novikova KF, Ol' AI, Tokareva NV. 1982. Instantaneous death at
cardiovascular disease and solar activity. In: Problems of solar-biospheric connections.
Novosibirsk. p 179-187.
Grundler, W., Keilmann, F., & Fröhlich, H. (1977). Resonant growth rate response of yeast
cells irradiated by weak microwaves. Physics letters A, 62(6), 463-466.
Grundler, W., Keilmann, F., Putterlik, V., & Strube, D. (1982). Resonant-like dependence of
yeast growth rate on microwave frequencies. The British journal of cancer. Supplement, 5, 206.

55
Grundler, W., Jentzsch, U., Keilmann, F., & Putterlik, V. (1988). Resonant cellular effects of
low intensity microwaves. In Biological coherence and response to external stimuli (pp. 65-
85). Springer, Berlin, Heidelberg.
Gubkina, E. A., Kushnir, A. E., Bereziuk, S. K., Potapov, V. A., & Lepekhin, E. A. (1996).
Effects of low-intensity electromagnetic radiation of extremely high-frequency on the animal
organism in combination with whole-body low-dose X-ray irradiation. Radiats Biol
Radioecol, 36, 722-726.
Gurwitsch, A. G., & Gurwitsch, L. D. (1959). Mito-genetic radiation. Mito-genetic radiation.
Gurwitsch, A. A. (1988). A historical review of the problem of mitogenetic
radiation. Experientia, 44(7), 545-550.
Ivaschuk, O. I., Jones, R. A., Ishida‐Jones, T., Haggren, W., Adey, W. R., & Phillips, J. L.
(1997). Exposure of nerve growth factor‐treated PC-12 rat pheochromocytoma cells to a
modulated radiofrequency field at 836.55 MHz: Effects on c‐jun and c‐fos
expression. Bioelectromagnetics: Journal of the Bioelectromagnetics Society, The Society for
Physical Regulation in Biology and Medicine, The European Bioelectromagnetics
Association, 18(3), 223-229.
Ji, W., Huang, H., Deng, A., & Pan, C. (2009). Effects of static magnetic fields on Escherichia
coli. Micron, 40(8), 894-898.

56
Jin, M., Lin, H., Han, L., Opler, M., Maurer, S., Blank, M., & Goodman, R. (1997). Biological
and technical variables in myc expression in HL60 cells exposed to 60 Hz electromagnetic
fields. Bioelectrochemistry and Bioenergetics, 44(1), 111-120.
Kato, M., Honma, K. I., Shigemitsu, T., & Shiga, Y. (1993). Effects of exposure to a circularly
polarized 50‐Hz magnetic field on plasma and pineal melatonin levels in
rats. Bioelectromagnetics, 14(2), 97-106.
Karbowski, L. M., Murugan, N. J., & Persinger, M. A. (2016). Experimental evidence that
specific photon energies are “stored” in malignant cells for an hour: the synergism of weak
magnetic field-LED wavelength pulses. Biology and Medicine, 8(1), 1.
Kavaliers, M., Ossenkopp, K. P., & Hirst, M. (1984). Magnetic fields abolish the enhanced
nocturnal analgesic response to morphine in mice. Physiology & Behavior, 32(2), 261-264.
Kavaliers, M., & Ossenkopp, K. P. (1985). Exposure to rotating magnetic fields alters
morphine-induced behavioral responses in two strains of mice. Neuropharmacology, 24(4),
337-340.
Kavaliers, M., & Ossenkopp, K. P. (1986). Stress-induced opioid analgesia and activity in
mice: inhibitory influences of exposure to magnetic fields. Psychopharmacology, 89(4), 440-
443.
Kavaliers, Martin, and Klaus-Peter Ossenkopp. "Calcium channel involvement in magnetic
field inhibition of morphine-induced analgesia." Naunyn-Schmiedeberg's archives of
pharmacology 336, no. 3 (1987): 308-315.

57
Kaznacheev VP, Mikhajlova LP. 1985. Extra weak irradiation in cellular interactions.
Novosibirsk: Nauka (Science).
Kaznacheev VP, Mikhajlova LP, Ivanova MP, Zajtsev YuA, Kharina NI. 1989. Growth and
behavior of the cell monolayer in the hypomagnetic field. In: Gnevyshev MN, Ol' AI, editors.
Problems of cosmic biology, Vol 65, Biophysical and clinical aspects of heliobiology.
Leningrad: Nauka (Science). p 189-195.
Kholodov, I. A. (1967). The effect of electromagnetic and magnetic fields on the central
nervous system (Vol. 459). National Aeronautics and Space Administration.
Kholodov, J. A., Alexandrovskaya, M. M., Lukjanova, S. N., & Udarova, N. S. (1969).
Investigations of the reactions of mammalian brain to static magnetic fields. In Biological
effects of magnetic fields (pp. 215-225). Springer, Boston, MA.
Kholodov, Y. A. (1975). Reactions of the nervous system to electromagnetic fields.
Kholodov, Y. A., & Shishlo, M. A. (1979). Electromagnetic fields in
neurophysiology. Moscow: Science, 168.
Kinoshameg, S. A., & Persinger, M. A. (2004). Suppression of experimental allergic
encephalomyelitis in rats by 50-nT, 7-Hz amplitude-modulated nocturnal magnetic fields
depends on when after inoculation the fields are applied. Neuroscience letters, 370(2-3), 166-
170.

58
Kirschvink JL, Jones DS, McFadden BJ, editors. 1985. Magnetite biomineralization and
magnetoreception in organisms. A new biomagnetism. New York and London: Plenum Press
Koivisto, M., Revonsuo, A., Krause, C., Haarala, C., Sillanmäki, L., Laine, M., &
Hämäläinen, H. (2000a). Effects of 902 MHz electromagnetic field emitted by cellular
telephones on response times in humans. Neuroreport, 11(2), 413-415.
Koivisto, M., Krause, C. M., Revonsuo, A., Laine, M., & Hämäläinen, H. (2000b). The effects
of electromagnetic field emitted by GSM phones on working memory. Neuroreport, 11(8),
1641-1643.
Koivisto, M., Haarala, C., Krause, C. M., Revonsuo, A., Laine, M., & Hämäläinen, H. (2001).
GSM phone signal does not produce subjective symptoms. Bioelectromagnetics: Journal of
the Bioelectromagnetics Society, The Society for Physical Regulation in Biology and Medicine,
The European Bioelectromagnetics Association, 22(3), 212-215.
Kolosova, L. I., Akoev, G. N., Avelev, V. D., Riabchikova, O. V., & Babu, K. S. (1996). Effect
of low‐intensity millimeter wave electromagnetic radiation on regeneration of the sciatic nerve
in rats. Bioelectromagnetics: Journal of the Bioelectromagnetics Society, The Society for
Physical Regulation in Biology and Medicine, The European Bioelectromagnetics
Association, 17(1), 44-47.
König, H. L. (1962). Ueber den Einfluss besonders niederfrequenter elektrischer Vorgaenge in
der Atmosphäre auf die Umwelt. Z. angew. Валет,-и. Klimaheilk, 9, 481-501.

59
Koren, S. A., & Persinger, M. A. (2002). Possible disruption of remote viewing by complex
weak magnetic fields around the stimulus site and the possibility of accessing real phase space:
A pilot study. Perceptual and Motor Skills, 95(3), 989-998.
Kotani H, Kawaguchi H, Shimoaka T, Iwasaka M, Ueno S, Ozawa H et al (2002) Strong
static magnetic field stimulates bone formation to a definite orientation in vitro. J Bone Miner
Res 17:1814–1821 doi: 10.1359/jbmr.2002.17.10.1814
Krause, C. M., Sillanmäki, L., Koivisto, M., Häggqvist, A., Saarela, C., Revonsuo, A., ... &
Hämäläinen, H. (2000a). Effects of electromagnetic field emitted by cellular phones on the
EEG during a memory task. Neuroreport, 11(4), 761-764.
M. Krause, L. Sillanmäki, M. Koivisto, A. Häggqvist, C. Saarela, A. Revonsuo, M. Laine, H.
Hämäläinen, C. (2000b). Effects of electromagnetic fields emitted by cellular phones on the
electroencephalogram during a visual working memory task. International Journal of
Radiation Biology, 76(12), 1659-1667.
Kremer, F., Santo, L., Poglitsch, A., Koschnitzke, C., Behrens, H., & Genzel, L. (1988). The
influence of low intensity millimetre waves on biological systems. In Biological coherence and
response to external stimuli (pp. 86-101). Springer, Berlin, Heidelberg.
Kuzmanova, M., & St, I. (1995, April). Effect of millimeter waves and gamma-radiation on
the surface electrical charge of erythrocyte membranes. In Millimeter Waves in Medicine and

60
Biology,” Digest of papers of the 10th Russian Symposium with International
Participation (pp. 24-26).
Lazar, M., & Barca, C. (1969). Influence of electromagnetic field of small intensity and of the
homogenous field of large intensity on the ions of chicken tissue. An. Stiint. Univ. Al. I Cuza
Iasi. Sea. II Biol, 15, 1-7.
Lednev, V. V., Srebnitskaya, L. K., Ilyasova, E. N., Rogdestvenskaya, Z. E., Klimov, A. A.,
Belova, N. A., & Kiras, K. P. (1996). Magnetic parametric resonance in biosystems:
Experimental verification of the theoretical predictions with the use of regenerating planarians
Dugesia tigrina as a test-system. Biofizika, 41(4), 815-825.
Leesungbok, R., Ahn, S. J., Lee, S. W., Park, G. H., Kang, J. S., & Choi, J. J. (2013). The
effects of a static magnetic field on bone formation around a sandblasted, large-grit, acid-
etched–treated titanium implant. Journal of Oral Implantology, 39(s1), 248-255.
Levina, M. Z., Veselago, I. A., Belaya, T. I., Gapochka, L. D., Mantrova, G. M., & Yakovleva,
M. N. (1989). Influence of low-intensity VHF irradiation on growth and development of
protozoa cultures. Millimeter Waves in Medicine and Biology.” Moscow: Radioelectronica,
189-195.
Liburdy, R. P. (1992). Calcium signaling in lymphocytes and ELF fields evidence for an
electric field metric and a site of interaction involving the calcium ion channel. FEBS
letters, 301(1), 53-59.

61
Liburdy, R. P., Callahan, D. E., Harland, J., Dunham, E., Sloma, T. R., & Yaswen, P. (1993).
Experimental evidence for 60 Hz magnetic fields operating through the signal transduction
cascade: effects on calcium influx and c-MYC mRNA induction. FEBS letters, 334(3), 301-
308.
Lin, H., Goodman, R., & Shirley‐Henderson, A. (1994). Specific region of the c‐myc promoter
is responsive to electric and magnetic fields. Journal of Cellular Biochemistry, 54(3), 281-288.
Lin, H., & Goodman, R. (1995). Electric and magnetic noise blocks the 60 Hz magnetic field
enhancement of steady state c-myc transcript levels in human leukemia
cells. Bioelectrochemistry and Bioenergetics, 36(1), 33-37.
Lin, H., Blank, M., Jin, M., & Goodman, R. (1996). Electromagnetic field stimulation of
biosynthesis: changes in c-myc transcript levels during continuous and intermittent
exposures. Bioelectrochemistry and bioenergetics, 39(2), 215-220.
Ludwig, H. W., Mecke, R., and Seelewind, H. (1968). Elektroklimatologie. Arch. Meteorol.,
Geophys. Bioklimatol
Luk'janova SN. 1969. Analysis of reactions of the central nervous system to the static magnetic
field. Author's abstract of Candidate. Dissertation. Moscow.
Mach, Quoc Hao, and Michael A. Persinger. "Behavioral changes with brief exposures to weak
magnetic fields patterned to stimulate long-term potentiation." Brain research 1261 (2009):
45-53.

62
Mahmoudi, A., Shojaeifard, M. B., Nematollahii, S., Mortazavi, S. M. J., & Mehdizadeh, A.
R. (2018). Effect of Microwave Wi-Fi Radiation at Frequency of 2.4 GHz on Epileptic
Behavior of Rats. Journal of biomedical physics & engineering, 8(2), 185.
Martin, L. J., & Persinger, M. A. (2003). Spatial heterogeneity not homogeneity of the
magnetic field during exposures to complex frequency-modulated patterns facilitates
analgesia. Perceptual and motor skills, 96(3), 1005-1012.
Martin, L. J., & Persinger, M. A. (2004). Thermal analgesia induced by 30-min exposure to 1
μT burst-firing magnetic fields is strongly enhanced in a dose-dependent manner by the α2
agonist clonidine in rats. Neuroscience letters, 366(2), 226-229.
Martin, L. J., Koren, S. A., & Persinger, M. A. (2004a). Influence of a complex magnetic field
application in rats upon thermal nociceptive thresholds: The importance of polarity and
timing. International Journal of Neuroscience, 114(10), 1259-1276.
Martin, L. J., Koren, S. A., & Persinger, M. A. (2004b). Thermal analgesic effects from weak,
complex magnetic fields and pharmacological interactions. Pharmacology Biochemistry and
Behavior, 78(2), 217-227.
Martin, L. J., S. A. Koren, and M. A. Persinger. "Thermal analgesic effects from weak, complex
magnetic fields: critical parameters." Electromagnetic biology and medicine 24, no. 2 (2005):
65-85.

63
Martin, L. J., and M. A. Persinger. "The influence of various pharmacological agents on the
analgesia induced by an applied complex magnetic field treatment: a receptor system
potpourri." Electromagnetic Biology and Medicine 24, no. 2 (2005): 87-97.
Masoumipoor, M., Jameie, S. B., Janzadeh, A., Nasirinezhad, F., Kerdari, M., & Soleimani,
M. (2014). Effects of 660 nm low level laser therapy on neuropathic pain relief following
chronic constriction injury in rat sciatic nerve. Archives of Neuroscience, 1(2), 76-81.
McFadden, J. (2013). The CEMI field theory closing the loop. Journal of Consciousness
Studies, 20(1-2), 153-168.
McKay, B. E., & Persinger, M. A. (2000). Application timing of complex magnetic fields
delineates windows of posttraining-pretesting vulnerability for spatial and motivational
behaviors in rats. International Journal of Neuroscience, 103(1-4), 69-77.
McKay, B. E., Persinger, M. A., & Koren, S. A. (2000). Exposure to a theta-burst patterned
magnetic field impairs memory acquisition and consolidation for contextual but not discrete
conditioned fear in rats. Neuroscience Letters, 292(2), 99-102.
McKay, B. E., & Persinger, M. A. (2003). Combined effects of complex magnetic fields and
agmatine for contextual fear learning deficits in rats. Life sciences, 72(22), 2489-2498.
McKay, B. E., & Persinger, M. A. (2004). Normal spatial and contextual learning for ketamine-
treated rats in the pilocarpine epilepsy model. Pharmacology Biochemistry and
Behavior, 78(1), 111-119.

64
McKay, B. E., & Persinger, M. A. (2005). Complex magnetic fields enable static magnetic
field cue use for rats in radial maze tasks. International journal of neuroscience, 115(5), 625-
648.
McKay, B. E., & Persinger, M. A. (2006). Weak, physiologically patterned magnetic fields do
not affect maze performance in normal rats, but disrupt seized rats normalized with ketamine:
Possible support for a neuromatrix concept?. Epilepsy & Behavior, 8(1), 137-144.
Meli, S. C., & Persinger, M. A. (2009). Red light facilitates the sensed presence elicited by
application of weak, burst-firing magnetic fields over the temporal lobes. International
Journal of Neuroscience, 119(1), 68-75.
Mudrick, D. G., Golant, M. B., Izvol'skaia, V. E., Slutzkii, E. M., & Oganezova, R. A. (1995).
Chemoluminescence of human blood leukocytes after exposure to a low-intensity extremely-
high frequency electromagnetic field. In Moscow, Russia: 10th Russian Symposium
“Millimeter Waves in Medicine and Biology,” April (pp. 109-111).
Mulligan, S., & Persinger, M. A. (1998). Perinatal exposures to rotating magnetic
fieldsdemasculinize'neuronal density in the medial preoptic nucleus of male rats. Neuroscience
letters, 253(1), 29-32.
Mulligan, B. P., Hunter, M. D., & Persinger, M. A. (2010). Effects of geomagnetic activity and
atmospheric power variations on quantitative measures of brain activity: replication of the
Azerbaijani studies. Advances in Space Research, 45(7), 940-948.

65
Mulligan, B. P., & Persinger, M. A. (2012). Experimental simulation of the effects of sudden
increases in geomagnetic activity upon quantitative measures of human brain activity:
validation of correlational studies. Neuroscience Letters, 516(1), 54-56.
Mulligan, B. P., Gang, N., Parker, G. H., & Persinger, M. A. (2012). Magnetic field
intensity/melatonin-molarity interactions: Experimental support with planarian (Dugesia sp.)
activity for a resonance-like process. Open Journal of Biophysics, 2(04), 137.
Muniz JB, Marcelino M, da Motta M, Schuler A, da Motta MA. Influence of static magnetic
fields on S-cerevisae biomass growth. Braz Arch Biol Technol. 2007; 50:515–20.
Murugan, Nirosha J., Lukasz M. Karbowski, Robert M. Lafrenie, and Michael A. Persinger.
"Temporally-patterned magnetic fields induce complete fragmentation in planaria." PloS
one 8, no. 4 (2013): e61714.
Murugan, N. J., Karbowski, L. M., & Persinger, M. A. (2014a). Serial pH increments (~ 20 to
40 milliseconds) in water during exposures to weak, physiologically patterned magnetic fields:
implications for consciousness. Water, 6, 45-60.
Murugan, N. J., Karbowski, L. M., & Persinger, M. A. (2014b). Weak burst-firing magnetic
fields that produce analgesia equivalent to morphine do not initiate activation of proliferation
pathways in human breast cells in culture. Integrative Cancer Science and Therapeutics, 1(3),
47-50.

66
Murugan, N. J., Karbowski, L. M., & Persinger, M. A. (2017). Synergistic interactions between
temporal coupling of complex light and magnetic pulses upon melanoma cell proliferation and
planarian regeneration. Electromagnetic biology and medicine, 36(2), 141-148.
NEAGA, N., and LAZAR, M., Histological changes in the thyroids of chicks after treatment
with a pulsing magnetic field. Stud. Cevoet. Biol. Ser. Zool., 24, 119–124.
Olcese, J., & Reuss, S. (1986). Magnetic field effects on pineal gland melatonin synthesis:
comparative studies on albino and pigmented rodents. Brain research, 369(1-2), 365-368.
Ossenkopp, K. P., Koltek, W. T., & Persinger, M. A. (1972). Prenatal exposure to an extremely
low frequency‐low intensity rotating magnetic field and increases in thyroid and testicle weight
in rats. Developmental Psychobiology: The Journal of the International Society for
Developmental Psychobiology, 5(3), 275-285.
Ossenkopp, K. P., & Barbeito, R. (1978). Bird orientation and the geomagnetic field: A
review. Neuroscience & Biobehavioral Reviews, 2(4), 255-270.
Ossenkopp, K. P., Kavaliers, M., & Hirst, M. (1983). Reduced nocturnal morphine analgesia
in mice following a geomagnetic disturbance. Neuroscience letters, 40(3), 321-325.
Ossenkopp, K. P., & Kavaliers, M. (1987). Morphine-induced analgesia and exposure to low-
intensity 60-Hz magnetic fields: inhibition of nocturnal analgesia in mice is a function of
magnetic field intensity. Brain Research, 418(2), 356-360.

67
Ossenkopp, K. P., & Shapiro, L. J. (1972, January). EFFECTS OF PRENATAL EXPOSURE
TO A 0.5 HZ LOW-INTENSITY ROTATING MAGNETIC-FIELD ON WHITE PEKING
DUCKLINGS. In AMERICAN ZOOLOGIST (Vol. 12, No. 4, pp. 650-650). 1313 DOLLEY
MADISON BLVD, NO 402, MCLEAN, VA 22101 USA: SOC INTEGRATIVE
COMPARATIVE BIOLOGY.
Persinger, M. A., Glavin, G. B., & Ossenkopp, K. P. (1972). Physiological changes in adult
rats exposed to an ELF rotating magnetic field. International journal of biometeorology, 16(2),
163-172.
Papathanasopoulos, P., Preka-Papadema, P., Gkotsinas, A., Dimisianos, N., Hillaris, A.,
Katsavrias, C., ... & Papachristou, P. (2016). The possible effects of the solar and geomagnetic
activity on multiple sclerosis. Clinical neurology and neurosurgery, 146, 82-89.
Persinger, M. A., & Pear, J. J. (1972). Prenatal exposure to an ELF‐rotating magnetic field and
subsequent increase in conditioned suppression. Developmental Psychobiology: The Journal
of the International Society for Developmental Psychobiology, 5(3), 269-274.
Persinger, M. A., & Psych, C. (1995a). Sudden unexpected death in epileptics following
sudden, intense, increases in geomagnetic activity: prevalence of effect and potential
mechanisms. International Journal of Biometeorology, 38(4), 180-187.
Persinger, M. A. (1995b). Out-of-body-like experiences are more probable in people with
elevated complex partial epileptic-like signs during periods of enhanced geomagnetic activity:
a nonlinear effect. Perceptual and Motor Skills, 80(2), 563-569.

68
Persinger, M. A. (1996). Enhancement of limbic seizures by nocturnal application of
experimental magnetic fields that simulate the magnitude and morphology of increases in
geomagnetic activity. International journal of neuroscience, 86(3-4), 271-280.
Persinger, M. A., & Belanger-Chellew, G. (1999). Facilitation of seizures in limbic epileptic
rats by complex 1 microTesla magnetic fields. Perceptual and motor skills, 89(2), 486-492.
Persinger, M. A. (2003). The sensed presence within experimental settings: implications for
the male and female concept of self. The Journal of Psychology, 137(1), 5-16.
Persinger, M. A., Koren, S. A., & Tsang, E. W. (2003). Enhanced power within a specific band
of theta activity in one person while another receives circumcerebral pulsed magnetic fields: a
mechanism for cognitive influence at a distance?. Perceptual and Motor Skills, 97(3), 877-894.
Persinger, M. A. (2006). A potential multiple resonance mechanism by that weak magnetic
fields affect molecules and medical problems: the example of melatonin and experimental
“multiple sclerosis”. Medical hypotheses, 66(4), 811-815.
Persinger, M. A., & Dotta, B. T. (2011). A transient but protracted geomagnetic anomaly in
the Sudbury Basin following two near-contiguous intense geomagnetic storms. International
Journal of Geosciences, 2(03), 363.
Persinger, M. A., & Koren, S. A. (2016). The Aharanov-Bohm phase shift and magnetic vector
potential “A” could accommodate for optical coupler, digital-to-analogue magnetic field

69
excess correlations of photon emissions within living aqueous systems. Journal: JOURNAL
OF ADVANCES IN PHYSICS, 11(5).
Pelyhe I, Meszaros I, Sarvari E (1973): Effect of static magnetic field on the establishment of
conditioned electrodefensive reflex in the rat. Acta Physiol Acad Sci Hung 43:125-132.
Phillips JL, Haggren W, Thomas WJ, Ishida-Jones T, Adey WR. 1992. Magnetic field induced
changes in specific gene transcription. Biochim Biophys Acta 1132:140–144.
Piacentini, R., Ripoli, C., Mezzogori, D., Azzena, G. B., & Grassi, C. (2008). Extremely low‐
frequency electromagnetic fields promote in vitro neurogenesis via upregulation of Cav1‐
channel activity. Journal of cellular physiology, 215(1), 129-139.
Podkolzin, A. A., & Dontsov, V. I. (1994). Immunomodulating action of weak magnetic fields
on formation of antibodies in mice. Bjulleten'Experimental'noj Biologii i Meditsiny (Bulletin
of experimental biology and medicine), 117, 482-483.
Podkovkin VG. 1995. Response of hormonal and mediator regulation systems to the weak
geomagnetic field after the ionizing radiation action. Radiatsionnaja Biologija. Radioekologija
(Radiation Biology. Radioecology) 35:906-909.
Popp, F. A., Li, K. H., Mei, W. P., Galle, M., & Neurohr, R. (1988). Physical aspects of
biophotons. Experientia, 44(7), 576-585.
Popp, F. A. (2003a). Properties of biophotons and their theoretical implications.

70
Popp, F. A. (2003b). Biophotons—background, experimental results, theoretical approach and
applications. In Integrative biophysics (pp. 387-438). Springer, Dordrecht.
Porumb, S. (1971). The influence of an electromagnetic field on glucose-6-phosphate
dehydrogenase activity in rabbit red blood cells. Stud. Cerc. Biol. Ser. Zool., 23, 239-242.
Preece, A. W. (1999). Effect of a 915-MHz simulated mobile phone signal on cognitive
function in man. International journal of radiation biology, 75(4), 447-456.
Rao S, Henderson AS. 1996. Regulation of c-fos is affected by electromagnetic fields. J Cell
Biochem 63:358–365.
Reille, A. (1968). Essai de mise en évidence d'une sensibilité du pigeon au champ magnétique
à l'aide d'un conditionnement nociceptif. J. Physiol.(Paris), 60, 85-92.
Reiter, R. (1964). Atmospheric electricity and natural radioactivity. Medical climatology. New
York: Waverly, 280-316.
Regoli, F., Gorbi, S., Machella, N., Tedesco, S., Benedetti, M., Bocchetti, R., ... & Principato,
G. (2005). Pro-oxidant effects of extremely low frequency electromagnetic fields in the land
snail Helix aspersa. Free Radical Biology and Medicine, 39(12), 1620-1628.
Resch, J. (1995). Geographic distribution of multiple sclerosis and comparison with
geophysical values. Sozial-und Praventivmedizin, 40(3), 161-171.

71
Richards, M. A., Koren, S. A., & Persinger, M. A. (2002). Circumcerebral application of weak
complex magnetic fields with derivatives and changes in electroencephalographic power
spectra within the theta range: implications for states of consciousness. Perceptual and Motor
Skills, 95(2), 671-686.
Rojavin, M. A., & Ziskin, M. C. (1995). Effect of millimeter waves on survival of UVC‐
exposed Escherichia coli. Bioelectromagnetics, 16(3), 188-196.
Röschke, J., & Mann, K. (1997). No short‐term effects of digital mobile radio telephone on the
awake human electroencephalogram. Bioelectromagnetics: Journal of the
Bioelectromagnetics Society, The Society for Physical Regulation in Biology and Medicine,
The European Bioelectromagnetics Association, 18(2), 172-176.
Rose, G. M., David M. Diamond, K. Pang, and T. V. Dunwiddie. "Primed burst potentiation:
lasting synaptic plasticity invoked by physiologically patterned stimulation." In Synaptic
plasticity in the hippocampus, pp. 96-98. Springer, Berlin, Heidelberg, 1988.
Rudakov YaYa, Mansurov SM, Mansurova LG, Portnov AA, Poleshchuk YuI, Mazursky MB.
1984. Significance of sector structure of the interplanetary magnetic field in synchronization
of psycho-physiological regulation in human beings. In: Electromagnetic fields in biosphere:
electromagnetic fields in the earth's atmosphere and their biological significance. Moscow:
Nauka (Science), Vol 1. p 150-159.

72
Ruttan, L. A., Persinger, M. A., & Koren, S. (1990). Enhancement of temporal lobe-related
experiences during brief exposures to milligauss intensity extremely low frequency magnetic
fields. Journal of Bioelectricity, 9(1), 33-54.
Ryczko, M. C., & Persinger, M. A. (2002). Increased analgesia to thermal stimuli in rats after
brief exposures to complex pulsed 1 microTesla magnetic fields. Perceptual and motor
skills, 95(2), 592-598.
Ryabykh, T. P., & Bodrova, N. B. (1992). CORRELATION OF THE RISK OF
ONCOLOGICAL BREAST DISEASE AND SOLAR-ACTIVITY. Biofizika, 37(4), 710-715.
Samokhvalov VP. 1989. Effects of cosmic fluctuations on mental diseases. In: Gnevyshev MN,
Ol' AI, editors. Problems of Cosmic Biology, Vol 65, Biophysical and clinical aspects of
heliobiology. Leningrad: Nauka (Science). p 65-80.
Saunders, R. (2005). Static magnetic fields: animal studies. Progress in biophysics and
molecular biology, 87(2-3), 225-239.
Schimmelpfeng, J., & Dertinger, H. (1993). The action of 50 Hz magnetic and electric fields
upon cell proliferation and cyclic AMP content of cultured mammalian
cells. Bioelectrochemistry and bioenergetics, 30, 143-150.
Servantie, B., Servantie, A. M., & Etienne, J. (1975). Synchronization of cortical neurons by a
pulsed microwave field as evidenced by spectral analysis of electrocorticograms from the white
rat. Annals of the New York Academy of Sciences, 247(1), 82-86.

73
Shestopalova, N. G., Makarenko, B. I., Golovina, L. N., Timoshenko YuP, B. T., Vinokurova,
L., & Miroshnichenko, V. (1995, April). Modification of synchronizing effect of millimeter
waves on first mitoses by different temperature regimens of germination. In 10th Russian
Symposium Millimeter Waves in Medicine and Biology, IRE RAN, Moscow, Russia (pp. 236-
237).
Shibab, K., Brock, M., Gosztonyi, G., Erne, S. E., Hahlbohm, H. D., & Schoknecht, G. (1987).
The geomagnetic field: a factor in cellular interactions. Neurological Research, 9, 225-235.
Shpil'berg PI, Vjalov AM. (1972). EEG changes at rhythmic light ¯ashes in the human persons
subjected to action of magnetic fields during the production process. In: Clinics and problems
of examination of ability to work at diseases caused by physical factors. Moscow. p 116-124.
Shuvalova, L. A., Ostrovskaia, M. V., Sosunov, E. A., & Lednev, V. V. (1991). The effect of
a weak magnetic field in the paramagnetic resonance mode on the rate of the calmodulin-
dependent phosphorylation of myosin in solution. Doklady Akademii Nauk SSSR, 317(1), 227-
230.
Simonov, A. N., Livshits, V. A., & Kuznetsov, A. N. (1986). EFFECT OF CONSTANT
MAGNETIC-FIELDS ON THE FORMATION OF BILAYER LIPID-
MEMBRANES. Biofizika, 31(5), 777-780.
Sisken, B. F., Walker, J., & Orgel, M. (1993). Prospects on clinical applications of electrical
stimulation for nerve regeneration. Journal of cellular biochemistry, 51(4), 404-409.

74
Sisken, B. F., Jacob, J. M., & Walker, J. L. (1995). Acute treatment with pulsed electromagnetic
fields and its effect on fast axonal transport in normal and regenerating nerve. Journal of
neuroscience research, 42(5), 692-699.
St-Pierre, L. S., Parker, G. H., Bubenik, G. A., & Persinger, M. A. (2007). Enhanced mortality
of rat pups following inductions of epileptic seizures after perinatal exposures to 5 nT, 7 Hz
magnetic fields. Life Sciences, 81(21-22), 1496-1500.
Takashima, S., Onaral, B., & Schwan, H. P. (1979). Effects of modulated RF energy on the
EEG of mammalian brains. Radiation and environmental biophysics, 16(1), 15-27.
Tambiev, A. K., Kirikova, N. N., Lapshin, O. M., Betzkii, O. V., Novskova, T. A., Nechaev,
V. M., & Petrov, I. Y. (1989). The combined effect of exposure to EMF of millimeter and
centimeter wavelength ranges on productivity of microalgae. Millimeter waves in medicine and
biology. N. Devyatkov, editor, 183-188.
Tessaro, L. W., & Persinger, M. A. (2013). Optimal durations of single exposures to a
frequency‐modulated magnetic field immediately after bisection in planarian predict final
growth values. Bioelectromagnetics, 34(8), 613-617.
Tessaro, L. W., Murugan, N. J., & Persinger, M. A. (2015). Bacterial growth rates are
influenced by cellular characteristics of individual species when immersed in electromagnetic
fields. Microbiological research, 172, 26-33.

75
Tiras, K. P., Srebnitskaya, L. K., Ilyasova, E. N., Klimov, A. A., & Lednev, V. V. (1996). The
influence of weak combined magnetic field on the rate of regeneration in planarians Dugesia
tigrina. Biofizika, 41(4), 826-831.
Tsang, E. W., Koren, S. A., & Persinger, M. A. (2009). Specific patterns of weak (1
microTesla) transcerebral complex magnetic fields differentially affect depression, fatigue, and
confusion in normal volunteers. Electromagnetic biology and medicine, 28(4), 365-373.
Tsutsaeva, A. A., Makarenko, B. I., Beznosenko, B. I., Gomosov, V. I., Simonova NYa, K. L.,
Shatilova, L. E., ... & Lisenko, N. A. (1995, April). Radioprotective effect of microwave action.
Millimeter Waves in Medicine and Biology. In Digest of papers of the 10th Russian Symposium
with International Participation (pp. 24-26).
und Halbach, O. V. B. (2009). Structure and function of dendritic spines within the
hippocampus. Annals of Anatomy-Anatomischer Anzeiger, 191(6), 518-531.
Usenko UA, Derjapa UR, Kopanev CI, Panin LE. 1989. Effects of heliogeophysical factors on
some professional and physiological functions of aviation operators in Siberia. In: Gnevyshev
MN, Ol' AI, editors. Problems of cosmic biology, Vol 65, Biophysical and clinical aspects of
heliobiology. Leningrad: Nauka (Science). p 52-65.
VanWijk, R. (2001). Bio-photons and bio-communication. Journal of Scientific
Exploration, 15(2), 183-197.

76
Varró, P., Szemerszky, R., Bárdos, G., & Világi, I. (2009). Changes in synaptic efficacy and
seizure susceptibility in rat brain slices following extremely low‐frequency electromagnetic
field exposure. Bioelectromagnetics: Journal of the Bioelectromagnetics Society, The Society
for Physical Regulation in Biology and Medicine, The European Bioelectromagnetics
Association, 30(8), 631-640.
Vjalov AM. (1971). Clinical, hygienic and experimental data on the action of magnetic fields
in industrial conditions. In: Kholodov YuA, editor. Influence of magnetic fields on biological
objects. Moscow: Nauka (Science). p 165-177.
Vladimirskij, B. M., & Kislovskij, L. D. (1995). Cosmophysical periods in European
history. Biofizika, 40(4), 856-860.
Volobuev, AN., Trufanov, LA., Ovchinnikov, EL., Konstenkov, AG. (1985). Influence of static
magnetic field on the velocity of propagation of electrical pulse along the nerve fiber. In:
Nonionizing irradiation in phlebological practice. Kujbyshev. pp 79-97.
Whissell, P. D., Tsang, E. W., Mulligan, B. P., & Persinger, M. A. (2009). Prenatal exposures
to LTP-patterned magnetic fields: Quantitative effects on specific limbic structures and
acquisition of contextually conditioned fear. International Journal of Neuroscience, 119(1), 1-
14.
Wiech, K., Ploner, M., & Tracey, I. (2008). Neurocognitive aspects of pain perception. Trends
in cognitive sciences, 12(8), 306-313.

77
Wever, R. (1967). Über die Beeinflussung der circadianen Periodik des Menschen durch
schwache elektromagnetische Felder. Zeitschrift für vergleichende Physiologie, 56(2), 111-
128.
Wever, R. (1968). Einfluss schwacher elektro-magnetischer Felder auf die circadiane Periodik
des Menschen. Naturwissenschaften, 55(1), 29-32.
Wu, H. P. P., & Persinger, M. A. (2011). Increased mobility and stem-cell proliferation rate in
Dugesia tigrina induced by 880 nm light emitting diode. Journal of Photochemistry and
Photobiology B: Biology, 102(2), 156-160.
Yakovleva, M. I., & Medvedeva, M. V. (1974). Conditioned Control of Cardiac Activity and
Respiration and Morphological Changes in the Brain of Pigeons under the Action of a
Constant Magnetic Field (Uslovnoreflektornaya Regulyatsiya Serdechnoi Deyatelnosti
Dykhaniya i Morfologicheskie Izmeneniya v Golovnom Mozge Golubei pri Deistvii
Postoyannogo Magnitnogo Polya) (No. NISC-Trans-3569). NAVAL INTELLIGENCE
SUPPORT CENTER WASHINGTON DC TRANSLATION DIV.
Yeagley HL. 1947. A preliminary study of physical basis of bird navigation. J Appl Physiol
18:1035-1063.
Zaĭtseva, S. A., & Pudovkin, M. I. (1995). Effect of solar and geomagnetic activity on
population dynamics among residents of Russia. Biofizika, 40(4), 861-864.

78
Zecca L, Ferrario P, Conte GD. 1984. Activation of immune
systembypulsedmagneticfieldsafterg-rayirradiation.Bioelectrical Repair and Growth Society
(BRAGS), 1981. Transactions of the First Annual Meeting, Vol 4.
Zemskov, V. S., Korpan, N. N., Khokhlich, I. I., Pavlenko, V. A., Nazarenko, L. S.,
Koval'chuk, A. I., & Stefanishin, I. (1988). Effect of millimeter-band low intensity
electromagnetic radiation on the course of wound healing. Klin. Khir., 1, 31-33.

79
Chapter 2
2. Parameterizing the Influence of Physiologically Patterned EMF on Forskolin Induced
Pheochromocytoma Plasma Membrane Extensions
2.1 Abstract
Previous research has demonstrated the utility of pheochromocytoma (PC-12) cells as a model
for the in vitro examination and experimentation of neuritogenesis after treatment with
forskolin or nerve growth factor (NGF). Electromagnetic fields (EMFs), especially those that
have been designed to mimic biological function, have been evidenced to influence, at least
functionally, various biological systems. Here, we aimed to determine the most effective EMF
pattern, as well as other application parameters, that will optimally influence the proportion of
plasma membrane extensions in PC-12 cells treated with a cyclic adenosine monophosphate
activator (forskolin). Furthermore, we aimed to determine the biomolecular mechanism that
drives the synergism between appropriately patterned EMF and forskolin stimulation in this
cell model. Results emphasize that EMF pattern, and not intensity, as well as exposure duration
is important for maximizing the synergism between chemical treatment and EMF application.
Results demonstrated that EMF pattern, especially when that pattern mimics what naturally
occurs in the brain, reliably increases the proportion of plasma membrane extensions. Other
EMF parameters, such as exposure duration, intensity, and timing, did not appreciably alter the
proportion of cells bearing neuron-like extensions.

80
2.2. Introduction
Pheochromocytoma (PC-12) cells can be induced to produce plasma membrane extensions that
have been previously characterized to have morphological and physiological features similar
to that of peripheral neurons (Greene and Tishcler, 1976; Green and Tischler, 1982). These
cells are electrically excitable and capable of producing and secreting classical
neurotransmitters, such as dopamine and serotonin (Shafer and Artichson, 1991, Satpute et al.,
2010) making them an excellent model to investigate the mechanisms of neurogenesis and
neuronal activity.
Neurotrophic factors, such as brain-derived neurotrophic factor (BDNF) and nerve growth
factor (NGF), are quintessential for the survival and differentiation of developing and maturing
neurons. NGF treatment has been shown to produce neurite extensions in PC-12 cells with
several different biomolecular pathways identified driving this effect (Loeb et al., 1991;
Vaudry et al., 2002; Wooten et al., 1999). Caillaud and colleagues (1995) demonstrated that
forskolin, in combination with NGF and epidermal growth factor (EGF), was capable of
producing neurite extensions in PC-12 cells. Additional work by Gunning et al., (1981a;
Gunning et al., 1981b) and Ritcher-Landsberg and Jastorff (1986) showed that elevations in
cyclic adenosine monophosphate (cAMP) could mimic the plasma membrane extensions
induced by NGF treatment of PC-12 cells.
Forskolin is a diterpene isolated from the Coleus forskohlii root, that is capable of activating
adenylyl cyclase in various tissues (Seamon and Daly, 1981, Seamon and Daly, 1983, Seamon
et al., 1981). Therefore, forskolin treatment results in increased levels of cyclic-adenosine
monophosphate (cAMP) that is followed by activation of protein phosphorylation by cAMP

81
dependent proteins, most notably, PKA (Park and Kim, 1996). In addition to activating
adenylyl cyclase, forskolin can act on potassium-induced depolarization that can partially
substitute the action of NGF resulting in the promotion of neurite outgrowth (Hoshi et al.,
1988). The activity of forskolin was also shown to act on calcium channel kinetics by increasing
calcium influx by activating voltage dependent channels, but does not alter channel expression
(Bouron et al., 1999).
There are some conflicting results regarding the molecular mechanism by that forskolin
promotes neurogenesis in PC-12 cells although cAMP and ERK activity appear to be involved.
For instance, researchers were able to demonstrate that adenylyl cyclase activity led to growth
arrest and accumulation of cytoplasmic cAMP ultimately resulted in neurite production in PC-
12 cells (Deutsch and Sun, 1992; Greene and McGuire, 1978). Lazarovici et al., (1998) were
able to extend these results and observed that the production of neurites of PC-12 cells in
response to forskolin was independent of PKA activity. Contrary to these findings, Foley and
colleagues (2005) found that stimulation of ERK by forskolin depends on PKA, Rap1, and
C3G suggesting that forskolin works via PKA dependent C3G pathway to activate ERK in
these cells. In this vein, York et al., (1998) reported that cAMP elevating agents can lead to the
activation of ERKs in a Rap1-dependent fashion. Bos et al., (2003) showed that treatment with
forskolin stimulates activation of Rap1 via activation of cAMP-dependent PKA activity.
Research by Wang et al., (2006) added further evidence that forskolin activated ERK in PC-12
cells that was contingent on PKA activity. Recently, Park et al., (2012) showed that forskolin
increased dopamine synthesis by transiently phosphorylating ERK1/2, while sustained activity
of ERK1/2 resulted in neurite outgrowth. The effects described were concentration dependent.

82
cAMP modulates cell survival, proliferation, differentiation, and apoptosis through a cascade
involving PKA, ERK1/2, and CREB and this pathway is evident in PC-12 cells (Stork and
Schmidt, 2002). Dugan and colleagues (1999) and others (Stork and Schmitt, 2002; Vossler
et al., 1997), have showed that sustained activation of ERK phosphorylation by way of Rap-1,
subsequent to stimulation by PKA, with B-Raf. NGF treatment also activates prolonged, stable
activation of ERK leading to the formation of neuritic outgrowths (York et al., 1998). Park et
al (2012) demonstrated that forskolin (at discrete concentrations) was also able to prolong the
activation of ERK1/2 leading to the formation of sympathetic-like neurite extensions similar
to those observed in PC-12 cells stimulated with NGF. Ritcher-Landsberg and Jastorff (1986)
were able to demonstrate that forskolin did not act as a second messenger for NGF-induced
neurite production (Garrels and Schubert, 1979; Halegoua and Patrick, 1980; Schubert and
Whitlock, 1977; Schubert et al., 1978) but rather that the effects of forskolin and NGF were
synergistic suggesting distinct yet complimentary modes of action.
There is ample evidence to suggest the manner, and mechanism, by that cAMP activation via
forskolin stimulation can lead to plasma membrane extensions in PC-12 cells. Recently, Zhang
et al (2014) demonstrated the potential to circumnavigate direct chemical stimulation by
exposing cells to various treatments of electromagnetic field radiation (i.e., light). Under the
appropriate conditions, light was able to induce neurite extensions in the absence of NGF, that
was contingent upon the activation of Raf/MEK/ERK signalling (Zhang et al., 2014).
Our lab has previously shown that exposures to a time-varying, physiologically patterned,
propagating electromagnetic field (EMF), can affect biological systems (Whissel and
Persinger, 2007; Ross et al., 2008; Mach and Persinger, 2009; Murugan et al., 2014; Karbowski
et al., 2012). Buckner et al, (2015, 2017, 2018) demonstrated that the application of a frequency

83
modulated EMF (e.g., Thomas) is capable of reducing proliferation of B16-BL6 melanoma
cells in vivo and in vitro. Exposures to the Thomas EMF has also been shown to produce
analgesia in rats, influence the change in pH of physio-chemical reactions, is correlated with
quantitative electroencephalographic changes associated with altered states of consciousness,
affect the growth rates of bisected planaria, mediate the induction of excess correlation
between distal pairs of humans, chemiluminescent reactions, and pH deviations (Murugan et
al., 2013; Murugan et al., 2015; Dotta et al., 2014, Dotta et al., 2012; Dotta et al., 2015; Dotta
et al., 2011; Tessaro and Persinger, 2013).
Martin et al (2003, 2004, 2005a; 2005b) showed that exposure to an EMF modeled after the
burst-firing rate of a collection of amygdaloid neurons, was capable of inducing analgesia in
rats that was equivalent to 4mg/kg of morphine (Fleming et al., 1994). Burst-firing EMF was
demonstrated to ameliorate self-reported mood and depression scores in human participants
receiving weekly 1 hour treatments of 1 µT intensity for the duration of 6 weeks (Baker-Price,
2003). Murugan et al (2014) compared the metastatic potential of cancer cell cultures treated
with typical pain management therapeutics (e.g., morphine) as compared to cells receiving
treatment with the burst-firing EMF, and found that only samples receiving morphine, and not
the patterned EMF, had activated proliferation pathways. In addition, Murugan and colleagues
(2014) showed that the burst-firing EMF activated mu opioid receptors in order to elicit their
effects. Finally, Loney et al (unpublished) recently demonstrated synergisms between sub-
micromolar concentrations of forskolin and concomitant burst-firing EMF treatment on the
proportion of neurite bearing PC-12 cells. The authors noted that the effects observed were
dependent on the available concentration of forskolin with too high a concentration eliminating
burst-firing EMF effects. The aim of the following investigation is to demonstrate the specific
timing (frequency), exposure duration, intensity, pattern, and application geometry of the

84
applied burst-firing EMF that were necessary to maximize the proportion of PC-12 cells
bearing plasma membrane extensions subsequent to stimulation with sub-micromolar
concentrations of forskolin. Furthermore, we aim to identify the potential biomolecular
pathways that are activated (or inhibited) when these cells are presented with the most effective
field configuration using a pharmacological inhibitor approach.
2.3. Methods
2.3.1. Cell culturing and induction of plasma membrane extensions
Pheochromocytoma (PC-12) cells, derived from the rat adrenal medulla, were grown to
confluence on 100-mm stock plates supplemented with standard growth media (85% RMPI-
1640, 10% horse serum, 5% fetal bovine serum, 1% antibiotic and antimycotic; v/v
equivalents). 50 µL of the cell suspension were inoculated on poly-L-lysine-treated, 35-mm
cell culture dishes and allowed to adhere to plates for 24 hours in a standard incubator at
standard conditions (37ºC, 95% O2, 5% CO2). After appropriate adhesion, growth media was
removed and cells were supplemented with 2 mL of serum-free media (RMPI-1640 with 0.5%
antibiotic and antimycotic). Cultures were then placed in the exposure incubator, operating at
standard conditions, that contained the EMF exposure equipment. Cells were treated with 1 µL
of forskolin (final concentration: 0.5 µM) at ten minutes during their respective exposure
conditions.
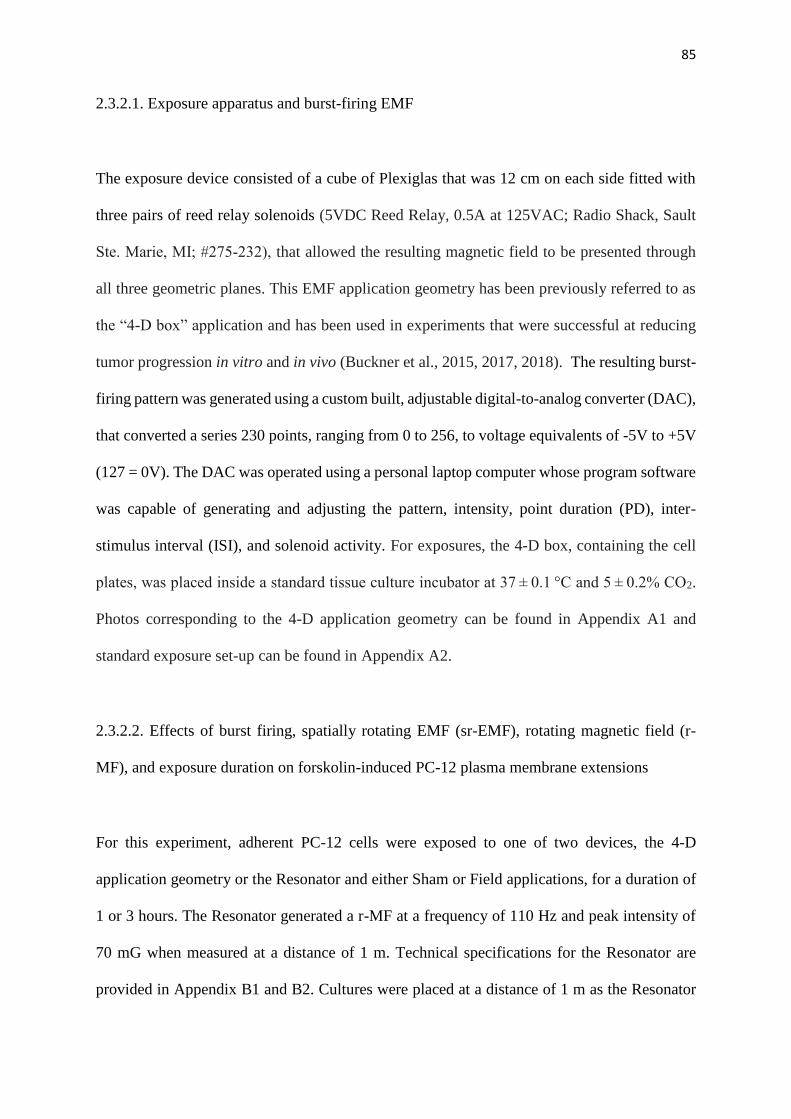
85
2.3.2.1. Exposure apparatus and burst-firing EMF
The exposure device consisted of a cube of Plexiglas that was 12 cm on each side fitted with
three pairs of reed relay solenoids (5VDC Reed Relay, 0.5A at 125VAC; Radio Shack, Sault
Ste. Marie, MI; #275‐232), that allowed the resulting magnetic field to be presented through
all three geometric planes. This EMF application geometry has been previously referred to as
the “4-D box” application and has been used in experiments that were successful at reducing
tumor progression in vitro and in vivo (Buckner et al., 2015, 2017, 2018). The resulting burst-
firing pattern was generated using a custom built, adjustable digital-to-analog converter (DAC),
that converted a series 230 points, ranging from 0 to 256, to voltage equivalents of -5V to +5V
(127 = 0V). The DAC was operated using a personal laptop computer whose program software
was capable of generating and adjusting the pattern, intensity, point duration (PD), inter-
stimulus interval (ISI), and solenoid activity. For exposures, the 4-D box, containing the cell
plates, was placed inside a standard tissue culture incubator at 37 ± 0.1 °C and 5 ± 0.2% CO2.
Photos corresponding to the 4-D application geometry can be found in Appendix A1 and
standard exposure set-up can be found in Appendix A2.
2.3.2.2. Effects of burst firing, spatially rotating EMF (sr-EMF), rotating magnetic field (r-
MF), and exposure duration on forskolin-induced PC-12 plasma membrane extensions
For this experiment, adherent PC-12 cells were exposed to one of two devices, the 4-D
application geometry or the Resonator and either Sham or Field applications, for a duration of
1 or 3 hours. The Resonator generated a r-MF at a frequency of 110 Hz and peak intensity of
70 mG when measured at a distance of 1 m. Technical specifications for the Resonator are
provided in Appendix B1 and B2. Cultures were placed at a distance of 1 m as the Resonator

86
generated physical vibrations in the exposure room that were attenuated to background
displacements at 1 m. Sham applications for the 4-D application geometry consisted of
uploading the target EMF pattern and placing cells in the exposure device, but no current was
passed through the solenoids of the 4-D box. Field applications consisted of simultaneously
presenting the burst-firing pattern (PD = 3 msec, ISI = 3 msec) through opposing pairs of
solenoids and was rotated along all three spatial axes every 500 msec followed by the
simultaneous activation of all three planes for 500 msec. The intensity of the burst-firing EMF
was measured to be between 20 and 40 mG (2 – 4 uT) using an AC milliGauss meter
(AlphaLabs). The presence of the pattern was verified using a mini-audio amplifier coupled to
a magnetic telephone pick-up. Sham applications of the r-MF generating device (Resonator)
consisted of plugging the device into the 120 VAC outlet and turning its cooling fan on. Active
field exposures consisted of turning the engine that turned a series of static magnets at a rate of
110 Hz. The r-MF generated from the Resonator was verified by way of an AC milliGauss
meter (AlphaLabs). Trials were conducted such that in each condition there were N=2 plates
exposed in parallel and all replicates (N=3) were completed independently.
2.3.2.3. Determining the difference between rotational or constant application of burst-firing
EMF generated through the 4-D exposure application
The aim of this section was to differentiate the contribution of rotation or constant application
of the burst-firing EMF pattern on the ability to induce plasma membrane extensions in PC-12
cells treated with forskolin. PC-12 cells were prepared according to the procedures described
in section 2.3.1. Cells were either exposed to the burst-firing EMF (PD = 3 msec, ISI = 3 msec)
generated through all three pairs of solenoids simultaneously (constant exposure) or to the same
pattern that was simultaneously presented through opposing pairs of solenoids that was then

87
rotated along all three spatial axes every 500 msec followed by the simultaneous activation of
all three planes for 500 msec (rotation) using the 4-D exposure apparatus. The peak intensity
and duration of exposure to the burst-firing EMF for both the constant and rotational conditions
were held consistent between 20 and 40 mG (2 – 4 uT) and 1 hour respectively. The presence
and intensity of the burst-firing EMF was verified using a telephone pick-up and mini audio
amplifier and an AlphaLabs AC milliGauss meter.
2.3.2.4. The influence of point duration of burst-firing EMF on PC-12 plasma membrane
extensions
The effect of specific combinations of PD and ISI had on the proportion of PC-12 cells bearing
plasma membrane extensions was examined. The exposure apparatus, peak intensities, EMF
pattern, and spatial presentation across solenoids were the same as described in section 2.3.2.2.
There were a series of three manipulations with respect to the PD and ISI variables for the
burst-firing pattern: 1) PD = 3msec, ISI = 3 msec (positive control), 2) PD = 1, ISI = 1, and 3)
PD = 3, ISI = 3000. These combinations of PD and ISI were selected from previous
experiments conducted in our laboratory to examine the effectiveness of the burst-firing field
on thermal analgesia in rats, amelioration of psychometric measures of depression, induction
of mystical experiences in humans, and the generation of excess correlations in physio-
chemical reactions (Baker-Price, 2003;Dotta et al., 2015; Martin et al., 2004; Fleming et al.,
1994; Tsang et al., 2009; Cook and Persinger, 1997; Meli and Persinger, 2009). The duration
of exposure was 1 hour, as results from experiment 2.3.2.2 suggested that there was no
significant difference between 1 and 3-hour field applications. For each replicate, there was
N=2 plates exposed in parallel and all replicates (N = 3) were conducted independently (i.e.,
on different days). The presence and intensity of each EMF was verified using an AC

88
milliGauss meter (AlphaLabs) and mini-audio amplifier coupled to a telephone pick-up. A
diagrammatic representation of the burst-firing EMF configuration can be found in Appendix
C.
2.3.2.5. Intensity dependence of burst-firing EMF on induced plasma membrane extensions in
PC-12 cultures
PC-12 cells were sub-cultured and plated according to the methods detailed in section 2.3.1.
and then subjected to exposures in the 4-D box exposure and burst-firing pattern as outlined in
section 2.3.2.2. The PD and ISI for the burst-firing pattern used in this experiment were each
set to 3 msec respectively. Plates of PC-12 cells were exposed for a duration of 1 hour to one
of three intensities: 1) 300 – 500 nT (Low), 2) 2 – 5 µT (Medium), and 3) >10 µT (High).
Intensities were verified using an AC milliGauss meter (AlphaLabs) and the presence of the
field pattern was confirmed using a mini-audio amplifier coupled to a magnetic telephone pick-
up. Plates(N=2) were exposed in parallel and all conditions were independently replicated
(N=3).
2.3.2.6. Pattern specificity of EMF application on forskolin-induced PC-12 plasma membrane
extensions
The efficacy of the pattern of EMF application on the proportion of plasma membrane
extensions in PC-12 cells treated with nanomolar concentrations of forskolin was tested. The
exposure apparatus for this investigation consisted of the 4-D box application geometry
(section 2.3.2.2.), however there was no rotation in the pattern applied across the solenoids
(i.e., all three spatial planes were activated simultaneously). PC-12 cells were sub-cultured and

89
plated according to our standard protocols outlined in section 2.3.1, before being exposed for
a duration of 1 hour to one of the four following EMF conditions: Burst-firing EMF, Reverse
Burst-firing EMF, Thomas-EMF, and 7-Hz pulse (690 msec 7-Hz sine wave followed by a 210
msec pause). The reverse burst-firing pattern consisted of the same series of 230 points that
made up the burst-firing pattern, however the series of integers were inverted. The Thomas-
EMF was generated by converting 859 integer values between 0 and 256 to a corresponding
voltage of -5 V to +5V (127 = 0V), producing 18 doublet peaks with gradually increasing
intervals between 3 msec (for the first 5 repeats) to 120 msec for the last 5 repeats. The resulting
frequency modulation for the Thomas-EMF pattern ranged from 25 Hz for the first 5 to 6 Hz
for the last 5 repeats. For all patterned EMF applications, PD and ISI were set to 3 msec
respectively. The patterns were all exposed continuously to the cells for a duration of 1 hour,
and peak intensities were set between 2 and 4 µT. The intensity and pattern of each respective
manipulation was assessed using an AC milliGauss meter (AlphaLabs) and a magnetic
telephone pick-up coupled to a mini-audio amplifier. A series of photographic representations
of the burst-firing, reverse burst, FM-EMF, and 7 Hz sine wave patterns can be found in
Appendix D. There were N=2 plates that were exposed in parallel for each condition and all
replicates (N=3) were conducted independently.
2.3.2.7. Identifying the potential biomolecular pathway for the action of burst-firing EMF on
forskolin-induced plasma membrane extensions in PC-12 cell cultures using an inhibitor series
PC-12 cell cultures were prepared in accordance with the methods outlined in section 2.3.1.
and were exposed for the duration of 1 hour to either sham or burst-firing EMF generated
through the 4-D box application geometry. Here, the presentation of the burst-firing EMF was
presented in opposing pairs of solenoids and rotated through all three spatial planes at a

90
frequency of 2 Hz (i.e., 500 msec presentations) before being simultaneously presenting all
three planes for 500 msec. PD and ISI were set to 3 msec respectively. The intensity of the
burst-firing EMF was verified, by way of an AC milliGauss meter (AlphaLabs) and mini-audio
amplifier coupled to a telephone pick-up coil, to fall within the 3 – 5 µT range.
Inhibitors (or suspending media for controls) were injected to PC-12 plates 30 min prior to
their respective exposure conditions, maintained for the 1-hour treatment, and then the media
removed and replaced with serum-free media. Injections of 1 µL (final concentration 0.5 µM)
forskolin were added to plates at 10 minutes into their respective treatment conditions.
Following exposure, samples were removed, transported to a different room, and measures
were taken for photon emission (see section 2.3.4 for a complete methodology). After emission
was assessed, media was removed, replaced with serum free media, and inoculated with 1 µL
of forskolin (final concentration 0.5 µM) before being allowed 72 hours for differentiation and
morphological assessment. The inhibitors were used at the indicated concentrations: 50 nM
SB20219 (Sigma Chemical, Oakville, Canada), 5 µM PD98059, 14 nM bisindolylmaleimide,
10 nM wortmannin, and 36 µM H7 (Calbiochem, San Diego, CA). Plates receiving EMF or
sham exposures were conducted in blocks of 6. That is to say that each of the respective
inhibitors (5) as well as a control plate (i.e., receiving only forskolin and having its media
removed and replaced at the end of the exposure duration) were conducted in a given replicate,
and all replicates (N=7) were conducted independently.
2.3.3. Cell morphological measures
In order to assess the efficacy of our various treatments, photos (N=4 per plate) were taken 3
days after receiving EMF exposure using a phase-contrast setting on a light compound

91
microscope at 100x magnification. The total number of cells were counted for each quadrant
and summated for each plate. In addition, cells bearing plasma membrane extensions (i.e., any
observable distortion and protrusion whose origin can be traced to the cell body) were counted
and reported as a proportion of the total cell count. Additional measures included: the
proportion of cells with multipolar and higher order arborizations, number of inter-cellular
connections (i.e., synapses), and proportion of cells whose plasma membrane extensions
exceeded the diameter of the cell soma at its largest extent.
The data from investigation 2.3.2.2. suggested that there was no impact of exposure duration
on the proportion of cells displaying plasma membrane extensions, or other morphological
measures, and therefore all subsequent investigations only tested the impact of 1 hour
exposures. Furthermore, there was no observable difference in the proportion of cells
exhibiting plasma membrane extensions at days 3 and 6 following exposure. Therefore,
subsequent morphological measures for investigations 2.3.2.3 – 2.3.2.7. were taken only 3 days
after exposure.
2.3.4. Ultra-Weak Photon emission
In conjunction with morphological measures, biophoton emission data was recorded for the
experiment outlined in section 2.3.2.7. The aim was to possibly identify 1) differences in
emission spectra that were associated with specific biomolecular pathway inhibitors in
forskolin treated PC-12 cells and 2) to demonstrate a potential interaction between altered
biomolecular pathway activity in these cells when they have been treated with a patterned EMF.

92
PC-12 cells treated with specific inhibitors in the presence or absence of forskolin (see section
2.3.2.7 for summary of group construction) and either receiving 1 hour of burst-firing EMF or
Sham exposures were removed from the exposure incubator and transported to the recording
immediately following their respective EMF treatment conditions. The recording room, that
housed the measurement unit, was located approximately 3 m away from the cell culture
laboratory. A single plate was placed over the aperture of a Model DMC-0089 digital
photomultiplier tube (PMT) (SENS-TECH Sensory Technologies; SN:68569). The entire
experimental detection system was housed in a darkened wooden box, that was covered by 10
layers (8 cm) of thick cotton cloth to ensure no environmental light pollution would affect the
sensitivity of the PMT recordings. The typical dark count or background ambient recording
obtained for this PMT were in the range of 0 – 2 photon units per 20 msec (50 – 100 photons
per sec). Measurements were acquired using Sens-Tech Counter Timer software (Version 2.8,
build: 11) at a sampling rate of 50 Hz. The PMT recordings were stored on a personal laptop
computer. Each recording session consisted of a 2-min baseline (empty box) recording, before
placing the cells over the aperture of the PMT recording device and the emission measured for
another 3 x 1-min sessions. Between baseline and active cell recordings a 2-min light
adjustment period was provided to reduce the impact of environmental light pollution during
data collection. At the end of the recording period, the cells cultures were returned to the culture
lab and placed in a standard incubator for 3 days. Each recording session was conducted in
blocks (i.e., N = 1 sample for each inhibitor-forskolin and field condition) and all trials were
replicated independently (N=7).

93
2.3.5. Methods of analyses
2.3.5.1 Cell morphology:
Raw data for morphological measures were converted into a proportion of the total cells
counted (feature of interest/total cell count·100%) and were used in subsequent analyses.
Unless otherwise specified, all proportions were subjected to a one-way analysis of variance.
Subsequent Tukey’s post-hoc tests, where applicable, were employed to demonstrate that
source(s) of variance were driving the effect.
2.3.5.2 Ultra-Weak Photon Emission:
Raw emission data were imported into Excel for the calculation of the mean and standard
deviation (SD) for each of the recording phases (i.e., baseline, cell, post-baseline).
Furthermore, raw time-series data was standardized (i.e., z-transformed) and truncated between
+/-5 SD to accommodate outliers. Standardized data was then subjected to spectral analysis
yielding spectral power densities whose frequency range spanned 0 – 25 Hz in 0.01 Hz bin
increments. Spectral data as well as the means and SD for each recording phase were then
exported into SPSS for statistical analysis. The, data was grouped in 1 Hz increments (i.e., 1
Hz bin = 1.01 to 1.99) for time-series analysis. Assessment of the mean and SD of the
measurement were subjected to a MANOVA with condition [sham v. Burst (3,3)] and inhibitor
(6 levels) as between-subjects’ factors with measurement period (3 levels) as within subjects’
factors. Examination of spectral power densities for frequency patterns were also investigated
by way of MANOVA with frequency (25 levels) as within subjects’ factors. Relevant post-hoc
tests, or other manipulations are discussed in the corresponding results section.

94
2.4. Results:
2.4.1. Effect of burst-firing EMF and rotating EMF exposure duration on forskolin induced
PC-12 plasma membrane extensions
A MANOVA with device, field condition, and duration of exposure as between-subject’s
variables revealed no within-subject’s main effects or interactions for any of the morphological
features measured. A 3-way between-subject’s analysis of variance was conducted with device
(Resonator v. 4-D), duration (1 v. 3 hours) and exposure condition (Sham v. Field) as
independent variables with each of the morphological measures as dependent variables.
Results revealed a significant two-way interaction of device (Resonator v. 4-D) and exposure
condition (Sham v. Field) for the proportion of cells bearing plasma membrane extensions
(PME) only [F (1,47) = 6.25, p = .016, Ω2-est = .10]. This interaction was abolished when
examining morphological measures taken on Day 6 [F (1,47) = 0.19, p>.05]. Post-hoc one-way
analyses of variance were conducted in order to ascertain the source of the interaction and
revealed that the significant differences obtained were driven by a greater proportion of PME-
bearing cells when exposed to the 4-D burst-firing EMF and proportionally lower PME-bearing
cells exposed to the Resonator field condition. (Figure 2.4.1.1).

95
Figure 2.4.1.1: 2-way interaction of device and field condition on the proportion of PME-
bearing cells treated with 0.5 µM forskolin Error bars represent standard error of the mean
(SEM). Field produced in the 4-D condition was consisted of the burst-firing pattern (PD = 3,
ISI = 3) with a peak intensity of 40 mG and was spatially rotated across all three axes at an
interval of 2 Hz. Frequency of the Resonator was verified to be 110 Hz and the peak intensity
at the exposure distance of 1 m was 70 mG.
0
5
10
15
20
25
30
Sham Field Sham Field
4-D box Resonator
Pro
po
rtio
n o
f M
E ce
lls(%
)
Device by Condition
Day 3 Day 6

96
Subsequently, one-way analysis of variance was conducted selecting only the 4-D application
geometry in order to verify significant differences between 1) exposure condition (Sham v.
Field) and 2) day of measure, for PME-bearing cells only. Here, the results indicated significant
differences between exposure condition for the proportion of PME-bearing cells on Day 3 [F
(1,26) = 6.48, p =.017, Ω2-est = 0.21] and Day 6 [F (1,26) = 7.24, p = .013, Ω2-est = 0.22] with no
difference across days. The results can be seen in Figure 2.4.1.2.
Figure 2.4.1.2: Main effect of the burst-firing pattern (PD = 3, ISI = 3) generated by the 4-D
application geometry with 2 Hz spatial rotation across all three axes on the proportion of PME-
bearing cells treated with 0.5 µM forskolin. Peak intensity was verified to be 40 mG within the
EMF-generating unit. Error bars represent SEM.
0
5
10
15
20
25
30
Sham Field
Pro
po
rtio
n o
f P
ME
bea
rin
g ce
lls (
%)
Exposure Conditon
Day 3 Day 6

97
Next, we aimed to evaluate any features of the exposure parameters that were unique to the
Resonator (r-MF) device. A two-way repeated measures ANOVA with exposure duration (1
and 3 hours) and condition (no field v. field) and time (day 3 and 6 measures) was conducted
to statistically validate any effects between treatment conditions and percent of cells bearing
neurites, multipolar nerites, long extensions, and synapses. Results indicated a main effect of
exposure duration [F (1,20) = 5.00 p = .037, pη2 = 0.20]. Subsequent post-hoc one-way analysis
of variance revealed that cells measured 3 days following exposure had a higher proportion of
neurite-bearing cells, regardless of exposure condition (sham v. field) when the cells were
exposed for a duration of 3 hours [F (1,23) = 6.61, p = .017, Ω2-est = 0.23] as can be seen in
Figure 2.4.1.3.
Figure 2.4.1.3: Data represents the change in proportion of cells bearing neurites from PC-12
cells injected with 0.5 µM forskolin and exposed to the Resonator C500 device at 1 m for 1
hour and 3 hours. Error bars represent SEMs.
0
5
10
15
20
25
1 hour 3 hours
Pro
po
rtio
n o
f P
ME
bea
rin
g ce
lls (
%)
Exposure Duration (hr)Day 3 Day 6

98
2.4.2. Determining the difference between rotational or constant application of burst-firing
EMF generated through the 4-D exposure application
A one-way analysis of variance was used to compare the spatio-temporal presentation (constant
v. rotation) was conducted to statistically validate any differences between morphological
measures assessed. Results indicated no significant differences in the proportion of cells
bearing PME (p>.05) or any other morphological measure between treatment conditions
(p>.05; Figure 2.4.2.1).
Figure 2.4.2.1: Proportion of cells displaying PME and multipolar PME, two measures that
demonstrated differences between EMF patterns, as a function of spatio-temporal pattern of
presentation (constant v. rotation) in the 4-D application apparatus. Error bars represent SEMs
n=2 plates per trial and N=4 replicates conducted independently.
0
5
10
15
20
25
30
35
4D Constant 4D Rotation
Pro
po
rtio
n o
f ce
ll to
tal (
%)
Condition
PME Multipolar

99
2.4.3. The influence of point duration of burst-firing EMF on PC-12 plasma membrane
extensions
One-way analysis of variance examining the difference in morphological measures as a
function of condition (i.e., changing PD and ISI) revealed significant differences for the
proportion of PME-bearing [F (3,35) = 5.83, p = .003, Ω2-est = 0.35] and multipolar cells [F (3,35)
= 8.27, p = 3.24·10-4, Ω2-est = 0.44]. The differences obtained were driven by greater
proportion of PME-bearing and multipolar between burst-firing treated samples and Sham
exposures. There was no difference between any of the different combinations of PD and ISI
used in this investigation. Results can be observed in the figure 2.4.3.1.
Figure 2.4.3.1: The proportion of PME and multipolar cells as a function of exposure condition.
EMF intensity, regardless of PD and ISI fell between 3 and 5 µT. Error bars represent SEM.
0
5
10
15
20
25
30
35
40
45
Sham Burst 3,3 Burst 1,1 Burst 3,3000
Pro
po
rtio
n o
f C
ell T
ota
l (%
)
Condition
PME Multipolar

100
2.4.4. Intensity dependence of burst-firing EMF on induced plasma membrane extensions in
PC-12 cultures
A one-way ANOVA was conducted to ascertain differences in morphological measures as a
function of intensity. Results revealed statistically significant differences in the proportion of
PME-bearing cells [F (2,29) = 6.08, p = .003, Ω2-est = 0.41] and multipolar cells [F (3,29) = 12.36,
p = 3.3·10-5, Ω2-est = 0.59] by intensity. Tukey’s post-hoc analysis revealed that the effects
were driven by significantly lower proportions of PME-bearing cells in sham conditions as
compared to all other intensities, with the greatest differences obtained between sham
exposures and high intensity burst-firing EMF exposures. No differences were obtained
between the highest intensity and all other EMF exposure intensities. The findings have been
summarized in Figure 2.4.4.1.
Figure 2.4.4.1: Effects of intensity on the proportion (%) of PME-bearing and multipolar cells
treated to Burst-firing EMF (3,3) for 1 hour in combination to 0.5 µM forskolin. Sham
0
5
10
15
20
25
30
35
Sham Low Med Hi
Pro
po
rtio
n o
f To
tal (
%)
Intenisty Condition
PME Multipolar

101
(control); Low (0.3 -0.5 uT); Med (3 – 5 uT); Hi (10+ uT). Error bars represent SEM. There
were total of N = 3 independent replicates with n = 2 plates for each intensity whilst Sham
conditions contained N=6 independent trials with n = 2 plates conducted in parallel.
2.4.5. Pattern specificity of EMF application on forskolin induced PC-12 plasma membrane
extensions
Analyses of variance was conducted to verify difference in morphological features as a function
of different patterned EMF exposures (5-levels). The results indicated significant differences
between the proportion of PME-bearing [F (4,29) = 3.93, p = .031, Ω2-est = 0.39] and multipolar
cells [F (4,29) = 4.71, p = .006, Ω2-est = 0.43] as a function of patterned EMF exposure. Tukey’s
post-hoc tests demonstrated the effects observed were being driven by the difference in the
proportion of PME-bearing cells between Burst and Rev-Burst. There was a significantly
greater proportion of multipolar cells when exposed to the burst-firing EMF as compared to
both the Rev-burst and Thomas conditions, with the latter pair being no different from each
other.

102
Figure 2.4.5.1: The representation of the differences obtained between varying EMF
configurations (patterns) as applied to 0.5 µM forskolin treated PC-12 cells. PD and ISI were
3 msec and verified intensity fell within the range of 2 – 4 µT respectively. The proportion of
cell total for plasma membrane extensions (PME) are represented in the dark bars, whilst the
proportion of the multipolar cells are represented in the light bars. Error bars correspond to
SEMs. N =3 replicates with 2 plates conducted in parallel.
0
5
10
15
20
25
30
Sham Thomas Burst Rev-Burst 7 Hz
Pro
po
rtio
n o
f ce
ll to
tal (
%)
EMF condition
PME Multipolar

103
2.4.6. Identifying the potential biomolecular pathway for the action of burst-firing EMF on
forskolin induced plasma membrane extensions in PC-12 cell cultures using an inhibitor series
2.4.6.1: Cell Morphology:
At the time of this writing, several (N=7) failed attempts to assess the impact of various
inhibitors in the presence of the most effective field condition were conducted. No data has
been rendered.
2.4.6.2: Ultra-Weak Photon Emission Spectra:
There were no significant differences between chemical inhibitors or EMF exposure as a
function of frequency for mean photon counts, standard deviation of the raw counts, nor the
spectral power densities among the 25-Hz bins (p>.05). Data was further investigated by
examining the mean spectral power densities as well as the standard deviation of spectral power
densities divided into frequency bins corresponding to the classical EEG frequencies, (delta :0-
3 Hz; theta: 4-7 Hz; alpha:1 8-11 Hz; alpha2: 12-15 Hz; beta1: 16-19 Hz; and beta2: 20-24
Hz). A MANOVA with these variables as dependents and EEG bins as within subjects’ factors
was used. There were no significant differences in the mean spectral power densities,
corresponding to the classical EEG bins, as a function of condition and inhibitor (p>.05).
However, there was a significant within-subjects’ interaction of condition and EEG frequency
bins [F (5,360) = 3.02, p = .011, pη2= .04]. Post-hoc one-way analyses revealed that the
differences were being driven by a reduction in low frequency (delta; 0-3 Hz) spectral power
density variability when the burst-firing field was present and can be found in Figure 2.4.6.2.1.

104
Figure 2.4.6.2.1: Data investigating differences in the standard deviation of spectral power
densities (ordinate) organized into classical EEG bands (abscissa). Each frequency bin was the
aggregate (mean) corresponding to frequency ranges of: delta :0-3 Hz; theta: 4-7 Hz; alpha:1
8-11 Hz; alpha2: 12-15 Hz; beta1: 16-19 Hz; beta2: 20-24 Hz. Error bars represent SEMs.
0
0.5
1
1.5
2
2.5
3
3.5
Delta Theta Alpha1 Alpha2 Beta1 Beta2
Mea
n o
f St
and
ard
Dev
iati
on
Frequency Bin
Sham Burst (3,3)

105
2.5. Discussion
In this series of investigations, we aimed to determine the most effective configuration of EMF
application parameters that could influence neuritogenesis of PC-12 cells treated with a cAMP
activator. These data showed that 1) different forms of electromagnetic (EM) energy
differentially influenced PME (neurite outgrowth), 2) there was no difference when cells were
exposed to EMF for 1 or 3 hours, 3) the effects on PME was strongly dependent on the temporal
organization of an effector field, 4) the burst-firing EMF and 7-Hz sine were the most impactful
and, 5) difference in intensity (0.1 to 10 uT) had the same effect on PME.
In terms of source of the EM energy, our results indicated that burst-firing EMF presented
through pairs of solenoids arranged across the 3 spatial axes as being able to promote (enhance)
neurite formation (operationalized as a change in the proportion of cells bearing PME) when
samples of PC-12 cells were also incubated with 0.5 µM forskolin. Conversely, the effects
observed when the same experimental protocol was applied to cells that were exposed to a
rotating magnetic field (rMF) of comparable intensity, demonstrated a reduction in
morphological measures. There is evidence to suggest that different forms of EM energy,
generated from different sources can lead to similar or opposite effects. For example,
Ossenkopp and Kavaliers (Ossenkopp and Kavaliers, 1987; Kavaliers and Ossenkopp, 1986)
demonstrated a sensitization to nociceptive stimuli in animals exposed to a rMF rotated at a
frequency of 0.5 Hz with an intensity of 3 G, while analgesic effects were observed by Martin
et al. (2004) when rats were exposed to burst-firing EMF of much lower intensities (5 – 10 uT).
Furthermore, certain field parameters may enhance abilities while other configurations may
lead to extirpation of an effect as evidenced in research examining Ingo Swann’s remote
viewing capacity (Koren and Persinger, 2002). Mr. Swann possessed the unique capacity to
accurately describe the nature and content of images sealed in envelopes and placed in a

106
separate location. His capacity to accurately described image content was impeded when
targets were exposed to a patterned EMF.
The results of these studies show that there is a specificity for EMF pattern in terms of inducing
effects, first by altering the gestalt temporal structure of the EMF stimulus (i.e., presentation
of different patterns) then by discretely altering the temporal organization of the most effective
field (i.e., changing point duration and inter-stimulus interval). In the former case, 3 distinct
EMF patterns that have been previously shown to be biologically relevant (burst-firing,
Thomas-EMF, and LTP), as well as 2 other targets, the inverted pattern of the effector field
(Rev-Burst) and a 7-Hz pulse, were compared. Results revealed that the burst-firing EMF was
most successful at positively impacting our measures (i.e., proportion of PME-bearing cells
and proportion of cells with multipolar extensions), as compared to other targets. Most notably,
there was an inversion of effects (i.e., return to baseline measures) observed when the structure
of the target field was reversed. These effects provide evidence that pattern is important when
using EMF exposure to affect biological systems and that, even when the energy is the same,
the structure of the quanta (stimulus) is different.
The effects of the 7-Hz pulse had a very similar effects on proportion of PME-bearing cells
when compared to the burst-firing pattern. PC-12 cells that are induced to differentiate by
stimulation with chemical agents respond specifically to dopamine agonism and antagonism
insofar that they are classified as peripheral dopaminergic neurons (Hussain et al., 2006;
Westerink and Ewing, 2008; Pothos et al., 1998). The effects associated with the burst-firing
pattern have been demonstrated to act, at least partially, on u-opioid receptors, and are related
to the biomolecular features of dopamine reactions (Thompson et al., 2000; Calon et al., 2000;
Greengard et al., 1999). The 7-Hz pulse has some similarity to naturally occurring EM

107
fluctuations in the environment. For instance, the geomagnetic field (that which arises from the
rotation of Earth’s fluid iron core) and Schumann harmonics (the consequence of lightning
discharges between the Earth’s surface and the ionosphere) share this frequency and have been
observed to have remarkable impacts on animal behaviour and neurodevelopment (Fournier et
al., 2012; Friedman et al., 1965; Persinger, 1999). Although unsubstantiated, it is possible that
the 7-Hz pulse activate neuritogenesis in the PC-12 model by mimicking fluctuations in the
geomagnetic field, although more rigorous experimental investigations are warranted.
It is interesting to note that the changing the organization of PD and ISI of the burst-firing EMF
had no effect on the proportion of PME-bearing cells in the PC-12 model as compared to
changing the overall pattern. An analogy to describe what was found can be likened to the
information contained within a narrative. In our narrative analogy, we may conceptualize point
duration, and alterations in this parameter, as the speed at that the narrative is read whilst the
inter-stimulus interval would be analogous to pauses associated with punctuation (commas and
periods) of the narrative. The overall information (content) in the narrative does not change if
we speed up or slow down the rate at that we read the excerpt nor does the time we take to
pause at the appropriate punctuation. In our manipulation, the content (structure) of the signal
is maintained but the speed and latency (pauses), between the presentation of the pattern is
altered with no change to the message (information) being espoused. Provided this analogy
holds, we would expect no differences to be observed. An alternative perspective would be that
our investigation only examines physical features of our target system. With this limited tool
of investigation, we cannot appreciate subtle changes in the function of the biological substrate
that may be elicited by our manipulations. Provided that we examined our system using more
functional measures, rather than strictly examining changes in physical structure, differences
may arise.

108
We have emphasized the importance of pattern in the observed effects and provided the
analogy of a narrative, describing the function of the EMF pattern, to that the biological system
responds. In keeping with this analogy, we will examine the influence of rotation, constant
application of the most effective field pattern, and the intensity of this pattern on the proportion
of cells bearing PME. When comparing rotated presentations of the burst-firing field
(presentation of the pattern in the plane-paired solenoids across 3 spatial axes followed
immediately by the simultaneous presentation of all 3-pairs across a rotation frequency of 0.5
Hz) and constant presentation through all 3 pairs of solenoids simultaneously, no differences
were determined in morphology. Consider how a recorded narrative that is played through a
set of headphones might affect transmission of information. In one instance, the recording is
played through both speakers simultaneously while in another situation, the same narrative is
constantly alternated between both speakers. Here again, the content of the narrative is not
altered and the individual receives all necessary/relevant information. Similarly, the pattern of
the EMF is not different (i.e., same content) and in both the rotated and constant conditions the
target system receives appropriate stimulation to elicit the observed effects. In these
experiments, we observed an intensity-independence between the three levels (low: 300-500
nT; medium: 3-5 uT; high: 10+ uT) of application intensity and their capacity to appreciably
alter the proportion of PME-bearing cells and those that bear multipolar (higher order
arborizations) extensions. There was no difference in morphological measures between the
different intensities but differences were observed and described as a marked enhancement in
the proportion of cells bearing PME and multipolar extensions when comparing the highest
intensity (10+ uT) to sham (no field) conditions. If we operationalize intensity as the volume of
speech, then it does not matter whether the message is screamed or whispered, the importance
lies in the message being articulated. Again, limitations arise as the technology employed does
not allow the field strengths to exceed 15 µT. It is possible that higher intensities (~ 100 uT),

109
that are 10 times greater than the limits of our tool, may render differing results. The
investigation described previously would identify 1) threshold effects and 2) power windows
that optimally drive this phenomenon.
One aim in this series of investigations was to determine the biomolecular pathway that was
most associated with statistical differences of the proportion of cells bearing plasma membrane
extensions by way of an inhibitor series. Two measures were utilized in order to determine any
potential effects associated with 1) morphological measures (structure) and 2) functional
differences as assessed by ultra-weak photon emission (UPE). No data has been successfully
collected in order to appropriately assess differences in morphological features as a function of
field in combination with specific inhibitors. Results from UPE analyses revealed a burst-firing
field effect described as a reduction in the mean variability (standard deviation) of spectral
power densities falling within the 0 – 3 Hz range. No effects were determined to be inhibitor
specific. Little can be said about discrete differences occurring at the biomolecular level
accommodating the observed effects. Despite this lack of mechanistic clarity, data collected
comparing 1 and 3-hour exposure durations to the burst-firing EMF revealed statistical
differences in the proportion of PME-bearing cells between these two exposure conditions.
Three possible mechanisms are suggested: 1) burst-firing EMF promotes the accumulation of
secondary signalling molecules (i.e., cAMP) that is maintained over the course of the exposure,
2) burst-firing EMF impacts enzyme kinetics, either speeding up or slowing down the rate-
limiting step, leading to the promotion of neurite outgrowth, or 3) downstream enzyme
(MEK/ERK) activity is stabilized long-term. Data that refutes the first mechanism was
provided by Loney et al., (Unpublished) who demonstrated that the presence of forskolin is
essential for field mediated effects and that the burst-firing field alone does not induce plasma
membrane extension. Not only does this evidence refute the first mechanism it may also serve

110
to support the third hypothesis. The scientific literature also suggests that maintained activation
of the MEK/ERK pathway is quintessential to the formation of plasma membrane extensions
as evidenced in similar studies using nerve growth factor (Loeb et al., 1991; York et al., 1998;
Park et al., 2012). One possible manner by that to verify our hypotheses is to investigate greater
exposure durations (i.e., more than 24 hours less than 72 hours) and measure PME proportion
and length of these corresponding extensions as well as directly assessing cAMP levels using
an enzyme-linked assay.
We conclude that the effects of EMF application on PC-12 cells treated with forskolin are
contingent upon the pattern of the applied field. Intensity demonstrated no difference between
various levels, nor does discretely altering the temporal construction of the pattern. When the
inverted configuration of the burst-firing field is presented in combination with forskolin the
proportion of cells bearing PME are reduced, burst-firing EMF effects are eliminated. Lastly,
although we were unable to directly assess the associated biomolecular pathway related to EMF
enhanced neurite outgrowth, we offered alternative means for clarifying the mechanism
involved evidenced by differences in proportion of PME-bearing cells exposed for 1 and 3 hour
durations.

111
2.6. References:
Baker-Price, L., & Persinger, M. A. (2003). Intermittent burst-firing weak (1 microTesla)
magnetic fields reduce psychometric depression in patients who sustained closed head injuries:
A replication and electroencephalographic validation. Perceptual and Motor Skills, 96(3), 965-
974.
Bouron, A., Becker, C., & Porzig, H. (1999). Functional expression of voltage-gated Na+ and
Ca2+ channels during neuronal differentiation of PC-12 cells with nerve growth factor or
forskolin. Naunyn-Schmiedeberg's archives of pharmacology, 359(5), 370-377.
Bos, J. L., De Bruyn, K., Enserink, J., Kuiperij, B., Rangarajan, S., Rehmann, H., ... &
Zwartkruis, F. (2003). The role of Rap1 in integrin-mediated cell adhesion.
Buckner, C. A., Buckner, A. L., Koren, S. A., Persinger, M. A., & Lafrenie, R. M. (2015).
Inhibition of cancer cell growth by exposure to a specific time-varying electromagnetic field
involves T-type calcium channels. PLoS One, 10(4), e0124136.
Buckner, C. A., Buckner, A. L., Koren, S. A., Persinger, M. A., & Lafrenie, R. M. (2017). The
effects of electromagnetic fields on B16‐BL6 cells are dependent on their spatial and temporal
character. Bioelectromagnetics, 38(3), 165-174.
Buckner, C. A., Buckner, A. L., Koren, S. A., Persinger, M. A., & Lafrenie, R. M. (2018).
Exposure to a specific time‐varying electromagnetic field inhibits cell proliferation via cAMP
and ERK signaling in cancer cells. Bioelectromagnetics, 39(3), 217-230.

112
Caillaud, T., Xu-van Opstal, W. Y., Scarceriaux, V., Billardon, C., & Rostene, W. (1995).
Treatment of PC-12 cells by nerve growth factor, dexamethasone, and forskolin. Molecular
neurobiology, 10(2-3), 105-114.
Calon, Frédéric, Abdallah Hadj Tahar, Pierre J. Blanchet, Marc Morissette, Richard Grondin,
Martin Goulet, Jean-Pierre Doucet et al. "Dopamine-receptor stimulation: biobehavioral and
biochemical consequences." Trends in neurosciences 23 (2000): S92-S100.
Cook, C. M., & Persinger, M. A. (1997). Experimental induction of the “sensed presence” in
normal subjects and an exceptional subject. Perceptual and Motor Skills, 85(2), 683-693.
Deutsch, P. J., & Sun, Y. (1992). The 38-amino acid form of pituitary adenylate cyclase-
activating polypeptide stimulates dual signaling cascades in PC-12 cells and promotes neurite
outgrowth. Journal of Biological Chemistry, 267(8), 5108-5113.
Dotta, B. T., Buckner, C. A., Lafrenie, R. M., & Persinger, M. A. (2011). Photon emissions
from human brain and cell culture exposed to distally rotating magnetic fields shared by
separate light-stimulated brains and cells. Brain research, 1388, 77-88.
Dotta, B. T., Lafrenie, R. M., Karbowski, L. M., & Persinger, M. A. (2014). Photon emission
from melanoma cells during brief stimulation by patterned magnetic fields: is the source
coupled to rotational diffusion within the membrane. General Physiology and Biophysics, 33,
63-73.

113
Dotta, B. T., Murugan, N. J., Karbowski, L. M., & Koren, S. A. (2015). Rotational frequency
matching of the energy of the changing angular velocity magnetic field intensity and the proton
magnetic moment produces a ten fold increased excess correlation in pH shifts in spring
water. NeuroQuantology, 14(1).
Dotta, B. T., & Persinger, M. A. (2012). “Doubling” of local photon emissions when two
simultaneous, spatially-separated, chemiluminescent reactions share the same magnetic field
configurations. Journal of Biophysical Chemistry, 3(01), 72.
Dugan, L. L., Kim, J. S., Zhang, Y., Bart, R. D., Sun, Y., Holtzman, D. M., & Gutmann, D. H.
(1999). Differential effects of cAMP in neurons and astrocytes role of B-raf. Journal of
Biological Chemistry, 274(36), 25842-25848.
Fleming, J. L., Persinger, M. A., & Koren, S. A. (1994). Magnetic pulses elevate nociceptive
thresholds: Comparisons with opiate receptor compounds in normal and seizure-induced brain-
damaged rats. Electro-and Magnetobiology, 13(1), 67-75.
Foley, John D., Eric W. Grunwald, Paul F. Nealey, and Christopher J. Murphy. "Cooperative
modulation of neuritogenesis by PC-12 cells by topography and nerve growth
factor." Biomaterials 26, no. 17 (2005): 3639-3644.
Fournier, N. M., Mach, Q. H., Whissell, P. D., & Persinger, M. A. (2012). Neurodevelopmental
anomalies of the hippocampus in rats exposed to weak intensity complex magnetic fields
throughout gestation. International Journal of Developmental Neuroscience, 30(6), 427-433.

114
Friedman, H., Becker, R. O., & Bachman, C. H. (1965). Psychiatric ward behaviour and
geophysical parameters. Nature, 205(4976), 1050-1052.
Garrels, J. I., & Schubert, D. (1979). Modulation of protein synthesis by nerve growth
factor. Journal of Biological Chemistry, 254(16), 7978-7985.
Greene, Lloyd A., and Jeffrey C. McGuire. "Induction of ornithine decarboxylase by nerve
growth factor dissociated from effects on survival and neurite outgrowth." Nature 276, no.
5684 (1978): 191.
Greene, L. A., & Tischler, A. S. (1982). PC-12 pheochromocytoma cultures in neurobiological
research. In Advances in cellular neurobiology (Vol. 3, pp. 373-414). Elsevier.
Greene, L. A., & Tischler, A. S. (1976). Establishment of a noradrenergic clonal line of rat
adrenal pheochromocytoma cells that respond to nerve growth factor. Proceedings of the
National Academy of Sciences, 73(7), 2424-2428.
Greengard, P., Allen, P. B., & Nairn, A. C. (1999). Beyond the dopamine receptor: the DARPP-
32/protein phosphatase-1 cascade. Neuron, 23(3), 435-447.
Gunning, P. W., Landreth, G. E., Bothwell, M. A., & Shooter, E. M. (1981). Differential and
synergistic actions of nerve growth factor and cyclic AMP in PC-12 cells. The Journal of Cell
Biology, 89(2), 240-245.

115
Halegoua, S., & Patrick, J. (1980). Nerve growth factor mediates phosphorylation of specific
proteins. Cell, 22(2), 571-581.
Hoshi, T., Garber, S. S., & Aldrich, R. W. (1988). Effect of forskolin on voltage-gated K+
channels is independent of adenylate cyclase activation. Science, 240(4859), 1652-1655.
Hussain, S. M., Javorina, A. K., Schrand, A. M., Duhart, H. M., Ali, S. F., & Schlager, J. J.
(2006). The interaction of manganese nanoparticles with PC-12 cells induces dopamine
depletion. Toxicological sciences, 92(2), 456-463.
Karbowski, L. M., Harribance, S. L., Buckner, C. A., Mulligan, B. P., Koren, S. A., Lafrenie,
R. M., & Persinger, M. A. (2012). Digitized quantitative electroencephalographic patterns
applied as magnetic fields inhibit melanoma cell proliferation in culture. Neuroscience
Letters, 523(2), 131-134.
Kavaliers, Martin, and Klaus-Peter Ossenkopp. "Stress-induced opioid analgesia and activity
in mice: inhibitory influences of exposure to magnetic fields." Psychopharmacology 89, no. 4
(1986): 440-443.
Koren, S. A., & Persinger, M. A. (2002). Possible disruption of remote viewing by complex
weak magnetic fields around the stimulus site and the possibility of accessing real phase space:
A pilot study. Perceptual and Motor Skills, 95(3), 989-998.
Lazarovici, P., Jiang, H., & Fink, D. (1998). The 38-Amino-Acid Form of Pituitary Adenylate
Cyclase-Activating Polypeptide Induces Neurite Outgrowth in PC-12 Cells that Is Dependent

116
on Protein Kinase C and Extracellular Signal-Regulated Kinase but not on Protein Kinase A,
Nerve Growth Factor Receptor Tyrosine Kinase, p21ras G protein, and pp60c-srcCytoplasmic
Tyrosine Kinase. Molecular Pharmacology, 54(3), 547-558.
Loeb, D. M., Maragos, J., Martin-Zanca, D., Chao, M. V., Parada, L. F., & Greene, L. A.
(1991). The trk proto-oncogene rescues NGF responsiveness in mutant NGF-nonresponsive
PC-12 cell lines. Cell, 66(5), 961-966.
Mach, Quoc Hao, and Michael A. Persinger. "Behavioral changes with brief exposures to weak
magnetic fields patterned to stimulate long-term potentiation." Brain research 1261 (2009):
45-53.
Martin, L. J., S. A. Koren, and M. A. Persinger. "Thermal analgesic effects from weak, complex
magnetic fields: critical parameters." Electromagnetic biology and medicine 24, no. 2 (2005):
65-85.
Martin, L. J., & Persinger, M. A. (2003). Spatial heterogeneity not homogeneity of the
magnetic field during exposures to complex frequency-modulated patterns facilitates
analgesia. Perceptual and motor skills, 96(3), 1005-1012.
Martin, L. J., & Persinger, M. A. (2004). Thermal analgesia induced by 30-min exposure to 1
μT burst-firing magnetic fields is strongly enhanced in a dose-dependent manner by the α2
agonist clonidine in rats. Neuroscience letters, 366(2), 226-229.

117
Martin, L. J., and M. A. Persinger. "The influence of various pharmacological agents on the
analgesia induced by an applied complex magnetic field treatment: a receptor system
potpourri." Electromagnetic Biology and Medicine 24, no. 2 (2005): 87-97.
Meli, S. C., & Persinger, M. A. (2009). Red light facilitates the sensed presence elicited by
application of weak, burst-firing magnetic fields over the temporal lobes. International Journal
of Neuroscience, 119(1), 68-75.
Murugan, Nirosha J., Lukasz M. Karbowski, Robert M. Lafrenie, and Michael A. Persinger.
"Temporally-patterned magnetic fields induce complete fragmentation in planaria." PloS
one 8, no. 4 (2013): e61714.
Murugan, N. J., L. M. Karbowski, R. M. Lafrenie, and M. A. Persinger. "Maintained exposure
to spring water but not double distilled water in darkness and thixotropic conditions to weak
(~ 1 µT) temporally patterned magnetic fields shift photon spectroscopic wavelengths: Effects
of different shielding materials." Journal of Biophysical Chemistry 6, no. 01 (2015): 14.
Murugan, N. J., Karbowski, L. M., & Persinger, M. A. (2014). Serial pH increments (~ 20 to
40 milliseconds) in water during exposures to weak, physiologically patterned magnetic fields:
implications for consciousness. Water, 6, 45-60.
Murugan, N. J., Karbowski, L. M., & Persinger, M. A. (2014). Weak burst-firing magnetic
fields that produce analgesia equivalent to morphine do not initiate activation of proliferation
pathways in human breast cells in culture. Integrative Cancer Science and Therapeutics, 1(3),
47-50.

118
Ossenkopp, K. P., & Kavaliers, M. (1987). Morphine-induced analgesia and exposure to low-
intensity 60-Hz magnetic fields: inhibition of nocturnal analgesia in mice is a function of
magnetic field intensity. Brain Research, 418(2), 356-360.
Park, K. H., Park, H. J., Shin, K. S., Choi, H. S., Kai, M., & Lee, M. K. (2012). Modulation of
PC-12 cell viability by forskolin-induced cyclic AMP levels through ERK and JNK pathways:
an implication for L-DOPA-induced cytotoxicity in nigrostriatal dopamine
neurons. Toxicological Sciences, 128(1), 247-257.
Park, Tae‐Ju, and Kyong‐Tai Kim. "Cyclic AMP‐independent inhibition of voltage‐sensitive
calcium channels by forskolin in PC-12 cells." Journal of neurochemistry 66, no. 1 (1996): 83-
88.
Persinger, M. A. (1999). Wars and increased solar-geomagnetic activity: aggression or change
in intraspecies dominance?. Perceptual and motor skills, 88(3_suppl), 1351-1355.
Pothos, E. N., Przedborski, S., Davila, V., Schmitz, Y., & Sulzer, D. (1998). D2-Like dopamine
autoreceptor activation reduces quantal size in PC-12 cells. Journal of Neuroscience, 18(15),
5575-5585.
Richter-Landsberg, C., & Jastorff, B. (1986). The role of cAMP in nerve growth factor-
promoted neurite outgrowth in PC-12 cells. The Journal of cell biology, 102(3), 821-829.

119
Ross, M. L., Koren, S. A., & Persinger, M. A. (2008). Physiologically patterned weak magnetic
fields applied over left frontal lobe increase acceptance of false statements as
true. Electromagnetic biology and medicine, 27(4), 365-371.
Satpute, R. M., Hariharakrishnan, J., & Bhattacharya, R. (2010). Effect of alpha-ketoglutarate
and N-acetyl cysteine on cyanide-induced oxidative stress mediated cell death in PC-12
cells. Toxicology and industrial health, 26(5), 297-308.
Schubert, D., M. La Corbiere, C. Whitlock, and W. Stallcup. (1978). Alterations in the surface
properties of cells responsive to nerve growth factor.
Schubert, D., & Whitlock, C. (1977). Alteration of cellular adhesion by nerve growth
factor. Proceedings of the National Academy of Sciences, 74(9), 4055-4058.
Seamon, K. B., & Daly, J. W. (1981). Forskolin: a unique diterpene activator of cyclic AMP-
generating systems. Journal of cyclic nucleotide research, 7(4), 201-224.
Seamon, K. B., & Daly, J. W. (1983). Forskolin, cyclic AMP and cellular physiology. Trends
in Pharmacological Sciences, 4, 120-123.
Seamon, K. B., Padgett, W., & Daly, J. W. (1981). Forskolin: unique diterpene activator of
adenylate cyclase in membranes and in intact cells. Proceedings of the National Academy of
Sciences, 78(6), 3363-3367.

120
Shafer, T. J., & Atchison, W. D. (1991). Transmitter, ion channel and receptor properties of
pheochromocytoma (PC-12) cells: a model for neurotoxicological
studies. Neurotoxicology, 12(3), 473-492.
Stork, Philip JS, and John M. Schmitt. "Crosstalk between cAMP and MAP kinase signaling
in the regulation of cell proliferation." Trends in cell biology 12, no. 6 (2002): 258-266.
Tessaro, L. W., & Persinger, M. A. (2013). Optimal durations of single exposures to a
frequency‐modulated magnetic field immediately after bisection in planarian predict final
growth values. Bioelectromagnetics, 34(8), 613-617.
Thompson, A. C., Zapata, A., Justice, J. B., Vaughan, R. A., Sharpe, L. G., & Shippenberg, T.
S. (2000). κ-Opioid receptor activation modifies dopamine uptake in the nucleus accumbens
and opposes the effects of cocaine. Journal of Neuroscience, 20(24), 9333-9340.
Tischler, A. S., & Greene, L. A. (1978). Morphologic and cytochemical properties of a clonal
line of rat adrenal pheochromocytoma cells that respond to nerve growth factor. Laboratory
investigation; a journal of technical methods and pathology, 39(2), 77-89.
Tischler, A. S., Greene, L. A., Kwan, P. W., & Slayton, V. W. (1983). Ultrastructural effects
of nerve growth factor on PC 12 pheochromocytoma cells in spinner culture. Cell and tissue
research, 228(3), 641-648.

121
Tischler, A. S., Ruzicka, L. A., & Perlman, R. L. (1990). Mimicry and inhibition of nerve
growth factor effects: interactions of staurosporine, forskolin, and K252a in PC-12 cells and
normal rat chromaffin cells in vitro. Journal of neurochemistry, 55(4), 1159-1165.
Tsang, E. W., Koren, S. A., & Persinger, M. A. (2009). Specific patterns of weak (1
microTesla) transcerebral complex magnetic fields differentially affect depression, fatigue, and
confusion in normal volunteers. Electromagnetic biology and medicine, 28(4), 365-373.
Vaudry, D., Stork, P. J. S., Lazarovici, P., & Eiden, L. E. (2002). Signaling pathways for PC-
12 cell differentiation: making the right connections. Science, 296(5573), 1648-1649.
Vossler, M. R., Yao, H., York, R. D., Pan, M. G., Rim, C. S., & Stork, P. J. (1997). cAMP
activates MAP kinase and Elk-1 through a B-Raf-and Rap1-dependent pathway. Cell, 89(1),
73-82.
York, R. D., Yao, H., Dillon, T., Ellig, C. L., Eckert, S. P., McCleskey, E. W., & Stork, P. J.
(1998). Rap1 mediates sustained MAP kinase activation induced by nerve growth
factor. Nature, 392(6676), 622.
Wang, Z., Dillon, T. J., Pokala, V., Mishra, S., Labudda, K., Hunter, B., & Stork, P. J. (2006).
Rap1-mediated activation of extracellular signal-regulated kinases by cyclic AMP is dependent
on the mode of Rap1 activation. Molecular and cellular biology, 26(6), 2130-2145.
Westerink, R. H. S., & Ewing, A. G. (2008). The PC-12 cell as model for neurosecretion. Acta
Physiologica, 192(2), 273-285.

122
Whissell, P. D., & Persinger, M. A. (2007). Emerging synergisms between drugs and
physiologically-patterned weak magnetic fields: implications for neuropharmacology and the
human population in the twenty-first century. Current neuropharmacology, 5(4), 278-288.
Wooten, Marie W., M. Lamar Seibenhener, Guisheng Zhou, Michel L. Vandenplas, and T. H.
Tan. "Overexpression of atypical PKC in PC-12 cells enhances NGF-responsiveness and
survival through an NF-κB dependent pathway." Cell death and differentiation 6, no. 8 (1999):
753.
Zhang, Kai, Liting Duan, Qunxiang Ong, Ziliang Lin, Pooja Mahendra Varman, Kijung Sung,
and Bianxiao Cui. "Light-mediated kinetic control reveals the temporal effect of the
Raf/MEK/ERK pathway in PC-12 cell neurite outgrowth." PloS one 9, no. 3 (2014): e92917.

123
Chapter 3
3 The Influence of Physical Application Geometry on PC-12 Cell Morphology and B16-BL6
Ultra-Weak Photon Emission Spectra
3.1 Abstract:
There has been little attention paid to the contribution that physical application geometry (the structure through which current is passed) plays
in the bio-effectivity of exposure to patterned electromagnetic fields. In this study, we compared EMF generated from 4 unique geometric
structures on 2 biological model systems: 1) morphological changes in PC-12 cells treated with forskolin and exposed to burst-firing EMF for
1 hour and 2) the production of ultra-weak photons (UPE) by B16-BL6 cells treated with a frequency modulated (i.e., Thomas) EMF. The
unique geometric exposure devices were constructed by wrapping copper wire around structured frames representing Helmholtz, Hoberman,
Rodin, and Toroid geometries. Results showed that the physical structure of EMF-generating devices influenced the proportion of neuron-like
outgrowths in PC-12 cells exposed to sham and burst-firing EMF. Furthermore, exposure of B16-BL6 cells to the Thomas-EMF presented
using distinct EMF-generating devices was able to influence the raw and spectral UPE profiles. These findings herein support the adage that,
as in biology, structure dictates function, even when it is applied to the equipment used in EMF research.
3.2. Introduction:
Research has demonstrated the ability of exposure to weak, physiologically patterned and time-
varying electromagnetic fields (EMFs) to affect biological systems. Buckner et al., (2015)
showed that exposures to a frequency modulated (FM) field, also known as the Thomas-EMF,
reduced cancer cell growth in vitro and in vivo. Exposure to this FM-EMF was able to enhance
calcium influx through T-type calcium channels as the mechanism of action (Buckner et al.,
2015, 2017, 2018). In addition, Dotta et al., (2016b) had previously identified that spectral
power characteristics of ultra-weak photons emitted from B16-BL6 cells that could 1)
differentiate between cancerous and non-cancerous tissues, 2) could identify differences
between cells receiving exposures to EMFs compared to sham treatments, and 3) identified the
potential utility of using ultra-weak photon emission as a tool to measure biomolecular

124
pathways using exclusion filters that were congruent with Cosic’s resonant recognition mode
(Dotta et al., 2011, 2014, 2016a, 2016b).
Experimental evidence has shown that different patterns (temporal organizations of current
injections delivered to the EMF-generating device) are capable of eliciting different outcomes
in biological systems. For instance, an asymmetric FM-EMF (i.e., Thomas) is capable of
reducing proliferation of B16-BL6 cells while the presentation of an EMF modeled after the
burst-firing of a collection of amygdaloid neurons, does not. However, exposures to the burst-
firing EMF has been shown to reduce nociceptive responses in rats challenged with thermal
nociceptive stimuli as effectively as 4 mg/kg equivalent morphine (Fleming et al., 1994). The
Thomas-EMF was also effective at reducing nociceptive responses in rats but it was less
effective than the burst-firing EMF (Martin et al., 2004). Exposure to burst-firing EMF was
found to be correlated with increased positive self-reported mood states from individuals
presenting with symptoms of mild-to-moderate depression (Baker-Price and Persinger 1996;
Baker-Price and Persinger, 2003). Murugan et al., (2014) showed that exposures of breast
cancer cells to burst-firing EMF could be a useful alternative pain-management program for
individuals receiving treatment for cancer. Traditional pain intervention strategies (i.e.,
morphine) may increase the potential of developing metastases especially in the later stages of
cancer progression (Simon and Arbo, 1986). Here, Murugan and colleagues co-cultured
cancerous and healthy cells and treated samples with either morphine or burst-firing EMF and
showed that morphine, and not exposures to burst-firing EMF, activated biomolecular
pathways associated with proliferation. Loney et al., (unpublished) demonstrated that
exposures to burst-firing EMF enhanced the proportion of neurite bearing PC-12 cells
subsequent to sub-micromolar levels of a cyclic-adenosine monophosphate (cAMP) activator;
forskolin. The previous chapter in this thesis described experiments that were able to

125
demonstrate pattern specificity, intensity, exposure duration, and timing (pattern frequency)
were important components needed to optimize the proportion of neurite bearing cells in a PC-
12 model of neurogenesis using a different piece of equipment; the 4-D application system.
Evidence supports the assertion that pattern is quintessential for EMF exposures to appreciably
influence the function of biological systems. In normal systems, such as the processes
associated with memory, pattern is also important. For instance, long-term potentiation (LTP),
a feature of learning and memory consolidation, can be operationalized as the persistent and
stable enhancement of synaptic strengths (or connectivity) following stimulation (Frey and
Morris, 1997; Malenka and Nicoll, 1999) and has been associated with electromagnetic
processes (Komaki et al., 2014; Haas and Rose, 1982; Rose et al., 1988). Mach and Persinger
(2009), postulated that rats exposed to a digitized version of an LTP pattern at crucial time
points in memory acquisition and retrieval would show differences on memory-based tasks.
The results of their experiments indicated an enhancement of memory performance for LTP-
patterned EMF treated animals that were exposed after training but a reduction in performance
if they were exposed to the LTP patterned EMF prior to training. Unlike Thomas-EMF
treatments, LTP-EMF was not capable of reducing proliferation in cancer cells. However,
Dotta et al., (2014) demonstrated that isolated samples microtubules exposed to LTP-patterned
EMF were capable of re-emitting this same pattern (as assessed by the spectral characteristics
of ultra-weak photon emission) as compared to other patterned EMF treatments. The ability of
microtubules to emit photons was specific for the LTP pattern while the most conspicuous
effects approached the theoretical constructs detailed by Hameroff and Penrose in their
orchestrated objective reduction theory of consciousness (Hameroff and Penrose, 2014).

126
Evidence supports the underlining importance that the pattern of the applied EMF plays in
relation to its capacity to affect biological systems. Despite the breadth of knowledge detailing
the importance of EMF pattern, little attention has been given to the contribution made by the
physical structure through that the resultant EMF is generated. The importance of assessing the
relevance of physical application geometry (i.e., different configurations around that copper
wire is wound and the through that current is passed) can be supported by discussing the
structural difference between static magnets and EMFs generated from current loops.
The intensity (amount) of electromagnetic force exerted upon an object to do work of a static
magnetic results from the combined organizations (alignment) of magnetic dipoles contained
within the ferromagnetic material (Burke, 2012). Under the appropriate conditions, these
dipoles can either be made to align, by way of an external “magnetizing” field, or be unaligned
(demagnetized) by heating the material to the point where it begins to luminesce; its Currie
temperature (Burke, 2012). Generally, we describe the amount of electromagnetic force
available to do work by field lines. Field lines are magnetic force vectors (flux lines) that
extend from the magnetic North pole and enter the magnetic South pole and are present in both
bar and horseshoe magnets. The distance traveled along a bar magnet is greater than the
distance between adjacent poles of a horseshoe magnet that in turn may affect the quality
(constraints) of the field lines. A change in the constrictions of magnetic field lines of force
(either by convergence or divergence) will impact the intensity of the static magnet. When an
EMF is generated by passing a current through a conducting wire, the resultant magnetic field
is perpendicular and circumferential to the direction in that the current is traveling and follows
the Biot-Savart law. Changing the shape of the wire by wrapping it along an axis (i.e., a coil)
results in a solenoid that has a much different field configuration and parameters (i.e., intensity)
as compared to a solitary length of wire. Adding to this, if one were to wrap a length of

127
conducting wire in a direction perpendicular to the circumference of a non-conducting loop,
the resulting field configuration would take a doughnut shaped or toroidal field structure.
Furthermore, Helmholtz demonstrated that two electrically coupled (connected) circular coils
of wire with an equal number of wrappings that are physically separated by a distance
equivalent to the radius of the paired coils, generates a constant EMF contained within the
cylindrical volume, when current is passed through it and describes a structure named a
Helmholtz coil.
The physical structure of an EMF-generating device can change or impact the characteristics
of the resulting EMF. Despite these differences, little research has been conducted examining
the role that physical geometry plays in the biological efficacy of exposures to weak,
physiologically patterned EMFs. Here we propose two investigations using well defined
biological systems (i.e., cancer cells) that predictably respond to the application of unique
patterned EMFs. The first investigation aims to identify differences obtained in the morphology
and proportion of neurite-bearing PC-12 cells after exposure to the combination of burst-firing
EMF and sub-micromolar concentrations of a cAMP activator; forskolin. In addition to
qualitative morphological differences, we will assess the ultra-weak photon emission spectra
(i.e., measures of discrete individual differences) from PC-12 cells exposed to burst-firing EMF
presented through 4 unique application geometries 3 days after treatment. The target day was
selected as data from the previous chapter suggested that 72 hours is required in order to
observe differences in neurite outgrowth in this cell line. In our second investigation, discrete
differences in ultra-weak photon emission spectral profiles were examined for B16-BL6 cells
exposed to Thomas-EMF (as this patterned has been shown to significantly decrease their
proliferation) generated through the same 4 unique physical application geometries. These
investigations will allow us to identify any potential differences that can be elicited as a

128
function of geometric structure of an EMF-generating device in global and discrete measures
relevant to biological systems.
3.3. Methods
3.3.1. Cell culture and induction of plasma membrane extensions in PC-12 cells
Pheochromocytoma (PC-12) cells, derived from the rat adrenal medulla, were grown to
confluence on 100-mm stock plates supplemented with standard growth media (85% RMPI-
1640, 10% horse serum, 5% fetal bovine serum, 1% antibiotic and antimycotic; v/v
equivalents). 50 µL of cell suspensions were inoculated on poly-L-lysine-treated, 35-mm cell
culture dishes and incubated for 24 hours in a standard incubator at standard conditions (37ºC,
95% O2, 5% CO2) allowing the cells to adhere. On the day of the experiment, growth media
was removed and the cells were supplemented with 2 mL of serum-free media (RMPI-1640
with 0.5% antibiotic and antimycotic). Cultures were then placed in an exposure incubator,
operating at standard conditions, that contained the EMF exposure devices.
3.3.2. EMF exposure conditions for PC-12s
For this investigation, PC-12 cells were exposed to either Sham or burst-firing EMF generated
through 1 of 4 physical application geometries (Helmholtz, Hoberman, Rodin, or Toroid;
Appendix E1-E4) for the duration of 1 hour. The burst-firing EMF was generated from a digital
file programmed for 230 points ranging from 0 to 256, that were converted to voltage
equivalents of -5V to +5V (127 = 0V) by way of a custom constructed, adjustable digital-to-
analog converter and modified mini-audio amplifier that supplied current to each of the

129
respective physical application geometries. PD and ISI were set to 3 and 3000 msec
respectively. Field intensity was verified using an AC milliGauss meter (AlphaLabs) and field
pattern was verified using a mini-audio amplifier coupled to a telephone pick-up coil. The
intensity of the pattern fell between 300 and 500 nT. The cells were treated with 1 µL of
forskolin (final concentration: 0.5 µM) or DMSO (vehicle) at ten minutes into their respective
exposure conditions. The control conditions consisted of plates of cells that received only
forskolin or DMSO. For each condition, there were 2 plates that were conducted in parallel and
all replicates (N =3) were conducted on separate days. An example of the experimental
exposure set-up is provided in Appendix E5
3.3.3. Cell morphological measures
In order to assess the efficacy of our various treatments, photos (N=4 per plate) were taken 3
days after exposure using a phase-contrast light compound microscope at 100x magnification.
The total number of cells were counted for each quadrant and summated for each plate. In
addition, cells bearing plasma membrane extensions (i.e., any observable distortion or
protrusion whose origin can be traced to the cell body; PME) were counted and reported as a
proportion of the total number of cells. Other pertinent morphological features were measured
including: the proportion of cells with multipolar and higher order arborizations, the number
of inter-cellular connections (i.e., synapses), and proportion of cells whose plasma membrane
extensions exceeded the largest diameter of their cell soma. Morphological measures were
taken immediately following the recordings of biophoton emission.
3.3.4. Ultra-Weak Photon emission measurements for PC-12 cells

130
The plates of PC-12 cells that had been treated with forskolin or vehicle (DMSO) and that
received either sham or burst-firing EMF exposures through one of the four target EM physical
application geometries were removed from the growth incubator and transported to the
recording room. The recording room, that housed the photon measurement device is located
approximately 3 m away from the cell culture laboratory. A single plate was placed onto the
aperture of a Model DMC-0089 digital photomultiplier tube (PMT) (SENS-TECH Sensory
Technologies; SN:68569). The entire experimental detection system and culture plate was
housed in a darkened wooden box, that was covered by 10 layers (8 cm) of thick cotton cloth
to ensure no environmental light pollution would affect the sensitivity of the PMT recordings.
The typical dark counts or background ambient recordings obtained for this PMT were in the
range of 0 – 2 photon units per 20 msec (50 – 100 photons per sec). Measurements were
acquired using Sens-Tech Counter Timer software (Version 2.8, build: 11) at a sampling rate
of 50 Hz and were recorded and stored on a personal laptop computer. Each recording session
was divided into three recording phases: 1) a 2-min pre-baseline period (6000 points), 2) a 5-
min active cell recording period (i.e., when dish was placed over the aperture of the recording
device; 15000 points), and 3) a 2-min post baseline recording period (6000 points). Each
recording phase was separated by a 2-min light adjustment period to reduce the impact of
environmental light pollution during data collection. PMT measures were obtained prior to the
morphological measures and were taken 3 days following chemical treatment and EMF
exposure. For each recording session there were 2 plates per condition, and all conditions were
independently replicated in triplicate (N=3).

131
3.3.5. Cell culture of B16-BL6 mouse melanoma cells
Mouse melanoma (B16-BL6) cells were obtained from Dr. Carly Buckner and Dr. Robert
Lafrenie from the Health Sciences North Cancer Research Institute in Sudbury, Ontario. The
cells and were cultured on 100-mm plates and maintained in DMEM media supplemented with
10% fetal bovine serum, 100 U/ml penicillin G, 100 μg/ml streptomycin sulfate and 250 ng/ml
amphotericin B and maintained in a water jacketed incubator with standard settings (37°C, 95%
oxygen, 5% CO2). Stock cultures were split every 3-5 days at a ratio of approximately 1:5. For
the experiments, sub-cultures derived from stock plates were added to plates at a final cell
concentration of 106 cells/per 35-mm plate and incubated 4 – 6 hours to allow adherence in
standard conditions prior to experimentation.
3.3.6. EMF exposure conditions for B16-BL6 cells
A single 35-mm plate containing ~106 B16-BL6 cells was removed from the cell culture
laboratory and transported to the exposure and the measurement room approximately 3 m
away. Samples were placed inside of 1 of the 5 EMF physical application geometries [cells
only (controls), Helmholtz, Hoberman, Rodin, or Toroid] and on top of the aperture of a Model
DMC-0089 digital photomultiplier tube (PMT) (SENS-TECH Sensory Technologies;
SN:68569). The apparatus was kept in a darkened box covered with 10 layers (8 cm) of black
cotton cloth. The B16-BL6 cells were exposed to the Thomas-EMF with both the PD and ISI
set to 3.25 msec and at an intensity range of 300-500 nT. We chose this patterned EMF as it
had been previously demonstrated to significantly increase calcium uptake in the B16-BL6 cell
line as early as 15-min into exposure, as well as reducing growth in B16-BL6 cells following
repeated exposure (Buckner et al., 2015, 2018). The Thomas-EMF was generated by

132
converting a digital file of 859 integer values between 0 and 256 to a corresponding voltage of
-5 V to +5V (127 = 0V), producing 18 doublet peaks with gradually increasing intervals
between 3 msec (for the first 5 repeats) to 120 msec for the last 5 repeats. The resulting
frequency modulation for the Thomas-EMF pattern ranged from 25 Hz for the first 5 to 6 Hz
for the last 5 repeats. The Thomas-EMF pattern was presented for a duration of 30-min through
a custom constructed, adjustable digital-to-analog converter and modified mini-audio amplifier
that supplied current to each of the respective physical application geometries. The intensity,
as verified by an AC milliGauss meter (AlphaLabs), was between 300 – 500 nT.
3.3.7. Ultra-Weak Photon Emission Measurements for B16-BL6 cells
A single 35 mm plate containing ~106 B16-BL6 cells was removed from the cell culture
laboratory and transported to the exposure and the measurement room approximately 3 m
away. Samples were placed inside of 1 of the 5 EMF physical application geometries (cells
only, Helmholtz, Hoberman, Rodin, or Toroid) and on top of the aperture of a Model DMC-
0089 digital photomultiplier tube (PMT) (SENS-TECH Sensory Technologies; SN:68569) in
a darkened box covered with 10 layers (8 cm) of black cotton cloth. The experimental set-up
was constructed to allow detection of changes in ultra-weak photon emission from cells whilst
they were simultaneously exposed to a weak, time-varying EMF. Measurements of ultra-weak
photon emission were acquired using Sens-Tech Counter Timer software (Version 2.8, build:
11) at a sampling rate of 50 Hz and data were recorded and stored on a personal laptop
computer. The recording phases consisted of 3, 1-min long measurements at a sampling rate
of 50 Hz. There were 5 measurements periods that were recorded for each experiment:
background baseline period, pre-exposure cell baseline period (i.e., pre-exposure sham), 3
periods during the exposure [beginning (minutes 1 – 3), middle (minutes 15 – 18), and end

133
(minutes 27-30)], and post-exposure cell baselines period (post-exposure shams). For this
experiment, pre-exposure and post-exposure cell baseline measures also served as the Sham
exposure controls for statistical comparisons. Prior to the commencement of the pre-exposure
cell baselines, a 5-min adjustment period was allowed to accommodate recondite variance
associated with ambient light pollution.
3.3.8. Methods of analyses
3.3.8.1. Cell Morphology:
The raw data obtained for morphological measures were converted into the proportion of the
total cells counted (variable of interest/total cell count·100%) and were used in subsequent
analyses. In addition, three separated variables were computed corresponding to the ratio of
multipolar bearing cells, synaptic connections, and the long extensions relative to the number
of cells bearing plasma membrane extensions. Ratio values allow for the appropriate
assessment of a greater degree of complexity as a function of exposure condition. Unless
otherwise specified, all proportions were subjected to a one-way analysis of variance.
Subsequent Tukey’s post-hoc tests, where applicable, were employed to demonstrate that
source(s) of variance were driving the effect.
3.3.8.2. Ultra-Weak Photon Emission – PC-12 Cell Experiment:
Raw photon emission data taken 3 days after exposures to sham or burst-firing EMF in
combination with 0.5 µM forskolin were imported in MatLab processing software to allow the
computation of the mean and standard deviation (SD) of photon counts for each of the

134
recording phases (i.e., baseline, cell, post-baseline). Furthermore, raw time-series data was
standardized (i.e., z-transformed) and truncated between +/-5 SD to accommodate outliers for
each 1 min recording. Standardized cell photon emission was then subjected to spectral
analysis yielding spectral power densities whose frequency range spanned 0 – 25 Hz in 0.01
Hz bin increments. Spectral data as well as the mean number of photons and SD of photon
count for each recording phase were then exported to SPSS for statistical analysis. Here,
spectral data was then grouped in 1 Hz increments (i.e., 1 Hz bin = 1.01 to 1.99) for time-series
analysis. Spectral data, examining the frequency range of 0 – 24 Hz in 1 Hz increments, were
subjected to a Multi-variate analysis of variance (MANOVA) with field (sham v. burst-firing
EMF) and geometry (Helmholtz, Hoberman, Rodin, Toroid) as between-subject’s factors and
frequency (25 levels) as a within-subject’s measures. A one-way analysis of variance was
conducted to ascertain differences between mean photon counts and the standard deviation of
photon counts as a function of geometry.
3.3.8.3. Ultra-Weak Photon Emission – B16-BL6 Experiment:
Raw photon count data was imported into MatLab processing software to allow the
computation of means and SDs for each of the 3, 1-min recordings corresponding to the
background baseline, pre-exposure cell baseline, 3 periods during the exposure [beginning
(minutes 1 – 3), middle (minutes 15 – 18), and end (minutes 27-30)], and post-exposure cell
baselines measurement periods. Raw time-series data for the aforementioned recording phases
were standardized, truncated between +/- 5 SDs, and spectrally analyzed. The corresponding
spectral power densities had a frequency range that spanned 0 – 25 Hz in 0.01 Hz bin
increments. All computed data was entered into SPSS for statistical analysis. Data for the 0.01
Hz bins were aggregated into 25, 1 Hz bins (i.e., 1 Hz = 1.01 – 1.99 Hz) to reduce the number

135
of potentially spurious effects. To investigate overall changes in mean photon counts and
standard deviation of these measures, serial one-way ANOVAs were conducted with
appropriate alpha-wise correction.
Spectral power densities for each of the 25, 1 Hz (0-24 Hz) bins were subjected to serial
MANOVAs controlling for pre-exposure sham, EMF treatment, and post-exposure sham
measurement periods with geometry (4 levels) as between-subjects’ measures and frequency
(25 levels) as within-subjects’ measures. Relevant post-hoc analyses were conducted in order
to ascertain the driving factors between statistically relevant findings and are discussed within
their respective sub-sections.
3.4. Results
3.4.1. PC-12 Cell morphology
PC-12 cell treated with forskolin and EMF presented using different geometries showed
differences in the proportion of cells with multipolar extensions depending on the particular
geometry. The results of a one-way ANOVA examining the proportion of cells bearing plasma
membrane extensions (PME), multipolar cells, inter-cellular contacts, and long extensions by
condition (9-levels: controls receiving only chemical stimulation, 2 field conditions across 4
application geometries), revealed significant differences for multipolar cells [F(8,54)= 3.04, p
=.008, Ω2-est = 0.36], inter-cellular contacts [F(8,54)= 2.21, p =.044, Ω2-est = 0.28], and long
extensions [F(8,54)= 2.96, p =.009, Ω2-est= 0.34] as a function of EMF exposure condition.
Furthermore, significant differences were obtained in the ratios of multipolar to PME-bearing
cells [F (8,54) = 12.98, p =1.46·10-9, Ω2-est = 0.69], synapses to PME-bearing cells [F (8,54) =

136
4.90, p = 2.06·10-4, Ω2-est = 0.46], and long extensions to PME-bearing cells [F (8,54) = 4.88, p
=2.12·10-4, Ω2-est = 0.46]. Graphs showing the differences obtained for multipolar cells and
the ratio of multipolar cells to PME-bearing cells as a function of condition can be observed in
figures 3.4.1.1 and 3.4.1.2 respectively.
Figure 3.4.1.1: Data examining the proportion of cells bearing multipolar plasma membrane
extensions as a function of exposure condition and geometry. Field exposure consisted of 1
hour of burst-firing with PD = 3 msec and ISI = 3000 msec, at an intensity range of 300-500
nT. Error bars represent SEMs.
0
5
10
15
20
25
30
35
Helmholtz Hoberman Rodin Toroid
Pro
po
rtio
n o
f to
tal (
%)
Condition
Negative Control Sham Field

137
Figure 3.4.1.2: Differences obtained in the ratio (Y-axis) of the number of multipolar cells
relative to PME-bearing cells as a function of geometry (X-axis) and exposure condition. Field
exposure consisted of 1 hour of burst-firing with PD = 3 msec and ISI = 3000 msec, at an
intensity range of 300-500 nT. Error bar represent SEMs.
0
0.1
0.2
0.3
0.4
0.5
0.6
0.7
0.8
0.9
1
Helmholtz Hoberman Rodin Toroid
Rat
io v
alu
e
Condition
Negative Control Sham Field

138
Differences in morphological features of the PC-12 cells treated with forskolin and exposed to
burst-firing EMF presented through different geometries were shown for the proportion of cells
with PME, multipolar extensions, inter-cellular contacts, and long extensions were tested using
one-way analyses of variance. Only differences where p<.0125 were considered significant
after alpha-level correction. There were no differences observed in any of the morphological
measures for the Helmholtz and Toroid geometries as a function of condition. However, there
were differences in the proportion of PME-bearing cells [F (2,18) = 6.93, p = .007, Ω2-est = 0.46],
and multipolar cells [F (2,18) = 7.58, p = .005, Ω2-est = 0.49], as a function of condition for the
Hoberman geometry. Meanwhile, measures for PME [F (2,18) = 29.02, p = 5.0·10-6, Ω2-est =
0.78], multipolar cells, [F (2,18) = 61.24, p = 3.17·10-8 Ω2-est = 0.88], synapses [F (2,18) = 46.37,
p = 2.19·10-7, Ω2-est = 0.85], and long extensions [F (2,18) = 6.44, p = .009, Ω2-est = 0.45],
demonstrated differences as a function of exposure condition within the Rodin geometry. Data
corresponding to the proportion of PME-bearing cells and proportion of multipolar cells for
each geometry across the different exposure conditions can be found in figures 3.4.1.3 –
3.4.1.6.

139
Figure 3.4.1.3: Differences in the proportion of cells bearing PME and multipolar extensions
for the Helmholtz geometry. Field exposure consisted of 1 hour of burst-firing with PD = 3
msec and ISI = 3000 msec, at an intensity range of 300-500 nT. Error bar represent SEMs. No
significant differences were obtained at the p<.0125 level.
0
10
20
30
40
50
60
70
80
Negative control Sham Field
Pro
po
rtio
n o
f to
tal (
%)
Condition
PME Multipolar

140
Figure 3.4.1.4: Differences in the proportion of cells bearing PME and multipolar extensions
for the Hoberman geometry. Field exposure consisted of 1 hour of burst-firing with PD = 3
msec and ISI = 3000 msec, at an intensity range of 300-500 nT. Error bar represent SEMs.
Differences between field and negative control, but not between sham exposures, were driving
the observed effects.
0
5
10
15
20
25
Negative control Sham Field
Pro
po
rtio
n o
f to
tal (
%)
Condition
PME Multipolar

141
Figure 3.4.1.5: Differences in the proportion of cells bearing PME and multipolar extensions
for the Rodin geometry. Field exposure consisted of 1 hour of burst-firing with PD = 3 msec
and ISI = 3000 msec, at an intensity range of 300-500 nT. Error bar represent SEMs.
Differences observed were being driven by sham and field conditions as compared to negative
controls.
0
5
10
15
20
25
30
35
40
Negative control Sham Field
Pro
po
rtio
n o
f to
tal (
%)
Condition
PME Multipolar

142
Figure 3.4.1.6: Differences in the proportion of cells bearing PME and multipolar extensions
for the Toroid geometry. Field exposure consisted of 1 hour of burst-firing with PD = 3 msec
and ISI = 3000 msec, at an intensity range of 300-500 nT. Error bar represent SEMs. No
differences were obtained.
0
2
4
6
8
10
12
14
16
18
20
Negative control Sham Field
Pro
po
rtio
n o
f to
tal (
%)
Condition
PME Multipolar

143
3.4.2. Ultra-Weak Photon emission measurements for PC-12 cells
The number of photons emitted by the PC-12 cells cultures collected by PMT measures were
z-transformed and truncated between +/-5 SD prior to being spectrally analyzed and divided
into 0.1 Hz increment bins. The means and SDs of photons emitted for each condition were
also computed for each recording session. Differences in photon emission were analyzed for
both global (mean and SD of recording) and discrete (1 Hz bins and classical EEG bands) using
a MANOVA with chemical (DMSO v. Forskolin), Field (control, sham, Burst), and physical
application geometry as between-subject’s factors. None of the discrete measures were shown
to be different between treatments. However, it was shown that the mean photon counts when
cells were present, irrespective of field condition or chemical treatment showed a difference
between geometries [F (4, 101) = 8.04, p = 1.2·10-5, Ω2-est = 0.25]. Post-hoc analysis of
homogenous sub-groups identified mean photon counts for the PC-12 cells exposed to the
Rodin coil and Helmholtz coil (all groups combined) as being lower than that of cells exposed
to the Hoberman coil or controls. Follow-up multiple nonparametric tests (Mann-Whitney U)
confirmed the findings of parametric equivalents, as homogeneity of variance was violated.
Field effects (data not shown) were demonstrated to have impacted the standard deviation of
the recording phase but was not impacted by physical application geometry.

144
Figure 3.4.2: Differences obtained between physical application geometry as assessed by PMT
spectra emission 3 days following treatment. All groups were combined in this analysis. Error
bars represent SEMs. (N=3).
0
0.5
1
1.5
2
2.5
3
Control Helmholtz Hoberman Rodin Toroid
Men
a P
ho
ton
s /2
0 m
sec
EMF Application Geometry

145
3.4.3. Ultra-Weak Photon Emission Measurements for B16-BL6 cells
The data from the mean photon counts and SD of the recording segment were extracted from
each of the 3, 1-min recording measures from 3 observation periods during baseline, pre-
exposure sham, field recording (minutes 1-3; 15-18; 27-30), and immediately following
exposure (post-exposure sham) and imported into Excel. The data was standardized and
truncated between +/-5 SD to accommodate outliers and separately organized in a between-
subjects’ and a within-subjects’ manner before being exported into SPSS for statistical analysis.
For the dataset organized as between-subjects’ cases, 3 separate one-way analyses of variance
were conducted to examine the differences in the mean photon counts and SD of the photon
counts for the 3 periods of observation: pre-exposure sham, overall field effect, and post-
exposure sham. Significance was considered at the p<.02 level. There was no difference in
mean photon counts (p=.041) nor the standard deviation of photon counts (p=.049) for the post-
exposure sham conditions between geometries, after alpha-level correction. In contrast, there
were significant differences in mean photon counts [F (3,35) = 5.52, p =.004, Ω2-est = 0.34] and
in the SD of photon counts [F (3,35) = 4.54, p = .009, Ω2-est = 0.30] in pre-exposure sham treated
B16-BL6 cells. Tukey’s post-hoc analyses confirmed that the differences were being driven by
higher values for the Hoberman condition as compared to the Toroid and Helmholtz conditions.
Analysis of the combined field effects demonstrated significant differences for mean photon
counts [F (3,107) = 8.18, p = 6.1·10-5, Ω2-est =0.19] and the SD of photon counts [F (3,107) = 6.37,
p = .001, Ω2-est =0.16] as a function of geometry. The mean photon counts and SD of photon
counts for the Hoberman condition had significantly higher values as compared to all other
geometries. Results are summarized in figures 3.4.3.1 and 3.4.3.2.

146
Figure 3.4.3.1: Mean photon counts, per 20 msec (ordinate), as a function of geometry
(abscissa). Bars (left to right) correspond to measurement periods observing photon emission
during pre-exposure sham, total field exposure, and post-exposure sham. Error bars represent
SEMs.
0
1
2
3
4
5
6
7
8
9
Helmholtz Hoberman Rodin Toroid
Mea
n P
hoto
n c
ount
(/20 m
sec)
Geometry
Pre-exposure Sham Field Post-exposure sham

147
Figure 3.4.3.2: Differences in the standard deviation (ordinate) of measurement periods for the
pre-exposure sham, total field exposure, and post-exposure baselines (represented as bar going
from left to right) as a function of EMF physical application geometry (abscissa). Error bars
represent SEM values.
0
0.5
1
1.5
2
2.5
3
Helmholtz Hoberman Rodin Toroid
Stan
dar
d D
evai
tio
n
Geometry
Pre-exposure Sham Field Post-exposure sham

148
The frequency-specific attributes of photon emission associated with each geometry during the
three target phases of recording (pre-exposure sham, field, post-exposure sham) were
investigated using 3 separate MANOVAs to assess spectral power density (SPD) values for 25,
1 Hz frequency bins (1 Hz bin = spectral frequencies between 1.00 to 1.99 Hz) with geometry
(4 levels) as the between-subjects’ factors and frequency (25 levels) as the within subjects’
variables. Results were considered significant at the p<.02 level after alpha wise correction.
Investigations examining pre-exposure sham conditions revealed a significant within subjects’
interaction of geometry by frequency of photon emission [F (72,768) = 3.52, p<.001, pη2 = 0.25],
while no such interaction was determined in post-exposure baselines (p=.89), however this
interaction was maintained during the field exposure portion of the experiment [F (72,2496) = 2.01,
p <.001, pη2 = .05). Post-hoc analyses using one-way analyses of variance aimed to investigate
which frequencies that were different between each geometry during the pre-exposure sham
and active field conditions, as subtle distinctions between physical application geometry was
most salient to this investigation.
Post-hoc examinations of pre-exposure sham conditions identified the 3- and 10-Hz frequency
bins as being significantly different between geometries: the Helmholtz and Hoberman
conditions had lower SPD values compared to the Rodin geometry for 3- Hz bin; while the 10-
Hz bin had lower SPD values for the Hoberman and Helmholtz geometries but higher SPD
values for the Toroid condition. There were also differences in the frequency of photon
emission for B16-BL6 cells exposed to the active EMF condition and post-hoc analyses
demonstrated differences in SPD values for the 3- and 16-Hz frequency bins. The differences
obtained in the 3-Hz frequency bin showed SPD values in the Hoberman and Helmholtz
conditions that were significantly lower than the SPD values in the Rodin condition.
Differences in the 16-Hz bin were being driven by significantly lower SPD values in the

149
Hoberman condition as compared to the Rodin condition. Data associated with the most salient
findings are presented in figure 3.4.3.3 and 3.4.3.4.
Figure 3.4.3.3: Spectral power density (arbitrary units; ordinate) differences for 3 distinct
frequency bins (3, 10 and 16 Hz) comparing the 4 different EMF application geometries during
the pre-exposure sham condition. Geometries are represented as bars in alphabetical order from
left to right. Error bars represent SEM values. (N=3).
0
5
10
15
20
25
30
3 Hz 10 Hz 16 Hz
Spec
tral
Po
wer
Des
nti
y (a
.u.)
Frequency Bins
Helmholtz Hoberman Rodin Toroid

150
Figure 3.4.3.4: Spectral power density (ordinate; arbitrary units) differences as a function of 3
distinct frequency bins (abscissa) comparing the 4 different physical application geometries
(bars; alphabetical order left-to-right) during the Thomas-EMF application. Error bars
represent SEM values. (N=3).
0
5
10
15
20
25
3 Hz 10 Hz 16 Hz
Spec
tral
Po
wer
Den
sity
(a.
u.)
Freqeuncy Bins
Helmholtz Hoberman Rodin Toroid

151
Differences in 1) mean photon counts across observation periods as a function of manipulation
and 2) SD across observation periods as a function of manipulation, and 3) the spectral power
densities across observation periods as a function of manipulation for data organized in a
within-subjects’ manner were investigated using serial MANOVAs. In all three cases, there
were no significant differences obtained for mean photon counts, standard deviation, or spectral
power density (with 25-Hz bin frequencies) as a function of manipulation (pre-exposure sham,
Thomas-EMF exposure, or post-exposure shams; p>.05). Based upon the results of analyses
conducted on this data organized as between-subjects’ observations, the classification accuracy
for frequency alterations within salient experimental manipulations was examined. Four step-
wise discriminant analyses were used to classify between a single geometry by comparing that
target to all other geometries using a single-step entry method. This methodology only
identifies the largest source of variance in order to differentiate between targets and was
conducted only on spectral characteristics analyzed from each of the recording segments: pre-
exposure sham, Thomas-EMF, post-exposure sham. Results demonstrated, moderate accuracy
in differentiating between 2 out of 4 unique geometries. Results are summarized in table
3.4.3.1:

152
Table 3.4.3.1: Summary of multiple, single-step (Max-steps = 1) discriminant analyses. Data
presented aimed to identify unique statistical features that distinguish between various
geometric configurations of EMF application geometry. Relevant (statistically significant
effects) findings are bolded for convenience.
Geometry Variable Entered
Wilks-λ Χ2 – value p-value Cross-validated Accuracy
Helmholtz
Pre-exposure sham; 2-Hz bin
.686
3.58
.058
75%
Hoberman
Post-exposure sham; 12-Hz bin
.440
7.80
.005
83.3%
Rodin
--------------
--------------
- -------------
- --------------
---------------
Toroid
Thomas-EMF; 16-Hz bin
.256
13.03
3.06·10-4
100%
3.5. Discussion:
The experiments in this chapter have demonstrate that there are unique subtleties that can be
used to distinguish physical application geometry as a factor important on EMF exposures. For
example, when changes in the morphological features of PC-12 cells, such as PME, are used
as the outcome, 2 structural geometries that were wound with copper wire, the Helmholtz coil
and Toroid, did not have an effect when cells were exposed to both forskolin and burst-firing
EMF. In contrast, the two remaining geometries, the Hoberman and Rodin, did demonstrate
unique differences in morphology in PC-12 cells treated with 0.5 µM forskolin and exposed to
burst-firing EMF corresponding to changes in the proportion of cells bearing PME or
multipolar extensions. Exposures to the burst-firing EMF generated using the Hoberman
configuration showed an increase in the proportion of cells bearing plasma membrane
extensions (PME) and multipolar extensions when the field was present as compared to

153
forskolin treatment alone (control). Burst-firing EMF generated using the Rodin coil was
associated with a reduction in the proportion of cells bearing PME and multipolar extensions
relative to sham exposure conditions (i.e., no field present) although both conditions were
associated with significantly greater changes in C12 morphology as compared to control
conditions.
When using the emission of ultra-weak photons from forskolin-treated PC-12 cells cultures as
the endpoint exposure to EMF using different geometries and field conditions (sham v. burst-
firing EMF) taken three days after their treatments, only those cells that received exposure by
the Rodin coil, be it sham or field, demonstrated a net reduction in mean photon counts.
Comparatively, the cells that were exposed to either the sham or burst-firing EMF conditions
generated through the Hoberman geometry had mean photon counts that trended towards
control measures. There is some evidence, from our experiments, to suggest that the lower the
overall photon count, the greater the proportion of differentiated cells.
Data examining ultra-weak photon emission (UPE) profiles from cultures of melanoma cells
were able to successfully differentiate between the 4 different application geometries. In this
study were reported a net increase in background mean photon counts, relative to all other
geometries, for the Hoberman condition during pre-field (sham) recordings. Similar increases
in the standard deviation of the photon emission was also seen. Persinger et al., (2013)
demonstrated that a reduction in the local static magnetic field intensity corresponded to an
increase in spontaneous UPE emitted from a subject’s head. If true, the net increase in local
magnetic activity, as is the case when the appropriate field is being generated through any
device, would result in a net decrease in overall photon intensity. In all instances observed, for
all geometries, when the field was activated there was a net reduction in both the mean photon

154
counts and the standard deviation of the counts that supports the findings previously reported.
It is interesting that when the field has been removed, the counts do not immediately return to
baseline conditions. This effect may be accommodated by results obtained by Karbowski et al.,
(2016). In their experiments, B16-BL6 cells were exposed to patterned pulses of light while
being simultaneously exposed to a patterned EMF prior to having their UPE profiles measured.
There was an increase in the overall UPE intensity corresponding to the wavelength of light
that was presented to cells and that enhancement was sustained for approximately 70 min after
a 60 min exposure. The energy that was released during this time frame was calculated to fall
within the range of energy that was contained within the EMF that was simultaneously exposed
with the light pulses. In the experiments presented in this chapter we did not expose B16-BL6
cells to patterned light pulses, but the net reduction in photon intensity and variability may also
serve to represent a change in the applied EMF energy. If correct, the it is assumed that,
provided our observation accommodated the length of exposure, the UPE counts would return
to baseline around 40 min after the field (Thomas) was terminated.
In addition to the mean photon counts and standard deviation, we showed that the spectral
power differences emitted from the cells (i.e., B16-BL6 cells) were able to successfully
differentiate between application geometries during sham (pre-field) and Thomas – EMF
exposures. The spectral characteristics were binned in 1 Hz increments and it was shown that
3 distinct frequency bins, 3, 10, and 16 Hz, that represent harmonics of calcium ion cyclotron
resonance were differently affected by application geometry. (McLeod et al., 1987; Blackman
et al., 1994; Vorobyov et al., 1998). This observation is further supported by the data indicating
that exposures of cells to the Thomas-EMF acts on calcium signalling, and is congruent with
previous findings (Buckner et al., 2018). Finally, the data could be used to successfully

155
discriminate between a selected target geometry, as compared to all others, based upon unique
UPE spectral characteristics during unique periods of observation.
These results, taken together, suggest that application geometry does in fact paly a role, albeit
minor, in the bio-effectivity of exposures to patterned EMF, at least in the cells lines studied.
Furthermore, discrete differences can be observed in cell morphology (e.g., PC-12 cells) and
correlates with function (i.e., UPE) that can differentiate between different physical structures
through that a patterned EMF has been presented. The evidence collected supports the idea that
structure dictates function even when examining the nature of the application geometry of
patterned EMFs and warrants further exploration.

156
3.6. References:
Baker-Price, L. A., & Persinger, M. A. (1996). Weak, but complex pulsed magnetic fields may
reduce depression following traumatic brain injury. Perceptual and motor skills, 83(2), 491-
498.
Baker-Price, L., & Persinger, M. A. (2003). Intermittent burst-firing weak (1 microTesla)
magnetic fields reduce psychometric depression in patients who sustained closed head injuries:
A replication and electroencephalographic validation. Perceptual and Motor Skills, 96(3), 965-
974.
Blackman, C. F., Blanchard, J. P., Benane, S. G., & House, D. E. (1994). Empirical test of an
ion parametric resonance model for magnetic field interactions with PC‐12
cells. Bioelectromagnetics: Journal of the Bioelectromagnetics Society, The Society for
Physical Regulation in Biology and Medicine, The European Bioelectromagnetics
Association, 15(3), 239-260.
Buckner, C. A., Buckner, A. L., Koren, S. A., Persinger, M. A., & Lafrenie, R. M. (2015).
Inhibition of cancer cell growth by exposure to a specific time-varying electromagnetic field
involves T-type calcium channels. PLoS One, 10(4), e0124136.
Buckner, C. A., Buckner, A. L., Koren, S. A., Persinger, M. A., & Lafrenie, R. M. (2017). The
effects of electromagnetic fields on B16‐BL6 cells are dependent on their spatial and temporal
character. Bioelectromagnetics, 38(3), 165-174.

157
Buckner, C. A., Buckner, A. L., Koren, S. A., Persinger, M. A., & Lafrenie, R. M. (2018).
Exposure to a specific time‐varying electromagnetic field inhibits cell proliferation via cAMP
and ERK signaling in cancer cells. Bioelectromagnetics, 39(3), 217-230.
Burke, H. E. (2012). Handbook of magnetic phenomena. Springer Science & Business Media.
Dotta, B. T., Buckner, C. A., Cameron, D., Lafrenie, R. M., & Persinger, M. A. (2011).
Biophoton emissions from cell cultures: biochemical evidence for the plasma membrane as the
primary source. General Physiology and Biophysics, 30(3), 301.
Dotta, B. T., Murugan, N. J., Karbowski, L. M., Lafrenie, R. M., & Persinger, M. A. (2014).
Shifting wavelengths of ultraweak photon emissions from dying melanoma cells: their
chemical enhancement and blocking are predicted by Cosic’s theory of resonant recognition
model for macromolecules. Naturwissenschaften, 101(2), 87-94.
Dotta, B. T., Lafrenie, R. M., Karbowski, L. M., & Persinger, M. A. (2014). Photon emission
from melanoma cells during brief stimulation by patterned magnetic fields: is the source
coupled to rotational diffusion within the membrane. General Physiology and Biophysics, 33,
63-73.
Dotta, B., Buckner, C., & Lafrenie, R. (2016a). Photon Emissions as differential indicators for
different components of protein kinase A (PKA) in transfected murine melanoma cells. Arch
can Res, 4(3), 10-21767.

158
Dotta, B. T., Karbowski, L. M., Murugan, N. J., Vares, D. A. E., & Persinger, M. A. (2016b).
Ultra-weak Photon Emissions Differentiate Malignant Cells from Non-Malignant Cells In
Vitro. Archives of Cancer Res, 4(2).
Dotta, B. T., Vares, D. A., Buckner, C. A., Lafrenie, R. M., & Persinger, M. A. (2014).
Magnetic field configurations corresponding to electric field patterns that evoke long-term
potentiation shift power spectra of light emissions from microtubules from non-neural
cells. Open Journal of Biophysics, 4(04), 112.
Fleming, J. L., Persinger, M. A., & Koren, S. A. (1994). Magnetic pulses elevate nociceptive
thresholds: Comparisons with opiate receptor compounds in normal and seizure-induced brain-
damaged rats. Electro-and Magnetobiology, 13(1), 67-75.
Frey, U., & Morris, R. G. (1997). Synaptic tagging and long-term
potentiation. Nature, 385(6616), 533-536.
Haas, H. L., & Rose, G. (1982). Long‐term potentiation of excitatory synaptic transmission in
the rat hippocampus: the role of inhibitory processes. The Journal of physiology, 329(1), 541-
552.
Hameroff, S., & Penrose, R. (2014). Consciousness in the universe: A review of the ‘Orch
OR’theory. Physics of life reviews, 11(1), 39-78.

159
Karbowski, L. M., Murugan, N. J., & Persinger, M. A. (2016). Experimental evidence that
specific photon energies are “stored” in malignant cells for an hour: the synergism of weak
magnetic field-LED wavelength pulses. Biology and Medicine, 8(1), 1.
Komaki, A., Khalili, A., Salehi, I., Shahidi, S., & Sarihi, A. (2014). Effects of exposure to an
extremely low frequency electromagnetic field on hippocampal long-term potentiation in
rat. Brain research, 1564, 1-8.
Mach, Quoc Hao, and Michael A. Persinger. "Behavioral changes with brief exposures to weak
magnetic fields patterned to stimulate long-term potentiation." Brain research 1261 (2009):
45-53.
Malenka, R. C., & Nicoll, R. A. (1999). Long-term potentiation--a decade of
progress?. Science, 285(5435), 1870-1874.
Martin, L. J., Koren, S. A., & Persinger, M. A. (2004). Thermal analgesic effects from weak,
complex magnetic fields and pharmacological interactions. Pharmacology Biochemistry and
Behavior, 78(2), 217-227.
McLeod, B. R., Smith, S. D., & Liboff, A. R. (1987). Calcium and potassium cyclotron
resonance curves and harmonics in diatoms (A. Coeffeaformis). Journal of Bioelectricity, 6(2),
153-168.
Murugan, N. J., Karbowski, L. M., & Persinger, M. A. (2014). Weak burst-firing magnetic
fields that produce analgesia equivalent to morphine do not initiate activation of proliferation

160
pathways in human breast cells in culture. Integrative Cancer Science and Therapeutics, 1(3),
47-50.
Persinger, M. A., Dotta, B. T., Saroka, K. S., & Scott, M. A. (2013). Congruence of energies
for cerebral photon emissions, quantitative EEG activities and~ 5 nT changes in the proximal
geomagnetic field support spin-based hypothesis of consciousness. Journal of Consciousness
Exploration & Research, 4(1).
Rose, G. M., David M. Diamond, K. Pang, and T. V. Dunwiddie. "Primed burst potentiation:
lasting synaptic plasticity invoked by physiologically patterned stimulation." In Synaptic
plasticity in the hippocampus, pp. 96-98. Springer, Berlin, Heidelberg, 1988.
Simon, R. H., & Arbo, T. E. (1986). Morphine increases metastatic tumor growth. Brain
research bulletin, 16(3), 363-367.
Vorobyov, V. V., Sosunov, E. A., Kukushkin, N. I., & Lednev, V. V. (1998). Weak combined
magnetic field affects basic and morphine-induced rat's EEG. Brain Research, 781(1-2), 182-
187.

161
Chapter 4
4 Physical Characterization of the Nature of Electromagnetic Field Application Geometry
4.1 Abstract:
The role played by physical application geometry as a facet of electromagnetic field (EMF)
exposure is an underdeveloped concept that has been subjected to limited experimentation.
Provided that the concept of structure dictates function is relevant to EMF exposure it is
suggested that an investigation of the physical properties of EMF geometry are necessary. In
this study, we provide a series of investigations aimed to determine the salient effects that
physical application geometry plays in terms of producing bio-effective EMFs. Results are
suggestive of the idea that unique constructions can appreciably (statistically) alter background,
ambient static (DC) EMF intensity, especially when the structure approaches a dome-like
geometry. Further experimentation demonstrated no statistically significant differences for
other physical measures although this does not rule out the importance of individual
differences. The observed effects have been likened to alterations in the signal-to-noise ratio
or Weber’s concept of the just noticeable differences as a potential mechanism of action.
4.2. Introduction:
The greatest tool developed by human kind has been the scientific method. Systematic
evaluation of systems (physical, chemical, biological, etc.) and their corresponding reactions
to precise/accurate manipulations of contributing factors have provided a detailed, although
not an exhaustive, understanding of the description of the Nature of the physical world. One of
the cornerstone ideas underlying many systems is the assertion that structure dictates function.

162
By extension, the structure of the experiment can influence the function of the system under
observation. The aforementioned statement is best exemplified in terms of the double slit
experiment for electrons and photons, whereby the parameters of the experiment can suggest,
based on the interpretation of the results, that the observed stimuli either behave as a particle
or a wave (Bach et al., 2013; Eibenberger et al., 2013; Selleri, 1992).
With respect to biological systems, the concept that structure dictates function can be used in
our examination of the brain. For example, the structure of the hippocampus can be likened to
two concentric ring-like, intercalated c-like structures that condenses into nanometer
separations allowing for the transition from electrical impulses to chemical representations of
the same information. Furthermore, the hippocampus has demonstrated the ability to undergo
adult neurogenesis within its subdivisions of the cornu ammons (CA) fields, as well as
possessing Schaffer collaterals allowing for re-entrant processes and prolongation of the same
stimulus along its consolidatory path to more crystallized long-term representations (i.e.,
memory) (Riedel and Micheau, 2001; Morris et al., 2007). Additional examples of structure
dictating function, at the level of the brain, include Heschl’s gyrus and the lateral geniculate
nucleus of the thalamus. Heschl’s gyrus, along its course, has a tonotopic representation of the
frequencies of sound sensed by the ear, in the medial – lateral and anterior –posterior axes,
where high frequencies are presented most medially (and posterior) while low frequencies are
represented more laterally (and posterior) (Humphries et al., 2010; Talavage et al., 2004). The
observed organization of Heschl’s gyrus is reflected, although inverted, in the cochlea that
discriminates frequencies and translates them to corresponding nervous impulses. With respect
to the lateral geniculate nucleus (LGN) of the thalamus, it is composed of 6 layers, alternating
between grey and white layers, that can be subdivided into the magnocellular components
(inner layers 1, 2) and the parvocellular portions (outer layers 3 to 6) (Reid and Shapley, 1992;

163
Garey and De Courten, 1983; Crosby et al., 1962). The magnocellular division of the LGN is
responsible for colour-blind vision and rapid conduction, whilst the parvocellular layers are
associated with lower velocity conduction and are associated with the conduction of colour
vision (Crosby et al, 1962; Parent, 1996). Visual processing and perception, to allow for
binocular vision, has divided the visual fields into ipsilateral and contralateral features, that are
structurally maintained at the level of the LGN whereby layer 2,3, and 5 process ipsilateral
visual information and layers 1,4, and 6 process contralateral information along with its
integration into primary, secondary, and tertiary visual areas (BA 17, 18, 19, etc.) (Crosby et
al., 1962; Parent, 1996). Outside the brain, we can demonstrate the concept of structure
dictating function in a number of organ systems. In examining the stomach, whose role in
digestion is the acidification of foodstuffs that have been passed by way of the esophagus
(another specialized tube structure whose function is to pass food along to the stomach
(Thibodeau et al., 2004). Acidification during digestion of the food supply is derived from
specialized cells oxyntic (parietal) cells that allow for the production and release of
hydrochloric acid in the lumen of the stomach (Forte et al., 1981; Sedar and Friedman, 1961).
As a consequence of the acidifying function of the stomach, there are biological fail-safes that
have evolved including goblet cells that can secrete an alkaline mucus (Jass and Filipe, 1981;
Thibodeau et al., 2004) so that the acidic environment does not destroy the epithelial lining of
the organ and ultimately having the acidic solution leak into adjacent structures (organs) and
digest the animal from the inside out. An additional function of the stomach, required to
promote digestion, is churning, a process arising from the peristaltic contraction of muscle
fibers embedded within the structural layering (tunics) of the organ.
It has been shown that exogenous application of discrete physiologically relevant (i.e.,
functional) stimuli can impact the structure of the system for that the stimulus is directed. For

164
instance, Mach and Persinger (2009) demonstrated that the application of a weak intensity
EMF, patterned to mimic LTP in hippocampal slices, facilitated learning of an inhibitory task
for animals that were exposed to this field during the task but a reduction in spatial memory in
trained animals that were exposed 30 min before or after training. The authors theorized that
the observed differences were being driven by hippocampal saturation. Comparatively, the
application of a burst-firing EMF, derived from the activity of a collection of amygdaloid-
hippocampal cells, has demonstrated functional changes that mimic the activity recorded from
the mesial basal temporal lobe structures including: visual sensations, ego-alien intrusions, and
the sensed presence (Cook and Persinger, 1997; Persinger and Healey, 2002; Persinger, 2003).
Although we typify the alterations that result from the application of a patterned EMF as a
functional alteration, it is truly the temporal construction or arrangement of parameters such as
stimulus (point) duration, inter-stimulus interval, and intensity that have been shown cause the
observed effects. It was only through systematic and rigorous investigation and
experimentation, the application of our most valuable tool, that has allowed temporal structure
of EMFs to be fully appreciated.
We have argued that just as temporal structure of EMFs can alter the biological function of
systems so too should the physical structure in that the EMF is being presented have an effect.
Some research has pointed to some validity/fidelity of the idea that the structure of the of the
EMF-generating device can alter the effectiveness of the patterned EMF. For example, Martin
and Persinger (2003) provided evidence that the physical structure through that an EMF is
generated is important when examining the analgesic response in rats exposed to burst-firing
EMF presented through a simple solenoid (heterogeneous field) versus a Helmholtz coil
(homogeneous field). Results showed that maximum analgesia was obtained when the
biologically relevant field was presented by the heterogeneous field-generating device. In the

165
previous chapter, we demonstrated that unique structural organizations of EMF-generating
devices, had effects on photon emission measures by B16-BL6 cells and PC-12 cells treated
with 0.5 µM forskolin, as well as in the morphological features of the treated PC-12 cells.
Given this evidence it would be prudent to discern to what degree the physical application
geometry contributes to the observed effects of EMF exposures on biological systems.
In this group of experiments, we have rigorously assessed the physical attributes of 4 distinct
EMF-generating devices. Herein we suggest comparing changes measured in the static,
ambient magnetic environment in response to different geometric configurations bound in
copper wire to Faraday-like cages, as well as to the ability of unique geometries wrapped in
copper wire to respond to weak environmental magnetic fields, to deflect or impede an incident,
biologically relevant propagating EMF, and to contribute to changes in exposure conditions for
that effects have been previously demonstrated by assessing static magnetic field changes.
4.3. Methods:
4.3.1. Physical Description of the Electromagnetic Application Geometries:
The devices corresponding to the following geometries were each constructed using 100-ft
(~33 m) of 18 AWG primary, insulated copper wire. A total of 4 different electromagnetic
(EM) physical application geometries were created and are identified as: Helmholtz,
Hoberman, Rodin, and Toroid coils. Photos of the corresponding physical application
geometries are included in Appendix E1 – E4.

166
Geometry#1: Helmholtz coil
The Helmholtz coil was fabricated out of two independent coils that were each wrapped
continuously with 50-ft of wire wound around two fused 25.4 cm diameter plastic crochet
hoops. The independent coils were then mounted to a wooden frame (L: 29.2 cm, W: 21.6 cm)
that served as the base of the apparatus. The coils were mounted and separated by a block of
wood (13.34 cm) affixed at the superior pole. The construction of the base and the upper mount
were completed using Elmer’s carpenter’s glue. The coils were separated by their radius (12.7
cm) in order to replicate the original design proposed by Herman von Helmholtz, the original
creator of this geometry. Resistance of the entire coil was assessed to be 0.8 Ohms by way of
a Victor 70C digital multimeter.
Geometry #2: Hoberman coil
The Hoberman coil was derived from a collection of six overlapping plastic, circular rings that,
as a whole, results in an icosododecahedron with 20 triangular faces and twelve pentagonal
faces with a maximal diameter of 30.48 cm. For our purposes, the original Hoberman sphere
was bifurcated, wrapped with electrical tape, and finally wrapped in one continuous fashion
with 100-ft of 18 AWG primary, insulated copper wire. The resulting Hoberman coil has a base
diameter of 30.48 cm and a dome height of 15.7 cm accommodating 10 triangular and 6
pentagonal faces. Coil resistance was 4.5 Ohms as measured by a Victor 70C digital
multimeter.

167
Geometry #3: Rodin coil
The Rodin coil was constructed by fusing 2, 25.4 cm diameter plastic, circular crochet hoops,
and continuously wrapping them with 50-ft of wire in a counter-clockwise fashion parallel to
the circumferential plane. Following the completion of the circumferential wrapping, the
Rodin coil was then perpendicularly wrapped with the remaining 50-ft of wire. Conceptually,
the resulting aggregate encompassed an inner solenoid wrapped by an outer toroid. The
resulting leads of the inner solenoid and outer toroid were soldered together to form a single
input lead so as to activate both components simultaneously. The resulting resistance of the
Rodin coil, as measured by a Victor 70C digital multimeter, was 0.4 Ohms.
Geometry #4: Toroid coil
The Toroid coil was created by wrapping 100-ft of wire around a plastic, circular 25.4 cm
diameter crochet hoop. Wrappings were perpendicular to the circumference of the plastic
backbone and were wrapped in a counter-clockwise fashion. The resulting resistance of the
Toroid coil was 1.0 Ohms as verified by a Victor 70C digital multimeter.
Comparator Geometries:
In addition to the four primary target, physical application geometries, there were 8 different
comparator geometries that were developed in order to assess and compare the differences
obtained between background static magnetic field intensities measured in the various
application geometries. Our working hypothesis was that any difference, or resulting change
in the intensity of the background magnetic field would arise in the same way that changes in

168
the field are observed in a Faraday cage. A Faraday cage is built from specific materials (i.e.,
copper alloys) with a physical structure that causes attenuation of a magnetic field as measured
in the “cage”. Here we constructed 8 different Faraday-like containers using 25.4 cm diameter
plastic salad dishes. One salad dish served as a physical control (i.e., no copper wrappings),
while the remaining 7 salad bowls were covered with either a copper foil mesh or a copper
weavemesh. Four devices were generated using copper foil mesh corresponding to 25, 50, 75
and 100% surface area coverage. Three devices were created using the copper weavemesh that
included 25, 50, and 100% surface area coverings. The copper weavemesh described by the
manufacturer (FerrierWire) to be used in electromagnetic interference and radio frequency
(EMIRFI) shielding, filtering, and straining applications had a wire diameter of 0.04 cm, with
a wire opening diameter of 0.08 cm. All copper foil mesh and copper weavemesh applications
were affixed to the plastic salad containers using Elmer’s glue. Photographic representations
of each of the 8 comparator geometries can be found in Appendix F.
4.3.2. Determining The Change in the Earth’s Static Magnetic Field Intensity as a Function of
Physical Application Geometry:
The static intensity of the horizontal and orthogonal vectors of Earth’s electromagnetic field
(EMF) were measured using a tri-axial, vector FMV400 fluxgate magnetometer from
MacIntyre Electronic Design Associates (MEDA). The magnetometer has a sensitivity of 1 nT
with a range that extends to +/-100,000 nT (1 Gauss) with a +/-0.25% accuracy and an upper
limit sampling rate of 1 Hz using the associated software platform. Data was collected in two
different locations at Laurentian University, Sudbury, ON (longitude 80.78 W, latitude 46.62
N). The first locus of measure (N1; Neurochemistry) is situated in the basement laboratory of
Laurentian University’s Science II building. The second locus (N2; consciousness laboratory

169
chamber) was an acoustic chamber and Faraday cage in the basement of Laurentian
University’s Science II building that was separated from N1 by approximately 30 m. Data was
collected from all 12 different geometric organizations of copper wire and copper mesh
coverings (4 primary geometries and 8 comparator geometries). The measurement periods were
divided into three, 5-minute segments that included a pre-geometry baseline, a geometry
present test measure, and a post-geometry baseline measure. All data were acquired at a
sampling rate of 1 Hz and all trials were conducted independently. Values for the angles of
magnetic declination and inclination were manually recorded at the outset and at the
termination of each recording period. For each of the four primary target geometries, as well
as the 7 comparator geometries, there was a minimum of an N =3 measurements at each of the
two loci. Photos of the experimental setup for the measurement set-up in location N1
(neurochemistry) are provided in Appendix G.
4.3.3. Determining the Change in the Static Vectorial Intensity of an Incident, Time-Varying
EMF as a Function of Physical Application Geometry
Data was acquired using a tri-axial, FMV400 vector fluxgate magnetometer with a sampling
rate of 1 Hz and was recorded using a personal laptop computer and associated software. The
FMV400 magnetometer was placed at a distance of 30 cm from the opening of a 38 cm X 33
cm X 27 cm plastic milk crate that was wrapped in a single layer with 305 m of 30 AWG
primary, insulated copper wire. The milk crate coil served as the source generator for the
inducing, exogenous, frequency modulated (FM) EMF and will be herein referred to as the
inducing coil. The pattern of the inducing FM-EMF (also called the Thomas-EMF) was
generated by converting 859 integer values between 0 and 256 to a corresponding voltage of
-5 V to +5V (127 = 0V) using a digital-to-analog converter that supplied current to the inducing

170
coil. The resulting FM-EMF consisted of 18 doublet peaks, where each singlet peak was 6 msec
in duration, with gradually increasing intervals between 3 msec (for the first 5 repeats) to 120
msec for the last 5 repeats. The resulting frequency modulation for the FM-EMF pattern ranged
from 25 Hz for the first 5 repeats to 6 Hz for the last 5 repeats. The duration of that each point
of the 859 integer series was presented through the inducing coil was set to 3 msec and served
as the point duration (PD). The inter-stimulus interval (ISI), that corresponds to the temporal
delay between successive presentations of the 859-point pattern was also set to 3 msec. The
cycle duration for the 859-point series FM-EMF was approximately 2.58 s when the PD and
ISI were set to 3 msec respectively. The resulting FM-EMF was continuously presented during
the induction phase. A diagrammatic representation of the FM-EMF pattern can be found in
Appendix H1.
The experimental design for this investigation consisted of five, 2-minute recording periods
that were organized in an A-B-A-B-A design. For this experiment, the recording period
designated by ‘A’ indicated that the inducing field was not present (i.e., the equipment was on
but no current was applied to the inducing coil) while the recording period designated ‘B’
indicated that the inducing field was active (i.e., current was being supplied to the inducing
coil). There were five devices representing different EM application geometry conditions that
were placed directly over the recording magnetometer; control (no geometry), Helmholtz,
Hoberman, Rodin, and Toroid. Each EM application geometry condition was replicated across
10 independent trials (N=10). A photo and schematic representation of the experimental set-up
has been provided and can be found in Appendix H2.
171
4.3.4. Assessing the Change in Induced Voltage through Various Physical Application
Geometries in a Faraday Cage and Acoustic Chamber
The goal of this investigation was to discern the capacity of each geometry to act as an
induction coil as a means of assessing the peak frequencies, and the intensity, of Earth’s
geomagnetic field. Previous research has demonstrated that the discrete, reliable fundamental
and harmonic frequencies of the Earth’s magnetic field are a consequence of lightning
discharge between the Earth’s surface and the inner layer of the ionosphere, associated with
geomagnetic activity (Williams, 1992; Cherry, 2002; Schlegel and Füllekrug, 1999). Here, we
aim to investigate whether the structural geometry of the recording device can impact the
ability to detect or interfere with the geomagnetic fundamental and harmonic frequencies.
All four magnetic geometry devices (the Helmholtz, Hoberman, Rodin, and Toroid devices)
were simultaneously measured for discrete fluctuations in geomagnetic harmonic frequencies.
The magnetic geometry devices attached to a Mitsar Model 201 quantitative
electroencephalographic (QEEG) amplifier by way of silver-silver chloride cup sensors
coupled to alligator clips that were directly attached to the copper wound coils. Data was
acquired from all 4 geometries simultaneously and measured at a sampling rate of 500 Hz,
using WinEEG software with low cut filter set to DC, high cut filter set to 30 Hz, and a notch
filter between 55 -75 and 110 -130 Hz for the duration of 30 minutes. There were N=8
independent trials conducted between 20:00 and 23:00 DST local time. All recordings were
conducted in an acoustic chamber and Faraday cage that has been previously demonstrated to
reduce the static component of Earth’s magnetic field by approximately 50% (Persinger et al.,
2015). A pictorial representation of the experimental set-up is provided in Appendix I.

172
4.3.5. Characterizing the Change in the Static EM Background Intensity as a Function of
Application Geometry in a Standard Incubator
To examine the effects of our target EMF geometry devices on cell culture environments, we
first assessed the output capacity of each magnetic geometry device in a standard exposure
incubator. The standard incubator had an atmospheric composition of 95% oxygen and 5%
CO2 that was maintained at 37ºC and was located on the 7th floor of the Science II building at
Laurentian University, Sudbury, ON (longitude 80.78 W, latitude 46.62 N). For recordings, the
FMV400 fluxgate magnetometer was positioned in the center of the incubation unit.
Measurements of the horizontal and orthogonal magnetic vector intensities were sampled at 1
Hz increments, with the inner and outer doors of the incubator closed, over the course of the
experiment. The experimental measurement period consisted of an A-B-A-B-A repeated
measures observation alternating between Sham (A: no field) and Burst (B: field) cycled at 5-
minute intervals. There were five magnetic application geometries (Control/no EM geometry,
Helmholtz, Hoberman, Rodin, and Toroid) that were placed directly over the recording
magnetometer during the recording sessions. Each geometry (with the exception of the control
condition) was connected to a DAC that produced a burst-firing pattern of current that
generated an EMF through the respective coils for the field condition.
The burst-firing EMF was generated from 230 points ranging from 0 to 256, that were
converted to voltage equivalents of -5V to +5V (127 = 0V) by way of a custom constructed,
adjustable digital-to-analog converter and modified mini-audio amplifier. The point duration
(PD) and inter-stimulus interval (ISI) for this pattern were set to 3 and 3,000 msec, respectively.
EMF intensities resulting from the application of current into the respective physical EM
application geometries were verified using an AC milliGauss meter (AlphaLabs) that was set

173
such that the effective intensities ranged from 300 – 500 nT. The duration of the 230-point
burst-firing pattern with PD set to 3 msec was 690 msec while the cycle duration lasted 3.69 s.
For each combination of physical EM application geometry (Control, Helmholtz, Hoberman,
Rodin, and Toroid devices) and field presentation (burst-firing field or no field) a total of N=5
independent replicates were conducted. A diagrammatic representation of the experimental set-
up can be found in Appendix J.
4.3.6. Methods of analyses:
4.3.6.1. Determining The Change in Earth’s Static Magnetic Field Intensity as a Function of
Physical Application Geometry:
Raw data for the strength of the magnetic field was collected for the X, Y, and orthogonal
components of the Earth’s magnetic field and was assessed at 1 Hz. Additional data including
the angle of inclination, declination, and the computed Resultant Earth’s EMF intensity were
recorded. All data pertaining to EMF measures were root-mean-square transformed to assess
the time-varying average and imported into SPSS for statistical analysis. We aimed to measure
the difference in the intensity of the background geomagnetic EMF fluctuations between when
the geometry device was present versus absent. Therefore, difference scores were computed
for each of the magnetic vectors (X, Y, orthogonal, and Resultant) in reference to pre-exposure
baselines (e.g., prior to the application of the target geometry over the recording device) for
each of the geometry devices.

174
Normality tests revealed several outliers (> 3 STD) that were subsequently removed prior to
analysis. The resulting sample size for each geometry was N= 9 for Helmholtz, N = 10 for the
Hoberman, N = 11 for the Rodin, and N = 12 for the Toroid. Measures were taken in 2 distinct
locations [Neurochemistry (N1) and the and the chamber in the consciousness laboratory (N2)]
as outlined in the methods section. A number of comparator devices were created that consisted
of varying degrees of copper weavemesh (0, 25, 50, 75, and 100% coverage; N1, N2) wrapped
around plastic salad bowls, as well as devices where copper fly mesh was wrapped at varying
concentrations around plastic salad bowls (0, 25, 50, and 100%; N1, N2). These comparator
geometries were subjected to the same data processing as the target geometries.
4.3.6.2. Determining the Change in the Static Vectorial Intensity of an Incident, Time-Varying
EMF as a Function of Physical Application Geometry
The data corresponding to the intensity of the X, Y, and orthogonal vectors, as well as
computed Resultant intensities, for measurement either in the presence or following the
removal of the inducting field was subjected to a root-mean-square transformation. In addition,
the standard deviation of the cycled inducting field was also computed for each condition. All
computed variables were entered into SPSS for statistical analysis. Here we aimed to assess a
number of parameters and ascertain any differences for the following comparisons: 1) between
root-mean-square intensity measures for the magnetic vectors of pre and post exposure
measures, 2) between the mean of the change of intensity when the inducing field was present
versus absent for each the magnetic vectors, 3) between the standard deviation when the
inducting field was present, and 4) the change in deviation when the inducting field was present
and absent as a function of geometry. Statistical analyses to confirm differences between
geometries was assessed by way of a one-way analysis of variance. Data examining the

175
differences between recording phases were first explored using a MANOVA with intensity as
dependent variables, geometry as the between-subject’s variables, and recording phase as the
within subject’s factors. Any significant findings were further evaluated by systematically
conducting paired samples t-tests controlling for each geometry with a consideration for
significance when p<.001 after alpha level correction.
4.3.6.3. Assessing the Change in Induced Voltage through Various Physical Application
Geometries in a Faraday Cage and Acoustic Chamber
Data corresponding to the simultaneous recording of the 4 distinct EMF application geometries
in the Faraday cage were extracted using two different methods, 1) 60-second raw recordings
were extracted and spectrally analyzed within the WinEEG platform, and 2) 60-second raw
recordings were manually extracted, imported into SPSS, standardized (i.e., z-transformed),
and subjected to spectral analysis. Both extraction methods were conducted on 3 different time
points within the 30-minute recording period corresponding to minutes 1, 15, and 30 of the raw
record. Extraction method 1 yielded power measures (uV2/Hz) for 6 distinct frequency bins
akin to the classical EEG frequencies: delta (1 – 4 Hz), theta (4 – 7 Hz), alpha (8 – 13 Hz), beta
1 (14 – 20 Hz) beta 2 (21 – 30 Hz), and gamma (30+ Hz). In addition to power measures, peak
frequency values for each of the classical EEG bins were extracted and their means for the 3
recording phases were computed for comparisons. The date for the power derived from
extraction method 1 was entered into a MANOVA with geometry as the between-subject’s
factors and frequency bin (6) and phase of measurement (3) as the within subject’s factors. The
computed mean for the peak frequencies were entered into a one-way analysis of variance to
determine any differences between geometry devices. For extraction method 2, the resultant
spectral data was binned into 1 Hz increments between 1 and 50 Hz (1 Hz = 1.00 Hz to 1.99

176
Hz) for each of the recording phases before being subjected to a MANOVA with geometry as
the between-subject’s factors and frequency (50) and recording phase (3) as the within subject’s
factors. Tukey’s post-hoc tests were employed to discern the driving factors when one-way
analyses of variance were considered significant while serial one-way analyses of variance and
paired samples t-tests served as the post-hoc analyses to discern driving forces when
MANOVAs were conducted.
4.3.6.4 Characterizing the Change in the Static EM Background Intensity as a Function of
Application Geometry in a Standard Incubator
Three independent replicates measuring changes in the background intensity were completed
for each condition. The data was extracted, imported into Excel for computation of the root-
mean-square and standard deviation values for the intensity of each magnetic vector (X, Y,
orthogonal, and Resultant) for the duration of the 5-minute recording segments and
subsequently exported into SPSS for statistical analysis. Any global changes between each of
the recording segments (i.e., field off v. field on) were of interest and therefore were compared
to the mean of each intensity for the respective segments. Data was subjected to multivariate
analysis of variance with appropriate post-hoc analyses to determine the source of any
interaction.
4.4. Results
4.4.1. Determining The Change in Earth’s Static Magnetic Field Intensity as a Function of
Physical Application Geometry:

177
One-way analysis of variance examining the change in the RMS and mean intensities for the
X, Y, Z and resultant field vectors revealed significant differences in the intensity of the
orthogonal component [F (3,42) = 4.63, p = .007, Ω2-est = 0.26] and resultant [F (3,42) = 5.03, p =
.005, Ω2-est = 0.28] for the Earth’s field as a function of geometry. Post-hoc analysis suggested
that the effect was being driven by the difference in the change of the orthogonal and resultant
intensities between the Hoberman geometry and the Helmholtz and Toroid geometries as can
be seen in figure 4.4.1.1. Of note, similar results were obtained when looking at mean intensity
measures. In order to assess significant within-subject’s changes in each of the magnetic field
parameters. Paired samples t-tests were conducted that revealed that only the Hoberman
geometry demonstrated significant (p<.05) differences in the mean orthogonal and resultant
intensities when comparing the geometry present condition to the pre-baseline condition. In
addition, using the same type of analysis to examine the change in intensities from geometry
present condition to the post-exposure measures, only the Hoberman geometry demonstrated
an overshoot in intensity for the Z [t (9) = -5.75, p = 2.76·10-4, MD = -50.14] and resultant [t
(9) = -5.39, p = 4.37·10-4, MD = -54.45] intensity vectors.

178
Figure 4.4.1.1: The change in intensity (nT) of the X, Y, Z, and resultant coordinates for Earth’s
static magnetic field as a function of magnetic geometry. Error bars represent SEMs.
Measure of the magnetic field vectors showed that there was a difference in the change of the
static geomagnetic field as a function of the geometry device used for the experiment. After
outlier removal (SD>+/-3), there were significant differences observed for the change in the
intensity of the orthogonal component [F (12,85) = 1.98, p = .038, Ω2-est = 0.25] and the resultant
[F (12,85) = 2.192, p = .021, Ω2-est = 0.26] intensity of Earth static magnetic field as can be
observed in Figure 4.3.1.2. The differences obtained were due to a greater reduction in Earth
-60
-50
-40
-30
-20
-10
0
10
20
30
Helholtz Hoberman Rodin Toroid
chan
ge in
inte
nsi
ty (
nT)
Magnetic geometry
X Y Z Resultant

179
static magnetic field (Z and R) were measured with the Hoberman geometry as compared to
the 75% covered mesh covered salad bowl.
Figure 4.4.1.2: The change of root-mean-square intensity in the rectangular coordinates (X, Y,
Z, and Resultant) of Earth’s static magnetic field. Error bars represent SEMs. FC refers to
copper mesh covered salad bowls, whilst FMFC refers to fly-mesh encapsulated salad bowls.
Minimum N=4 for each measure. Each bar has a minimum of 2 different locations embedded
within it.
-60
-50
-40
-30
-20
-10
0
10
20
30
40
chan
ge in
th
e R
MS
Inte
nsi
ty (
nT)
Magnetic Geometry
X Y Z RESULTANT

180
4.4.2. Determining the Change in the Static Vectorial Intensity of an Incident, Time-Varying
EMF as a Function of Physical Application Geometry
A comparison of the differences in the mean intensity shifts between when the induced field
was present versus when it was absent, the degree of deviation of the mean when the inducting
field was present, and the change in deviation between the presence and absence of the inducing
field yielded no statistically significant results (p >.05) as a function of the geometry device
(table 4.4.2.1). Differences in the spatial organization (intensity) contained within each
magnetic geometry device was assessed by comparing the pre- to the post-experimental
baselines. Exploratory MANOVA demonstrated differences in recording phases for the Y [F
(2,64) = 698.72, p <.001, η2 = 0.96], Z [F (2,64) = 457.50, p <.001, η2 = 0.93], and Resultant [F
(2,64) =456.88, p <.001, η2 = 0.93] EMF intensity vectors. Paired samples t-test results
demonstrated that there were no significant differences between pre- and post-experimental
manipulations as a function of geometry device when alpha level corrections were applied
(table 4.4.2.2.).

181
Table 4.4.2.1: Summary of the means and SEMs (brackets) for the standard deviation (SD) for
when the inducting field was active, the change background intensity (field on v. off), and the
change in the standard deviation (field on v. off) for each magnetic vector as a function of
geometry.
Field SD (SEM) Mean change intensity (SEM) Mean change in SD
(SEM)
X-axis Y-
axis
Z-
axis
X-
axis
Y-axis Z-axis Resultant X-
axis
Y-axis Z-axis
Control 4.06
(0.71)
35.37
(0.97)
19.81
(0.77)
-1.55
(1.50)
-56.28
(3.47)
-34.60
(2.22)
-36.43
(2.39)
0.39
(1.14)
19.93
(1.86)
8.83
(2.45)
Helmholtz 3.78
(0.86)
36.06
(1.59)
20.61
(1.37)
-0.27
(1.48)
-60.59
(1.89)
-32.27
(2.94)
-34.03
(2.92)
1.00
(1.10)
22.79
(1.02)
11.86
(1.68)
Hoberman 2.86
(0.46)
34.24
(0.65)
19.19
(0.99)
1.21
(2.83)
-57.96
(1.34)
-28.61
(3.03)
-30.09
(3.28)
0.86
(0.37)
21.26
(0.78)
11.85
(0.63)
Rodin 3.49
(0.67)
35.56
(1.30)
19.77
(0.96)
-0.12
(1.39)
-53.63
(3.76)
-31.09
(1.73)
-32.64
(1.87)
1.71
(0.46)
21.21
(1.35)
11.94
(0.83)
Toroid 3.10
(0.59)
33.11
(1.23)
18.34
(1.08)
-1.79
(1.98)
-59.35
(5.75)
-33.88
(2.44)
-35.83
(2.57)
0.46
(1.07)
14.11
(5.18)
10.54
(1.67)

182
Table 4.4.2.2: The mean difference, in nT, between static background magnetic field intensity
comparing the pre-exposure baseline to post-exposure baseline conditions as a function of
geometry.
Y-axis Z-axis Resultant
Mean
Diff
T-
statistic
P-
value
Mean
Diff
T-
statistic
P-
value
Mean
Diff
T-
statistic
P-
value
Control 6.04 1.76 .011 6.43 3.25 .014 6.54 3.00 .020
Helmholtz 8.45 2.48 .048 7.31 2.07 .084 7.60 2.05 .087
Hoberman 6.85 2.02 .083 .066 .018 .986 -0.34 -0.087 .933
Rodin 0.95 0.151 .885 4.93 2.66 .032 4.87 2.93 .022
Toroid 1.89 0.279 .792 4.41 2.54 .143 4.27 1.64 .162
Significance was considered when p<.001 after alpha-level correction. Data explored after
significant within-subject’s time effect was revealed by way of exploratory MANOVA.
4.4.3. Assessing the Change in Induced Voltage through Various Physical Application
Geometries in a Faraday Cage and Acoustic Chamber
There were no differences in power and the frequency as a function of the different application
geometries for measures of induced voltage through the different magnetic geometry devices
measured simultaneously. Data corresponding to classical WinEEG extractions were subjected
to a MANOVA with the classical EEG bins and the measurement period as the within-subject’s
factors was conducted for both differences in frequency and power. Neither measure
demonstrated a significant main effect for geometry, either as a between-subject’s measure or
within-subjects’ measure. These effects were not significant when considering the arithmetic

183
mean of the 3 observation periods. Peak frequencies and power (SPD)for each of the
geometries can be observed in table 4.4.3.1.
Table 4.4.3.1: Displays the mean power (SPD; uV2/Hz) and frequency (Hz) across the three
recording phases (beginning, middle, end) of the 30-minute continuous recording across N=7
independent trials. SEMs are reported within the brackets.
Classical EEG Frequency Bins
Delta Theta Alpha Beta1 Beta2 Gamma
Geometry f SPD f SPD f SPD f SPD f SPD f SPD
Helmholtz 3.68
(0.15)
36.34
(31.67)
4.06
(0.14)
89.86
(79.55)
9.85
(0.15)
127.50
(89.34)
18.35
(0.62)
49.06
(29.27)
20.54
(0.27)
64.15
(33.85)
30.97
(0.65)
25.20
(11.65)
Hoberman 3.72
(0.12)
90.99
(86.48)
3.92
(0.01)
164.99
(141.39)
9.80
(0.15)
147.67
(118.81)
18.75
(0.32)
41.17
(30.10)
20.80
(0.42)
65.70
(42.49)
33.19
(1.43)
24.60
(16.17)
Rodin 3.91
(0.00)
14.34
(9.27)
4.20
(0.18)
74.60
(48.14)
9.74
(0.34)
73.82
(35.50)
18.26
(0.61)
38.62
(17.97)
21.89
(1.06)
121.26
(58.25)
32.89
(1.45)
68.68
(39.01)
Toroid 3.35
(0.41)
95.36
(47.38)
3.97
(0.06)
396.71
(256.25)
9.29
(0.41)
396.03
(212.10)
18.22
(0.82)
62.19
(18.31)
20.74
(0.41)
147.21
(50.25)
32.97
(1.31)
46.92
(13.81)

184
The raw data extracted according to method 2 was processed for each of the 3 observation periods
(min 1, 15, and 30) from a 30-minute measurement across N=7 independent trials. The data was
standardized, and subjected to spectral analysis prior to being divided into 50, 1 Hz bins (1 Hz bin
= spectral frequencies 1.00 – 1.99 Hz) and then subjected to MANOVA for spectral power density
(SPD) by geometry (4 levels) with each observation period (3 levels) and the frequency (50 levels)
as within-subjects’ factors. This analysis revealed no between- or within-subjects’ effect of
geometry (p>.05) but a main effect for frequency [F (49,1127) = 20.49, p <.001, pη2 = 0.47). Data not
shown.
4.4.4. Characterizing the Change in the Static EM Background Intensity as a Function of
Application Geometry in a Standard Incubator
Serial (3) MANOVAs were used to identify differences in the background vector intensity
measured in a standard incubator when the burst-firing EMF pattern was presented through each
of the magnetic geometry devices versus when the field was absent. Analyses of the identified
significant within-subjects’ field effects for the X-axis [F (1,8) = 6.02, p = .040, η2 = 0.43] and the
orthogonal [F (1,8) = 51.50, p< .001, η2= 0.87] but not for the Resultant or the Y-axis (p>.05)
vectors. The data is summarized in table 4.4.4.1. Furthermore, we found no difference in the mean
SD for the burst-firing EMF versus no field conditions for any of the geometries. Serial
MANOVAs revealed no significant within-subject’s field effect for the orthogonal magnetic vector
(p>.05), but did reveal significant within-subjects’ main effects for the field vectors in the X-axis
[F (1,8) = 6.20, p= .038, η2= 0.44] and Y-axis [F (1,8) =19.20, p = .002, η2= 0.71], table 4.3.4.2. There
were no geometry-specific effects noted.

185
Table 4.4.4.1: Mean intensities (nT) comparing the field and no field being generated through each
EMF physical application geometry. There is an enhancement when the field is on.
X-axis Z-axis
Mean
(SEM)
MD(SEM) T-stat P-
value
Mean
(SEM)
MD(SEM) T-
stat
P-value
No
field
74772.25
(676.12)
-4.23
(1.34)
-3.16
.007
80714.20
(140.48)
6.72 (1.38)
4.86
2.52·10-4
Field 74776.48
(675.39)
80707.48
(140.77)
Table 4.4.4.2: Mean of the SD for 5-min recordings of intensity for each of the magnetic vectors.
MD refers to the mean difference obtained from the statistical analysis.
X-axis Y-axis Z-axis
Mean
(SEM)
MD(SEM) T-
stat
P-
value
Mean
(SEM)
MD(SEM) T-
stat
P-
value
Mean
(SEM)
MD(SEM) T-stat P-
value
No
field
7.60
(0.41)
1.32 (0.7)
2.33
.040
11.38
(1.33)
-6.04
(1.49)
-
4.06
.002
27.31
(2.33)
-0.63
(0.64)
-0.97
.352
Field 6.27
(0.31)
17.42
(1.11)
27.93
(7.22)

186
4.5. Discussion:
The results determined in this series of investigations support the idea that differences between
physical application geometries can have subtle and discrete effects on magnetic field
presentations. Here, we have demonstrated that specific geometries, primarily the Hoberman or
dome-like structure, can influence the static (DC) background electromagnetic intensity. These
observations were specific for vector direction and the resultant change caused a reduction of
approximately 20-30 nT. Although these are relatively weak changes, these features are important
because similar intensity fluctuations in geomagnetic storm intensity have been associated with a
myriad of behavioural and biological effects (Persinger and Saroka, 2014; Mulligan and Persinger,
2012; Michon and Persinger, 1997; Suess and Persinger, 2001; Persinger, 2001; O’Connor and
Persinger, 1997; Bureau and Persinger, 1995; Booth and Persinger, 2005). For example, changes
in geomagnetic storm activity has been associated with changes in mood, spontaneous death
following induced limbic seizures, and the occurrence of parapsychological phenomena. The
mechanism of action, although undetermined in these investigations, is hypothesized to be due to
a reduction in ambient noise leading to an increase in the signal-to-noise, or clarity, of the applied
signal. Consider the analogy of a room full of people who are all engaged in conversation. The
ability to discern a single individual’s content amongst the cacophony would be almost
incomprehensible. However, if the multitude of difference conversations are reduced to whisper
levels and the selected individual’s voice remained at a constant volume (i.e., normal talking level),
the ability to appreciate their message, as compared to all others, would be enhanced.

187
It is prudent to determine the relative reduction in energy contained within this system. The
equation to determine the energy contained within a volume of a magnetic field is defined by:
E = 𝐵2
2𝜇·V
Where E is the energy (kg·m2s-2), B is the magnetic field intensity, in Tesla (kg·A-1s-2), µ is the
permeability of free space (1.256·10-6 kg·m·A-2s-2) and V is the volume (m3).
The volume of a dome is defined by:
V = 1/6πh (3a2 + h2)
Where V is the volume (m3), h is the height of the dome (m), and the a is the radius of the base
(m)
For the Hoberman sphere used in these experiments, the height was 0.15 m and radius of 0.15 m
and would yield a volume equal to 7.065·10-3 m3. If the resulting change in magnetic field intensity
contained within this volume is 20 nT (2.0·10-8 kg·A-1s-2), then the energy would be within the
order of 1.13·10-12 J. The observed reduction in overall energy is the able to provide the opportunity
for any exogenous sources to be detected in terms of Weber’s concept of the just noticeable
difference that is based upon the reference sensory level as defined by the equation:
k = ∆𝐼
𝐼

188
Where k is a constant, based upon the system under observation, I is the original intensity of the
stimulus, and ΔI is change in intensity required for the change to be perceived.
A proportional reduction in the original intensity of the stimulus, or the ambient environmental
sources acting on the system under observation, would result in a net reduction in the change
required in order for the system to “perceive” or respond to the difference applied to it. Here, a
reduction in ambient geomagnetic intensity would lower the threshold for the intensity of an
applied EMF that is required to have an appropriate effect on the system. Thus, weaker fields
would be more impactful provided our hypothesis is correct.
In terms of the ability to effectively shield, or impede, the propagation of an inducting field we
have demonstrated that these geometries have minor influences on the variability (standard
deviation) of the inducing field’s intensity although these effects do not rise to statistical
significance. Reduction in variability, in this manner, can be likened to a homogenization of the
incoming signal content or to a reduction in complexity of the generated signal. In either case, the
fidelity of the incoming signal is reduced and may lose some of its effective qualities as it is
impacted by the geometry during its propagation. In this same experiment, small differences, albeit
not statistical, were measured between pre- and post-induction measures and may be indicative of
a EM storing capacity within different arrangements/configurations of copper wire. Verification is
required to further detail and elaborate on this assertion. One experimental feature that may assist
in answering this question would be to examine continuous and prolonged induction exposures
since intermittent presentations may not have appropriately saturated the local EM containment
environment.

189
Discrete differences were observed between frequency components and power measures when the
physical application geometries were measured for voltage fluctuations over the course of a 30-
min observation while immersed in a reduced geomagnetic environment. Here again, differences
were not statistical. These discrete alterations between the magnetic geometry devices around that
copper wire was wound may result in standing waves or resonant cavities that would differ
depending on the shape the object, and could be detected as very small differences in intensity or
SPD. While these differences did not rise to statistical significance the idea that there are any
differences between geometries may be salient. One could postulate that the impact of structure,
especially for those structures that significantly overlap, would be discrete and could be obfuscated
by statistical tools. Examples, from cosmology and biology, can be used to defend this point of
view.
Consider the distortion of the fabric of space-time caused by the presence of large masses
interspersed throughout the Universe, and modeled by Einstein’s equation for general relativity:
R = 8 𝜋 𝐺
𝑐4 T
Where R is the curvature (m-2), G is the gravitational constant (6.67·10-11 m3·kg-1s-2), c is the speed
of light (3.0·108m·s-1) and T is the stress energy tensor (kg·m-1s2).
Of importance is the stress-energy tensor, and its relation to the energy, and ultimately mass, of
the stellar body. If, for example, we compared the space-time distortion of our sun to another star
with twice the mass but roughly the same volume, although the change in R is twice that for the

190
larger star, the overall change in curvature even though it is real and exists is so small that
statistically it would be irrelevant. However, even these minute changes in local space-time
curvature can be shown to significantly impact the paths of orbiting bodies and the bending of light
around the star. In a more biologically relevant context, if we examine lethal doses of certain
pharmaceuticals, like fentanyl, and compare them to therapeutic dosages, the difference of a few
micrograms is the difference between effective pain management and death. The difference of a
few micrograms to a dose of 2 mg would be statistically inconsequential but the resulting effects
(i.e., death) would be remarkably impactful.
In our last investigation, there were no differences obtained between each unique magnetic
geometry device when a biologically relevant field was being generated through these devices.
What was determined, however, was that there was a reduction in the intensity in the orthogonal
vector with a concomitant enhancement in the Y-axis intensity when the field was present. These
changes were ubiquitous across geometries. When variability was assessed, we observed a trend
toward homogeneity (decreased variability) in the X-axis vector, with an associated trend toward
heterogeneity (increased variability) in the Y-axis vector but we did not detect any change in the
orthogonal vector.
We liken our findings to a change in the signal-to-noise ratio when the field is present. Here, the
noise is operationalized as the mean intensity, while the signal is described as the variability.
However, rather than the analogy of a conversation we adopt the metaphor of a choir performing
to a talkative audience. When the choir is not performing, conversations within the audience
dominate but when the choir commences its performance the crowd begins to quiet down (overall

191
reduction in intensity). As the performance progresses, one begins to appreciate harmonies being
vocalized by certain members of the choir (homogenization of signal as measured by a reduction
in variability in our experiment) while other portions of the choir are disharmonious singing unique
notes (heterogeneity or increased variability in the signal). Taken together, and finishing the
analogy, the intermingling of harmonies from one area of the choir combined with the
disharmonious aspects of another, as a gestalt, leads to a beautiful aggregate of enchanting
melodies.
In summary, unique geometric configurations of aggregates of copper wire built to serve as
magnetic field generating devices demonstrate unique characteristics in terms of their effects on
altering the ambient EM environment. These changes allow for reduced environmental noise in
the order of 20-30 nT, allowing for a reduction in the intensity of change required for the system
to identify and respond just noticeable effects. Applied EMF stimuli through these geometries may
not be different depending in the application investigated. Further research may reveal statistical
features of EM storing capacity, under different experimental conditions, as well as demonstrating
unique frequency and power distributions of induced voltage fluctuations.

192
4.6 References:
Bach, R., Pope, D., Liou, S. H., & Batelaan, H. (2013). Controlled double-slit electron
diffraction. New Journal of Physics, 15(3), 033018.
Booth, J. N., Koren, S. A., & Persinger, M. A. (2005). Increased feelings of the sensed presence
and increased geomagnetic activity at the time of the experience during exposures to transcerebral
weak complex magnetic fields. International Journal of Neuroscience, 115(7), 1053-1079.
Bureau, Y. R. J., & Persinger, M. A. (1995). Decreased latencies for limbic seizures induced in
rats by lithium-pilocarpine occur when daily average geomagnetic activity exceeds 20
nanoTesla. Neuroscience letters, 192(2), 142-144.
Cherry, N. (2002). Schumann Resonances, a plausible biophysical mechanism for the human
health effects of Solar. Natural Hazards, 26(3), 279-331.
Cook, C. M., & Persinger, M. A. (1997). Experimental induction of the “sensed presence” in
normal subjects and an exceptional subject. Perceptual and Motor Skills, 85(2), 683-693.
Crosby, E. C. T., Humphrey and EW Lauer 1962 Correlative Anatomy of the Nervous System.
Eibenberger, S., Gerlich, S., Arndt, M., Mayor, M., & Tüxen, J. (2013). Matter–wave interference
of particles selected from a molecular library with masses exceeding 10000 amu. Physical
Chemistry Chemical Physics, 15(35), 14696-14700.

193
Forte, J. G., J. A. Black, T. M. Forte, T. E. Machen, and J. M. Wolosin. "Ultrastructural changes
related to functional activity in gastric oxyntic cells." American Journal of Physiology-
Gastrointestinal and Liver Physiology 241, no. 5 (1981): G349-G358.
Garey, L. J., & De Courten, C. (1983). Structural development of the lateral geniculate nucleus
and visual cortex in monkey and man. Behavioural Brain Research, 10(1), 3-13.
Humphries, C., Liebenthal, E., & Binder, J. R. (2010). Tonotopic organization of human auditory
cortex. Neuroimage, 50(3), 1202-1211.
Jass, J. R., & Filipe, M. I. (1981). The mucin profiles of normal gastric mucosa, intestinal
metaplasia and its variants and gastric carcinoma. The Histochemical journal, 13(6), 931-939.
Mach, Quoc Hao, and Michael A. Persinger. "Behavioral changes with brief exposures to weak
magnetic fields patterned to stimulate long-term potentiation." Brain research 1261 (2009): 45-
53.
Martin, L. J., & Persinger, M. A. (2003). Spatial heterogeneity not homogeneity of the magnetic
field during exposures to complex frequency-modulated patterns facilitates analgesia. Perceptual
and motor skills, 96(3), 1005-1012.

194
Michon, A. L., & Persinger, M. A. (1997). Experimental simulation of the effects of increased
geomagnetic activity upon nocturnal seizures in epileptic rats. Neuroscience Letters, 224(1), 53-
56.
Morris, R., Amaral, D., Bliss, T., & OKeefe, J. (2007). The hippocampus book. Anderson, P, 872.
Mulligan, B. P., & Persinger, M. A. (2012). Experimental simulation of the effects of sudden
increases in geomagnetic activity upon quantitative measures of human brain activity: validation
of correlational studies. Neuroscience Letters, 516(1), 54-56.
O'connor, R. P., & Persinger, M. A. (1997). Geophysical variables and behavior: LXXXII. A
strong association between sudden infant death syndrome and increments of global geomagnetic
activity—possible support for the melatonin hypothesis. Perceptual and motor skills, 84(2), 395-
402.
Parent, A. (1996). Carpenter's human neuroanatomy. Williams & Wilkins.
Persinger, M. A. (2001). The neuropsychiatry of paranormal experiences. The Journal of
neuropsychiatry and clinical neurosciences, 13(4), 515-524.
Persinger, M. A., & Healey, F. (2002). Experimental facilitation of the sensed presence: Possible
intercalation between the hemispheres induced by complex magnetic fields. The Journal of
nervous and mental disease, 190(8), 533-541.

195
Persinger, M. A. (2003). The sensed presence within experimental settings: implications for the
male and female concept of self. The Journal of Psychology, 137(1), 5-16.
Persinger, M. A., & Saroka, K. S. (2014). Quantitative support for convergence of intrinsic
energies from applied magnetic fields and “noise” fluctuations of Newton’s gravitational value
within the human brain. International Letters of Chemistry, Physics and Astronomy, 19(2), 181-
190.
Persinger, M. A., Dotta, B. T., Karbowski, L. M., & Murugan, N. J. (2015). Inverse relationship
between photon flux densities and nanotesla magnetic fields over cell aggregates: Quantitative
evidence for energetic conservation. FEBS open bio, 5(1), 413-418.
Reid, R. C., & Shapley, R. M. (1992). Spatial structure of cone inputs to receptive fields in primate
lateral geniculate nucleus. Nature, 356(6371), 716.
Riedel, G., & Micheau, J. (2001). Function of the hippocampus in memory formation: desperately
seeking resolution. Progress in Neuro-Psychopharmacology and Biological Psychiatry, 25(4),
835-853.
Schlegel, K., & Füllekrug, M. (1999). Schumann resonance parameter changes during high‐energy
particle precipitation. Journal of Geophysical Research: Space Physics, 104(A5), 10111-10118.

196
Sedar, A. W., & Friedman, M. H. F. (1961). Correlation of the fine structure of the gastric parietal
cell (dog) with functional activity of the stomach. The Journal of Cell Biology, 11(2), 349-363.
Selleri, F. (Ed.). (1992). Wave-particle duality (p. 187). London: Plenum Press.
Suess, L. A. H., & Persinger, M. A. (2001). Geophysical variables and behavior:
XCVI.“Experiences” attributed to Christ and Mary at Marmora, Ontario, Canada may have been
consequences of environmental electromagnetic stimulation: implications for religious
movements. Perceptual and motor skills, 93(2), 435-450.
Talavage, T. M., Sereno, M. I., Melcher, J. R., Ledden, P. J., Rosen, B. R., & Dale, A. M. (2004).
Tonotopic organization in human auditory cortex revealed by progressions of frequency
sensitivity. Journal of neurophysiology, 91(3), 1282-1296.
Thibodeau, G. A., Patton, K. T., & Wills. (2004). Structure & function of the body. St Louis:
Mosby.
Williams, E. R. (1992). The Schumann resonance: A global tropical
thermometer. Science, 256(5060), 1184-1187.

197
Chapter 5
5.1 General Discussion
Throughout the experiments presented, we have described unique features that were associated
with the temporal structure of electromagnetic fields and the material (physical) sources from that
these field are generated. In our discovery, we have characterized the effectiveness of burst-firing
EMF, a pattern that was derived from the activity of amygdaloid-hippocampal cells, and its
synergisms with respect to sub-micromolar concentrations of forskolin in a cell model of
neuritogenesis. In this endeavour, we were successful at determining the most appropriate pattern
as well as discussing the relevance of exposure duration, identified the role of intensity and timing,
and attempted, albeit in vein, to demonstrate the biomolecular course of action that accommodates
the observed changes with respect to concomitant treatments to burst-firing EMF and chemical
stimulation with forskolin. We have likened our findings to that of a well constructed narrative
and presented this as an analogy for the resonance-like phenomenon that has been attributed to
what we have measured. Caution is recommended in interpreting these results and utilizing this
analogy as more data may provide conflicting evidence suggestive of a more appropriate
mechanism.
Our findings suggest that the pattern (described as the content of a narrative) of EMF exposure is
important to the activation of PC-12 cells to respond with extensions of their plasma membrane
(i.e., neurites) secondary to chemical stimulation with forskolin. While the volume (intensity) and
the speed at that the narrative is read (alterations in the point duration and inter-stimulus delay, or
successive presentations of the same pattern) contribute very little to the effectiveness of the

198
patterned EMF, at least in this model of observation. Duration of exposure also seems to mitigate
and contribute, at least in part, to the effectiveness of the target pattern with trends towards a
greater proportion of plasma membrane extensions measured with longer durations. If one
assumes, as is the case with list-learning tasks or rote memorization, that the greater the number
of iterations of the important information the more likely that the message is to be appropriately
interpreted and remembered. It was also determined that different forms of EMF energy (i.e.,
rotating EMF vs. patterned EMF generated through solenoids) produce different results. If we
continue with the analogy of a narrative of instructions that direct a system to respond in a certain
way, then we can consider the form of EMF energy as the “language” of the narrative. Consider
that we liken the system of observation to the auditory cortex of an individual whose primary
language of communication and comprehension is English with no exposure to other languages.
Then, and only then, if the language of instruction is presented in English will they respond
congruently to the directions presented and accurately perform whatever task is requested.
However, if the same set instructions were presented to the English speaker in German, the
likelihood that the individual will accurately complete the task is reduced. Similarly, if the energy
or the form of the EMF is incorrect or incongruent with the system that it is designed to affect that
system may respond in an unpredictable manner or will not react to the stimulus.
What was also determined was that distinct apparatuses wrapped in copper wire to create unique
geometric configurations through that patterned EMFs are generated, can impact the effectiveness
of said field. The changes observed with respect to unique structures around that copper wire is
wrapped either enhanced or reduced the proportion of plasma membrane extensions in a PC-12
model of neuritogenesis, as well as affecting measurements of ultra-weak photon emission (UPE)

199
from melanoma cultures. In some way, the physical nature of the EMF-generating device has
impacted correlates of function (i.e., differentiation and UPE spectral profiles), in such a way that
the differences obtained can identify the equipment used during the experiment.
We have argued, at least from the perspective of biology, that structure dictates function and
provided a series of examples that supported this assertion. Considering that the geometric
configuration around that copper wire is wrapped may impact the biological relevance of an
applied EMF further investigation is required. If we adapt our analogy of a narrative or language
and shift it to the perspective of creating music by way of an instrument, we may be able to shed
some light on these features. Consider an acoustic guitar and a guitarist who is instructed to
repeatedly play a series of musical scales. In a standard setting, with standard equipment, each of
the notes ring clearly and produce harmonious and concordant tones. Now, if we were to introduce
an altered instrument whose housing was cuboid rather than bulbous in shape, and the artist was
asked to play the same scales again the perception of the notes would be different and may be
interpreted as discordant. Changes in the structure will ultimately change the function, even
slightly. The greater the change in a structure the greater the noticeable difference.
Our results suggest that unique geometric organizations around that copper wire is wrapped,
especially when that shape approaches a dome, can reduce the ambient, static magnetic
background. Furthermore, the individual geometries respond in subtle, albeit not statistically
significant, manners to a myriad of physical manipulations. This would suggest that the geometries
used in the experiments respond in a manner similar to that of individual differences. Again, we
have defended that even though the observed differences may be small and statistically

200
insignificant, that they are not inconsequential. As a whole, this project demonstrates, at least
provisionally, that the equipment employed as the source generator for EMFs is important to the
bio-effectivity of the pattern of that EMF. Future endeavours should aim to identify whether the
complexity of the physical application geometry can influence 3-dimensional models, as all
investigations conducted in this thesis examined the relevance in electromagnetic field physical
application geometry in 2-dimensional samples.
5.2 Implications and Future Directions
The results demonstrated in this thesis have shown the potential to use patterned EMF in
combination with forskolin to promote neurite outgrowth in PC-12 cells. The implications of such
work would constitute the foundation for EMF-mediated therapeutic intervention especially in
Parkinson’s disease (PD). A hallmark neurophysiological correlate of PD is the deterioration of
midbrain dopaminergic cells most notably within the substantia nigra (Lang and Obeso, 2004).
Reconstituting dopamine supplies, either by promoting cell survival or with cell replacement,
would be of marked benefit to the individual. It is important to note that PC-12 cells induced to
form neurites as demonstrated in the model outlined in this document, have been shown to respond
to dopamine stimulation and actively undergo dopamine neurotransmission (Kozminki et al., 1998;
Loder and Melikian, 2003; Ohare-Imaizumi et al., 1991; Pothos et al., 1998). Cell replacement,
either by direct injection or vector assisted implantation, with PC-12 cells followed by treatment
with forskolin or nerve growth factor (NGF) in combination with exposures to burst-firing EMF
may serve as a cost-effective alternative for the treatment of PD. However, in vivo studies would
have to be conducted in order to assess the efficacy of this methodology.

201
Prior to in vivo analysis, functional features of PC-12 cells induced to promote neuritogenesis by
way of forskolin and burst-firing EMF exposures, must be identified. In this vein, it would be
prudent to assess any and all alterations in dopamine synthesis and neurotransmission and typify
these reactions as approximating normal, healthy functioning cells. In so doing, we would be able
to examine whether burst-firing EMF exposure is represented functionally in the activity of these
cells by assessing pulse-rate using patch-clamp technology. These investigations may demonstrate
the influence that point duration and inter-stimulus interval have on the activity of these cells, a
feature that may have been overshadowed by solely measuring morphology. Comparing EMF
treated samples to what is normally occurring in fully functional systems would allow us to
potentially tailor our treatments to best suit the requirements of the system. Functional analysis
(i.e., assessing firing rate, dopamine concentration, dopamine response reactions, etc.) of these
cells would not only rule out changing the temporal structure of the applied pattern, it would also
demonstrate the potential contribution of intensity.
An additional feature in PD is neurodegeneration subsequent to L-DOPA treatment as well as the
naturally occurring changes associated with disease progression (Meredith et al., 2008; Zhang et
al., 2005). It would be of interest then to challenge our PC-12 cells induced to generate neurites
when presented with the combination of forskolin an burst-firing EMF with L-DOPA or MPP+ (a
chemical agent that induces PD-like symptoms in vivo) and measure cell integrity and survival as
some data has been collected has shown that induced PC-12 cells respond by undergoing apoptosis
when challenged with L-DOPA (Park et al., 2012; Velez-Pardo et al., 1997; Walkinshaw and
Waters, 1995) and MPP+ (Xu et al., 2017; Santos et al., 2015; Zhu et al., 2012). These

202
investigations would provide insight to the neuroprotective value of burst-firing EMF on these
cells. Based on the findings in this latter study, we may design additional experiments, such as the
investigation of burst-firing EMF treatment following forskolin or NGF induced neuritogenesis,
as an adjunct therapy to L-DOPA treatment or as a standalone treatment regime for neuroprotection
against neurodegeneration.
Although the data collected here has implicated pharmaco-magnetic synergisms for neurite
formation, no underlying mechanism has been identified. We propose additional investigations to
effectively discern the biomolecular mechanism of action in a step-wise fashion. In the first phase,
completing a treatment course with burst-firing EMF and inhibitors, as outlined in Chapter 2,
would serve as a screening method for the identification of downstream effects that drive the
observed morphological changes. In the second phase, manipulating specific targets identified by
first phase experiments such that they become constitutively active/inactive and exposing these
systems to our pharmaco-magnetic stimulations would be revealing. These latter investigations
would provide more insight to other potential chemical agents that could be used as a more cost-
effective replacement for forskolin. Additionally, identifying the appropriate pathway of action
and sequential timing of the events within the cascade leading to neurite outgrowth, would allow
for the development of specifically patterned EMF configurations and application regimes that
could completely circumnavigate chemical manipulation. Our data collection was also limited in
duration (1 hour exposures) to the burst-firing EMF and single treatments of forskolin. We suggest
further exploration into the duration of EMF exposure by assessing lengthier treatments (i.e., 6,
12, and 24 hours), multiple EMF exposures over the course of neurite development (i.e., 6 hours
per day for 3 days), multiple stimulations with forskolin (i.e., 0.5 µM a day for 3 days), and the

203
combination of such manipulations. The aim, again, is to ultimately demonstrate the utility of
patterned EMF exposures to best maximize neurite production, higher order branching, and inter-
cellular contacts, as a means to identify the effective treatment regime necessary to assist in PD
management.
204
5.3 References
Kozminski, K. D., Gutman, D. A., Davila, V., Sulzer, D., & Ewing, A. G. (1998). Voltammetric
and pharmacological characterization of dopamine release from single exocytotic events at rat
pheochromocytoma (PC-12) cells. Analytical chemistry, 70(15), 3123-3130.
Lang, A. E., & Obeso, J. A. (2004). Challenges in Parkinson's disease: restoration of the
nigrostriatal dopamine system is not enough. The Lancet Neurology, 3(5), 309-316.
Loder, M. K., & Melikian, H. E. (2003). The dopamine transporter constitutively internalizes and
recycles in a protein kinase C-regulated manner in stably transfected PC-12 cell lines. Journal of
Biological Chemistry, 278(24), 22168-22174.
Meredith, G. E., Sonsalla, P. K., & Chesselet, M. F. (2008). Animal models of Parkinson’s disease
progression. Acta neuropathologica, 115(4), 385-398.
Ohara-Imaizumi, M. I. C. A., Nakazawa, K., Obama, T. O. M. O. K. O., Fujimori, K., Takanaka,
A. K. I. R. A., & Inoue, K. A. Z. U. H. I. D. E. (1991). Inhibitory action of peripheral-type
benzodiazepines on dopamine release from PC-12 pheochromocytoma cells. Journal of
Pharmacology and Experimental Therapeutics, 259(2), 484-489.
Park, K. H., Park, H. J., Shin, K. S., Choi, H. S., Kai, M., & Lee, M. K. (2012). Modulation of PC-
12 cell viability by forskolin-induced cyclic AMP levels through ERK and JNK pathways: an

205
implication for L-DOPA-induced cytotoxicity in nigrostriatal dopamine neurons. Toxicological
Sciences, 128(1), 247-257.
Pothos, E. N., Przedborski, S., Davila, V., Schmitz, Y., & Sulzer, D. (1998). D2-Like dopamine
autoreceptor activation reduces quantal size in PC-12 cells. Journal of Neuroscience, 18(15),
5575-5585.
Santos, N. A. G., Martins, N. M., Sisti, F. M., Fernandes, L. S., Ferreira, R. S., Queiroz, R. H. C.,
& Santos, A. C. (2015). The neuroprotection of cannabidiol against MPP+-induced toxicity in PC-
12 cells involves trkA receptors, upregulation of axonal and synaptic proteins, neuritogenesis, and
might be relevant to Parkinson's disease. Toxicology in Vitro, 30(1), 231-240.
Velez‐Pardo, C., Jimenez Del Rio, M., Verschueren, H., Ebinger, G., & Vauquelin, G. (1997).
Dopamine and iron induce apoptosis in PC-12 cells. Pharmacology & toxicology, 80(2), 76-84.
Walkinshaw, G., & Waters, C. M. (1995). Induction of apoptosis in catecholaminergic PC-12 cells
by L-DOPA. Implications for the treatment of Parkinson's disease. The Journal of clinical
investigation, 95(6), 2458-2464.
Xu, J., Gao, X., Yang, C., Chen, L., & Chen, Z. (2017). Resolvin D1 attenuates Mpp+-induced
Parkinson disease via inhibiting inflammation in PC-12 cells. Medical science monitor:
international medical journal of experimental and clinical research, 23, 2684.

206
Zhang, W., Wang, T., Pei, Z., Miller, D. S., Wu, X., Block, M. L., ... & Zhang, J. (2005).
Aggregated α-synuclein activates microglia: a process leading to disease progression in
Parkinson’s disease. The FASEB Journal, 19(6), 533-542.
Zhu, Q., Wang, J., Zhang, Y., & Sun, S. (2012). Mechanisms of MPP+-induced PC-12 cell
apoptosis via reactive oxygen species. Journal of Huazhong University of Science and Technology
[Medical Sciences], 32(6), 861-866.
207
Appendices
Appendix A1: Photographic representation of the 4-D exposure apparatus from different points of
view. Front (top left); Top (Top right), Corner (bottom left), side (bottom right).

208
Appendix A2: Photographic representation of the 4-D application geometry with
corresponding computer generated patterned EMF (computer) and custom built digital-to-
analog converter (DAC; blue box).

209
Appendix B1: Photo of the Resonator.

210
Appendix B2: Technical specifications and description of the Resonator
(12) United States Patent
Shallcross
US009156709B2
(10) Patent No.: US B2
(45) Date of Patent: Oct. 13, 2015
(87) PCT Pub. No.:
W02007/065257
PCT Pub. Date: Jun. 14, 2007
(65) Prior Publication Data
US 2008/0296162 Al Dec. 4, 2008
(30) Foreign Application Priority Data
Dec. 6, 2005 (CA) 2526977
(51) Int. Cl.
C02F 1/48 (2006.01)
C02F 1/00 (2006.01)
A 61N 2/06 (2006.01)
U.S.C. 154(b) by 1186 days. (Continued)
(21) Appl. No.: 12/096,063 FOREIGN PATENT
DOCUMENTS
(22) PCT Filed: Dec. 6, 2006 CA 2526977 Al 4/2006 CA 2488776 Al 6/2006
(86) PCT No.: PCT/CA2006/001984
§ 371
(2), (4) Date: Jun. 4, 2008
OTHER PUBLICATIONS
(54) MULTI-ROTATOR MAGNETIC RESONATOR (56) References Cited
EMBODYING SACRED GEOMETRY
(76) Inventor: Kim Shallcross, Milton (CA) U.S. PATENT DOCUMENTS
8/1999 Srail et al. 335/284 7/2000 Saho et al. Notice: Subject to any disclaimer, the term of this8/2000 Saho
et al. patent is extended or adjusted under 351/2001 Kim

211
A61N 2/12 (2006.01)
HOIF 7/02 (2006.01)
(52) U.S. Cl. CPC . C02F 1/005 (2013.01); A61N2/06 (2013.01); A61N2/12 (2013.01); C02F 1/481 (2013.01),
HOIF 7/0294 (2013.01)
(58) Field of Classification Search CPC C02F 1/005; C02F 1/48; C02F 1/481 C02F 1/482; 2/06; A61N 2/12 USPC
335/306; 210/222Q23•, 600/9 See application file [Or complete search history. Wikipedia: Magnet Therapy, Dec. 2, 2011, pp. I-5.· Wikipedia: Magnetic water treatment, Dec. 2, 2011, pp. I-4.· Pitkänen, About Strange Effects Related to Rotating Magnetic Systems, pp. 1-
13 (undated).
(Continued)
Primary Examiner — Ramon Barrera
(74) Attorney, Agent, or Firm — Harness, Dickey & Pierce, P.L.C.
(57) ABSTRACT
A magnetic resonator is provided that has a support structure and a plurality of roller assemblies mounted thereto for rotation about respective axes ofrotation that are generally parallel one to another. Drive means are coupled to the roller assemblies to rotate each of the roller assemblies about its respective axis of rotation relative to the support structure. Each roller assembly houses a plurality of magnets disposed along respective axes of the roller assemblies. The plurality of magnets are grouped in a plurality of first and second arrangements with a first arrangement being interspersed between a pair of second arrangements. At least one of the first and second arrangements incorporates a pattern or shape based on sacred geometry.
11 Claims, 7 Drawing Sheets
132
US B2 Page 2
(56) References Cited
U.S. PATENT DOCUMENTS
3/2001 Seale et al. 8/2001 Yoshifusa et al.
6,323,647 Bl 11/2001 Anderson et al. 11/2009 Shallcross

212
of

213

214

215

216

217

218
2

219
MULTI-ROTATOR MAGNETIC
RESONATOR Sacred geometrical patterns are patterns
constructed using EMBODYING SACRED GEOMETRY the sacred geometrical ratios, such as
exemplified by the "Seed of Life" pattern, used in the description of
preferred CROSS-REFERENCE TO RELATED embodiments set out below. Other sacred
geometrical shapes APPLICATION and patterns include, without limitation,
pentagons, pentagrams, hexagrams, equilateral
triangles, squares, rectangles This application is the U.S. national phase of
PCT Appln. with sides having a 2: I ratio, vesicapisces and 3-
dimensional No. PCT/CA2006/001984 filed Dec. 6, 2006, that
claims structures such as the pyramid and the cathara
grid. Other priority to Canadian application 2,526,977 filed
Dec. 6, 2005. 10
shapes, patterns and structures will be known to
those versed FIELD OF THE INVENTION in sacred geometry.
The present invention relates to devices that
utilize mag- SUMMARY OF THE INVENTION
netic fields arising from the rotation of magnets,
that In very general terms, the present invention
recognizes that devices may be useful in the field ofpurilication
and healing.
15 a significantly more eflèctive field may be
realized in a mag-
BACKGROUND OF THE INVENTION netic resonator embodying sacred geometry by
repeating a magnetic pattern based on sacred
geometry axially along a A variety of devices have been proposed for the
purpose of rotating roller and by utilizing a plurality of
rollers arranged parallel to one another. purifying water through the use of magnetic
fields. Most
20 More particularly, a magnetic resonator is
provided that purifying devices are stagnant magnets, few are
rotating and has a support structure and a plurality of roller
assemblies require contact with one or more rotating magnets
within a mounted thereto for rotation about respective
axes of rotation vessel containing the water to be purified. In
contrast, Appli- that are generally parallel one to another. Drive
means are cant has previously invented magnetic
purification devices coupled to the roller assemblies to rotate each of
the roller that require only that the substance to be purified
be near
25 assemblies about its respective axis of rotation
relative to the the device. Applicant's earlier inventions are
exemplified in support structure. Each roller assembly houses a
plurality of Applicant's Canadian Patent Application Nos.
2,488,776 and 2,526,977. magnets disposed along respective axes of the
roller assem-

220
Applicant's earlier inventions recognize that
using a plu- blies. The plurality of magnets are grouped in a
plurality of first and second arrangements with a
first arrangement being rality of magnets arranged in patterns that
conform to
30 interspersed between a pair of second
arrangements. At least "sacred geometry" (that is discussed in more
detail below) one of the first and second arrangements
incorporates a pat- is significantly more effective than the simple
rotation of a bar tern or shape based on sacred geometry.
magnet. Nevertheless, despite Applicant's
advances to date, The first arrangement of magnets may be a
"seed of life" there is a desire for even more efficient and
compact devices
pattern. for purifying such things as food, water, air and
soil and direct
35 The second arrangement of magnets may
include a plural- application to human and animal body surfaces
for healing. ity of magnets disposed generally equidistantly
about the The term "sacred geometry" does not refer to any
religious respective axes of rotation in a generally
pyramid or cone- significance. In contrast, the term "sacred
geometry" is a shaped pattern or shape with a vertex of the
pyramid or cone well-known term of art that refers to a number of
basic facing the first arrangement.
geometrical patterns and sequences that reoccur
in nature.
40 The magnets in the second arrangement may
have discern- While some of the patterns may have been used
in religious ible front and rear faces on opposite sides of a
longitudinal rituals because of the belief that such patterns
have a funda- axis. The magnets may be arranged with the
longitudinal axes mental connection with nature and humanity, this
is not the lying along the pyramid or cone shape. Each
magnet may be locus of the present invention. rotated by an equal amount in a common
direction from its There are numerous publications that discuss
sacred
45 neighbour whereby diametrically opposed
magnets have geometry. Exemplary ones include The Ancient
Secret of the their respective front and rear Faces Facing in
generally per- Flower of Lilè (W. I and Il) by 'Drunvalo
Melchizedec and pendicular directions.
the Internet (see [Or example
http:/www.intent.com/sg) and The magnets in the first and second
arrangements may have the reader is relèrred to those [Or a more in-depth
study of generally planar front and rear Faces joined by
curved side
sacred geometry. Faces that meet at opposite ends 10 present a
lens-like pro- Very broadly, sacred geometry generally relates to
patterns file when viewed from the front or rear Faces
and a generally

221
and figures created or embodying one of live basic
geometri- rectangular profile when viewed from the side
face, with the cal ratios: Pi, •V2, •x/5, •x/3, and Phi. longitudinal axis of each lens extending through
its ends. Pi is the ratio of the diameter of the circle to its
circumlèr- The magnets may be mounted in support blocks
having ence. recesses lòrmed therein (Or receiving and
orienting the mag- A/2 is the length of a diagonal of a square with
sides of nets.
The support blocks may be cylindrical and
housed in roller length I . assemblies comprising a tubular shell of a non-
magnetic A/5 the length of the a diagonal of a rectangle with
sides of material. Retainers may be provided that act
between the length I and length 2. shell and the support blocks 10 constrain the
support blocks A/3 is the length of the chord connecting the points
of 60 against rotation relative 10 the shell.
intersection of two circles each having a radius l,
where the The magnetic resonator may have three roller
assemblies circumlèrence of each intersects the centre of the
other. spaced equidistantly about a common axis.
Phi is ( l +/5)/2 and is a naturally occurring ratio
prevalent The magnets may be arranged with their north
and south
in animal and plant skeletal structures. It is also
retèrred 10 as poles alternating.
the "golden ratio". Most naturally occurring fractal
patterns,
The magnetic resonator may have lour first
arrangements
such as snowflakes, tree shapes and so on, 10110w
the golden of magnets and nine second arrangements of
magnets. ratio. Each second arrangement may include six
magnets.
3 4
DESCRIPTION OF DRAWINGS drums illustrated, mounted for rotation about
respective rotational axes 104 generally parallel
to each other. FIG. 1 is a perspective view from above showing
a top, a The roller assemblies 102 and their respective
axes are also side and an end of a magnetic resonator according
to the parallel to and spaced equally about a common
axis 106. present invention with its outer cover removed; Three roller assemblies 102 are illustrated
arranged with FIG. 2 is a view corresponding to FIG. 1 but
showing the their respective axes 104 arranged to correspond
to the cor-

222
opposite side; ners of an equilateral triangle when viewed from
the end, such
FIG. 3 is a top plan view of the magnetic
resonator of FIGS. 1 and 2;
as in FIG. 5. A prototype magnetic resonator 100 built
according to FIG. 4 is a front elevation corresponding to
FIG. 3•
10 such an arrangement has provided beneficial
results in test- FIG. 5 is an end elevation of the magnetic
resonator of ing. It is however expected that other numbers
and arrange-
FIGS. 1 and 2; ments of rollers may work. Certainly beneficial
results, albeit FIG. 6 is a plan or elevational view of a roller
assembly of a smaller resonant field is achievable with a
single roller assembly 102. a resonator unit according to the present invention
(as the
15 Each of the roller assemblies 102 contains
magnets roller assemblies illustrated are cylindrical, plan
and eleva- arranged according to a pattern conforming to
sacred geom- (ional views would be similar); etry as described in detail further below.
FIG. 7 is a sectional view of the roller assembly
taken on The roller assemblies 102 are rotated about their
respective line 7-7 ofFIG. 6• axes 104 by any suitable motive power means or
rotator to FIG. 8 is a sectional view of the roller assembly
of FIG. 6
20 create a resonant magnetic field. A suitable
rotator, as illus- corresponding to line 8-8 of FIG. 7 and showing a
magnet trated, may include a motor 108 rotatably
coupled to the holder according to the present invention; rotator assemblies 102 by a drive belt 112 that
rides on and FIG. 9 is a sectional view of the magnet holder
of FIG. 8 frictionally engages driven pulleys 110 mounted
to the rotator taken on line 9-9 of FIG. 8• assemblies 102. A driving pulley 114 mounted
to an output FIG. 9A is a perspective view of a "lens" shaped
magnet
25 shaft of the motor 108 and presses against the
drive belt 112 according to the present invention; to frictionally engage the belt 112.
FIG. 10 is a front elevation of a magnet holder
according to It will be appreciated that the pulley and belt
arrangement the present invention for holding 1 8 magnets; is exemplary and may be substituted with other
drive assem- FIG. 11 is a rear elevation of the magnet holder
of FIG. 10• blies such as a sprocket and chain assembly or a
gear drive FIG. 12 is a section on line—12-12 of FIG. 10• 30 assembly, to mention but two alternatives. FIG. 13 is a section on line 13-13 ofFIG. 10• The balance of the structure illustrated in FIGS.
1 through FIG. 14 is a section on line 14-14 ofFIG. 10• 5 is mostly support structure for the mounting
and support of

223
FIG. 15 is a front elevation of a magnet holder
according to the components described above. The support
structure illus- the present invention for holding 6 magnets; trated includes a base 120 to that roller assembly
support FIG. 16 is a section on line 16-16 ofFIG. 15• 35 plates 122 are secured to extend generally
perpendicularly FIG. 17 is a section on line 17-17 ofFIG. 15• therefrom. The roller assembly support plates
would typically FIG. 18 is a section on line 18-18 ofFIG. 15• house bearings into that respective ends of the
roller assem- FIG. 19 is a front elevation showing hidden
detail of a blies 102 are journalled for low friction
rotational support. magnet holder according to the present invention
for holding The motor 108 may be supported on the base
120 by an
six (6) magnets 40 adjustable motor mount 122 to allow for
tensioning of the FIG. 20 is a top plan view of the magnet holder
of FIG. 19' drive belt 112 by moving the motor 108.
FIG. 21 is a perspective view ofthe magnet
holder of FIGS. A non-magnetic cover (not illustrated) may be
provided 19 and 20 taken from the direction of line 21-21
of FIG. 2()• over the magnetic resonator 100 for aesthetics
and to protect FIG. 22 is a section on line 22-22 ofFIG. 19; against inadvertent contact with any moving
parts. FIG. 23 is a section on line 23-23 ofFIG. 19; 45 The roller assemblies 108 and parts thereof are
illustrated FIG. 24 is a front elevation of a magnet holder
according to in detail in FIGS. 6-31. Each roller assembly 108
has a gen- the present invention [Or holding eighteen (18)
magnets; erally cylindrical shell 130 of a non-magnetic
material (Ibr FIG. 25 is a rear elevation ofthe magnet holder
of FIG. 24; example aluminium) inside of that is disposed an
array of FIG. 26 is a top plan view ofthe magnet holder
ofFIG. 24; lens-shaped magnets 132 disposed generally
axially thereal- FIG. 27 is a perspective view ofthe magnet
holder ofFIGS.
so ong.
24, 25 and 26 taken from the perspective ofline
27-27 ofFIG. "Non-magnetic" as used herein is intended to
relèr to a 26; material that doesn't significantly interlère with
the mag- FIG. 28 is a section on line 28-28 of FIG. 24; nelic field associated with the magnets 132.
FIG. 29 is a section on line 29-29 of FIG. 24; The array of magnets 132 generally comprises
two FIG. 30 is a perspective view of a magnet holder
according
arrangements. A first arrangement 134 is a
radially disposed to the present invention (Or holding eighteen (18)
magnets; "seed of lilè" pattern as shown in FIG. 8.

224
and A second arrangement 136 generally comprises
six mag- FIG. 31 is a front elevation ofthe magnet holder
ofFIG. 30 nets equidistantly spaced about the rotational
axis 104 of the showing representative radii of curved portions of
FIG. 30. roller 102 in a generally conical layout. In other
words, one
60 end of each ofthe magnets 132 is closer to the
rotational axis DESCRIPTION OF PREFERRED 138 than is its opposite end. Hence the magnets
132 of the EMBODIMENTS second arrangement 136 either converge or
diverge relative 10 the rotational axis 138
(depending on one's frame of relèr- A magnetic resonator according to the present
invention is ence).
generally indicated by relèrence in the
accompanying
65 A second arrangement 136 is located adjacent
each first illustrations. The magnetic resonator basically
comprises arrangement with the magnets 132 of each
second arrange- a plurality of roller assemblies 102, such as the
cylindrical ment 136 being closest 10 the rotational axis 104
adjacent the
5 6
first arrangement 134. In other words, the
magnets 132 of the Use of the resonator 100 doesn't require that the
object to second arrangement 136 diverge from the
rotational axis 104 be treated surround the roller assemblies 102.
Being adjacent away from the adjacent first arrangement 134. thereto is generally sufficient and accordingly, in
the case of As can be seen in FIGS. 9 through 16, each of
the magnets fluids all that is required is that a non-magnetic
conduit for the 132 of each second arrangement 136 has a
slightly different fluid pass by the resonator 100. It is believed
that purification orientation than the remaining magnets 132 of the
second time will depend on the substance being purified
and the arrangement 136. As mentioned above, each
magnet 132 has overall size of the resonator 100. For water
purification using a generally lens-like shape in that it has generally
parallel a resonator 100 having rollers of about 17 inches
in length and planar side faces 140 and curved front and rear
faces 142 about 4 inches in diameter it is believed that
approximately that meet at opposite edges 144 as can be seen in
FIG. 9A.
10 0.03 seconds would be required for killing a
virus. PCB 's may A lens axis 146 extends through each lens 132
between the require about 20 minutes. Accordingly it should
be apparent edges 144 equidistant from the side faces 140. that a continuous flow operation (as contrasted
with a batch

225
Each lens 132 in the second arrangement 136 is
oriented as operation) may be viable at least for some
applications. if it has been rotated about 30 0 (thirty degrees)
about its lens The above description focuses upon the use of a
"seed of axis 146 relative to the immediately adjacent
lenses 132. The
15 lilè" pattern. The seed of lilè is but one
geometric pattern arrow indicated by relèrence 148 in FIG. (DA
illustrates the that incorporates the reoccurring ratios or
sequences Ibund rotation. FIGS. 12 through 14 and 15 through 18
illustrate the in nature that are collectively referred to as
"sacred geom- resulting orientations. Note for example that one
of the two etry". It is believed that the inherent ratios of the
sacred lenses 132 apparent in FIG. 12 (to the left as
illustrated) geometry associated with the "seed of life" has a
strong presents its side face parallel to the plane of the
page whereas
20 influence on the effectiveness of the resulting
magnetic field. the other (to the right as illustrated) has its side
faces 140 Accordingly, it stands to reason that beneficial
results would perpendicular to the plane of the page. FIG. 16
illustrates the also be achieved by selecting other of the
geometric patterns reverse arrangement. within the sacred geometry group.
The magnets 132 are held in their respective
positions by The magnets 132 should be as strong as
reasonably pos- respective 18 magnet and 6 magnet holders 150
and 152.
25 sible. Accordingly rare earth magnets are
presently preferred FIGS. 10 through 14 and 24 through 31 illustrate
the former in view of their high strength to size ratio.
Whilst this is a and FIGS. 15 through 23 illustrate the latter.
Quite simply the preference it is not a requirement. Other forms
of permanent magnet holders 150 and 152 are non-magnetic
blocks with magnets or even electromagnets may be used.
Preferably the suitable recesses for receiving the magnets 132 to
align and magnets 132 are symmetrically disposed to
minimize rota- hold them in their desired positions. 30 tionally induced vibration during use. The
magnets are pref- The 18 magnet holders 150 hold both a first
arrangement erably arranged in alternating north-south
orientation, but this 134 and a second arrangement 136 of magnets
132. The 6 may be changeable.
magnet holders 152 hold only a second arrangement
136 of The resonator 100 of the present invention is
believed to magnets. It should be borne in mind that the
magnet holders have practical application as a means to purify
water or food 150 and 152 are merely exemplary as no doubt
other secure-
35 by killing pathogens and breaking down toxins.
The resonator ment means are viable. For example the entire
array could be 100 also may have practical application in direct
application

226
cast into a suitable potting material such as a
thermosetting or to a human body and animals to assist in
restoring circulation, thermal setting polymer or a chemically setting
resin such as treating inflammation, ulceration, viral and
bacterial infec- epoxy. tions and as a general tonic. The resonator 100
may also be Reference is now made to FIGS. 20 through 23
illustrating
40 useful for reducing environmental toxins in air,
water, food a six magnet holder 152. The 6 magnet holder
152 has a and soil. Preliminary tests are believed to be able
to show the generally cylindrical body 160 having a plurality
of recesses breakdown of toxic compounds (such as in
automobile 162 each of that accommodates a single magnet
132
exhaust) into smaller and less harmlill
constituent elements
Each ofthe recesses 162 is configured to receive
its respec- such as IC, CO, NO and
tive magnet in a desired orientation by closely
engaging the
45 The above invention is described in an
illustrative rather side Faces 140 of the magnet 132. than a restrictive sense. Variations may be
apparent to persons Locating holes 164 are provided between
opposite Faces skilled in such arrangements without departing
from the spirit 166 ofthe 6 magnet holder 152 to align with
locating rods or and scope of the invention as defined by the
claims set out bolts 168 (see FIG. 6) that extend through the
roller assembly 102. The locating holes 164 align
the magnet holders 150
below.
and 152 and secure the magnet holders 150 and
152 to the balance of the roller assemblies (Or
rotation therewith.
PARTS LIST
Relèrence is now made 10 FIGS. 24 through 31
that resonator
illustrate 18 magnet holders 150. The 18 magnet
holders are 102 roller assembly
similar to the 6 magnet holders on one side but,
on the oppo-
104 axis (roller assembly)
site side, include lilrlher recesses 170 Ibr
receiving and hold- 106 common axis (of roller assemblies)
ing the magnets 132 ofthe first arrangement 134.
As with the 108 motor
6 magnet holder 152, locating holes 164 are
provided to align 110 driven pulleys
with locating rods or bolts 168 and retain the 18
magnet 112 drive belt
holder 150 in a desired orientation within the
roller assembly
60 114 drive pulleys
104. 120 base

227
In use, the motor 108 is activated 10 rotate the
roller assem-
122 support plates
blies 1 02 via the drive bell 1 12. The desired
speed al that the 124 adjustable motor mount
rollers 102 rotate may vary depending upon the
purpose tor 130 shell (roller)
that the resonator is 10 be used. For example, it is
believed
65 132 magnets
that running the roller assemblies 102 al 3,500 10
rpm 134 first arrangement (seed of lilè)
may prove 10 be beneficial in water purification
applications. 136 second arrangement (conical)

228
7 8
138 rotational axis (roller assembly) along said pyramid or cone shape; each said
magnet is rotated 140 side face (lens) by an equal amount in a common direction from
its neighbour 142 front and rear faces (lens) whereby diametrically opposed magnets have
respective of 144 edges (lens) said front and rear faces facing in generally
perpendicular 146 lens axis 5 directions. 148 arrows (showing rotational displacement of
lens) 4. The magnetic resonator of claim 3 wherein:
said mag- 150 18 magnet holder nets in said first and second arrangements have
generally 152 6 magnet holder planar side faces joined by curved front and rear
faces that 162 recesses (for holding magnets) 164 locating holes 10
meet at opposite ends to present a lens-like
profile when
166 opposite faces (of body) viewed from the said front or rear faces and a
generally 168 rods or bolts (extending through roller
assembly) rectangular profile when reviewed from said side
faces; and, 170 recesses in 150 for holding first arrangement
of magnets said longitudinal axis of each said lens extends
through said The invention claimed is: ends.
5. The magnetic resonator of claim 4 wherein:
said mag- 1. A magnetic resonator comprising: a support
structure; a
15
plurality of roller assemblies mounted to said
support struc- nets are mounted in support blocks having
recesses IUrmed ture for rotation about respective axes of rotation
that are therein for receiving and orienting said magnets.
generally parallel to one another; drive means
coupled to said 6. The magnetic resonator of claim 5 wherein:
said support roller assemblies for rotating each of said roller
assemblies blocks are cylindrical; said roller assemblies
have a tubular about its respective axis of rotation relative to
said support
20 shell of a non-magnetic material housing said
support blocks; structure; each said roller assembly housing a
plurality of and, retainers are provided that act between said
shell and magnets disposed along said respective axes; said
plurality of said support blocks to constrain said support
blocks against magnets are grouped in a plurality of a first and
second rotation relative to said shell.

229
arrangements in distinct, non-identical patterns, with
a first 7. The magnetic resonator of claim 6 further
comprising: arrangement being interspersed between a pair of
said second 25 three of said roller assemblies spaced
equidistantly about a arrangements; at least one of said first and second
arrange- common axis. 8. The magnetic resonator of claim 7 wherein at
least some ments incorporating a pattern or shape based on a
seed of life
pattern. of said magnets are arranged with their
respective north and 2. The magnetic resonator of claim 1 wherein: said
second south poles alternating.
arrangement of magnets includes a plurality of said
magnets 30 9. The magnetic resonator of claim 8 further
comprising: disposed generally equidistantly about said
respective axes of four of said first arrangements and nine of said
second rotation in a generally pyramid or cone-shaped
pattern or arrangements, along each said roller.
10. The magnetic resonator of any one of claim
1 wherein shape with a vertex of said pyramid or cone facing
said first
arrangement. each said second arrangement has six (6)
magnets. 3. The magnetic resonator of claim 2 wherein: said
mag- 35 11. The magnetic resonator of claims 1 wherein
said drive nets in said second arrangement of magnets have
discernible means is arranged to rotate said rollers at from
3,500 to 4 000 front and rear faces on opposite sides of a
longitudinal axis; said magnets are arranged with
said longitudinal axes lying
revolutions per minute ("rpm").

230
Appendix C: Graphical representation of the burst-firing EMF pattern.

231
Appendix D: Graphical representation of the burst-firing (top left), reverse burst firing (top right),
Thomas (bottom left), and 7-Hz burst (bottom right) patterns.

232
Appendix E1: Photographic representation of the Helmholtz geometry from various perspectives.
Front view (top left), Top view (top right), Left-sided view (bottom, middle).

233
Appendix E2: Photographic representation of the Hoberman geometry taken from various
perspectives. Front view (top left), Top view (right), Left-sided view (bottom left).

234
Appendix E3: Photographic representation of the Rodin geometry taken from different
perspectives. Front view (top left), Top view (right), Left-sided view (bottom left).

235
Appendix E4: Photographic representation of the Toroid geometry taken from different
perspectives. Front view (top left), Top view (right), Left-sided view (bottom left).

236
Appendix E5: Pictographic representation of PC-12 exposure conditions to various magnetic field
generating devices (i.e., application geometries). The example provided demonstrates the
Hoberman geometry in the context of the experimental set-up.

237
Appendix F: Photographs of the Faraday-bowls. Weavemesh (top row) and fly mesh (bottom row)
constructs ranging from left-to-right in terms of overall coverage.

238
Appendix G: Photographic representation of experimental set-up for the measurement of
background, ambient fluctuations in the Earth’s magnetic field with the Hoberman geometry as an
example.

239
Appendix H1: Graphical representation of the Thomas-EMF pattern.

240
Appendix H2: Photographic representation of the experimental set-up for exogenous field
induction trials with the Hoberman geometry serving as an example.

241
Appendix I: Photograph of the experimental set-up for the measurement of background voltage
fluctuations induced the various EMF coils in a Faraday cage and acoustic chamber.

242
Appendix J: Photograph of the experimental set-up for measuring fluctuations in static magnetic
field measures in a standard incubator when the burst-firing EMF is generated through different
application geometries. Here, the Hoberman geometry is used as an example.