characterizing teaching and assessing for understanding...
TRANSCRIPT

Characterizing Teaching and Assessing for Understanding in Middle Grades
Mathematics: An Examination of Best Practice Portfolio Submissions to NBPTS
Edward A. Silver and Vilma Mesa
University of Michigan
with
Babette M. Benken (Oakland University)
Angus Mairs (Chicago Public Schools)
Katherine A. Morris (University of Michigan)
Jon Star (Michigan State University)
March 2002
Preparation of this paper was supported in part by grant #ESI-0083276 from the
National Science Foundation (NSF) to the Educational Testing Service (ETS), under the
direction of Gail P. Baxter and Edward A. Silver. The authors are grateful to the National
Board for Professional Teaching Standards (NBPTS) and key members of the ETS staff,
especially Rick Tannenbaum, for facilitating access to the data used in this investigation.
However, any opinions expressed herein are those of the authors and do not necessarily
reflect the views of the NSF, NBPTS, or ETS. The authors are grateful to Douglas Corey
and Hala Ghousseini for their assistance with some of the data coding in the study
reported herein.
This paper was presented at the 2002 annual conference of the American
Educational Research Association, New Orleans, LA, April 2002.

Characterizing Teaching and Assessing for Understanding in Middle Grades
Mathematics: An Examination of Best Practice Portfolio Submissions to NBPTS
Documents such as the Curriculum and Evaluation Standards for School
Mathematics (NCTM, 1989) and Principles and Standards for School Mathematics
(NCTM, 2000) argue that it is both educationally possible and socially necessary to have
ambitious mathematics learning goals for all students. At the same time, evidence from
the Third International Mathematics and Science Study (TIMSS) suggests that American
students learn not only far less mathematics than is desired in absolute terms but also far
less than is needed in relative terms, in comparison to students in many other nations in
the world (Beaton et al., 1996; Schmidt et al., 1999). In response, a number of initiatives
have been proposed by educators and policy professionals to raise mathematics
achievement for all students in the U.S. Many of these initiatives have focused on
enhancing the quality of mathematics teachers and teaching. In fact, there is widespread
agreement (cf. National Commission on Teaching and America’s Future, 1996; U.S.
Department of Education, 2000)—even among those who find themselves at odds about
the goals of school mathematics in the so-called Math Wars—that it will be impossible to
attain high standards for student performance, however they are defined, unless efforts
are made to increase the prevalence of high quality teaching.
In light of the growing interest in the quality of teachers and teaching in the U.S.,
many educators and policy makers have begun to pay more attention to the certification
process offered by the National Board for Professional Teaching Standards (NBPTS).
The NBPTS was established in 1987 as a nonprofit, nonpartisan organization that
promotes the recognition of “highly accomplished” teaching practice. Under the guidance

2
of NBPTS, a voluntary, national system was established to certify accomplished practice
in a number of fields. Except for “generalist” certifications, each field is defined by
content area (e.g., mathematics) and students’ development level (e.g., Early
Adolescence, ages 11-15). The NBPTS certification process involves both the
specification of standards for professional practice and the completion of an assessment
of the extent to which experienced teachers meet these standards.
The NBPTS identifies and recognizes teachers through a complex assessment
system in which teacher candidates demonstrate knowledge and professional practice of
many kinds. The NBPTS assessment in the area of Early Adolescence/Mathematics
(EA/M), for example, consists of two parts: in one, teachers complete an on-demand,
test-center-administered set of exercises to evaluate certain aspects of their content and
pedagogical content knowledge; in the other, candidates submit a portfolio that includes
contextualized samples of their teaching practice and reflections on their work. The
portfolio component of the assessment consists of six entries, of which four are
classroom–based entries. In these, two (Developing Mathematical Understanding and
Assessing Mathematical Understanding) rely on classroom artifacts, samples of student
work, and teachers’ reflective narratives to illustrate teaching practice and two (Engaging
a Whole Class in Mathematical Discussions and Engaging Small Groups in Mathematical
Interactions) rely on videotapes and accompanying artifacts and reflective commentary.
The two portfolio entries not based on work inside the classroom pertain to teachers’
participation in professional activity and their outreach to families and local communities.
This exploratory study was undertaken in response to a perceived need for more
information about the data collected in the NBPTS certification process. Despite

3
widespread support for the NBPTS efforts among education professionals and
policymakers, its certification process has remained largely underexamined. Although
technical analyses of the reliability and some aspects of the validity have been conducted
(e.g., Jaeger & Bond, 2000), many questions remain. For example, little is known about
the nature and character of the instructional and assessment practices of this select group
of teachers. In what ways do these portfolios help to answer the question, What is “highly
accomplished” mathematics teaching? To what extent do they reflect contemporary ideas
about “best practice” in mathematics teaching? In what ways do the instructional and
assessment practices of teachers who obtain NBPTS certification differ from those who
do not? To what extent do the portfolio submissions for the NBPTS certification process
give evidence of teaching that deviates from the portrait of typical practice available from
other sources?
Because the NBPTS process attracts a self-selected sample of teachers, each of
whom has an opportunity to select a few samples of teaching and assessment
performance from across a year of work, the data available for inspection in this study
differ substantially from data available from other large-scale studies of mathematics
teaching/assessment practice. Unlike the teacher questionnaire data collected by NAEP
and by TIMSS, for example, which portray normative teaching practice via teacher self-
reports, the NBPTS data combine teacher self-reports (narrative descriptions of teaching
practice) with physical records (video clips, instructional and assessment activities, and
samples of student work) of actual classroom practice. Furthermore, in contrast to the
data collected in the TIMSS and TIMSS-R video studies, the NBPTS portfolio
submissions are intended to represent what the teacher applicants might be more likely to

4
characterize as their “best” practice rather than their “typical” practice. Thus, the NBPTS
portfolio submissions are a strategic site for investigation into mathematics
teaching/assessment practice in the middle grades.
The portfolio submissions of applicants for NBPTS certification provide an
unprecedented glimpse at the instructional and assessment practices of a select group of
American teachers. They also afford an opportunity to address a question that is
increasingly part of public and professional debates about education: What is the nature
of highly accomplished mathematics teaching? For that reason we undertook the
exploratory investigation reported here.
Goals
One goal of this study was to characterize the nature and quality of samples of
mathematics instruction and assessment submitted by middle school teachers who applied
to the NBPTS for EA/M certification. A second goal was to contrast the nature and
quality of the portfolio entries submitted by teachers who were granted NBPTS
certification to those of the teachers who did not obtain certification. To accomplish the
first goal we selected a random sample of applicants for NBPTS EA/M certification,
examined two portfolio entries submitted by these teachers, and characterized selected
mathematical and pedagogical features of the portfolio entries. To accomplish the second
goal we contrasted the mathematical and pedagogical features of portfolio entries
submitted by applicants who obtained NBPTS certification with those who did not.
Because the NBPTS portfolio process affords an opportunity for teachers to submit
examples of their best practice, we expected that these portfolio submissions would

5
exhibit mathematical and pedagogical features that deviate from “typical” mathematics
teaching practice in the middle grades. In particular, we expected that the portfolio
submissions of teachers desiring NBPTS certification would contain activities that were
mathematically demanding, and we further expected to see that teachers obtaining
NBPTS certification would be more likely to submit high-demand activities than teachers
who did not obtain certification. Similarly, we expected that the portfolio submissions of
teachers desiring NBPTS certification would contain pedagogically adventurous samples
of teaching, and we further expected to see that teachers obtaining NBPTS certification
would be more likely to submit pedagogically rich samples than teachers who did not
obtain certification.
Method
As part of the NBPTS process, applicants agree that their submissions can be
examined for research purposes. A subset of the available data was used in this study.
Sample
We obtained test center and portfolio exercise score data for all candidates who
applied for NBPTS certification during the 1998-99 academic year (n = 250). From this
set of 250 applicants a random sample of candidates (n = 32) was selected for further
analysis of a subset of their portfolio entries. Our random sample included 13 individuals
who obtained NBPTS certification and 19 who did not; the ratio of successful to
unsuccessful applicants in our sample was approximately that found in the entire
population of EA/M applicants in 1998-99.

6
Data
We obtained copies of two of the portfolio entries submitted by the 32 individuals
in our random sample of candidates for NBPTS certification. We collected the two
portfolio entries that contained textual (rather than video) samples of instructional
practice — Developing Mathematical Understanding (DU) and Assessing Mathematical
Understanding (AU).
The two entries are each distinct, yet they share some common characteristics. For
both entries, candidates are told to represent examples of their “best practice” and present
“clear, consistent and convincing evidence” that they are able to build conceptual
understanding using the activity in their classroom. Also, for both entries, candidates are
instructed to use the same general format and include common elements: a written
description of the instructional context (e.g., grade, subject, class characteristics); a
written description of teacher planning (e.g., substantive math idea, goals for
instructional sequence, challenges inherent in teaching these activities); analysis of
student responses (actual student work samples for these specific students are appended
to the entry); and candidate’s reflections on the outcomes of each instruction or
assessment process as a whole.
Beyond these similarities, there are also some distinctions between the two entries. For
the DU entries teachers are asked to select two activities for which they describe and
exemplify their instructional approaches to developing students’ conceptual
understanding of a substantive idea in mathematics. The two distinct learning experiences
can be consecutive or spread apart in time; however, both should be focused on the same
mathematical idea. The candidates are instructed to select activities in which students are

7
engaged in thinking and reasoning mathematically (e.g. interactive demonstrations, long
term projects, journal assignments, problem solving); in particular, it is emphasized that
they are to not select activities that focus on rote learning (e.g., students’ memorizing
procedures).
In the AU entries the instructional sequence around which teachers develop their
assessments must be one in which students are engaged in “thinking and reasoning
mathematically and building conceptual understanding”; they are again told not to focus
on rote learning. For the AU entry, candidates submit an assessment that describes and
exemplifies an approach that supports and promotes the learning goals and enhances
instruction. Candidates select one assessment for which they describe, analyze and
evaluate their students’ understanding of a chosen mathematical idea.
Data Analysis
Our examination of the NBPTS data consisted of quantitative and qualitative
analyses of the two portfolio entries for the random sample of 32 applicants. To
accomplish the first goal of this study—characterizing the nature and quality of
mathematics teaching in the portfolio entries—we systematically examined the two
portfolio entries along two distinct dimensions: (1) mathematical features, and (2)
pedagogical features. The mathematical features of interest were the topical focus (e.g.,
algebra, number) and the presence (or absence) of mathematically challenging or
cognitively demanding work for students. The pedagogical features included several
different aspects of the organization and enactment of instruction or assessment in the
classroom that have been widely advocated in recent years (e.g., group work, use of
technology). Taken together, these two dimensions provide information about what
8
mathematics learning opportunities teachers provide in their classrooms and how these
opportunities are provided to students. To accomplish the second goal of this study, we
contrasted the mathematical and pedagogical features of portfolio entries submitted by
applicants who obtained NBPTS certification with those who did not. Further details
about the coding and analysis procedures for each aspect of the coding are provided as
the results are presented in subsequent sections of this paper.
Results
In this section we present the major findings of our analysis of the portfolio entries.
First, we present the results for the analysis of mathematical features. Next, we present
the results for the analysis of pedagogical features. Finally, we provide the findings of our
analysis of similarities and differences between the mathematical and pedagogical
features in portfolio entries submitted by applicants who obtained NBPTS EA/M
certification and in the entries of those teachers who did not obtain certification.
Mathematical Features of NBPTS Portfolio Submissions
This section presents the findings of our analysis of the mathematical characteristics
of the activities in the DU and AU entries submitted by NBPTS candidates, with a
particular focus on the mathematical/cognitive demands of the activities.
Mathematical topics. Mathematics teaching in the middle grades has long been
criticized for excessive attention to number. In response to this preoccupation with
number, the NCTM Standards (1989, 2000) suggest the importance of also treating topics
in algebra, geometry, measurement, and data analysis in the middle grades. Algebra has
received particular emphasis in recent years, as schools have more frequently offered a
9
year-long algebra course to students in grades 7 or 8. Therefore, in our analysis of the
portfolio entries, we were interested in determining the mathematics topic area treated in
the submissions.
Each activity was coded with respect to the mathematical topic under consideration.
The five topic categories used by NAEP were used in this coding: Number and
Operations; Algebra and Functions; Measurement; Geometry; and Data Analysis,
Statistics and Probability (NAEP, 1988). Each of the three activities in the two portfolio
entries (two activities in each DU entry and one activity on each AU entry) was assigned
one or more of these topical designations based on the judgement of two raters who
examined the nature of the activity. There was near unanimity in this coding, with a few
disagreements arising only when multiple designations were assigned.
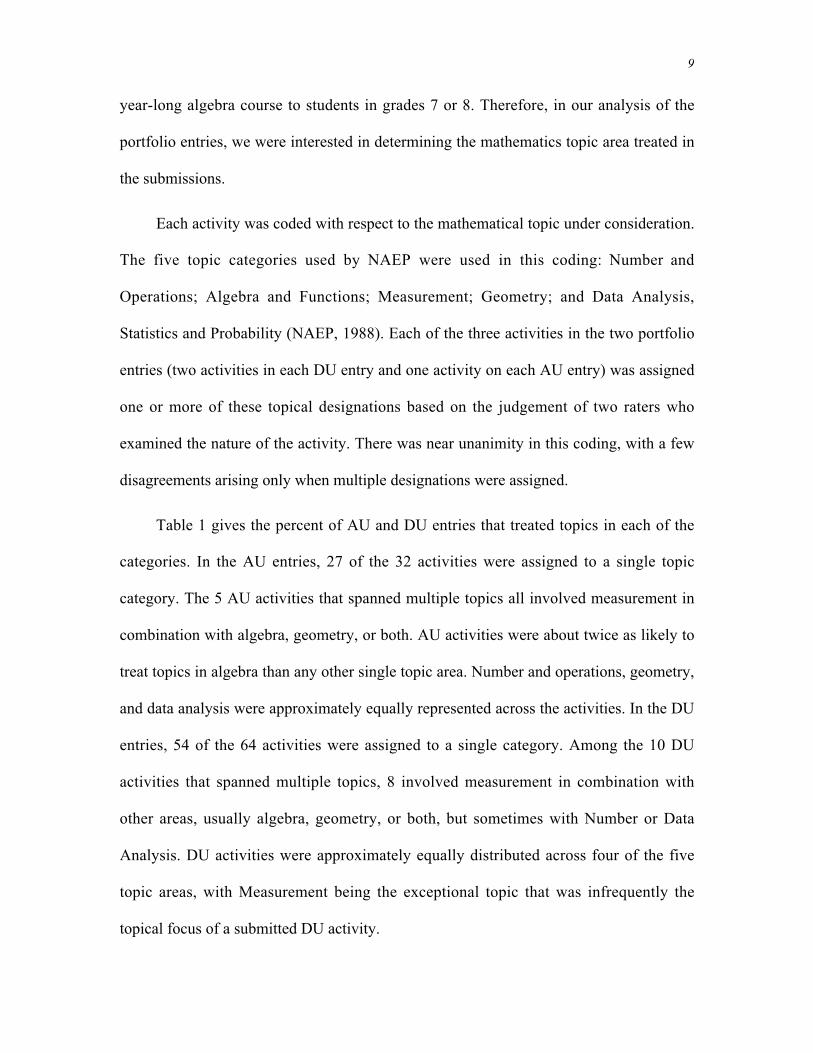
Table 1 gives the percent of AU and DU entries that treated topics in each of the
categories. In the AU entries, 27 of the 32 activities were assigned to a single topic
category. The 5 AU activities that spanned multiple topics all involved measurement in
combination with algebra, geometry, or both. AU activities were about twice as likely to
treat topics in algebra than any other single topic area. Number and operations, geometry,
and data analysis were approximately equally represented across the activities. In the DU
entries, 54 of the 64 activities were assigned to a single category. Among the 10 DU
activities that spanned multiple topics, 8 involved measurement in combination with
other areas, usually algebra, geometry, or both, but sometimes with Number or Data
Analysis. DU activities were approximately equally distributed across four of the five
topic areas, with Measurement being the exceptional topic that was infrequently the
topical focus of a submitted DU activity.

10
--------------------------------
Insert Table 1 about here
--------------------------------
Combining these results, we see that the submitted activities were more than five
times as likely to involve a single topic area as to involve multiple topics. Measurement
was the topic least likely to be the singular topical focus of an activity, but it was the
most likely to be found in combination with other topics. Activities were approximately
equally distributed across the other four mathematical topic areas, with Algebra being
favored in AU submissions but not in DU submissions and geometry favored in DU
submissions but not in AU submissions.
Mathematical demands. According to the Professional Standards for Teaching
Mathematics (NCTM, 1991), in order for teachers to promote their students’ learning of
worthwhile mathematics, teachers need to select “mathematical tasks that engage
students’ interests and intellect” (p. 1). Such tasks, when implemented well in the
classroom, can help develop students’ understanding, maintain their curiosity, and invite
them to speculate and communicate with others about mathematical ideas. Research
suggests, however, that this vision of mathematics teaching is far from commonplace in
elementary and middle grades mathematics classrooms. Several research studies have
found that daily mathematics instruction at these grade levels more typically involves
teachers and students engaging in less intellectually challenging activities, such as
recalling facts and applying well-rehearsed procedures to answer simple questions
(Porter, 1989; Stake & Easley, 1978; Stigler & Hiebert, 1997; Stodolsky, 1988).
Moreover, other research has shown that considerable pedagogical skill is needed to use
cognitively demanding tasks well in mathematics classrooms. In particular, it is often
11
difficult for teachers to enact the tasks without reducing the very complexity and
intellectual challenge that makes them worthwhile (Stein, Grover, & Henningsen, 1996).
In our analysis of the NBPTS portfolio entries we were interested in determining
the extent to which the activities proposed by the teachers seeking NBPTS certification
constituted worthwhile, high-demand mathematical activities and the extent to which the
“highly accomplished” teachers who obtained NBPTS certification were more likely to
employ such tasks than those who did not obtain certification. Thus we developed a
coding system to help us determine the mathematical and cognitive demands of the
activities submitted by the teachers, after which we used the results of the coding to
characterize the frequency of cognitively demanding activities in the portfolio
submissions.
Coding for mathematical demands. Our process of coding for mathematical
demands incorporated aspects of both “top-down” and “bottom-up” approaches to data
coding. In top-down approaches, one typically uses categories that are determined a
priori. In contrast, bottom-up approaches typically involve allowing the categories to
emerge from the data.
We began by examining several frameworks that have been used to distinguish
among different levels of demands in mathematical tasks. Some of the frameworks we
considered are drawn from the assessment literature (e.g., Beaton et al., 1996; Silver &
Kenney, 2000); others were drawn from analyses of instruction (Stein, Smith,
Henningsen, & Silver, 2000) or student proficiency (Kilpatrick, Swafford, & Findell,
2001). Although none of these frameworks was judged completely appropriate for our
needs, the categories, layers of complexity, and descriptions associated with these

12
frameworks provided us with many examples and helped us organize our thinking about
the demands exhibited in the activities.
The next phase of work involved two members of the research team examining the
32 AU activities and classifying each one independently using a dichotomous (high/low)
rating scale to distinguish between those activities that were judged to be highly
cognitively demanding tasks and those that were judged to low in cognitive demand.
Because we were interested in the actual content of the activities, rather than what
teachers wrote about their teaching more generally, this analysis focused on the actual
activities proposed by the teachers and the associated student work samples. When it was
deemed necessary to understand an activity, a teacher’s description of instructional
context was also considered. After each activity was coded independently, the two raters
met to compare ratings and discuss the rationale for each classification. Agreement was
achieved for about 70% of the AU activities on this first pass rating. All instances of
disagreement were discussed, and a consensus rating was derived.
Based on this experience, the two raters developed a list of criteria and
characteristics that they found useful to distinguish the AU activities designated as high-
demand from those designated as low-demand. This scheme was discussed and refined as
needed to reach consensus. Then this list was used by each of the individuals to examine
and classify the 64 DU activities. As before, each activity was classified by each person
working independently to distinguish between those activities that were judged to be
high-demand tasks and those judged to be low-demand tasks. Each rater gave a rationale
for every classification and noted whether the list of characteristics was useful in making
the judgment; they also identified emergent criteria or characteristics needed to enhance

13
the list initially derived from the rating of the AU activities. The two raters were able to
use the preliminary list of criteria and characteristics for the DU entries, and they
achieved agreement on nearly 80%.
The framework that emerged from this coding of the AU and DU entries is shown
in Table 2. The application of these criteria required nuanced judgment on the part of the
raters, and the classifications were sometimes difficult to make. Activities typically
contained many parts, and it was difficult to decide how to weigh the more demanding
and less demanding aspects of an activity to derive an overall classification. In general,
the raters tried to apply the criteria liberally. That is, if some part of an activity exhibited
high-demand characteristics, it was generally classified as highly demanding, even if
some other parts of the activity did not exhibit high-demand characteristics. Another
feature that required special judgment by the raters was the topic treated in the task at a
particular grade level. For example, a task requiring application of basic knowledge about
place value was less likely to be classified as highly demanding in grade 6 than a task
involving a more advanced topic, such as trigonometry. Finally, the raters tried to ignore
features of an activity (such as collecting data, writing a letter related to a mathematical
task) that might increase performance complexity but which seemed more related to non-
mathematical or extracurricular features than to mathematical and cognitive demands.
Therefore, tasks that called for complex performances but required only routine
mathematics tended to be classified as low-demand activities.
--------------------------------
Insert Table 2 about here
--------------------------------
14
To illustrate how these criteria were applied to the AU and DU tasks, two examples
of activities classified as high demand and two classified as low demand are provided in
Table 3. A rationale provided by a rater for the classification accompanies each example
to illustrate how the criteria in Table 2 were applied in this process.
--------------------------------
Insert Table 3 about here
--------------------------------
Findings. Each of the 32 AU portfolio entries contained one activity; each of the 32
DU entries contained two activities. Each activity was coded independently. Thus, we
coded a total of 96 activities.
Overall, we judged 38 percent of the AU activities and 30 percent of the DU
activities to be tasks that had at least some high demand characteristics. That is, about
one of every three activities in the AU and DU portfolio submissions had some part that
exhibited the high-demand characteristics shown in Table 2. We next examined how the
high-demand activities were distributed across mathematics content topics.
Table 4 presents the distribution of high-demand and low-demand activities among
the five topic focus areas. This count was complicated for activities that were judged to
have more than one topic focus. To handle such cases, we counted the activity for each
topic area as a fraction depending upon the number of topic areas (e.g., if two topic areas
were identified, then each would receive 0.5 in the tally).

15
--------------------------------
Insert Table 4 about here
--------------------------------
Several observations are worth noting about the findings presented in Table 4.
Combining across the two entries, there was no topic area associated more with high-
demand activities than with low-demand activities. But the observation of cognitively
demanding tasks varied across topic areas. Activities that treated topics in Number and
Operations were six and one-half times as likely to be low-demand than high-demand
activities; whereas, activities that treated topics in Measurement and Data Analysis were
only about one and one-half times as likely to be low-demand than high-demand.
Activities that treated topics in Geometry were about twice as likely to be low-demand
than high-demand activities, and activities that treated topics in Algebra were almost
twice as likely to be low-demand than high-demand activities. In general, the ratios of
low-demand to high-demand activities for the topic areas are smaller for the AU entries
than for the DU entries, with Geometry being the lone exception. That is, teachers in our
sample were somewhat more likely to use cognitively demanding tasks in assessment to
evaluate student understanding than they were to use such tasks in instruction to develop
understanding.
In addition to examining variation in cognitive demand across topics, we also
examined variation across teachers. Not all teachers included high-demand tasks in their
portfolio entries. In fact, the high-demand tasks were submitted by about one-half of the
teachers in our sample: 53 percent of the teachers in our sample submitted one or more
cognitively demanding task, and 47 percent submitted only low-demand tasks. Some of

16
the teachers submitted only one cognitively demanding task, but others submitted more
than one. About one-third of the total sample submitted two or three cognitively
demanding tasks.
Pedagogical Features of NBPTS Portfolio Submissions
Mathematics classrooms for students in the upper elementary school and middle
grades have been characterized in research studies as places in which students often work
alone and in silence, with little or no access to each other or to suitable tools, on exercises
presented through textbooks or worksheets that make little or connection to either other
subjects taught in school or the world outside of school, to produce answers quickly and
efficiently without much attention to explanation, justification, or the development of
meaning (e.g., Stodolsky, 1988; Stigler & Hiebert, 1999). In response to this
characterization the NCTM Standards (1989, 2000) have suggested the potential
instructional value of fostering communication and interaction among students in the
mathematics classroom, through the use of complex tasks that are suitable for cooperative
group work and that provide settings in which students need to explain and justify their
solutions. The NCTM Standards also suggest the importance of connecting work done in
the mathematics classroom to other subjects and to the world outside school. Moreover,
the NCTM Standards also encourage the use of physical models and technological tools
both to engage students with “hands on” learning activities and to support their
developing conceptual understanding. Because these suggestions for pedagogical
innovation have received considerable attention in the past decade, we hypothesized that
they would be evident in the portfolios of applicants for NBPTS EA/M certification.
Therefore, in our analysis of the portfolio entries, we looked for evidence of the

17
following pedagogical features: setting tasks in contexts outside the domain of
mathematics itself, using hands-on materials and activities, using cooperative grouping,
setting tasks in interdisciplinary contexts, using technology (especially calculators and
computers), and requiring students to provide explanations of their thinking and
reasoning.
Coding for pedagogical features. Each portfolio entry was examined for evidence
that each pedagogical feature was employed. A portfolio entry was considered to give
evidence of an actualized use of a feature when the teacher’s description of the
instructional context clearly indicated the use of the feature in connection with the
submitted activity. In some cases, the teacher’s narrative description was not explicit
about the use of a pedagogical feature in connection with a submitted activity, but the
narrative did suggest that the feature might have been used. We noted these instances and
coded them as instances of potential uses rather than actualized uses of a feature. Because
a teacher’s explanation of the instructional context was not generally activity-specific for
the two activities in the DU entry, we decided to treat the entire DU entry, rather than
each activity, as the unit of analysis for the coding of pedagogical features. Thus, there
were 64 items coded in this analysis – 32 AU entries and 32 DU entries.
Initial rater training consisted of having one member of the research team and two
graduate assistants independently examine 8 of the 32 activities in the AU entries. For
each entry, the rater judged whether the pedagogical feature was actualized (A), potential
(P), or not evident, and generated a written rationale – typically, verbatim excerpts from
the portfolio entries—as evidence that the selected features were represented as coded.
Raters were nearly unanimous in their A and P classifications, though they sometimes

18
chose different aspects of the portfolio entry to support a common classification. The
only source of classification disagreement related to distinguishing interdisciplinary work
(i.e., about different school subjects) from contexts other than mathematics (i.e., “real
world” applications) in some settings (e.g., athletics, home economics). Such
disagreements were resolved through discussion to reach consensus. The working
definitions were refined accordingly. Table 5 gives the set of judgment criteria that
emerged from this initial coding.
--------------------------------
Insert Table 5 about here
--------------------------------
Given the high level of agreement, the remaining AU entries and all DU entries
were each coded by only one rater, but a reliability check was conducted for 8 randomly
selected entries (2 in AU, and 6 in DU). For these cases, the second rater agreed with the
first rater’s A and P classifications in all instances. To illustrate how the criteria were
applied to the AU and DU tasks, excerpts of entries that were associated with the coding
of actualized pedagogical features are provided in Table 6.
--------------------------------
Insert Table 6 about here
--------------------------------
Findings. As can be seen in Table 7, pedagogical features were observed in the
portfolio entries with varying frequency. The pedagogical features found most frequently
in the portfolio entries were the use of “hands on” materials and attention to applications
of mathematics to contexts outside of mathematics itself. These features were evident in a

19
little more than half of the AU entries. They were even more prevalent in the activities
submitted in DU entries, with nearly 9 of every 10 DU entries containing an activity
involving an application of mathematics to a context outside of mathematics and about 8
of every 10 DU entries containing a “hands on” activity. The least frequently observed
pedagogical feature was the requirement that students provide explanations or
justifications for their procedures or solutions. Only about 1 of every 4 AU entries
contained an activity that exhibited this feature, and only about 1 in 5 of the DU entries
had an activity with this feature.
--------------------------------
Insert Table 7 about here
--------------------------------
As Table 7 also indicates, the frequency of occurrence varied between AU and DU
entries. Except for the requirement that students provide an explanation or justification
for their procedure or solution, all other pedagogical features were more frequently found
in the activities provided in DU portfolio entries than in the activities in AU entries. This
general trend may suggest that teachers are more comfortable or more adept with using
cooperative groups, “hands on” activities, and technology in teaching situations rather
than in assessment situations. Teachers may be less likely to use applications and
interdisciplinary activities in assessment than in teaching because they wish to avoid the
negative effects on student performance of unfamiliar application settings. The AU
entries were more likely than the DU entries to contain activities that required students to
provide an explanation, which may be due to the fact that assessment tasks are likely

20
places to ask for such explanations. Nevertheless, the low frequency of this feature, even
in the AU entries, is surprising.
The variation noted between AU and DU entries led us to consider how consistent
teachers were in their deployment of these features. For each of the six pedagogical
features, Table 8 gives the percent of teachers for whom at least one portfolio entry
contained clear evidence of actual use of the feature.
--------------------------------
Insert Table 8 about here
--------------------------------
As might be expected from the findings reported in Table 7, the data in Table 8
show that almost all of the teachers in this sample of NBPTS applicants used outside
applications and “hands on” activities in the portfolio entries. Approximately two of
every three teachers used cooperative learning, and nearly that many used technology.
About half of the teachers in the sample used interdisciplinary activities, but less than
half used tasks that required students to give explanations.
Putting these findings in perspective. To interpret the extent to which the findings
reported in Table 8 suggest “pedagogically adventurous” instructional practice on the part
of NBPTS candidates, we compared our findings to data found in the Report of the 2000
National Survey of Science and Mathematics Teachers (Weiss, et al., 2001). The Weiss et
al. report is based on self-reports from a nationally representative sample of about 6000
teachers of mathematics in grades 1-12 in about 1200 schools. Weiss et al. report their
findings for teachers in three grade-level clusters, one of which is grades 5-8, and this is
the cluster of teachers that corresponds to age/grade specialization of applicants to the

21
NBPTS for EA/M certification. Before providing our comparison of points of agreement
and disagreement between the two sets of findings, it is important to note that these data
sources are different in many ways – including the nature of the data, the circumstances
under which the data were collected, and the data analysis procedures employed.
Therefore, these comparisons should be considered suggestive rather than conclusive.
In general, teachers in the NBPTS sample exhibited different use of the pedagogical
features than would have been expected from the national survey data. Although the
direction of the difference was not the same for all features, we found that NBPTS
teachers tended to be fairly adventurous pedagogically, when compared to the picture of
normative practice painted by the Weiss et al. report. Our sample of NBPTS applicants
employed three features far more than expected, one feature at about the expected
frequency, and only one feature far less than expected. 1
For three pedagogical features—using technology, using outside applications, and
using “hands on” activities—teachers in the NBPTS sample exhibited greater use of the
pedagogical strategies than would have been expected based on the national survey data.
Regarding the use of technology—the percent of teachers in our sample who actually
used the feature was similar to the percent of teachers in the national sample who
reported employing this pedagogical feature at least once each week. In the Weiss et al.
1 A comparison is difficult to make for the sixth pedagogical feature – using interdisciplinaryactivity—because Weiss et al. (2001) indicate only the percent of teachers in their sample who reporteddaily use of this strategy and they do not indicate the percent of teachers in their sample who reportedweekly use. Although only 17 percent of the teachers in their sample reported daily use of interdisciplinaryactivity—which is much lower than the 50 percent of the teachers in our NBPTS sample who included aninterdisciplinary activity in at least one portfolio entry—we think a reasonable comparison requiresincluding the percent of teachers in the national sample who reported weekly use of this strategy.

22
(2001) survey 49 percent of grade 5-8 teachers reported using calculators or computers
for developing concepts and skills. In Table 8 we see that 59 percent of the teachers in
our sample actually used technology in either the AU or DU portfolio entries, or in both.
A similar trend was found for the use of outside mathematics contexts and for the
use of concrete materials and “hands on” activities. Weiss et al. indicated that 57 percent
of grade 5-8 teachers reported using concrete materials in their lessons, and 71 percent of
these teachers reported having students use mathematical concepts to interpret and solve
applied problems, at least once each week. In contrast, 84 percent of the teachers in our
sample actually included at least one “hands on” activity in their portfolio entries, and 91
percent of the teachers actually used contexts outside mathematics as a setting for student
work in at least one of the two portfolio entries we examined.
In these latter cases, the observed difference may be at least partially attributable to
somewhat different pedagogical features being considered. The term “concrete
materials,” which was used in the Weiss et al. survey, may provoke a narrower
interpretation than the term “hands on” activities, which we used in our analysis of the
NBPTS portfolios. For example, it is not certain that a teacher would consider cereal
boxes to be concrete materials for the purposes of responding to a survey question, but
we did consider a task involving the analysis of data from a variety of cereal boxes to be
an instance of a “hands on” activity. Some similar phenomenon may be affecting the
findings for the use of contexts outside mathematics.
For another pedagogical feature, cooperative groups, the percent of teachers in our
NBPTS sample who exhibited use of the feature in their portfolio entries was lower than
the percent of teachers in grades 5-8 in the national sample who reported employing this

23
pedagogical feature at least once each week. In the Weiss et al. (2001) survey 83 percent
of grade 5-8 teachers reported using cooperative groups at least once each week. We
found that only 66 percent of the teachers in our sample documented the actual use of
cooperative groups in at least one of the two entries we examined. But if we include the
additional 16 percent of the teachers in our sample who wrote in their portfolio narratives
about using cooperative groups in their teaching, then the totals in the two groups are
very similar.
There was only one pedagogical feature for which NBPTS teachers were markedly
less “pedagogically adventurous” than would be expected from the national survey
results. NBPTS teachers in our sample were far less likely to require students to provide
explanations than would have been predicted from the responses given by the grades 5-8
teachers in the national sample. In the Weiss et al. (2001) survey, 56 percent of the grade
5-8 teachers indicated that they required such explanations every day or almost every day
in their classroom. Although Weiss et al. do not report the percent of teachers who
reported requiring student explanations at least once each week, the percent reporting
daily use already exceeds the 44 percent of our NBPTS sample who used, or at least
wrote about using, tasks that required students to give explanations (see Table 8). Even if
we include an additional 3 percent of the teachers in our NBPTS sample who wrote in
their portfolio narratives about requiring student explanations in their teaching, the totals
in the two groups remain quite different. Moreover, Weiss et al. reported that 71 percent
of the grade 5-8 mathematics teachers indicated that they assessed students at least
monthly using tests that require them to provide descriptions or explanations for open-

24
ended questions. This is more than double the 28 percent of our NBPTS sample who
submitted an AU portfolio activity that required students to provide an explanation.
Relating Mathematical and Pedagogical Features of the Portfolio Entries
Previous research has shown that high-demand tasks are challenging for
mathematics teachers to use well with students in the middle grades, but they can be
successfully enacted when teachers employ certain pedagogical strategies effectively
(Henningsen & Stein, 1997; Stein, et al, 1996; Stein, et al. 2000). Moreover, some
observers of mathematics reform efforts in the past decade (e.g., Cohen, 1990; Ferrini-
Mundy & Schram, 1997) have noted that even when reform ideas are evident in the
rhetoric and actions of teachers and others in schools and classrooms, these ideas are
often implemented in superficial ways. Similarly, Stigler and Hiebert (1999) reported that
most of the U.S. grade 8 teachers in the TIMSS Video Analysis Study reported an
awareness of ideas espoused in the NCTM Standards, and they expressed a belief that
they were implementing these ideas in their teaching; yet, the analysis of their teaching
detected almost no evidence of any real implementation of these ideas. Thus, we
undertook an analysis to detect the extent to which teachers in our sample of applicants
for NBPTS EA/M certification used pedagogical strategies to support students’
engagement with high-demand mathematics tasks. In particular, we were interested in
which pedagogical features, if any, were strongly associated with teachers’ use of high-
demand tasks.
For the AU and DU portfolio entries, we created 2-by-2 contingency tables,
crossing cognitive demand (high or low) with pedagogical feature (present or absent). For
each pedagogical feature, each contingency table displayed the number of teachers in our
25
sample who submitted entries that were coded with the corresponding pair of
characteristics. For this analysis, we considered pedagogical features to be present only
when they were coded as actualized features. For the DU entries, we collapsed the
cognitive demand coding for the two submitted activities, and we considered an entry to
be high-demand if it contained at least one activity coded as high-demand.
We analyzed the data in these tables using Chi-square tests, and we found no
evidence that any of the pedagogical features were strongly associated with the use of
cognitively demanding tasks in either the AU entries or the DU entries. Table 9 provides
a summary that collapses all the 2-by-2 tables, providing the information that appeared in
each small table in the column corresponding to the pedagogical feature being present.
--------------------------------
Insert Table 9 about here
--------------------------------
Of the 12 chi-square analyses conducted, only one indicated a significant
relationship between cognitive demand and the use of a pedagogical feature—the use of
interdisciplinary activities in AU entries (χ2 (32, 1) = 6.400, p < .05). In this case, the
relationship was negative. That is, interdisciplinary activities submitted in AU portfolio
entries were significantly more likely to be low demand activities than to be high-demand
activities. No significant positive relationships were indicated.
The findings of our analysis of the relationship between cognitive demand and
pedagogical features suggests that, although the teachers in our sample were using many
innovative pedagogical strategies, the teachers were not using them in any systematic
way to support students’ engagement with cognitively demanding mathematics tasks. In

26
this way, the teachers in our NBPTS sample are probably not very different from other
teachers of mathematics in grades 5-8.
A partial explanation for the apparent disconnection between pedagogy and
mathematical demand may be found in the diverse array of instructional goals and
motivations that were mentioned by teachers in the description sections (e.g.,
instructional context, planning) of their AU and DU portfolio entries. Some of the goals
expressed by teachers related to mathematical content (e.g., understanding ratios, solving
equations, organizing and interpreting data). Other teacher goals related more to
mathematical processes as outlined in the Principles and Standards for School
Mathematics (NCTM, 2000) (e.g., developing problem-solving strategies, providing
opportunities for communication, connecting mathematics to the real world). Yet,
perhaps most interesting was the substantial number of goals related to non-mathematical
issues confronting middle grades math teachers (e.g., building students’ self-confidence
in mathematics, addressing students’ learning styles, preparing students for standardized
test and future courses). In general, we found that teachers stated many goals for their
teaching, some exceeding 50 in number for any given entry. In addition to the number of
goals, the varied, and sometimes possibly competing, content of those goals may play a
role in teachers’ inability to implement innovative pedagogical strategies in the service of
cognitively demanding mathematical tasks.
Contrasting the Mathematical and Pedagogical Features of Portfolio Entries Submitted
by Certified and Non-certified Teachers
Our random sample included 13 individuals who obtained NBPTS certification and
19 who did not. One major goal of this study was to contrast the nature and quality of the

27
portfolio entries submitted by applicants who obtained NBPTS certification with those
who did not. Toward that end we contrasted the mathematical and pedagogical features of
the entries submitted by these two subsets of the total sample of NBPTS applicants.
Before presenting the findings, we first describe how decisions are made to award
NBPTS certification to applicants.
Certification decisions are based on the total scaled score candidates earn on the
overall assessment. The total score is a weighted sum of scores on 10 exercises — six
portfolio entries (Developing mathematical understanding, Assessing mathematical
understanding, Engaging a whole class in mathematical discussion [video entry],
Engaging small groups in mathematical interactions [video entry], Collaboration in the
professional community, and Outreach to families and the community) and four test
center exercises — (Content knowledge, Analysis of student work, Using manipulative
materials to develop understanding, and Using technology to develop understanding). All
the exercise scores are reported on a scale that ranges from 0.75 to 4.25. Exercises are
weighted because certain exercises were judged as being more important to the
certification decision than others. The two portfolio entries considered in this study were
among the four most heavily weighted entries in determining the total score.
To arrive at a total scaled score, each final exercise score is multiplied by its weight
and the sum is taken to these 10 weighted exercise scores; a 12-point constant is added to
ensure consistent reporting across certificates and administrations. The final value is then
rounded to the nearest whole number. The performance standard for all NBPTS
certificate fields is 275 points (including the 12-point constant). To be awarded a

28
certificate of accomplished teaching practice, a candidate’s total scaled score must be
equal to or greater than 275 points.
Mathematical demands. As we noted earlier, about half of the teachers in our
sample submitted portfolio entries containing at least one mathematics activity coded as a
high-demand activity. Table 10 shows the distribution of NBPTS certified (and non-
certified) teachers who submitted (or did not submit) at least one high-demand activity.
--------------------------------
Insert Table 10 about here
--------------------------------
These data suggest a strong association between NBPTS certification and the
submission of cognitively demanding tasks. In particular, four of every five teachers who
submitted exclusively low-demand tasks in these two portfolio entries did not obtain
NBPTS certification. Similarly, very few teachers who obtained NBPTS certification
submitted exclusively low-demand tasks in the two portfolio entries we examined. Three
of every four teachers who obtained NBPTS certification submitted at least one high-
demand task in the two portfolio entries we examined. A chi-square analysis indicated a
statistically significant association (χ2 (32, 1) = 4.98; p < .05).
Pedagogical features. Because the use of pedagogical features in the submitted
portfolio entries also varied across teachers, we could examine the use of these features
by teachers who did (or did not) obtain NBPTS certification. Table 11 shows the
distribution of NBPTS certified (and non-certified) teachers who submitted (or did not
submit) at least one activity which contained each of the pedagogical features we
considered in the two portfolio entries we examined.
29
--------------------------------
Insert Table 11 about here
--------------------------------
These data suggest a fairly weak association between NBPTS certification and the
use of most of the pedagogical features we examined. Consider, for example, the use of
hands-on activities, contexts outside mathematics, or small group activities. Each feature
was evident in at least one portfolio entry submitted by a majority of teachers who were
awarded NBPTS certification and in the entries submitted by a majority of teachers who
were not awarded NBPTS certification, though each feature was somewhat more likely to
be used by non-certified teachers. The pattern for the use of interdisciplinary activities
was somewhat different because it was less widely used by teachers in the portfolio
entries, but it was also slightly more likely to be used by non-certified teachers than by
those who obtained NBPTS certification. A negative trend between use of a pedagogical
feature and NBPTS certification was most evident for the pedagogical feature of
requiring students to produce explanations. In this case, teachers who obtained NBPTS
certification were about twice as likely not to ask for student explanations than to ask for
them; non-certified teachers were about as likely to ask for explanations as not to ask for
them. The strongest positive trend was found for the use of technology. About three of
every four teachers who obtained NBPTS certification also employed technology in at
least one of the two portfolio entries; non-certified teachers were about as likely to submit
as to not submit an entry that used technology. Chi-square tests indicated that none of
these relationships and trends was statistically significant.
Further contrasts of certified and non-certified teachers. We also used other
methods to contrast the mathematical and pedagogical character of the portfolio
30
submissions of certified and non-certified teachers. For example, we conducted an
analysis that removed the subset of the sample whose total NBPTS score was within an
error band around the cut score of 275. Because the decision to award or deny NBPTS
certification to these individuals whose scores are near the cut point are less certain than
for the other teachers in the sample, we conducted this analysis to detect patterns that
might be masked by potentially mis-classified individuals. Despite the reduced sample
size, the results of this analysis generally confirmed the findings reported above, and no
new significant relationships were identified.
Discussion
As we noted at the outset, national efforts to increase students’ mathematics
learning depend to a great extent on the success of efforts designed to improve the quality
of mathematics teaching. The NBPTS certification process represents an important
contribution both to the definition and recognition of teaching quality. Because the
portfolios that teachers assemble as part of the process of applying for NBPTS
certification provide opportunities for them to display samples of their best practice, the
entries comprise a rare database for the specification and analysis of teaching quality.
These records of instructional practice afford an unprecedented glimpse at the work of
teachers who are willing to submit themselves and samples of their work to a rigorous
judgement process to determine if they qualify for designation as highly accomplished
teachers.
In this exploratory study we analyzed samples of mathematics instruction and
assessment submitted by a random sample of 32 teachers from the total set of 250
applicants for NBPTS EA/M certification in 1998-99. In our analysis we investigated the

31
portfolio entries to look for evidence of selected mathematical and pedagogical features
that might be associated with high quality mathematics teaching. Because some of the
applicants were awarded NBPTS certification and some were not, it was possible to
contrast the mathematical and pedagogical features detected in the portfolio entries
submitted by the two groups. Thus, we also contrasted the mathematical and pedagogical
features of portfolio entries submitted by the 13 applicants who were awarded NBPTS
certification with the 19 who were not.
Before discussing the findings of our exploratory investigation of the portfolio
entries submitted by these teachers, it is worth noting some limitations. First, we
examined the entries of only 32 teachers, so generalizations to the entire population of
applicants for NBPTS EA/M certification should be made cautiously. However, a sample
of about 13 percent is reasonable for such a study, given the intensive qualitative analysis
required. Second, the corpus of data analyzed in this study was collected for a different
purpose. Ours was a secondary analysis of portfolio entries that were structured to allow
reliable scoring by trained raters to generate elements of a total score that could be used
to decide which teachers should be awarded NBPTS certification and which should not.
If one were to begin with questions regarding the mathematical and pedagogical features
considered in this study, one might well design a different process of collecting and
structuring the data. Nevertheless, the portfolio entries provide records of teachers’
instructional practice that they deem suitable as samples of their best practice. As such,
they constitute a reasonable data set for this investigation.
The NBPTS submissions were well balanced with respect to the treatment of
mathematics topics, but many were not particularly challenging. Contrary to expectations
32
based on some prior research on mathematics instruction in the upper elementary and
middle grades (e.g., Porter, 1989; Stodolsky, 1988), we found the portfolio entries to be
reasonably well balanced across mathematics topic areas—with activities frequently
treating topics in geometry and data analysis as well as in the traditionally more heavily
emphasized area of number and the currently heavily emphasized area of algebra.
However, in line with prior research on mathematics teaching at this age and grade level
(e.g., Stigler & Hiebert, 1999), we found that many of the mathematics tasks were not
very demanding. Despite the fact that we applied a generous criterion to determine
cognitive demand—if some part of an activity exhibited high-demand characteristics, it
was classified as highly demanding, even if other parts of the activity did not exhibit
high-demand characteristics—about half of the teachers in our sample failed to include in
their portfolio entries even a single task that was judged to be cognitively demanding. If
we applied a more stringent criterion—such as requiring that more than half of an activity
had to be judged to be cognitively demanding—the number of portfolio entries
containing high-demand tasks would have been reduced considerably.
Some of the activities submitted by teachers in our sample were quite demanding,
and would likely have been so judged even if more stringent criteria were applied, yet a
substantial portion of the teachers in our sample of applicants for NBPTS EA/M
certification did not include any mathematically demanding tasks. This finding is
especially surprising because these teachers were trying to exhibit their best practice.
Nothing in the directions provided by the NBPTS for the assembly of portfolios, nor in
the accompanying materials (such as the teaching standards themselves) appears to
discourage the inclusion of cognitively demanding tasks. Thus, this finding suggests that

33
many of these teachers either do not use such tasks in their instruction (and hence they
were unavailable for selection as portfolio entries), or they do not consider mathematical
demand to be a characteristic of highly accomplished mathematics teaching (and hence
they chose not to display it in their instructional samples).
The instructional practice evident in the NBPTS submissions was more
pedagogically adventurous than it was cognitively demanding. More than 80 percent of
the teachers included an activity involving “hands on” activities or contexts outside of
mathematics itself. For both of these pedagogical features, and also for the use of
technology, our sample of NBPTS applicants employed the strategies more frequently
than would have been predicted on the basis of the self-report data available from a
national survey of mathematics teachers in grades 5-8. The lone pedagogical feature used
less often than the national survey data suggested was requiring students to provide
explanations.
Although we found that teachers used innovative pedagogical strategies in their
classrooms, they did not do so in a way that was closely linked to supporting students’
encounters with challenging tasks. Even in our highly select sample of teachers who
applied for NBPTS certification—thereby indicating that they thought of themselves as
potentially highly accomplished teachers—we found little evidence innovative pedagogy
was used to support students’ engagement with cognitively demanding tasks in the
mathematics classroom in grades 5-8. In this respect, the findings of this exploratory
investigation are consistent with some other research studies (e.g., Cohen, 1990; Ferrini-
Mundy & Schram, 1997), and many anecdotes, suggesting that teachers may implement
reform pedagogy in a superficial manner that does not realize their potential.
34
Our findings, based on the work of a self-selected group of teachers, suggest that
the larger population of mathematics teachers in grades 5-8 is likely to need assistance in
learning to use innovative pedagogical features effectively to support students’
engagement with challenge in the mathematics classroom. This set of findings seems
especially important in light of evidence not only that teachers at this age and grade level
find it difficult to enact cognitively challenging tasks in the mathematics classroom (Stein
et al, 1996) but also that the consistent, effective use of cognitively demanding tasks in
the mathematics classroom increases student achievement (Stein & Lane, 1996; Stein,
Lane & Silver, 1996).
We found it especially surprising and concerning that requiring students to give
explanations was the least used pedagogical strategy among those we examined. This is
arguably the one strategy among the six we considered that can be most easily and
directly linked to cognitively demanding activity in the classroom. The fact that NBPTS
applicants, even those who were awarded NBPTS certification, used this pedagogical
strategy infrequently and in a manner that was not associated with high-demand tasks
suggests that mathematics teachers more broadly will need additional support to learn to
use this particular pedagogical feature effectively.
One intriguing aspect of the apparent disconnection between pedagogical
innovation and cognitively demanding mathematical tasks that merits further careful
exploration is the array of goals and intentions expressed by the teachers in our sample as
they described their planning and the instructional context of their portfolio entries. In
general, we found that teachers stated many goals for their teaching. Although we did not
report herein a careful, complete analysis of these goals, it was our impression that the

35
mathematical goals expressed by teachers were not highly specific, nor were they often
tied to pedagogical strategies. On the other hand, it was our impression that the diverse
set of goals related to non-mathematical issues confronting middle grades math teachers
(e.g., building students’ self-confidence in mathematics, addressing students’ learning
styles, preparing students for standardized test and future courses), though diffuse and
often also stated quite generally, were more likely to be tied to pedagogical strategies. A
careful analysis of the varied, and possibly competing, goals that teachers hold for their
instructional activities may shed more light on how to assist teachers to employ
innovative pedagogical strategies in the service of cognitively demanding mathematical
tasks in the classroom.
Our analysis of these portfolio entries also suggests that teachers may need more
opportunities to explain what they do and why they do it. Many of the teachers in our
sample failed to articulate clearly their goals and approaches to mathematics teaching.
The narrative portions of the portfolio entries were sometimes quite difficult to
understand and interpret, as many teachers used educational jargon quite liberally and
some moved across topics in a seemingly disconnected ramble. Thus, it seems that
teachers might need and benefit from professional development experiences that assist
them to become more adept at examining and reflecting on their instructional practice
and then expressing in writing the results of their examination and reflection. The use of
narrative and video cases and written reflections seem especially promising in this regard
(e.g., Schifter, 1996; Stein, et al, 2000) because they can help teachers learn to use
frameworks systematically to analyze and express key aspects of their practice.

36
Moving beyond the particulars of this investigation, we also see some broader
implications of this study. In particular, our exploration can be viewed as an indirect
examination of the validity of the NBPTS certification process. Moreover, our findings
may have broader implications for studies that seek observation-based generalizations
about mathematics teachers’ instructional practice
Our investigation of the portfolio entries was not intended to be a validation study
of the NBPTS certification process, and a replication involving a larger sample would be
needed to make strong claims. Nevertheless, some of our findings do provide some
validation of that process. In particular, the lack of correspondence between the awarding
of NBPTS certification and the use of pedagogical features can be taken as evidence that
the portfolio evaluation process is not heavily influenced by possibly superficial
implementation of pedagogical innovation. And the positive association of low-demand
mathematics tasks with non-certified teachers and high-demand mathematics tasks with
certified teachers suggests that there is some reason to think that the instructional practice
of those teachers awarded NBPTS certification is in fact “highly accomplished” in one
mathematically important way that is not an explicit part of the NBPTS certification
process.
These results from our study are generally supportive of the NBPTS process and
outcomes, but a more complete investigation of the relationship would involve other
analyses, such as the examination of portfolio entry scores in relation to our coding. Our
preliminary examination of this relationship suggests some reasons to be concerned about
the scoring of individual portfolio entries. For example, 17 DU portfolio entries contained
two low-demand activities, yet 65 percent of these entries received “accomplished”

37
scores (a score 3 or greater) from the NBPTS assessors. Thus, our preliminary analysis
suggests that the presence of low-demand tasks do not reliably predict a low assessor
score on a particular entry, even though they appear to be related more generally to a low
total score for the entire NBPTS process.
Several other extensions of this investigation also appear to be worth pursuing. For
example, one could consider our analysis of mathematical and pedagogical features in
these entries in relation to teachers’ performances on other exercises and entries deemed
important, such as the video-based portfolio entries or the test center exercise that
assesses mathematics content knowledge. Moreover, one would undoubtedly want to
know how the features of instructional practice identified in our analysis of the portfolio
entries are enacted more broadly in the instructional practice of NBPTS certified teachers
throughout an entire year of instruction and how those features appear to influence and
impact student learning.
Our analysis of cognitive demands in the mathematics tasks submitted by teachers
in our sample indicated that the assessment (AU) entries were more balanced with respect
to cognitive demands than were the teaching (DU) entries. That is, in all topic areas
except geometry, the ratio of low-demand to high-demand tasks in AU entries was closer
to one than in the DU entries (see Table 4). Large-scale research studies of teachers’
instructional practice, such as the TIMSS video analysis (Stigler & Hiebert, 1997), tend
to focus exclusively on the teaching of classroom lessons rather than the assessment
activities used by teachers. Thus, our findings suggest that studies that focus exclusively
on teaching that corresponds more to the requirements of the DU entry than the AU entry
may underestimate the extent to which cognitively demanding tasks are used with

38
students. Certainly, our findings suggest that more attention to teachers’ assessment
practices could provide valuable information about their classroom instruction that would
complement the kind of information available form surveys and studies of teaching
practice itself.
At the end of this presentation we return full circle to a question we stated near the
beginning: What is the nature of highly accomplished mathematics teaching? Our
analysis of this sample of teacher portfolio entries has identified some features of
instructional practice that appeared to be consistent with the conceptions of highly
accomplished instructional practice held and enacted by some of the teacher applicants
for NBPTS EA/M certification. Our analysis also identified some features that did not
appear to be consistent with the ways in which these teachers thought about or conducted
what they considered highly accomplished instruction. Much remains to be done in
understanding the nature of such practice, useful ways to record and describe it, and
effective means of supporting its development.

39
References
Beaton, A. E.,, Mullis, I. V. S., Martin, M. O., Gonzalez, E. J., Kelly, D. L., & Smith, T.
A. (1996). Mathematics achievement in the middle school years: IEA’s Third
International Mathematics and Science Study.
Cohen, D. K. (1990). A revolution in one classroom: The case of Mrs. Oublier.
Educational Evaluation and Policy Analysis, 12, 327-345.
Ferrini-Mundy J., & Schram, T. (Eds.). (1997). The Recognizing and Recording Reform
in Mathematics Education project: Insights, issues, and implications (JRME
Monograph No. 8). Reston, VA: National Council of Teachers of Mathematics.
Henningsen, M., & Stein, M. K. (1997). Mathematical tasks and student cognition:
Classroom-based factors that support and inhibit high-level mathematical thinking
and reasoning. Journal for Research in Mathematics Education, 28, 524-549.
Jaeger, R., & Bond, L. (2000). The accomplished teacher validation study. Available
from National Board of Professional Teaching Standards.
Kilpatrick, J., Swafford, J., & Findell, B. (Eds.). (2001). Adding it up: Helping children
learn mathematics. Washington, DC: National Academy Press.
National Assessment of Educational Progress. (1988). Mathematics objectives: 1990
Assessment. (Report 21-M-10). Princeton, NJ: Educational Testing Service and
Author.
National Board for Professional Teaching Standards. (1998). Middle childhood through
early adolescence/mathematics standards. Washington, DC: Author.
National Commission on Teaching and America’s Future (1996). What matters most:
Teaching for America’s future. New York: Author.
National Council of Teachers of Mathematics [NCTM]. (1989). Curriculum and
evaluation standards for school mathematics. Reston, VA: Author.
National Council of Teachers of Mathematics [NCTM] (1991). Professional standards
for teaching mathematics. Reston, VA: Author.
40
National Council of Teachers of Mathematics [NCTM] (2000). Principles and standards
for school mathematics. Reston, VA: Author.
Porter, A. (1989). A curriculum out of balance: The case of elementary school
mathematics. Educational Researcher, 18 (5), 9-15.
Schifter, D. (Ed.). (1996). What’s happening in math class? Envisioning new practices
through teacher narratives. New York: Teachers College Press.
Schmidt, W. H., McKnight, C. C., Cogan, L. S., Jakwerth, P. M., & Houang, R. T.
(1999). Facing the consequences: Using TIMSS for a closer look at U.S. mathematics
and science education. Dordrecht: Kluwer.
Silver, E. A., & Kenney, P. A. (Eds.). (2000). Results from the seventh mathematics
assessment of the National Assessment Educational Progress. Reston, VA: National
Council of Teachers of Mathematics.
Stake, R. E., & Easley, J. (Eds.). (1978). Case studies in science education. Urbana, IL:
University of Illinois.
Stein, M. K., Grover, B. W., & Henningsen, M. (1996). Building student capacity for
mathematical thinking and reasoning: An analysis of mathematical tasks used in
reform classrooms. American Educational Research Journal, 33, 455-488.
Stein, M. K., & Lane, S. (1996). Instructional tasks and the development of student
capacity to think and reason: An analysis of the relationship between teaching and
learning in a reform mathematics project. Educational Research and Evaluation, 2
(1), 50-80.
Stein, M.K., Lane, S., & Silver, E.A. (1996, April). Classrooms in which students
successfully acquire mathematical proficiency: What are the critical features of
teachers’ instructional practice? Paper presented at the annual meeting of the
American Educational Research Association, New York, NY.
Stein, M. K., Smith, M. S., Henningsen, M., & Silver, E. A. (2000). Implementing
standards-based mathematics instruction. New York: Teachers College Press.

41
Stigler, J. W., & Hiebert, J. (1997). Understanding and improving classroom mathematics
instruction: An overview of the TIMSS video study. Phi Delta Kappan, 79 (1), 14-21.
Stigler, J. W., & Hiebert, J. (1999). The teaching gap. New York: The Free Press.
Stodolsky, S. (1988). The subject matters: Classroom activity in mathematics and social
studies. Chicago: University of Chicago Press.
U.S. Department of Education (2000). Before it’s too late. A report to the Nation from the
National Commission on Mathematics and Science Teaching for the 21st century.
Washington, DC: Author.

42
Table 1
Number of Activities Treating Single and Multiple Mathematical Topics by Type of Entry
Mathematical Topic Categories DU Entries AU Entries
Single Topic
Number and Operations 12 6
Algebra and Functions 12 10
Measurement 2 1
Geometry 15 4
Data Analysis, Statistics, and Probability 13 6
Total 54 27
Multiple Topics
Number & Data 2 0
Measurement & Algebra 0 1
Measurement & Geometry 4 2
Number, Algebra, & Measurement 1 0
Algebra, Measurement, & Geometry 1 1
Algebra, Measurement, & Data 2 0
All Topics 0 1
Total 10 5
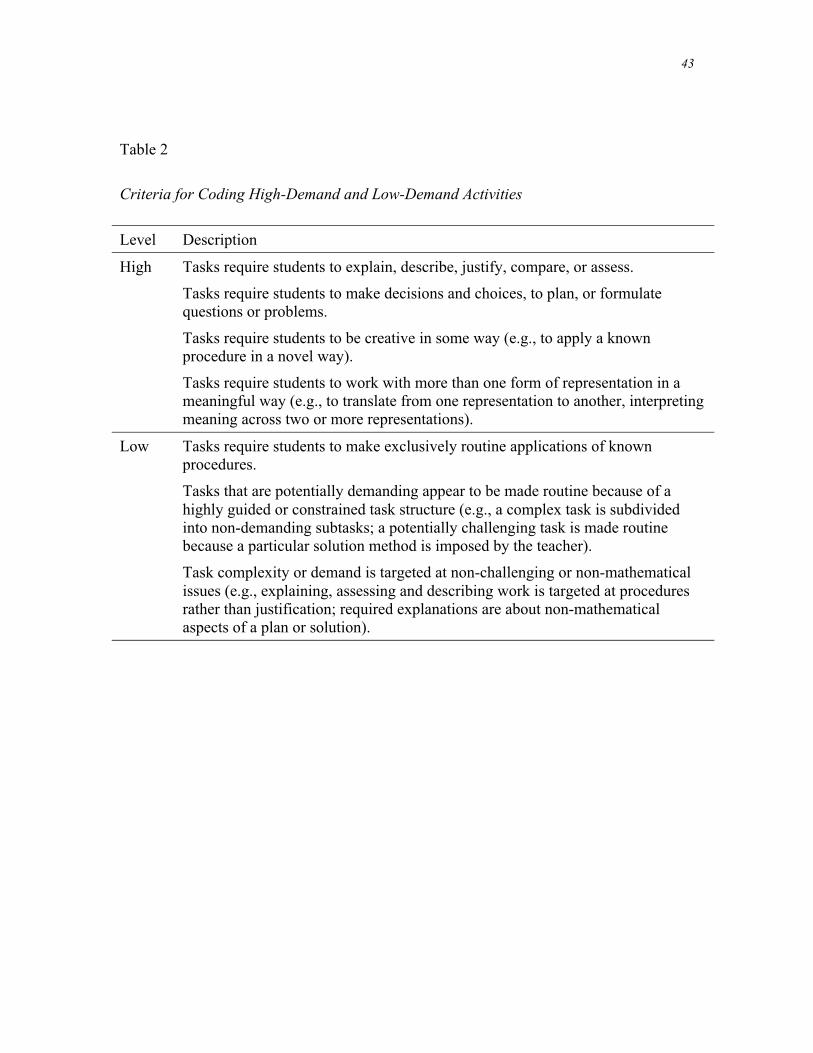
43
Table 2
Criteria for Coding High-Demand and Low-Demand Activities
Level Description
High Tasks require students to explain, describe, justify, compare, or assess.
Tasks require students to make decisions and choices, to plan, or formulatequestions or problems.
Tasks require students to be creative in some way (e.g., to apply a knownprocedure in a novel way).
Tasks require students to work with more than one form of representation in ameaningful way (e.g., to translate from one representation to another, interpretingmeaning across two or more representations).
Low Tasks require students to make exclusively routine applications of knownprocedures.
Tasks that are potentially demanding appear to be made routine because of ahighly guided or constrained task structure (e.g., a complex task is subdividedinto non-demanding subtasks; a potentially challenging task is made routinebecause a particular solution method is imposed by the teacher).
Task complexity or demand is targeted at non-challenging or non-mathematicalissues (e.g., explaining, assessing and describing work is targeted at proceduresrather than justification; required explanations are about non-mathematicalaspects of a plan or solution).

44
Table 3
Examples of Coding for High Demand and Low Demand Activities
Level Summary of the Activity Coding with Rationale
High Teacher created activity that integrates probability, number andoperation sense, geometry and measurement. Students have todesign a dartboard that has four regions with given features(scores 100, 50, 25, and 10; probabilities of 10%, 20%, 30%, and40% respectively; any shape; area between 1000 and 3000 cm2).They may assume that probability is proportional to the area of theregion. They have to produce a scale drawing with dimensionsand explain solutions in words (statement, procedure, andevaluation) (#9, AU)
The students had to devise a plan and consider severalconstraints to carry it out. Even thought the calculationsmight be simple (find radius/dimensions from given areas,subtract areas for rings, set up proportions, and find area sizebased on probability) how to find a solution requiredcreativity. Students’ narratives were clear, organized, andcomplete. Teacher mentions that the activity was a portfolioentry for problem solving. It is not clear how much time wasdedicated to this activity.
Students had to design a miniature golf course, using at least foursolids; they had to produce nets for each shape, showingdimensions, and an isometric drawing of the station. Students hadto pass an inspection that looked for description of the station,nets, isometric drawing, and overall comments. (#3, DU1).
Students had the freedom to choose the solids and had tocreate a difficult course; they had many constraints toconsider; producing the net involved required measures inboth 3D and 2D spaces and coordinate them. Students had toplan carefully their work in order to make sure they get to asolution.
Low Find Sale Price. Worksheet illustrating how to calculate the priceof an item on sale. (#19, DU)
Students have to repeat step-by-step procedures modeled inthe example provided.
Ten-problem quiz, without calculators or manipulative materials,though the latter were used in the instruction. No time limit.Includes questions about subtraction of integer numbers,manipulation of simple algebraic equations, and word problemsinvolving subtraction of integer numbers (plane altitude andtemperature), Short answers are required. It seems that studentsmay work with a partner. (#7, AU)
The activity looks for knowledge of facts, most of themcommitted to memory.

45
Table 4
Number of High Demand and Low Demand Activities by Mathematical Topics
AU Entries DU Entries
Topic Low High Total Low High Total
Number and Operations 5 1.2 a 6.2 11.8 1.5 13.3
Measurement 1.5 1.5 3 3.7 1.7 5.3
Geometry 4 1.5 5.5 11.3 6 17.3
Algebra and Functions 6.5 4.5 11 8.7 4.7 13.3
Data Analysis, Probability
and Statistics
3 3.2 6.2 9.5 5.2 14.7
Total 20 12 32 45 19 64
Notes: a. Activities that treated more than one topic were shared proportionally
among all the contributing topics.
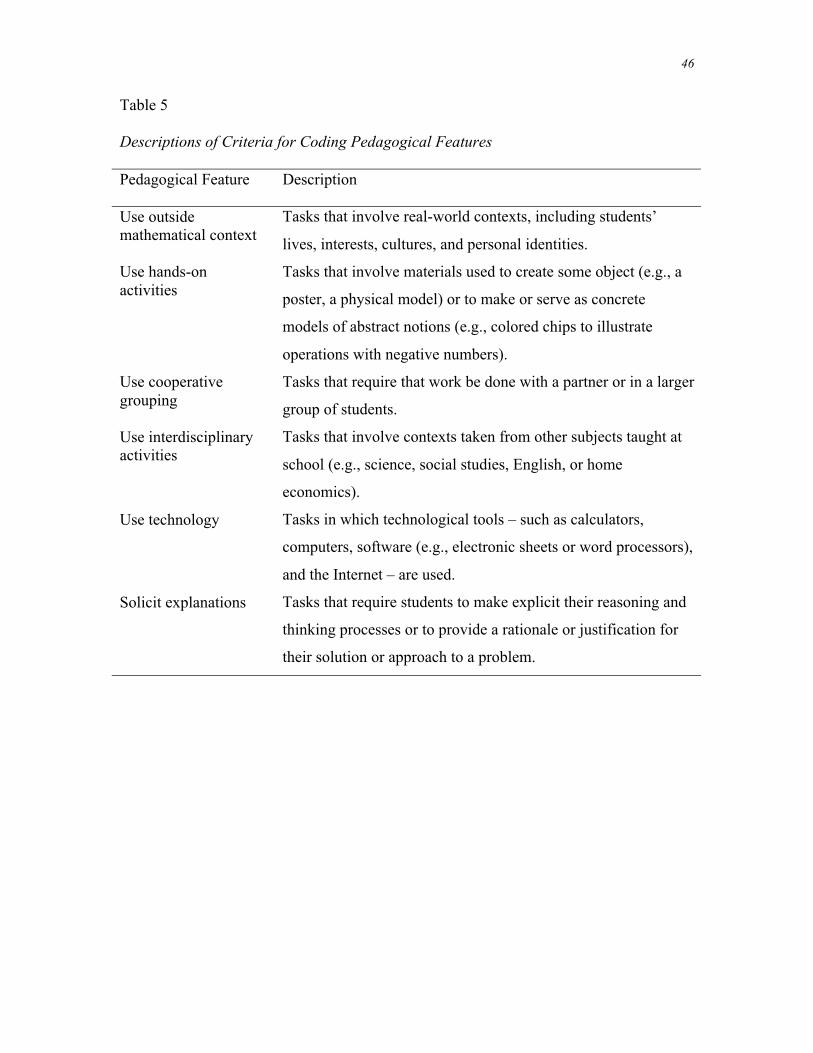
46
Table 5
Descriptions of Criteria for Coding Pedagogical Features
Pedagogical Feature Description
Use outsidemathematical context
Tasks that involve real-world contexts, including students’
lives, interests, cultures, and personal identities.
Use hands-onactivities
Tasks that involve materials used to create some object (e.g., a
poster, a physical model) or to make or serve as concrete
models of abstract notions (e.g., colored chips to illustrate
operations with negative numbers).
Use cooperativegrouping
Tasks that require that work be done with a partner or in a larger
group of students.
Use interdisciplinaryactivities
Tasks that involve contexts taken from other subjects taught at
school (e.g., science, social studies, English, or home
economics).
Use technology Tasks in which technological tools – such as calculators,
computers, software (e.g., electronic sheets or word processors),
and the Internet – are used.
Solicit explanations Tasks that require students to make explicit their reasoning and
thinking processes or to provide a rationale or justification for
their solution or approach to a problem.
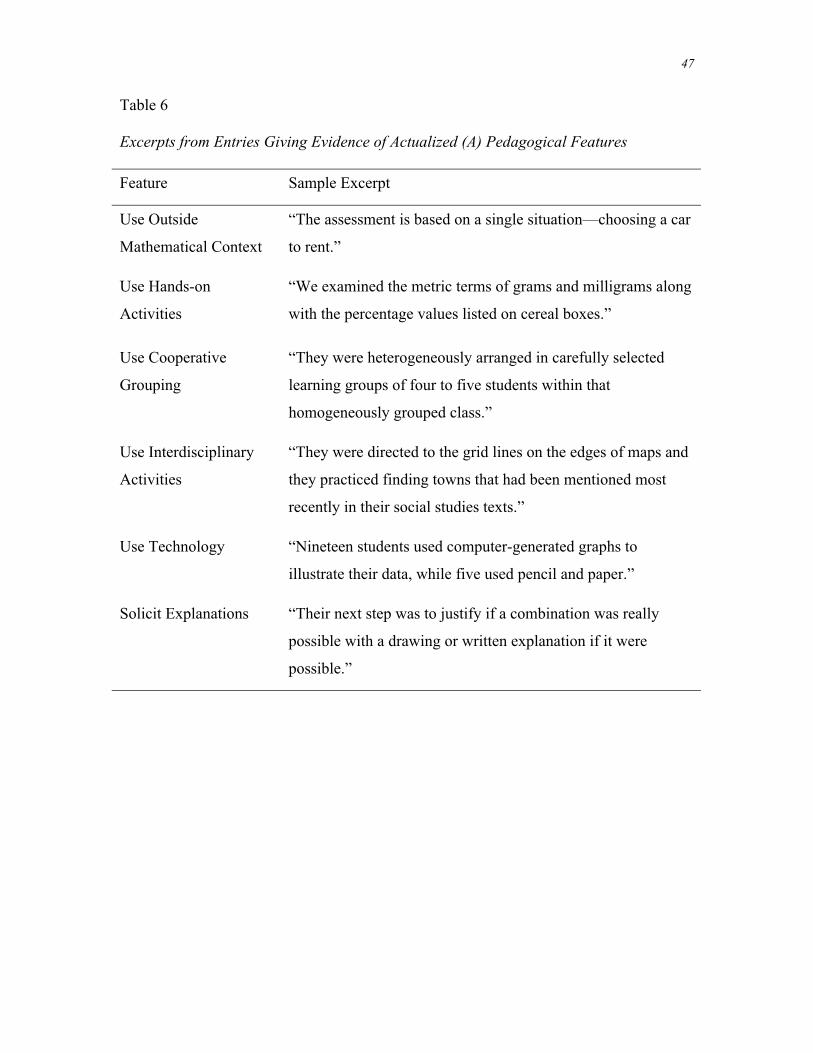
47
Table 6
Excerpts from Entries Giving Evidence of Actualized (A) Pedagogical Features
Feature Sample Excerpt
Use Outside
Mathematical Context
“The assessment is based on a single situation—choosing a car
to rent.”
Use Hands-on
Activities
“We examined the metric terms of grams and milligrams along
with the percentage values listed on cereal boxes.”
Use Cooperative
Grouping
“They were heterogeneously arranged in carefully selected
learning groups of four to five students within that
homogeneously grouped class.”
Use Interdisciplinary
Activities
“They were directed to the grid lines on the edges of maps and
they practiced finding towns that had been mentioned most
recently in their social studies texts.”
Use Technology “Nineteen students used computer-generated graphs to
illustrate their data, while five used pencil and paper.”
Solicit Explanations “Their next step was to justify if a combination was really
possible with a drawing or written explanation if it were
possible.”

48
Table 7
Percent of Portfolio Entries of Each Type with Actual (A) or Potential (P) Use of Each
Pedagogical Feature
AU Entries DU Entries
Pedagogical Feature Actual Use Potential Use Actual Use Potential Use
Use Outside MathematicalContexts
56 31 88 13
Use Hands-on Activities 56 3 78 9
Use Cooperative Grouping 38 22 63 16
Use InterdisciplinaryActivities
25 9 41 3
Use Technology 28 6 59 3
Solicit Explanations 28 6 19 0
Note: All percents in this table are based on n = 32.

49
Table 8
Percent of Teachers Actually Using Each Pedagogical Feature
Pedagogical Feature Percent of Teachers Using
Each Feature
Use Outside Mathematical Contexts 91
Use Hands-on Activities 84
Use Cooperative Grouping 66
Use Interdisciplinary Activities 50
Use Technology 59
Solicit Explanations 41
Note: All percents in this table are based on n = 32.

50
Table 9
Number of Teachers Using Each Pedagogical Feature by Type of Portfolio Entry and
Cognitive Demands
AU Entries DU Entries
Pedagogical Feature High
Demand
Low
Demand
High
Demand
(1 or 2)
Low
Demand
Use Outside MathematicalContexts
6 12 14 14
Use Hands-on Activities 6 12 14 11
Use Cooperative Grouping 4 8 11 9
Use InterdisciplinaryActivities
0 8 6 7
Use Technology 5 4 10 9
Solicit Explanations 5 4 4 2

51
Table 10
Number of NBPTS Certified and Non-certified Teachers Submitting High-Demand
Activities in At Least One Portfolio Entry
NBPTS Certification
Yes No
High Cognitive Demand Tasks
Present 10 7
Not Present 3 12

52
Table 11
Number of NBPTS Certified and Non-certified Teachers Giving Evidence of Using
Pedagogical Features in At Least One Portfolio Entry
NBPTS Certification
Yes No
Feature
Present
Feature
Not Present
Feature
Present
Feature
Not Present
Use Outside Mathematical Contexts 12 1 17 2
Use Hands-on Activities 11 2 16 3
Use Cooperative Grouping 9 4 12 7
Use Interdisciplinary Activities 6 7 10 9
Use Technology 10 3 9 10
Solicit Explanations 4 9 9 10