characterizing interstate crash rates based …docs.trb.org/prp/16-1194.pdf · characterizing...
TRANSCRIPT

CHARACTERIZING INTERSTATE CRASH RATES BASED ON TRAFFIC
CONGESTION USING PROBE VEHICLE DATA
Michelle M. Mekker
Purdue University
550 Stadium Mall Drive, West Lafayette, IN 47907-2051
Tel: 765-496-7314; Email: [email protected]
Stephen M. Remias
Wayne State University
Email: [email protected]
Margaret L. McNamara
Purdue University
Email: [email protected]
Darcy M. Bullock, Corresponding Author
Purdue University
550 Stadium Mall Drive, West Lafayette, IN 47907-2051
Tel: 765-494-2226; Email: [email protected]
Word count: 4,419 words text + 10 tables/figures x 250 words (each) = 6,919 words
References count: 24
November 11, 2015

Mekker, Remias, McNamara, Bullock 1
ABSTRACT Crash reduction factors are widely used by engineers for prioritizing safety investments. Work zones are
routinely analyzed by the length and duration of queues. Queue detection warning technology has been
growing in availability and reliability in recent years. This paper analyzes three years of crash data and
crowd-sourced probe vehicle data to classify crashes as being associated with queueing conditions or free-
flow conditions. In 2014, only 1.2% of the distanced-weighted hours of operation of Indiana interstates
operated at or under 45 MPH. A three-year study on Indiana interstates indicates that commercial vehicles
were involved in 87% of back-of-queue fatal crashes compared to 39% of all fatal crashes during free
flow conditions. A new measure of crash rate was developed to account for the presence and duration of
queues: crashes per mile-hour of congestion. The congested crash rate on all Indiana interstates in 2014
was found to be 24 times greater than the uncongested crash rate. Queues were found to be present for
five minutes or longer prior to approximately 90% of congestion crashes in 2014. Longer term, this
information shows the importance in the development of technology that can warn motorists of traffic
queues.
Keywords: Queue, Congestion, Crash Rate, Exposure, Safety, Probe Data

Mekker, Remias, McNamara, Bullock 2
INTRODUCTION AND MOTIVATION Congestion impacts both safety and mobility on the roadway. There is a debate whether congestion
improves safety by causing lower speeds or degrades safety by increasing the number of potential
opportunities for crashes. This paper studies historical crash data to determine crash rates during
congested and uncongested traffic conditions on the interstates of Indiana. The purpose of this paper is to
provide better understanding of safety risks due to congestion and help engineers prioritize and evaluate
safety and mobility improvements.
There are two main types of crashes that occur in association with congestion. First, there are the
low speed crashes that occur within a queue. It is generally accepted that these crashes are of low severity.
The second type of congestion-related crash is the back-of-queue crash, which involves a vehicle
traveling at a higher speed striking a vehicle traveling at a lower speed. These crashes are often high
severity. Figure 1 is an image of a back-of-queue crash on I-65 near mile marker 215 on the morning of
February 2, 2015. The queue had grown from the initial crash of a trailer and existed for over 90 minutes
before the occurrence of the secondary, back-of-queue crash. The driver that struck the back of the queue
was injured with a fractured arm.
* Photo courtesy of Indiana State Police
FIGURE 1 Back-of-queue crash on I-65 on February 2, 2015.
This paper discusses different factors prevalent in back-of-queue fatal crashes and compares crash
rates during congested and uncongested traffic conditions. A new measure of exposure was developed for
calculating these crash rates, to be discussed in a later section. Only crashes on the main lanes of interstate
travel in Indiana are considered.
LITERATURE REVIEW Agencies are concerned with the effect of the roadway and traffic conditions on safety since these are
factors that can potentially be impacted via infrastructure improvements and changes. When safety is a
concern, crash rates are the most common performance measure used by agencies and researchers. The
Highway Safety Manual (1) defines crash frequency as the number of crashes over a period of time,
usually a year. Crash rate is defined as the crash frequency of a period of time divided by the exposure in
that same time period. Exposure is the total of all opportunities for a crash to occur, whether or not a crash
actually occurs. The Highway Safety Manual refers to exposure as a measure of volume but, over the
years, researchers have used a number of different ways to measure exposure, such as induced exposure
(2-6) and volume-based exposure (7- 20). The volume-based exposure techniques and variations on those
are the most relevant to this study.

Mekker, Remias, McNamara, Bullock 3
A volume measure of some sort is the most common basis for exposure. Some studies use traffic
counts recorded by infrastructure technology. Other studies use annual average daily traffic (AADT).
Mensah and Hauer (7) advise caution when using AADT as a measure of exposure. AADT is an aggregate
measure and is not appropriate when considering the traffic conditions at the time of a crash. Specifically,
when studying the effect of congestion on safety, an average measure of volume does not adequately
represent the traffic conditions.
Regardless of the source of the volume data, there are three types of volume-based measures that
are the most common in safety studies. One study used volume for calculated crash rates for different
levels of severity, finding that property-damage-only and injury crash rates were highest when traffic was
lightest (8). Another study used AADT-based hourly volumes to estimate the potential for conflicts (9). A
third study modeled crash severity using flow as a variable in addition to speed and delay caused by
congestion. (10). Vehicle-miles traveled (VMT) is a widely accepted and often used measure of exposure
when calculating crash rates (11, 12, 13, 14, 15). Lastly, density (vehicles per mile) is frequently used in
safety studies directly concerned with the effects of congestion on crash rates (16, 17, 18, 19). A common
finding amongst safety studies using density as exposure is the parabolic, or U-shaped, relationship
between density and crash rates, where the highest crash rates occur at low densities (mostly single
vehicle crashes) and high densities (mostly multi-vehicle crashes). Some less common but no less viable
measures of exposure are the standard deviation of speed between vehicles (20) and the volume-to-
capacity ratio at the time of the crash (21).
Recently, with the greater availability and reliability of real-time traffic condition data, queue
detection and alert systems are becoming more common. One system focused on specific highway
sections designated as high-crash locations (22). This detection system used a number of factors, such as
average speed, different forms of traffic density, headway variability, acceleration noise, etc., to calculate
the crash likelihood in real-time. The combination of crash likelihood model and detection algorithm
succeeded in detecting 58% of crashes during the study. Another detection system was developed for the
Indiana Department of Transportation (INDOT) and covered the entire interstate system instead of small
sections (23). This system uses only the difference between the space mean speeds of two adjacent
roadway segments. If the average speed of an upstream segment is significantly higher than the average
speed of the immediate downstream segment, an alert is made visible to dispatchers and emergency
responders.
Of most relevance to this paper is a study by University of California-Berkeley’s Transportation
Research and Education Center (13, 14). In this study, four different traffic states are considered. The four
traffic states are based on speeds upstream and downstream of a crash and use 50 MPH as a threshold for
congestion, using VMT and vehicle-hours traveled (VHT) as exposure. In this study, the researchers
found that crash rates for the three different congestion states were about 5 times greater than the crash
rate for the free flow state.
RESEARCH OBJECTIVE There is wide interest and need to understand crash rates associated with work zones and queued traffic.
Historically, it has been very challenging to associate crash data with queued traffic. This paper looks at
opportunities to fuse new crowd-sourced probe data with crash reports to develop improved crash factors.
DATA SOURCES Two different data sources were used in this study. Crowd-sourced probe vehicle data were used to
determine traffic conditions. Crash data were retrieved from state crash records.
Crowd-Sourced Probe Vehicle Data Speed data from probe vehicles were used in this study to assess traffic conditions when a crash occurred.
Speed and trajectory information is collected from millions of probe vehicles by a third party vendor and
aggregated into space mean speeds every minute for specified roadway segments. The vendor has two

Mekker, Remias, McNamara, Bullock 4
possible segmentation schemes. The first is based on Traffic Message Channels (TMC) and is the older of
the two segmentation schemes. The TMC segments range from 0.5 to 15 miles in length. The second
segmentation scheme, XD, is proprietary, with segment lengths ranging from 1 to 2 miles. The XD
scheme has greater resolution but is only available from January 2014 and later.
Figure 2a shows a sample of speed and trajectory data from probe vehicles before it is aggregated
into space mean speeds. Specifically, these time-space diagrams are for probe vehicles passing through a
section of I-65 Northbound on February 2, 2015, before, during, and after a crash (Figure 1). The incident
began when a trailer jack-knifed due to slick road conditions at about 8:30 AM (labeled i in Figure 2). A
queue began to form, with vehicles in the queue moving at 10 to 20 MPH until 9:40 AM when lanes were
restricted to facilitate clean up. Within this queue, vehicles moved at less than 10 MPH, if at all. At
approximately 9:55 AM, the queue began to dissipate quickly and was almost cleared when a passenger
vehicle struck a trailer at the back of the queue at 10:16 AM (ii). Prior to and upstream of the crash, the
queue existed for more than 90 minutes. The back-of-queue crash (ii) caused the queue to reform with
speeds of less than 10 MPH lasting for more than 2 hours after the crash and extending nearly 10 miles
behind the crash. Figure 2b shows the development of the queue using the real-time shockwave boundary
detection tool on the INDOT web page (22).
These new data sets provide the ability to precisely characterize traffic flow regimes with fidelity
that has historically only been discussed in an academic context. Figure 3 depicts the shockwave diagram
(23) developed from the time-space diagram (Figure 2). Before the back-of-queue crash at 10:16 AM, the
queue had a frontal stationary boundary, a backward forming boundary propagating at approximately 1
MPH, and a backward recovery boundary with a speed of 12 MPH. Just before the back-of-queue crash
and because of the lane restrictions, the backward forming boundary speed increased to 3.78 MPH.
Before the first accident was cleared, the frontal stationary boundary existed at mile marker 215, the site
of the initial crash. However, with the back-of-queue crash, a new frontal stationary boundary was formed
at the 213 mile marker. In addition to backward forming and backward recovering boundaries, the queue
from the secondary crash also had a rear stationary boundary for a short time. Table 1 shows the duration
and speeds of each of the 7 boundaries of the queue for this incident. In Figure 2 and Table 1, ωn
represents shockwave n.

Mekker, Remias, McNamara, Bullock 5
(a) Time-space diagram created with probe data
(b) Queue location over time
FIGURE 2 INRIX trip trace from February 2, 2015, crash on I-65

Mekker, Remias, McNamara, Bullock 6
FIGURE 3 Shockwave diagram from February 2, 2015, crash on I-65
TABLE 1 Shockwave Boundaries from February 2, 2015, crash on I-65
Shock-
wave Class
Duration
(minutes)
Speed
(mph)
ω1 Backward Forming 87 1.03
ω2 Frontal Stationary 95 --
ω3 Backward Recovery 10 12
ω4 Backward Forming 115 3.78
ω5 Frontal Stationary 40 --
ω6 Backward Recovery 50+ 7.2
ω7 Rear Stationary 15+ --

Mekker, Remias, McNamara, Bullock 7
Crash Database Crash data were retrieved from the state crash database. Only crashes defined as being within the
specified time frame (2012-2014) and as having occurred on an interstate were retrieved. Personal
information, such as names and license plate numbers, were omitted. The crash data included the number
of vehicles involved, the number of trailers involved, the number of injuries and deaths, whether or not
construction was associated with the crash, the primary factor or cause, the manner of collision,
information on the geometry of the road, etc. It should be noted that these crash data did not use the
KABCO (K = fatal, A = incapacitating injury, B = non-incapacitating injury, C = possible injury, O =
property damage only) scale of severity. The crash report data does not specify if the crash occurred
during congested operations, if it was a secondary crash, or the cause of congestion. There is also no
reliable data on roadside activities, such as stalled vehicles.
Before being used in this study, the raw crash data had to be cleaned, which required extensive
reading of the narrative to verify and correct database attributes. Any crash with an unknown or unreliable
location was eliminated from the study data. Any crash that did not occur in the interstate travel lanes,
such as ramps, was also eliminated. Lastly, only crashes that occurred on interstates of the Interstate
Highway System in Indiana were used, which includes I-265, I-465, I-469, I-64, I-65, I-69, I-70, I-74, I-
80, I-865, I-90, and I-94. Interstate 275 was not included in this study due to lack of probe vehicle data
and that its length in Indiana is only 3 miles.
INTERSTATE CRASHES
This crash analysis was conducted in two parts. For the first part of this study, only fatal crashes that
occurred in 2012 through 2014 were considered. The second part of the study looked in more detail at the
2014 crashes. This paper looked at the data in two cohorts. The longitudinal analysis of fatal crashes from
2012-2014 used the legacy TMC probe data that was available from 2012 onwards. Automated
classification of 2014 crashes as occurring during congested or uncongested conditions was done using
the newer, higher fidelity XD data with segment lengths approximately 1 mile in length.
Fatal Crashes
There were 230 fatal crashes total over this three year period on Indiana interstates. For each fatal crash,
speed data from the crowd-sourced probe vehicles prior to and upstream of the crash were analyzed to
ascertain whether or not the crash occurred at the back of a queue. The probe data were augmented by the
crash report narratives. Using this method, 30 of the fatal crashes were determined to be back-of-queue
crashes. Figure 4 shows a Pareto chart of the durations of queues as seen in the probe vehicle data before
each of the 30 fatal back-of-queue crashes. The durations range from not seen in the data at all (5 crashes)
to 6 hours. The chart also shows which back-of-queue crashes were associated with construction and
which involved commercial vehicles (trucks with trailers).

Mekker, Remias, McNamara, Bullock 8
FIGURE 4 Duration of queue before fatal back-of-queue crash
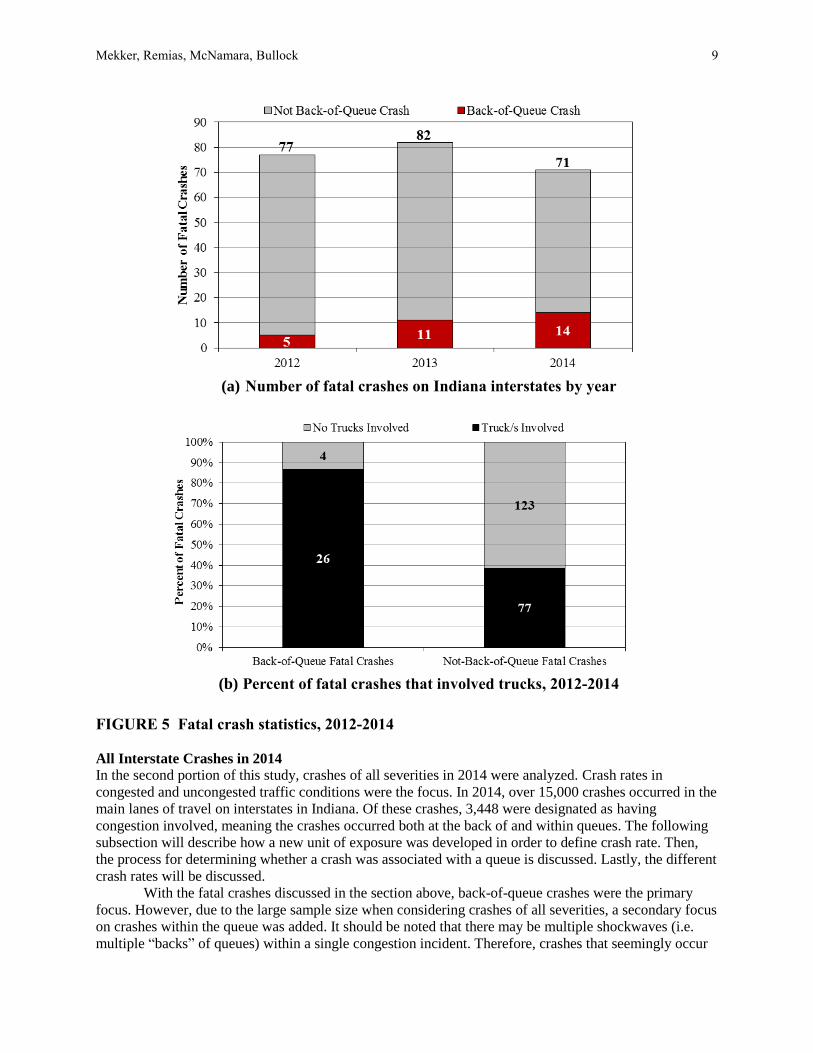
Figure 5a shows the total fatal crashes and number of fatal back-of-queue crashes by year. The
number of back-of-queue crashes increases over the three year period but the total number of fatal crashes
does not. This could be attributed to the randomness in crash occurrence or perhaps influenced by
increasing congestion. However, with only a three year sample, there is insufficient data to reach a
conclusion.
In this part of the study, different possible trends in back-of-queue fatal crashes were considered
and evaluated. For example, a larger percentage of back-of-queue crashes than non-back-of-queue were
associated with construction. This trend is perhaps influenced by the fact that work zones cause queueing
more so than non-work zones. The most significant trend found in fatal back-of-queue crashes is the
involvement of one or more trucks with trailers (Figure 5b). Out of all fatal back-of queue crashes over
the three year period, 87% involved at least one truck. In comparison, only 39% of the non-back-of-queue
fatal crashes involved at least one truck.
Mekker, Remias, McNamara, Bullock 9
(a) Number of fatal crashes on Indiana interstates by year
(b) Percent of fatal crashes that involved trucks, 2012-2014
FIGURE 5 Fatal crash statistics, 2012-2014
All Interstate Crashes in 2014
In the second portion of this study, crashes of all severities in 2014 were analyzed. Crash rates in
congested and uncongested traffic conditions were the focus. In 2014, over 15,000 crashes occurred in the
main lanes of travel on interstates in Indiana. Of these crashes, 3,448 were designated as having
congestion involved, meaning the crashes occurred both at the back of and within queues. The following
subsection will describe how a new unit of exposure was developed in order to define crash rate. Then,
the process for determining whether a crash was associated with a queue is discussed. Lastly, the different
crash rates will be discussed.
With the fatal crashes discussed in the section above, back-of-queue crashes were the primary
focus. However, due to the large sample size when considering crashes of all severities, a secondary focus
on crashes within the queue was added. It should be noted that there may be multiple shockwaves (i.e.
multiple “backs” of queues) within a single congestion incident. Therefore, crashes that seemingly occur

Mekker, Remias, McNamara, Bullock 10
within the queue may have actually occurred at a shockwave boundary (a back of queue) that may not be
readily visible without extensive analysis of the data.
Mile-Hours as Unit of Exposure As discussed in the literature review, the vast majority of crash rates use volume, or some form of
volume, as the unit of exposure. Many safety studies use AADT to derive volume. However, an aggregate
measure of volume would be insufficient in this case since congested conditions are not adequately
represented by average measures. Some safety studies use count data as measured by ITS (intelligent
transportation system) infrastructure, such as detector loops. However, no agencies have statewide
coverage, particularly in work zones or rural areas. Count stations are located infrequently enough that
any volume measure would still be too aggregated. Also, even if ITS devices are installed near work
zones, the temporary lane use patterns often degrade the quality of data. Therefore, a new unit of exposure
was developed for this study that uses crowd sourced probe data.
A mile-hour of congestion is a measure of exposure that combines the duration of a condition
with the length of roadway that the condition covered. For this study, the probe vehicle data were used in
calculations of mile-hours of exposure. As described above, each segment has a length and an average
speed every minute. A threshold of 45 MPH was chosen for defining congestion as this threshold has
been used extensively in interstate-based studies in Indiana. The sum of hours when the segment operated
at or under 45 MPH multiplied by the segment’s length is defined as the exposure of that segment to
congestion. For example, a queue of 1 mile in length that lasted for 1 hour would equate to 1 mile-hour of
congestion.
Following this idea, the crash rate is defined by the number of crashes that occurred during a
certain condition and the mile-hours of exposure to that condition. In this case, the uncongested crash rate
(Equation 1) uses mile-hours of uncongested conditions and the congested crash rate (Equation 2) uses
mile-hours of congested conditions.
N
n=1
Number of crashes in uncongested traffic conditionsUncongested crash rate =
Segment length Number of uncongested hours (1)
N
n=1
Number of crashes in congested conditionsCongested crash rate =
Segment length Number of congested hours (2)
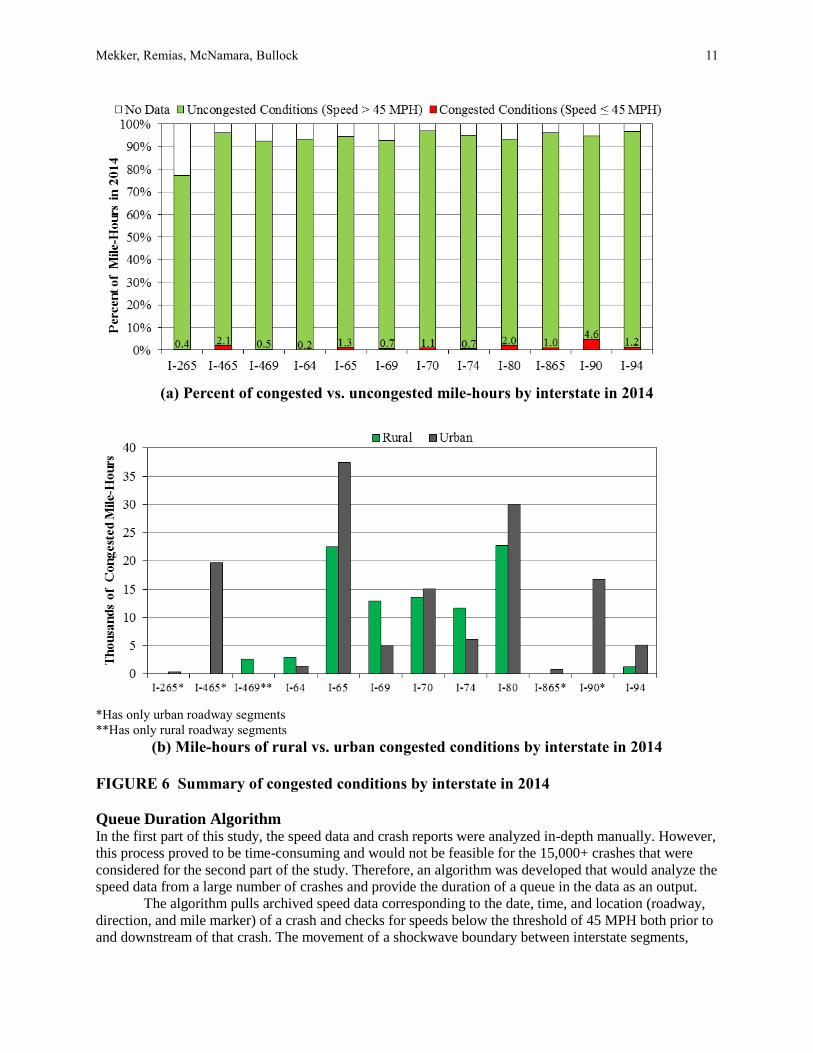
Figure 6a shows the percent of mile-hours operating under uncongested and congested conditions
for each interstate. Congested conditions make up only 1.2% of the total possible mile-hours of operation.
Interstates in Indiana experience congested conditions for a very small portion of yearly operation.
Differences between rural and urban crash rates and traffic conditions were also considered. Using the
metropolitan statistical areas, based on the United States Census, of Chicago, Indianapolis, and
Louisville, the interstate segments and crashes were designated as either rural or urban. Four interstates
were contained entirely in urban areas: I-265, I-465, I-865, and I-90. Interstate 469 was the only interstate
that was entirely defined as rural. Figure 6b shows the mile-hours of congestion as seen in red in Figure
6a split between rural and urban interstate segments.
Mekker, Remias, McNamara, Bullock 11
(a) Percent of congested vs. uncongested mile-hours by interstate in 2014
*Has only urban roadway segments
**Has only rural roadway segments
(b) Mile-hours of rural vs. urban congested conditions by interstate in 2014
FIGURE 6 Summary of congested conditions by interstate in 2014
Queue Duration Algorithm In the first part of this study, the speed data and crash reports were analyzed in-depth manually. However,
this process proved to be time-consuming and would not be feasible for the 15,000+ crashes that were
considered for the second part of the study. Therefore, an algorithm was developed that would analyze the
speed data from a large number of crashes and provide the duration of a queue in the data as an output.
The algorithm pulls archived speed data corresponding to the date, time, and location (roadway,
direction, and mile marker) of a crash and checks for speeds below the threshold of 45 MPH both prior to
and downstream of that crash. The movement of a shockwave boundary between interstate segments,

Mekker, Remias, McNamara, Bullock 12
which may cause minor fluctuations in the average speed was taken into account when designing the
algorithm. For example, as a shockwave enters a segment, the average speed of that segment could vary
between 50 MPH and 40 MPH. While 50 MPH is above the congestion threshold, it does not mean that
the queue has disappeared. A buffer period of 10 minutes is used to account for shockwaves passing
between segments and allows the algorithm to see a queue that existed across several segments. In
summary, the algorithm evaluates the speeds prior to the occurrence of the crash in the segment that the
crash occurred. If the segment had average speeds below 45 MPH immediately before a crash occurred, it
is concluded that a queue existed prior to that crash. The algorithm then evaluates consecutive roadway
segments downstream of the crash until the origin time and location is found. The difference between the
origin time of the queue and the time of the crash is taken as the queue duration.
As stated above, 3,448 crashes were found to have been involved in a queue. Figure 7a shows a
Pareto chart of the queue durations for all crashes in 2014, similar to Figure 4 for the fatal back-of-queue
crashes. Of the 15,117 total crashes, 3,448 or 22.8% were associated with congestion prior to the crash
itself. Figure 7b is a cumulative frequency diagram of the duration of congestion prior to crash for each of
the 3,448 congestion crashes. Approximately 90% of congestion crashes have a queue duration of 5
minutes or longer and 75% have a queue duration of 14 minutes or longer.
Crash Rates Using Equations 1 and 2, uncongested and congested crash rates were calculated for each interstate and
overall in 2014. Figure 8a shows both crash rates side-by-side for each interstate. The dotted lines
represent the overall crash rates. Figure 8b and Figure 8c show the crash rates segmented by rural and
urban interstate segments, respectively.
The ratios between the uncongested and congested crash rates are significant. In this paper, the
crash rate ratio is defined as the congested crash rate divided by the uncongested crash rate. Figure 9a
shows the crash rate ratios for each interstate in 2014. The ratios range from 6 for I-865 to 69 for I-265.
The overall congested crash rate is 24.1 times the overall uncongested crash rate. Figure 9b and Figure 9c
show the crash rate ratios for rural and urban segments, respectively. For rural interstate segments, the
congested crash rate is 23.8 times the uncongested crash rate. For urban interstate segment, the congested
crash rate is 20.7 times the uncongested crash rate. The total crash rate ratio is higher than both the urban
and rural crash ratios due to the congested crash rate being influenced heavily by urban conditions, while
the uncongested crash rate is equally influenced by urban and rural conditions. This is expected because
congested conditions are primarily located in urban environments, while uncongested conditions are
shared in both urban and rural environments.
These findings are somewhat different from those of the Potts et. al. SHRP 2 Report (15) and the
Kononov et. al. study (18), where the different crash rates were not found to be so drastically different.
The measure of exposure used in this study, mile-hours of congestion, is different from the traditional
measures of exposure used in the above mentioned papers. However, the authors of this paper believe the
results of this study are reliable, understandable, and applicable, especially in situations where volume
data is not available or reliable. The speed data used in this study instead of volume data has been used
extensively in Indiana interstate studies and its reliability has been vetted extensively.

Mekker, Remias, McNamara, Bullock 13
(a) All crashes (n = 15,117)
(b) Congestion crashes (n = 3,448)
FIGURE 7 Distribution of congestion duration before crashes on all interstates in 2014

Mekker, Remias, McNamara, Bullock 14
(a) All segments
(b) Rural segments
(c) Urban segments
FIGURE 8 Uncongested vs. congested crash rates by interstate in 2014

Mekker, Remias, McNamara, Bullock 15
(a) All segments
(b) Rural segments
(c) Urban segments
FIGURE 9 Congested/uncongested crash rate ratios by interstate in 2014

Mekker, Remias, McNamara, Bullock 16
CONCLUSIONS AND RECOMMENDATIONS
The impact of congestion on crashes is quite evident from the data presented in this paper. Using crash
and probe vehicle data, the following trends were found:
Over the 3 years studied, 13% of fatal crashes occurred at the back of a queue.
87% of fatal back-of-queue crashes involved at least one commercial vehicle.
Only 1-2% of the total mile-hours of interstate operated under congested conditions.
90% of congested crashes in 2014 had a queue duration ≥ 5 minutes
75% of congested crashes in 2014 had a queue duration ≥ 14 minutes
Overall congested crash rate was 24.1 times greater than the uncongested crash rate
Rural congested crash rate was 23.8 times greater than the rural uncongested crash rate
Urban congested crash rate was 20.7 times greater than the urban uncongested crash rate
The data reported in this paper may be useful to designers in performing alternative analysis of
mobility enhancements and work zone traffic management designs. It can also be useful for incident
management professionals to quantify the impact of shoulder activities, such as crash investigation and
tire changes. Special consideration should also be given to congestion- and queue-management in the
design of work zones. Though this study is specific to interstates in Indiana, it can be assumed that similar
results would be found for interstates across the country. These findings support increased use of either
roadside or in-vehicle back-of-queue warning equipment. Longer term, this information is important to
communicate to decision makers on the importance of advancing connected vehicle technology that warn
motorists of queued traffic on the interstate.
ACKNOWLEDGEMENTS
This work was supported by the Joint Transportation Research Program administered by the Indiana
Department of Transportation and Purdue University. The crowd-sourced probe vehicle data was
provided by INRIX. The contents of this paper reflect the views of the authors, who are responsible for
the facts and the accuracy of the data presented herein, and do not necessarily reflect the official views or
policies of the sponsoring organizations. These contents do not constitute a standard, specification, or
regulation.
Mekker, Remias, McNamara, Bullock 17
REFERENCES
1. Highway Safety Manual. AASHTO, Washington, D.C., 2010, Part A, Ch. 3.
2. Thorpe, J. D. Calculating Relative Involvement Rates in Accidents without Determining
Exposure. Australian Road Research, Vol. 2, No. 1, 1964, pp. 25-36.
3. Carr, B. R. A Statistical Analysis of Rural Ontario Traffic Accidents using Induced Exposure
Data. Accident Analysis and Prevention, Vol. 1, 1969, pp. 343-357.
4. Chapman, R. The Concept of Exposure. Accident Analysis and Prevention, Vol. 5, 1973, pp. 95-
110.
5. Stamatiadis, N., and J. A. Deacon. Quasi-Induced Exposure: Methodology and Insight. Accident
Analysis and Prevention, Vol. 29, No. 1, 1997, pp. 37-52.
6. Kirk, A., and N. Stamatiadis. Crash Rates and Traffic Maneuvers of Younger Drivers. In
Transportation Research Record: Journal of the Transportation Research Board, No. 1779,
Transportation Research Board of the National Academies, Washington, D.C., 2001, pp. 68-75.
7. Mensah, A., and E. Hauer. Two Problems of Averaging Arising in the Estimation of the
Relationship between Accidents and Traffic Flow. In Transportation Research Record: Journal
of the Transportation Research Board, No. 1635, Transportation Research Board of the National
Academies, Washington, D.C., 1998, pp. 37-43.
8. Martin, J. Relationship between Crash Rate and Hourly Traffic Flow on Interurban Motorways.
Accident Analysis and Prevention, Vol. 34, No. 5, 2002, pp. 619-629.
9. Elvik, R., A. Erke, and P. Christensen. Elementary Units of Exposure. In Transportation
Research Record: Journal of the Transportation Research Board, No. 2103, Transportation
Research Board of the National Academies, Washington, D.C., 2009, pp. 25-32.
10. Quddus, M. A., C. Wang, and S. G. Ison. Road Traffic Congestion and Crash Severity:
Econometric Analysis Using Ordered Response Models. Journal of Transportation Engineering,
Vol. 136, 2010, pp. 424-435.
11. Jovanis, P. P., and H. Chang. Modeling the Relationship of Accidents to Miles Traveled. In
Transportation Research Record: Journal of the Transportation Research Board, No. 1068,
Transportation Research Board of the National Academies, Washington, D.C., 1986, pp. 42-51.
12. Pal, R., and K. C. Sinha. Analysis of Crash Rates at Interstate Work Zones in Indiana. In
Transportation Research Record: Journal of the Transportation Research Board, No. 1529,
Transportation Research Board of the National Academies, Washington, D.C., 1996, pp. 45-53.
13. Yeo, H., K. Jang, and A. Skabardonis. Impact of Traffic States on Freeway Collision Frequency.
Publication RR-2010-6. University of California Berkeley Safe Transportation Research and
Education Center, Berkeley, CA, 2010.
14. Song, S., and H. Yeo. Method for Estimating Highway Collision Rate that Considers State of
Traffic Flow. In Transportation Research Record: Journal of the Transportation Research
Board, No. 2318, Transportation Research Board of the National Academies, Washington, D.C.,
2012, pp. 52-62.
15. Potts, I. B., D. W. Harwood, C. A. Fees, K. M. Bauer, and C. S. Kinzel. Further Development of
the Safety and Congestion Relationship for Urban Freeways. SHRP 2 Report S2-L07-RR-3.
Transportation Research Board, The Second Strategic Highway Research Program, Washington,
D.C., 2015.
16. Brodsky, H., and A. S. Hakkert. Highway Accident Rates and Rural Travel Densities. Accident
Analysis and Prevention, Vol. 15, No. 1, 1983, pp. 73-84.
17. Shefer, D., and P. Rietveld. Congestion and Safety on Highways: Towards an Analytical Model.
Urban Studies, Vol. 34, No. 4, 1997, pp. 679-692.
18. Kononov, J., D. Reeves, C. Durso, and B. K. Allery. Relationship between Freeway Flow
Parameters and Safety and Its Implications for Adding Lanes. In Transportation Research
Record: Journal of the Transportation Research Board, No. 2279, Transportation Research Board
of the National Academies, Washington, D.C., 2012, pp. 118-123.

Mekker, Remias, McNamara, Bullock 18
19. Harwood, D. W., K. M. Bauer, and I. B. Potts. Development of Relationships between Safety and
Congestion for Urban Freeways. In Transportation Research Record: Journal of the
Transportation Research Board, No. 2398, Transportation Research Board of the National
Academies, Washington, D.C., 2013, pp. 28-36.
20. Garber, N. J., and A. A. Ehrhart. The Effect of Speed, Flow, and Geometric Characteristics on
Crash Rates for Different Types of Virginia Highways. Publication VTRC 00-R15. Virginia
Transportation Research Council, Charlottesville, VA, 2000.
21. Zhou, M., and V. Sisiopiku. Relationship between Volume-to-Capacity Ratios and Accident
Rates. In Transportation Research Record: Journal of the Transportation Research Board, No.
1581, Transportation Research Board of the National Academies, Washington, D.C., 1997, pp.
47-52.
22. Hourdos, J. N., V. Garg, P. G. Michalopoulos, and G. A. Davis. Real-Time Detection of Crash-
Prone Conditions at Freeway High-Crash Locations. In Transportation Research Record: Journal
of the Transportation Research Board, No. 1968, Transportation Research Board of the National
Academies, Washington, D.C., 2006, pp. 83-91.
23. Li, H., S. M. Remias, C. M. Day, M. M. Mekker, J. R. Sturdevant, and D. M. Bullock.
Shockwave Boundary Identification using Cloud-Based Probe Data. Presented at 94th Annual
Meeting of the Transportation Research Board, Washington, D.C., 2015.
24. May, A. D. Traffic Flow Fundamentals. Prentice Hall, Englewood Cliffs, NJ, 1990.