characterizing dysgeusia in hemodialysis patients
TRANSCRIPT

Purdue University Purdue University
Purdue e-Pubs Purdue e-Pubs
Department of Food Science Faculty Publications Department of Food Science
2019
Characterizing Dysgeusia in Hemodialysis Patients Characterizing Dysgeusia in Hemodialysis Patients
Ciara Fitzgerald
Gretchen Wiese
Ranjani N. Moorthi
Sharon M. Moe
Kathleen Hill Gallant
See next page for additional authors
Follow this and additional works at: https://docs.lib.purdue.edu/foodscipubs
This document has been made available through Purdue e-Pubs, a service of the Purdue University Libraries. Please contact [email protected] for additional information.

Authors Authors Ciara Fitzgerald, Gretchen Wiese, Ranjani N. Moorthi, Sharon M. Moe, Kathleen Hill Gallant, and Cordelia Running

This is the author copy of an accepted manuscript, posted to the Purdue University Repository after an embargo period as permitted by the publisher. The published copy can be found at: Characterizing Dysgeusia in Hemodialysis Patients C Fitzgerald, G Wiese, RN Moorthi, SM Moe, K Hill Gallant, CA Running Chemical senses 44 (3), 165-171 https://doi.org/10.1093/chemse/bjz001

Characterizing Dysgeusia in Hemodialysis 1
Patients 2 Ciara Fitzgeralda,b,c, Gretchen Wiesea, Ranjani N. Moorthid, Sharon M. Moed,e, Kathleen Hill 3
Gallanta,d, Cordelia A. Runninga 4 5 aPurdue University, West Lafayette, IN, United States 6 bThe Dublin Institute of Technology, Dublin, Ireland 7 cTrinity College, Dublin, Ireland 8 dIndiana University School of Medicine, Department of Medicine, Division of Nephrology, 9
Indianapolis, IN, United States 10 eRoudebush Veterans Affairs Medicine Center, Department of Medicine, Indianapolis, IN, 11
United States 12
13
Correspondence to be sent to: 14
Cordelia Running, Departments of Nutrition Science and Food Science, Purdue University, West 15
Lafayette, IN. email: [email protected] 16

Abstract 17
Dysgeusia (abnormal taste) is common in those with chronic kidney disease and 18 contributes to poor nutritional intake. Previous sensory work has shown that taste improves 19 after dialysis sessions. The goal of this pilot study was to characterize altered taste perceptions 20 in patients on dialysis compared to healthy adults, and to evaluate relationships between 21 serum parameters with taste perceptions. We hypothesized that patients undergoing dialysis 22 would experience blunted taste intensities compared to controls, and that serum levels of 23 potential tastants would be inversely related to taste perception of compounds. Using a cross-24 sectional design, we carried out supra-threshold sensory assessments (flavor intensity and 25 liking) of tastants/flavors potentially influenced by kidney disease and/or the dialysis 26 procedure. These included sodium chloride, potassium chloride, calcium chloride, sodium 27 phosphate, phosphoric acid, urea, ferrous sulfate and monosodium glutamate. Individuals on 28 maintenance hemodialysis (n= 17, 10 males, range 23-87 years) were compared to controls 29 with normal gustatory function (n=29, 13 males, range 21-61 years). Unadjusted values for 30 intensity and liking for the solutions showed minimal differences. However, when values were 31 adjusted for participants’ perceptions of water (as a control for taste abnormalities), intensity 32 of monosodium glutamate, sodium chloride, and sodium phosphate solutions were more 33 intense for patients on dialysis compared to controls. Some significant correlations were also 34 observed between serum parameters, particularly potassium, for dialysis patients and sensory 35 ratings. These results suggest altered taste perception in patients during dialysis warrants 36 further study. 37
Keywords: Chronic kidney disease, dysgeusia, hemodialysis, taste 38
39
Introduction 40
Chronic kidney disease (CKD) affects approximately 11-13% of the worldwide 41
population (Hill, Fatoba et al. 2016). Progression of the disease can often warrant the 42
commencement of dialysis, with hemodialysis being the most common modality of renal 43
replacement therapy. Patients receiving dialysis are subject to prescriptive diets (Kalantar-Zadeh, 44
Tortorici et al. 2015), which can help increase dialysis effectiveness by improving parameters 45
such as serum electrolytes, acid-base balance, and blood pressure (Mc Causland, Waikar et al. 46
2012, Beerendrakumar and Haridasan 2018). Despite the multitude of benefits attributed to these 47
prescribed diets, poor dietary adherence is still a major issue, as recent systematic review 48
(Oquendo, Asencio et al. 2017) noted that 25% to 86% of hemodialysis patients do not adhere to 49
these diets. This can predispose patients to a higher risk of malnutrition and hence, poorer 50
survival outcomes and quality of life (Boltong and Campbell 2013, Lynch, Lynch et al. 2013). 51
One explanation for this poor adherence is dysgeusia, abnormal taste sensation, which 52
affects approximately 35% of end-stage renal disease patients (Lynch, Lynch et al. 2013). Some 53
commonly noted taste disturbances include reduced taste acuity, impaired detection of salty taste 54
and reporting that certain foods taste ‘metallic-like’ (Boltong and Campbell 2013, McMahon, 55
Campbell et al. 2014). Abnormalities in taste sensation may adversely affect the palatability of 56
food and thus decrease adherence to renal diets. 57
Fluid imbalances, uremic toxin accumulation, metabolic derangements and zinc 58
deficiency are some hypothesized mechanisms linked with the onset of dysgeusia (Carrero 2011, 59
Boltong and Campbell 2013, Lynch, Lynch et al. 2013, Neto, Bacci et al. 2016). Specific to 60
CKD patients, imbalances in ions, uremic toxins, or other small compounds in blood could be 61
contributing to altered vascular and salivary concentrations of solutes (Manley, Haryono et al. 62
2012). This may alter the baseline at which oral chemoreceptor cells are responding to stimuli in 63
foods. Vascular taste is when taste cells respond to tastants in the blood from the basolateral side 64
of the receptor cell; as CKD patients have altered dynamics and levels of various taste active 65
stimuli in blood (e.g., sodium, potassium, urea, etc.), vascular taste could be altered in these 66
individuals. Further, oral chemosensation could also be altered through salivary changes, as prior 67

research has shown that CKD patients have altered salivary composition of several compounds 68
that are active chemosensory stimuli in foods, including calcium, potassium and urea (Manley, 69
Haryono et al. 2012, Seethalakshmi, Koteeswaran et al. 2014, Rodrigues and Franco 2015). This 70
may be escalated by specific taste genetics that are sensitive to the increased salivary urea often 71
found in this particular patient group (Manley 2015). Additionally, previous studies have implied 72
that salivary and serum concentrations of these compounds are correlated and that taste 73
sensations improve following dialysis sessions (Burge, Park et al. 1979, Shepherd, Farleigh et al. 74
1986, Farleigh, Shepherd et al. 1987, Seethalakshmi, Koteeswaran et al. 2014, Rodrigues and 75
Franco 2015). Hence, alterations in saliva or vascular taste due to serum abnormalities may play 76
a mechanistic role in these altered taste perceptions. 77
Previous studies have examined this hypothesis for five primary tastes: sweet, salty, 78
bitter, sour, and umami (Burge, Park et al. 1979, Shepherd, Farleigh et al. 1986, Farleigh, 79
Shepherd et al. 1987, Manley, Haryono et al. 2012, McMahon, Campbell et al. 2014). However, 80
other salts and small molecules are also chemosensory stimuli, and the differences among these 81
less prototypical “tastants” has not been evaluated. Thus, this pilot study aimed to test how 82
hemodialysis patients perceive a wider range of chemosensory stimuli, specifically focusing on 83
ions and other small molecules that are likely to be altered in serum for CKD patients compared 84
to healthy controls. 85
86
Materials and Methods 87
Study Design 88 This pilot study used a cross-sectional design to compare perception of taste-active 89
compounds in dialysis patients (n=17) versus a control group (n=29). A sensory assessment was 90
conducted in which participants provided feedback on flavor intensity and liking/disliking for a 91
variety of stimuli that may be present at abnormal concentrations in the blood and/or saliva of 92
patients undergoing dialysis. 93
94
Participants 95 The target population for this study was adult patients with end-stage renal disease 96
attending a local dialysis clinic in Lafayette, IN for thrice weekly maintenance hemodialysis 97

(n=17). All participants were invited to take part in the study during their normal scheduled 98
dialysis treatment session. Control subjects (n=29) were recruited through the Purdue University 99
Sensory Perception Ingestion and Tongues (SPIT) Laboratory participant pool. Inclusion criteria 100
for the control subjects included: self-reported normal gustatory function, no issues with 101
salivation or dry mouth; 18 years of age or older; and no tongue, lip, or cheek piercings. All 102
participants gave written informed consent prior to participating in this study. The protocol was 103
approved by the Human Subjects Institutional Review Board of Purdue University and registered 104
at www.clinicaltrials.gov (NCT03495271). 105
106
Tasting Solutions 107 Solutions are listed in Table 1. All chemicals were food grade, and all were purchased 108
from Sigma-Aldrich with the exception of calcium chloride (Modernist Pantry, USA); and 109
monosodium glutamate (Ajinomoto, Japan). The solutions were presented to subjects in 15 mL 110
aliquots at room temperature. All solutions were prepared on the day before each testing. 111
112
Tasting Protocol 113 Each solution was presented at room temperature to participants in a blinded fashion and 114
in counterbalanced order. We aimed to carry out the dialysis taste assessments at the beginning 115
of the patient’s dialysis session, but this was not always consistent due to the clinic set-up. 116
117
As these stimuli are generally unpleasant, all participants tasted a urea and potassium 118
chloride sample first to control for bias as a result of the initial exposure to the unpleasant 119
sensation (termed “first sample effect” in the sensory field, or “initial elevation bias” in 120
psychology (Shrout, Stadler et al. 2018). Participants tasted 15 ml aliquots of each sample and 121
expectorated after 10 seconds. After tasting each solution, participants reported perceived flavor 122
intensity and liking/disliking of the solution. Participants rinsed their mouths with spring water 123
(Ice Mountain brand bottled water) between each sample. 124
125
Sensory Questionnaire 126 Sensory questions were asked verbally by experimenters and data were recorded using 127
RedJade sensory software. For each sample, the experimenter asked the participant to rate the 128

overall flavor intensity of the solution on a scale from 0 – 100, with 0 being no sensation and 100 129
being the strongest sensation ever experienced. Participants were familiarized with this intensity 130
scale using a warm-up questionnaire, which asked about the brightness of this room, the 131
brightness of the sun, the loudness of a shout, the loudness of a whisper, the bitterness of black 132
coffee, and the sweetness of pure sugar (adapted from (Hayes, Allen et al. 2013)). For the 133
samples, participants also reported their liking for the sensation, with 0 being the “worst thing 134
ever” and 100 being the “best thing ever”. 135
136
137
Blood Sample Collections 138 Non-fasting serum blood samples (8mL) were drawn from dialysis access following taste 139
assessments and analyzed by Mid America Clinical Laboratories. Samples were targeted to be 140
collected within 30 minutes of the taste assessment, but this varied considerably from subject to 141
subject due to the active clinic environment. 142
143
Statistical Analysis 144 Data were analyzed using SAS for Windows, version 9.4 (Cary, North Carolina, USA). 145
Significant differences between the variables were assessed using mixed models controlling for 146
year of birth, sex, order effects, and subjects (as a repeated measure); the Kenward Roger method 147
was applied for calculation of degrees of freedom. The dependent variables were flavor intensity 148
or liking/disliking rating, and the variables of interest were the sample type, group (control or 149
dialysis), and the interaction of group and sample type. Statistical code is available in 150
supplemental files. Sensory ratings were analyzed both as unadjusted as well as adjusted for each 151
participant’s perception of water (Water adjusted rating = Original rating – water rating). This 152
approach controlled for between-subject variability in how they used the scale, but also 153
controlled for baseline abnormalities in perception of water. Water is not a neutral stimulus, and 154
different sources of water can lead to changes in perception of flavor intensity and/or sensitivity 155
to tastes (Dalton, Nagata et al. 2000, Hoehl, Schoenberger et al. 2010). Deionized water, which 156
was the solvent in this study, is often described as bitter or metallic, perhaps because the pH is 157
actually below neutral (Whelton, Dietrich et al. 2007). Subtracting the rating of the water from 158
the rating of the tastant solutions thus gives a better idea of how individual participants perceived 159

the solutes in contrast to a standard (deionized water) with minimal solutes. Thus, the water-160
adjusted ratings were calculated for each individuals’ intensity and liking ratings for every test 161
solution. Alpha was set at 0.05 across all tests. Spearman correlations were used to identify 162
possible relationships between serum parameters and taste perceptions in the dialysis patients. 163
164
Results 165
Baseline Characteristics of the Study Population 166 Participant characteristics are reported in Table 2. The control group was significantly 167
younger than the dialysis group (P<0.001). Baseline taste abnormalities were reported by 43.8% 168
of the dialysis cohort. Abnormal sensations reported included that “everything tastes bitter/sour”, 169
“some fruits don’t taste as sweet”, “higher salt threshold”, and “metallic tastes.” 170
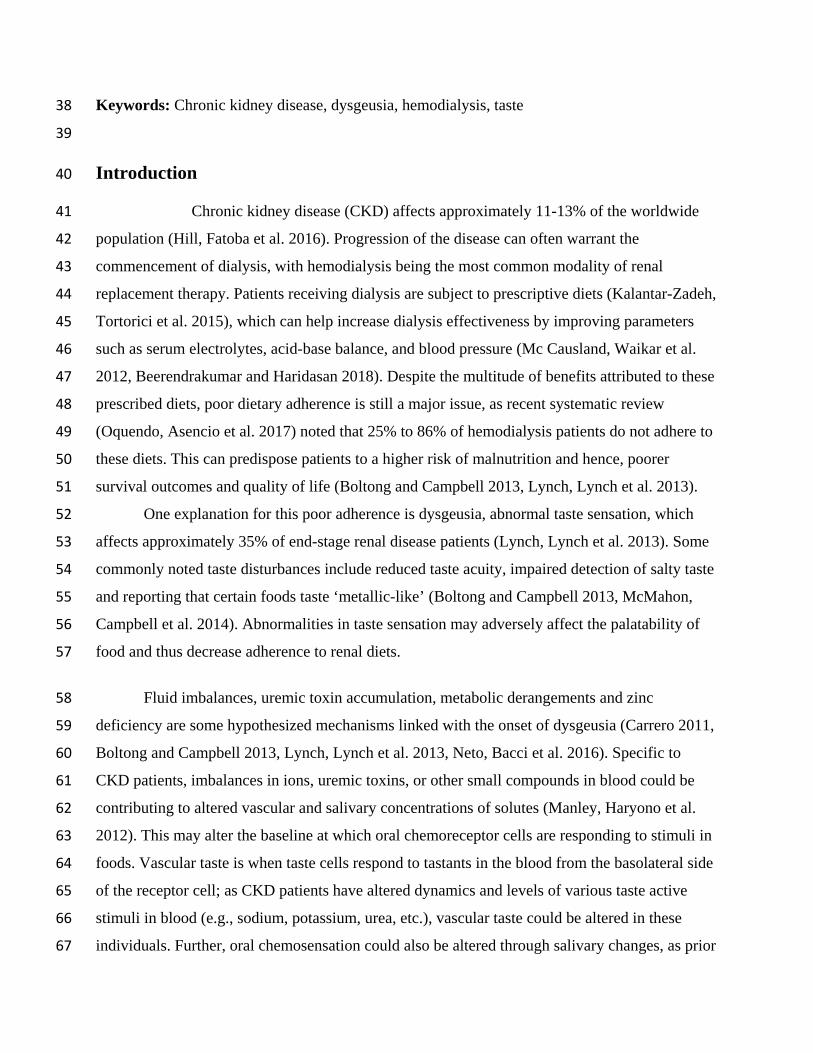
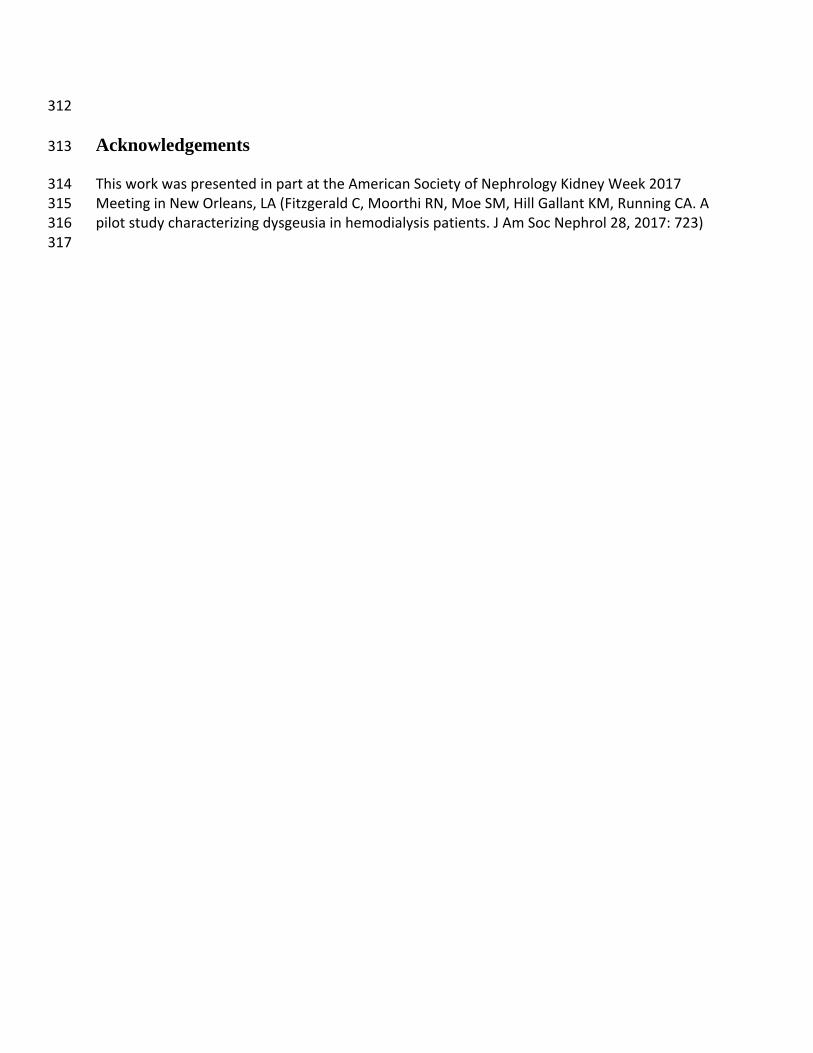
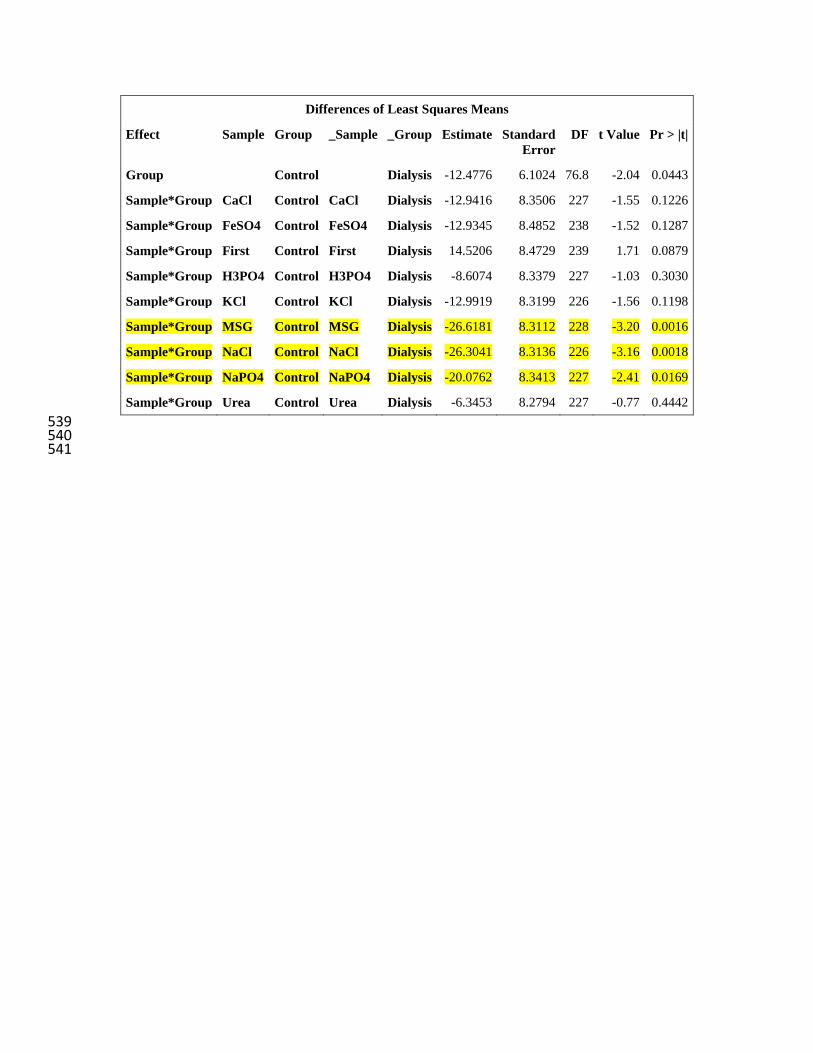
Flavor Intensity 171 Unadjusted flavor intensity values are presented in Figure 1 and showed no differences 172 (p=0.73) between groups overall, only trends in effects for interactions within sample types. 173 After adjustment for deionized water taste, significant differences emerged (Figure 2, p=0.044 174 between groups). Specifically, water-corrected ratings for monosodium glutamate (p=0.0016), 175 sodium chloride (p=0.0018), and sodium phosphate (p=0.017) were higher for dialysis patients 176 compared to control participants. 177 178 Hedonic ratings 179
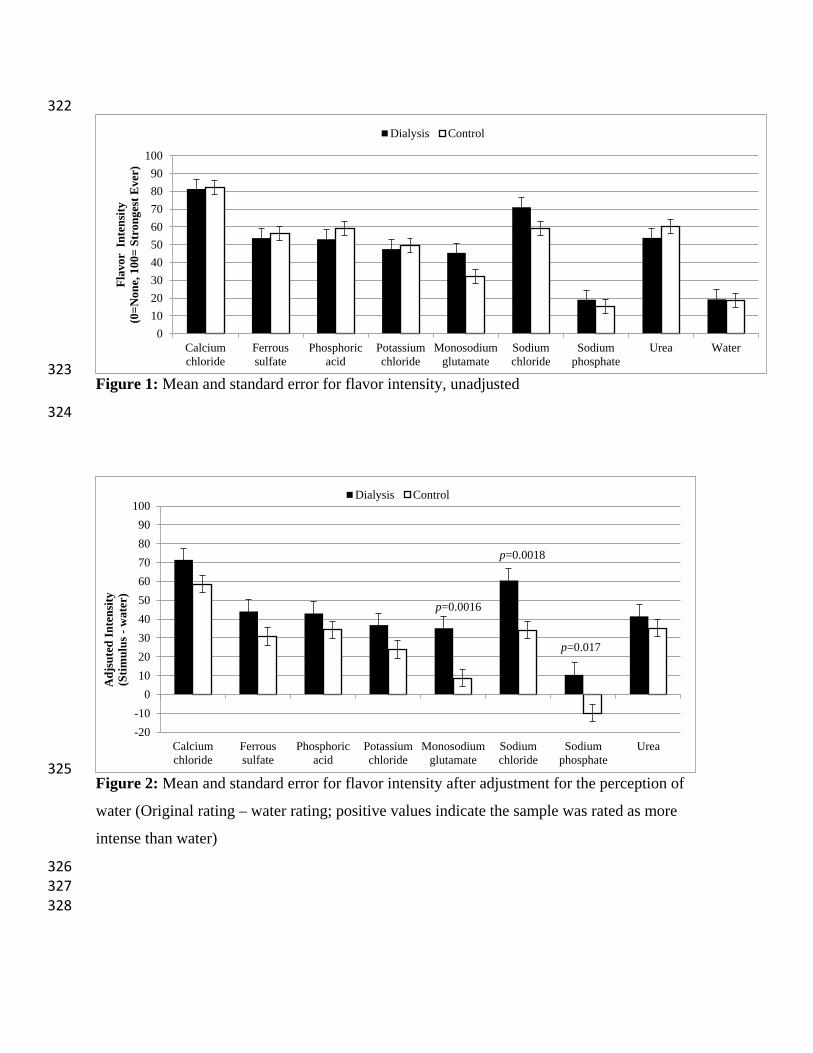
Liking/disliking values are presented in Figure 3 & 4. Unadjusted liking scores (Figure 180
3) highlights general, and similar (p=0.37 between groups, no significant interactions) disliking 181
for the solutions across both groups, which is signified by a mean score of <50 (i.e. values were 182
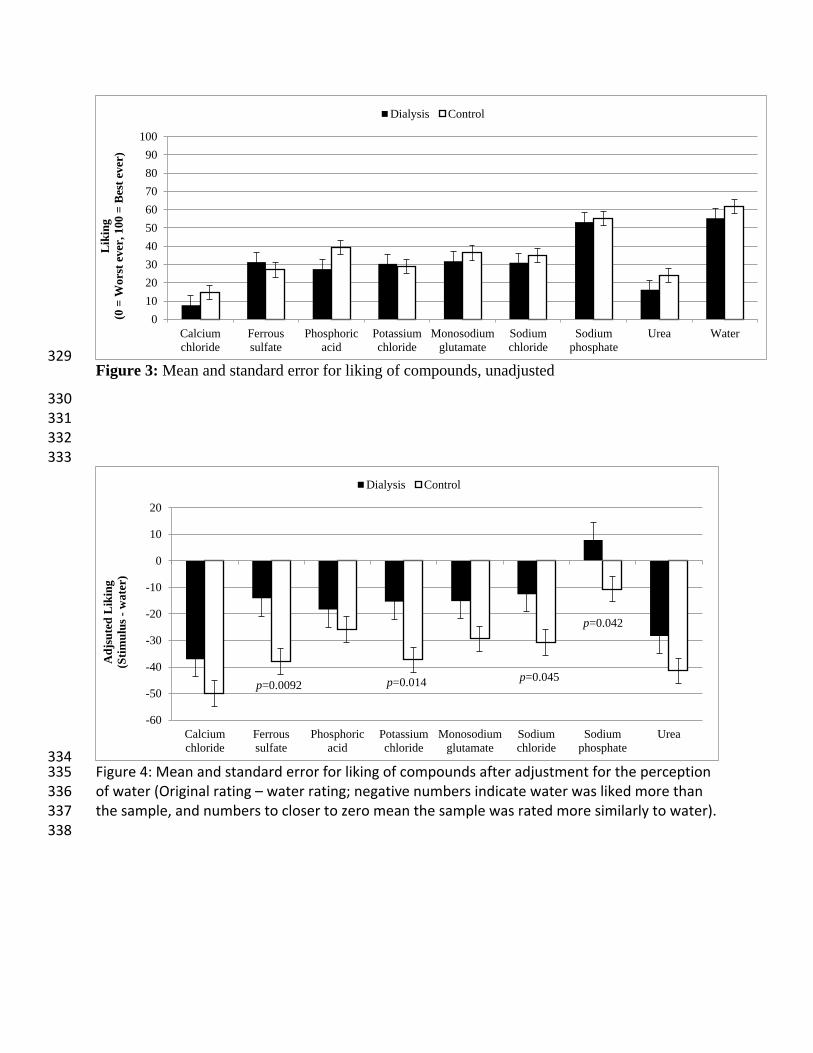
closer to ‘worst ever’ side of the scale). Adjusted liking data is shown in Figure 4, and are more 183
negative due to more dislike for the flavors versus water. The dialysis group’s adjusted liking 184
ratings were less negative than the control group’s, indicating the patients on dialysis rated the 185
samples closer to water for liking than controls (p=0.023), which could indicate the dialysis 186
group actually found the solutions closer to hedonically neutral than the control group. Specific 187
samples driving this difference between the groups were ferrous sulfate (p= 0.0092), potassium 188
chloride (p=0.014), sodium chloride (p=0.045), and sodium phosphate (p=0.042); 189
190

Serum parameters and taste 191 Serum results for the patients on dialysis are reported in Table 3, and significant 192
correlations are shown in Table 4. One sample was excluded due to hemolysis. Spearman 193
correlations were conducted between the sensory ratings and serum levels of compounds of 194
interest. In unadjusted ratings, a negative correlation was observed between serum glucose and 195
urea flavor intensity (p= 0.035); negative correlations for unadjusted liking ratings were also 196
observed between flavor intensity of monosodium glutamate and creatinine (p= 0.033). In water 197
adjusted ratings, a positive correlation was observed between serum potassium and taste intensity 198
of monosodium glutamate (p= 0.019); in adjusted liking ratings, positive correlations were 199
observed between serum potassium and phosphoric acid (p= 0.0008), potassium chloride ((p= 200
0.027), urea (p= 0.028), and calcium chloride (p= 0.028). Negative correlations were observed 201
between adjusted liking ratings for urea and serum carbon dioxide (p= 0.038) and between 202
ferrous sulfate and serum sodium (p= 0.045). 203
204
Discussion 205
In the present pilot study, we found water-adjusted flavor and liking intensity scores were 206
different between control and dialysis patients. Specifically, dialysis patients reported a more 207
intense sensation for two sodium containing salts (monosodium glutamate, sodium chloride) and 208
a less intense sensation for one compound, another sodium containing salt (sodium phosphate). 209
Differences in adjusted liking ratings appear to be primarily due to ferrous sulfate, potassium 210
chloride, sodium chloride, and sodium phosphate being rated closer to water ratings (near neutral 211
on the hedonic scale) for the dialysis group compared to control. The differences found in the 212
water-adjusted data, but not unadjusted data, suggest that baseline taste perception may be an 213
important factor for dysgeusia in dialysis patients and should be better characterized in future 214
studies. 215
Prior studies have generally shown that patients with CKD often experience lower taste 216
intensity and/or sensitivity for sodium containing compounds, along with other tastants. One 217
study (Manley, Haryono et al. 2012) conducted suggested that CKD patients have an impaired 218
ability to identify sour, bitter and glutamate tastes. Another study (McMahon, Campbell et al. 219
2014) also reported significantly lower intensity scores for monosodium glutamate and sodium 220

chloride. In that particular study, higher salivary and serum sodium levels correlated with lower 221
sensitivity to tasting sodium (McMahon, Campbell et al. 2014). A possible explanation for 222
differences between these reports and our current work is that our taste assessments were not 223
performed in the dialysis patients until they had undergone some of their dialysis treatment. 224
Although we aimed to complete the assessment at the beginning of treatment, this was not 225
feasible due to the busy clinical setting, and on occasion was not conducted until >30minutes 226
after dialysis commencement. It is possible that excess salivary and serum sodium was filtered 227
through the dialysate, reducing their sodium taste-threshold and improving sensitivity. Indeed, 228
previous research has shown that dialysis treatment removes excess salivary metabolites in a 229
mirror-like fashion to serum filtration (Seethalakshmi, Koteeswaran et al. 2014, Khanum, 230
Mysore-Shivalingu et al. 2017). In addition, this has been linked to improved taste function post-231
dialysis (Burge, Park et al. 1979). Older studies have indicated increased sensitivity and 232
decreased preference for sodium chloride post dialysis which may further explain the higher 233
ratings noted in our dialysis group by comparison to healthy controls (Farleigh, Shepherd, et al. 234
1987, Shepherd, Farleigh et al. 1987, Leshem & Rudoy 1997) . Furthermore, given the difference 235
in our findings between water-adjusted and unadjusted assessments, and the lack of major 236
correlations with serum levels for sodium, it is possible that baseline abnormalities in taste are 237
more important than acute changes during dialysis. 238
In our study, unadjusted liking scores were generally rated <50 on the scales in both 239
patients and controls which indicated overall negative hedonic reaction to the solutions. These 240
lower ratings were expected given that the solutions were characteristically unpalatable, with 241
some leaving lingering tastes (e.g. ferrous sulfate and monosodium glutamate, in particular). 242
However, food ingredients lead to very different affective responses when presented in foods 243
versus in solution. Monosodium glutamate, for example, can make a variety of foods more 244
palatable, but is generally unpleasant when tasted in isolation. Patients undergoing dialysis 245
indicated that sodium phosphate, sodium chloride, potassium chloride, and ferrous sulfate 246
solutions tasted closer to a “neutral” water their control counterparts. However, distractions from 247
the dialysis procedure itself may have influenced these ratings. In general, we would expect the 248
busy clinical environment of a dialysis unit to confound liking ratings. However, we would have 249
expected the negative feelings of the environment (due to having to go through the process of 250
dialysis) could leech into negative affect for the stimuli presented. This was not the case. Future 251

studies should be conducted in a better controlled environment, or with controls in a similar 252
clinical environment to the patients attending dialysis. 253
254
We detected few associations between serum parameters and hemodialysis patient’s 255
flavor ratings in the present study. We did however observe that serum potassium, in particular, 256
correlated with water-adjusted hedonic ratings for a number of compounds. This may imply a 257
role for potassium in the hedonic perception of other flavors. As several potassium channels are 258
proposed to influence different types of taste (particularly sour and fatty tastes (Gilbertson, 259
Fontenot et al. 1997, Challis and Ma 2016)), imbalances in potassium may alter taste cell 260
signaling, resulting in abnormalities in the quality of sensations and changes in effect. This 261
should be pursued in further work, both in patients on dialysis as well as healthy controls. 262
Prior research indicates that taste thresholds of renal patients increase with age and this finding is 263
also in agreement with results of studies on healthy subjects (Ogawa, Annear et al. 2017, Ng, 264
Woo et al. 2004, Vreman, Venter et al. 1980, Ciechanover, Peresecenschi et al. 1980). Therefore, 265
it is important to consider the fact that our dialysis and control groups were not demographically 266
well matched, especially in terms of age. Age was included as a covariate in our statistical model 267
and indeed indicated that younger subjects had higher ratings, even when adjusted for water. 268
This is consistent with other work. However, our patients on dialysis actually gave higher ratings 269
than the younger controls, which is directly the opposite of what we would expect for an age 270
effect, and indeed is also opposite from what we saw in our own model’s age effect Certainly, 271
matching the groups for age could improve our understanding of these potential differences 272
between groups, but a multitude of other confounding variables may also impact on our ability 273
to conduct taste tests in renal patients. Medications, diet and other chronic diseases can play an 274
influential role on taste perception, each of which are difficult to control for, especially in older 275
subjects who have many health issues (Boltong and Campbell 2013). 276
There are several other limitations to this study which must also be considered. As a 277
pilot study, the sample size was small and thus results should be considered preliminary. 278
Secondly, the control group did not have serum parameters measured for comparison. 279
Furthermore, our ability to assess the serum-taste perception relationship was restrained 280
considering our serum samples were drawn late into the dialysis session. Future larger studies 281

should be pursued using controlled, or at least comparable, environments and protocols to 282
minimize confounding factors in our clinical setting. 283
Finally, our findings of greater differences when controlling for water perception should 284
be further investigated. Deionized water itself stimulates sensation in the mouth, often of greater 285
intensity than tap or spring waters (Hoehl, Schoenberger et al. 2010). We did not find a 286
difference in taste intensity of deionized water between our groups in the current study, but this 287
concept should be further investigated to determine if individual differences in serum and 288
salivary solutes contribute to differences in perception of water, or some sort of partitioning of 289
solutes within the deionized water, which could then alter perception of other dissolved solids. 290
Our findings indicate that it may be important to correct for this baseline sensation of the solvent 291
in future work to investigate dysgeusia in patients undergoing hemodialysis. 292
293
Conclusion 294
The findings of this study add to the body of evidence suggesting that taste changes occur 295
with CKD. Our work emphasizes the need to investigate taste and flavor active compounds 296
beyond the prototypical taste stimuli for sweet, sour, salty, bitter and umami tastes. As many 297
known tastants are found in human serum and saliva, and are dysregulated with CKD, these non-298
typical stimuli are prime candidates for contributing to dysgeusia accompanying CKD. We 299
identified CKD patients experienced altered taste intensity for compounds that include a sodium 300
ion (greater intensity for monosodium glutamate and sodium chloride, and lesser intensity for 301
sodium phosphate) and lesser dislike for ferrous sulfate, potassium chloride, sodium chloride, 302
and sodium phosphate compared to healthy controls, when correcting for the subjects’ 303
perceptions of deionized water. More research is required to fully evaluate how dysgeusia is 304
experienced by CKD patients. 305
306 Conflicts of interests: The authors have no conflicts of interest to declare. 307
308
Funding: This work was supported by an Indiana CTSI Project Development Team Grant (NIH 309
UL1TR00118) to KMHG; KMHG receives support through K01 DK102864; RNM receives 310
support through K23 DK102824. 311
312
Acknowledgements 313
This work was presented in part at the American Society of Nephrology Kidney Week 2017 314 Meeting in New Orleans, LA (Fitzgerald C, Moorthi RN, Moe SM, Hill Gallant KM, Running CA. A 315 pilot study characterizing dysgeusia in hemodialysis patients. J Am Soc Nephrol 28, 2017: 723) 316 317

Table 1: Concentration of Solutions used in the Taste Assessment 318
Compounds Molarity (M) %(w/w) Sensory quality
Sodium Chloride 0.2 1.16 Salty
Potassium Chloride 0.01 0.74 Salty, bitter
Calcium Chloride 0.15 1.62 Calcium taste†, metallic
Sodium Phosphate 0.0063 0.09 Salty, phosphorous taste†
Phosphoric Acid 0.007 0.37 Sour
Urea 0.5 2.91 Bitter
Ferrous Sulfate 0.025 0.69 Metallic
Monosodium Glutamate 0.01 0.17 Umami
Deionised Water - - Control (solvent)
†These “tastes” are under debate as potential gustatory sensations; we will refer to them
as tastes for simplicity in this report, but readers should consult other articles to
understand the state of the science regarding these compounds as taste stimuli (Tordoff,
Alarcón et al. 2012, Tordoff 2017).
Table 2: Participant Characteristics 319
Control Dialysis
N 29 17
Gender Male, N (%)
Female, N (%)
13 (48.1)
16 (51.9)
10 (62.5)
7 (37.5)
Age (years) 32 (range 21-61) 61 (range 23-87)*
Taste Abnormalities, N (%) - 7 (43.8)
*p < 0.05, Dialysis vs. Control

Table 3: Serum Parameters for Dialysis Patients 320
Blood Parameters Ref. Range* Mean
Magnesium (mg/dL) 1.6-2.6 2.04 ± 0.17
Sodium (mmol/L) 136-145 137.60 ± 2.06
Potassium (mmol/L) 3.5-5.1 4.31 ± 0.56
Calcium (mg/dL) 8.4-10.5 8.91 ± 0.63
Phosphorous (mg/dL) 2.5-4.7 3.37 ± 1.69
Chloride (mmol/L) 98-110 98.93 ± 2.25
Carbon dioxide (mmol/L) 20-29 24.27 ± 3.90
Glucose (mg/dL) 65-99 128.07 ± 58.39
Urea Nitrogen (mg/dL) 10-20 33.40 ± 17.14
Creatinine (mg/dL) 0.70-1.20 5.24± 3.14
Albumin (mg/dL) 3.5-5.0 3.57 ± .35
* reference range provided by Mid America Clinical Laboratories.
Table 4: Spearman correlations between sensory ratings and serum parameters Rating type Sensory stimulus Serum parameter Spearman Rho p-value Unadjusted flavor Urea Glucose -0.55 0.035
Water adjusted flavor Monosodium glutamate
Potassium 0.60 0.019
Unadjusted liking Monosodium glutamate
Creatinine -0.55 0.033
Water adjusted liking Phosphoric acid Potassium 0.77 0.0008 Potassium chloride Potassium 0.57 0.027 Urea Potassium 0.57 0.028 Calcium chloride Potassium 0.56 0.028 Urea Carbon dioxide -0.54 0.038 Ferrous sulfate Sodium -0.52 0.045
321
322
323 Figure 1: Mean and standard error for flavor intensity, unadjusted
324
325 Figure 2: Mean and standard error for flavor intensity after adjustment for the perception of
water (Original rating – water rating; positive values indicate the sample was rated as more
intense than water)
326 327 328
0102030405060708090
100
Calciumchloride
Ferroussulfate
Phosphoricacid
Potassiumchloride
Monosodiumglutamate
Sodiumchloride
Sodiumphosphate
Urea Water
Flav
or I
nten
sity
(0=N
one,
100
= St
rong
est E
ver)
Dialysis Control
-20-10
0102030405060708090
100
Calciumchloride
Ferroussulfate
Phosphoricacid
Potassiumchloride
Monosodiumglutamate
Sodiumchloride
Sodiumphosphate
Urea
Adj
sute
d In
tens
ity
(Stim
ulus
-w
ater
)
Dialysis Control
p=0.017
p=0.0018
p=0.0016
329 Figure 3: Mean and standard error for liking of compounds, unadjusted
330 331 332 333
334 Figure 4: Mean and standard error for liking of compounds after adjustment for the perception 335 of water (Original rating – water rating; negative numbers indicate water was liked more than 336 the sample, and numbers to closer to zero mean the sample was rated more similarly to water). 337 338
0102030405060708090
100
Calciumchloride
Ferroussulfate
Phosphoricacid
Potassiumchloride
Monosodiumglutamate
Sodiumchloride
Sodiumphosphate
Urea Water
Lik
ing
(0 =
Wor
st e
ver,
100
= B
est e
ver)
Dialysis Control
-60
-50
-40
-30
-20
-10
0
10
20
Calciumchloride
Ferroussulfate
Phosphoricacid
Potassiumchloride
Monosodiumglutamate
Sodiumchloride
Sodiumphosphate
Urea
Adj
sute
d L
ikin
g
(Stim
ulus
-w
ater
)
Dialysis Control
p=0.0092 p=0.014 p=0.045
p=0.042

References 339
340 Beerendrakumar, N. R., L. and S. Haridasan (2018). "Dietary and Fluid Regime Adherence in 341
Chronic Kidney Disease Patients." J Caring Sci 7(1): 17-20. 342 Boltong, A. and K. Campbell (2013). "‘Taste’ changes: A problem for patients and their 343
dietitians." Nutrition & Dietetics 70(4): 262-269. 344 Burge, J., C., S. Park, Hi., C. Whitlock, P. and R. Schimmel (1979). "Taste acuity in patients 345
undergoing long-term hemodialysis." Kidney Int. 15(1): 49-53. 346 Carrero, J. (2011). "Mechanisms of Altered Regulation of Food Intake in Chronic Kidney 347
Disease." Journal of Renal Nutrition 21(1): 7–11. 348 Challis, R. C. and M. Ma (2016). "Sour taste finds closure in a potassium channel." PNAS 349
113(2): 246-247. 350 Ciechanover M., G. Peresecenschi, A. Aviram and J.E. Steiner (1980). “Malrecognition of taste 351
in uremia.” Nephron 26(1): 20-22. 352 Dalton, P. D., N., H. Nagata and P. A. S. Breslin (2000). "The merging of the senses: integration 353
of subthreshold taste and smell." Nature Neuroscience 3: 431-432. 354 Farleigh, C. A., R. Shepherd, S. Jevons and J. S. Pryor (1987). "Effects of haemodialysis on taste 355
for salt in relation to changes in blood constituents." Hum Nutr Clin Nutr 41(6): 441-451. 356 Gilbertson, T. A., D. T. Fontenot, L. Liu, H. Zhang and W. T. Monroe (1997). "Fatty acid 357
modulation of K+ channels in taste receptor cells: gustatory cues for dietary fat." American 358 Journal of Physiology 272(4). 359
Hayes, J. E., A. L. Allen and S. M. Bennett (2013). "Direct comparison of the generalized Visual 360 Analog Scale (gVAS) and general Labeled Magnitude Scale (gLMS)." Food Qual Prefer 361 28(1): 36-44. 362
Hill, N. R., S. T. Fatoba, J. L. Oke, J. A. Hirst, C. A. O’Callaghan, D. S. Lasserson and F. D. R. 363 Hobbs (2016). "Global Prevalence of Chronic Kidney Disease – A Systematic Review and 364 Meta-Analysis." PLoS One 11(7). 365
Hoehl, K., G. Schoenberger, U. and e. al. (2010). "Water quality and taste sensitivity for basic 366 tastes and metallic sensation." Food Quality and Preference 21(2): 243–249. 367
Kalantar-Zadeh, K., A. R. Tortorici, J. L. Chen, M. Kamgar, W. L. Lau, H. Moradi, C. M. Rhee, 368 E. Streja and C. P. Kovesdy (2015). "Dietary restrictions in dialysis patients: Is there 369 anything left to eat?" Semin Dial 28(2): 159-168. 370
Khanum, N., M. Mysore-Shivalingu, S. Basappa, A. Patil and S. Kanwar (2017). Evaluation of 371 changes in salivary composition in renal failure patients before and after hemodialysis. J Clin 372 Exp Dent. 9: e1340-1345. 373
Leshem M. and J. Rudoy (1997). “Hemodialysis increases the preference for salt in soup.” 374 Physiol Behav 61(1): 65-69. 375
Lynch, K. E., R. Lynch, G. C. Curhan and S. M. Brunelli (2013). "Altered taste perception and 376 nutritional status among hemodialysis patients." J Ren Nutr 23(4): 288-295.e281. 377
Manley, K., J., R. Haryono, Y. and R. Keast, S., J. (2012). "Taste changes and saliva 378 composition in chronic kidney disease." Renal Society of Australia Journal 8(2): 56-60. 379
Manley, K. J. (2015). "Taste genetics and gastrointestinal symptoms experienced in chronic 380 kidney disease." Eur J Clin Nutr 69(7): 781-785. 381

Mc Causland, F., R., S. Waikar, S. and S. Brunelli, M. (2012). "Increased dietary sodium is 382 independently associated with greater mortality among prevalent hemodialysis patients." 383 Kidney Int 82(2): 204-211. 384
McMahon, E. J., K. L. Campbell and J. D. Bauer (2014). "Taste perception in kidney disease and 385 relationship to dietary sodium intake." Appetite 83: 236-241. 386
Neto, L., C., M. Bacci, R., l. Sverzutt1, C., M. Costa, G. and e. al. (2016). "The Role of Zinc in 387 Chronic Kidney Disease Patients on Hemodialysis: A Systematic Review." Health 8: 344-388 352. 389
Ng K., J. Woo, M. Kwan, M. Sea, A. Wang, R. Lo, A. Chan and C.J. Henry (2004). “Effect of 390 age and disease on taste perception.” J Pain Symptom Manage 28(1): 28-34. 391
Ogawa T., M.J. Annear, K. Ikebe and Y. Maeda (2017). “Taste-related sensations in old age.” J 392 Oral Rehabil 44(8): 626-635. 393
Oquendo, L. G., J. M. M. Asencio and C. B. de Las Nieves (2017). "Contributing factors for 394 therapeutic diet adherence in patients receiving haemodialysis treatment: an integrative 395 review." J Clin Nurs 26(23-24): 3893-3905. 396
Rodrigues, V., P. and M. Franco, M. et al. (2015). "Salivary levels of calcium, phosphorus, 397 potassium, albumin and correlation with serum biomarkers in hemodialysis patients." 398 Archives of Oral Biology 62: 58–63. 399
Seethalakshmi, C., D. Koteeswaran and V. Chiranjeevi (2014). "Correlation of Serum and 400 Salivary Biochemical Parameters in end Stage Renal Disease Patients Undergoing 401 Hemodialysis in Pre and Post-Dialysis State." J Clin Diagn Res 8(12): 12-14. 402
Shepherd, R., C. A. Farleigh and J. S. Pryor (1986). "Changes in salt taste in dialysis and their 403 relationship to blood constituents." Percept Mot Skills 62(2): 343-347. 404
Shepherd, R, C.A. Farleigh, C. Atkinson and J.S. Pryor (1987). “Effects of haemodialysis on 405 taste and thirst.” Appetite 9(2): 79-88. 406
Shrout, P. E., G. Stadler, S. P. Lane, M. J. McClure, G. L. Jackson, F. D. Clavel, M. Iida, M. E. 407 J. Gleason, J. H. Xu and N. Bolger (2018). "Initial elevation bias in subjective reports." Proc 408 Natl Acad Sci U S A 115(1): E15-E23. 409
Tordoff, M. G. (2017). "Phosphorus Taste Involves T1R2 and T1R3." Chem Senses 42(5): 425-410 433. 411
Tordoff, M. G., L. K. Alarcón, S. Valmeki and P. Jiang (2012). "T1R3: A human calcium taste 412 receptor." Scientific Reports 2: 496. 413
Vreman H.J, C. Venter, J. Leewater, C. Oliver, M.W. Weiner (1980). “Taste, smell and zinc 414 metabolism in patients with chronic renal failure.” Nephron 26(4): 163-170. 415
Whelton, A. J., A. M. Dietrich, G. A. Burlingame, M. Schechs and S. E. Duncan (2007). 416 "Minerals in drinking water: impacts on taste and importance to consumer health." Water and 417 Science Technology 55(5): 283-291. 418
419

Supplemental files 420
421 422 proc sort data=CKD; 423 by sample group cond id Order; 424 run; 425 ods graphics on; 426 ods output tests3=mixedtestsFlavorV; 427 ods output diffs=FVdiff; 428 Title 'Flavor tests'; 429 proc mixed data=ckd; 430 class id Sample sex group order; 431 model flavor = sample group sex YOB sample*group/ residual outp=FTVresid 432 ddfm=KR; 433 repeated order/ subject=id type= ar(1); 434 lsmeans group / pdiff ADJDFE=ROW; 435 lsmeans sample*group/ pdiff ADJDFE=ROW; 436 run; 437 quit; 438 ods graphics off; 439 440 441 proc sort data=CKD; 442 by sample group cond id Order; 443 run; 444 ods graphics on; 445 ods output tests3=mixedtestsLikingV; 446 ods output diffs=LVdiff; 447 Title 'Liking tests'; 448 proc mixed data=ckd; 449 class id Sample sex group order; 450 model liking= sample group sex YOB sample*group/ residual outp=LTVresid 451 ddfm=KR; 452 repeated order / subject=id type= ar(1); 453 lsmeans group / pdiff ADJDFE=ROW; 454 lsmeans sample*group/ pdiff ADJDFE=ROW; 455 run; 456 quit; 457 ods graphics off; 458 459 460 proc sort data=CKD; 461 by sample group cond id Order; 462 run; 463 ods graphics on; 464 ods output tests3=mixedtestsFlavorVW; 465 ods output diffs=FWVdiff; 466 Title 'Flavor tests corrected for water'; 467 proc mixed data=ckd; 468 where sample ne 'Water'; 469 class id Sample sex group order; 470 model FlSam_H2O = sample group sex YOB sample*group/ residual outp=FTVWresid 471 ddfm=KR; 472 repeated order/ subject=id type= ar(1); 473 lsmeans group / pdiff ADJDFE=ROW; 474

lsmeans sample*group/ pdiff ADJDFE=ROW; 475 run; 476 quit; 477 ods graphics off; 478 479 480 proc sort data=CKD; 481 by sample group cond id Order; 482 run; 483 ods graphics on; 484 ods output tests3=mixedtestsLikingVW; 485 ods output diffs=LWVdiff; 486 Title 'Liking tests Corrected for water'; 487 proc mixed data=ckd; 488 where sample ne 'Water'; 489 class id Sample sex group order; 490 model lSam_H2O= sample group sex YOB sample*group/ residual outp=LTVWresid 491 ddfm=KR; 492 repeated order / subject=id type= ar(1); 493 lsmeans group / pdiff ADJDFE=ROW; 494 lsmeans sample*group/ pdiff ADJDFE=ROW; 495 run; 496 quit; 497 ods graphics off; 498 499
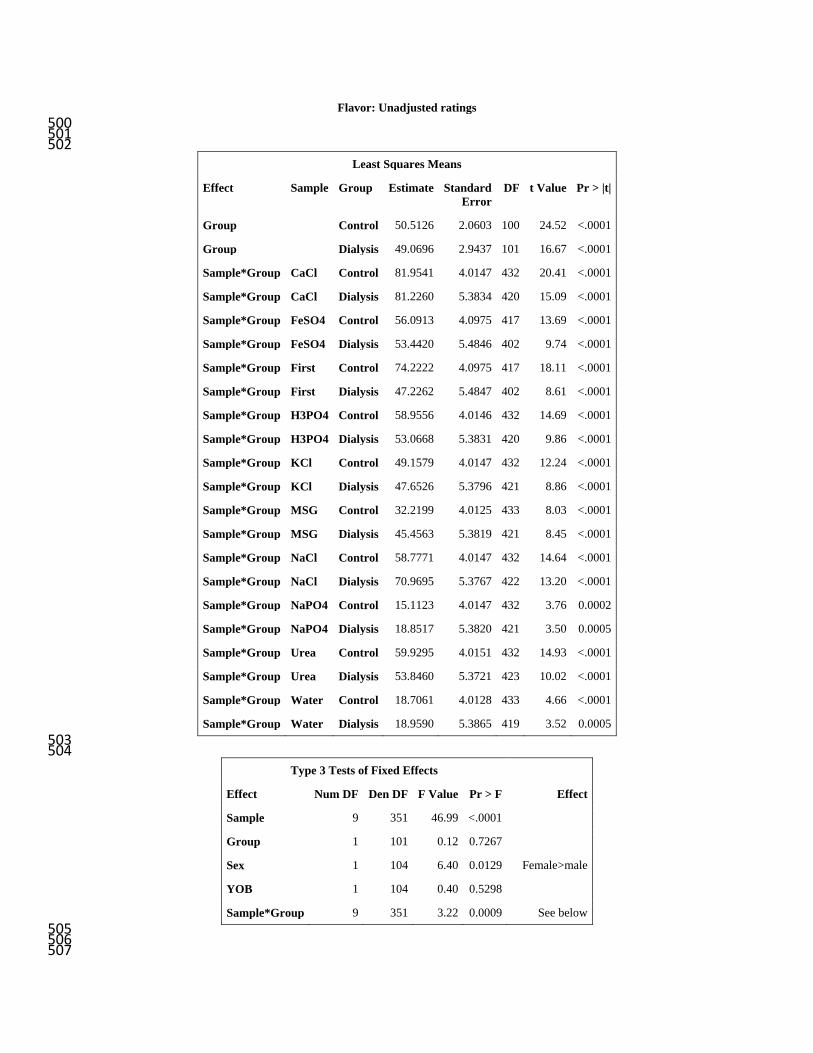
Flavor: Unadjusted ratings 500 501 502
Least Squares Means
Effect Sample Group Estimate Standard Error
DF t Value Pr > |t|
Group Control 50.5126 2.0603 100 24.52 <.0001
Group Dialysis 49.0696 2.9437 101 16.67 <.0001
Sample*Group CaCl Control 81.9541 4.0147 432 20.41 <.0001
Sample*Group CaCl Dialysis 81.2260 5.3834 420 15.09 <.0001
Sample*Group FeSO4 Control 56.0913 4.0975 417 13.69 <.0001
Sample*Group FeSO4 Dialysis 53.4420 5.4846 402 9.74 <.0001
Sample*Group First Control 74.2222 4.0975 417 18.11 <.0001
Sample*Group First Dialysis 47.2262 5.4847 402 8.61 <.0001
Sample*Group H3PO4 Control 58.9556 4.0146 432 14.69 <.0001
Sample*Group H3PO4 Dialysis 53.0668 5.3831 420 9.86 <.0001
Sample*Group KCl Control 49.1579 4.0147 432 12.24 <.0001
Sample*Group KCl Dialysis 47.6526 5.3796 421 8.86 <.0001
Sample*Group MSG Control 32.2199 4.0125 433 8.03 <.0001
Sample*Group MSG Dialysis 45.4563 5.3819 421 8.45 <.0001
Sample*Group NaCl Control 58.7771 4.0147 432 14.64 <.0001
Sample*Group NaCl Dialysis 70.9695 5.3767 422 13.20 <.0001
Sample*Group NaPO4 Control 15.1123 4.0147 432 3.76 0.0002
Sample*Group NaPO4 Dialysis 18.8517 5.3820 421 3.50 0.0005
Sample*Group Urea Control 59.9295 4.0151 432 14.93 <.0001
Sample*Group Urea Dialysis 53.8460 5.3721 423 10.02 <.0001
Sample*Group Water Control 18.7061 4.0128 433 4.66 <.0001
Sample*Group Water Dialysis 18.9590 5.3865 419 3.52 0.0005 503 504
Type 3 Tests of Fixed Effects
Effect Num DF Den DF F Value Pr > F Effect
Sample 9 351 46.99 <.0001
Group 1 101 0.12 0.7267
Sex 1 104 6.40 0.0129 Female>male
YOB 1 104 0.40 0.5298
Sample*Group 9 351 3.22 0.0009 See below 505 506 507

Differences of Least Squares Means
Effect Sample Group _Sample _Group Estimate Standard Error
DF t Value Pr > |t|
Group Control Dialysis 1.4430 4.1167 101 0.35 0.7267
Sample*Group CaCl Control CaCl Dialysis 0.7281 7.0097 400 0.10 0.9173
Sample*Group FeSO4 Control FeSO4 Dialysis 2.6493 7.1349 379 0.37 0.7106
Sample*Group First Control First Dialysis 26.9960 7.1350 379 3.78 0.0002
Sample*Group H3PO4 Control H3PO4 Dialysis 5.8888 7.0093 400 0.84 0.4013
Sample*Group KCl Control KCl Dialysis 1.5053 7.0068 401 0.21 0.8300
Sample*Group MSG Control MSG Dialysis -13.2365 7.0072 401 -1.89 0.0596
Sample*Group NaCl Control NaCl Dialysis -12.1924 7.0046 401 -1.74 0.0825
Sample*Group NaPO4 Control NaPO4 Dialysis -3.7394 7.0087 400 -0.53 0.5940
Sample*Group Urea Control Urea Dialysis 6.0835 7.0013 402 0.87 0.3854
Sample*Group Water Control Water Dialysis -0.2528 7.0110 400 -0.04 0.9713 508
509 510
511 512
513 514 515
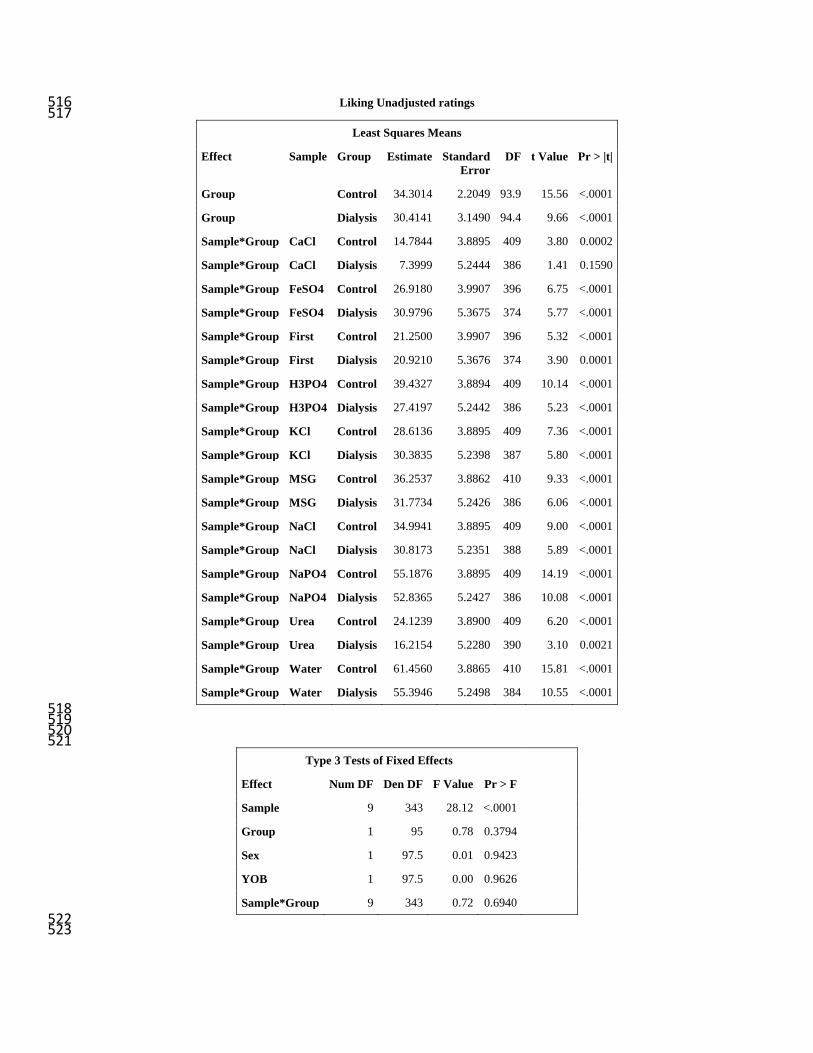
Liking Unadjusted ratings 516 517
Least Squares Means
Effect Sample Group Estimate Standard Error
DF t Value Pr > |t|
Group Control 34.3014 2.2049 93.9 15.56 <.0001
Group Dialysis 30.4141 3.1490 94.4 9.66 <.0001
Sample*Group CaCl Control 14.7844 3.8895 409 3.80 0.0002
Sample*Group CaCl Dialysis 7.3999 5.2444 386 1.41 0.1590
Sample*Group FeSO4 Control 26.9180 3.9907 396 6.75 <.0001
Sample*Group FeSO4 Dialysis 30.9796 5.3675 374 5.77 <.0001
Sample*Group First Control 21.2500 3.9907 396 5.32 <.0001
Sample*Group First Dialysis 20.9210 5.3676 374 3.90 0.0001
Sample*Group H3PO4 Control 39.4327 3.8894 409 10.14 <.0001
Sample*Group H3PO4 Dialysis 27.4197 5.2442 386 5.23 <.0001
Sample*Group KCl Control 28.6136 3.8895 409 7.36 <.0001
Sample*Group KCl Dialysis 30.3835 5.2398 387 5.80 <.0001
Sample*Group MSG Control 36.2537 3.8862 410 9.33 <.0001
Sample*Group MSG Dialysis 31.7734 5.2426 386 6.06 <.0001
Sample*Group NaCl Control 34.9941 3.8895 409 9.00 <.0001
Sample*Group NaCl Dialysis 30.8173 5.2351 388 5.89 <.0001
Sample*Group NaPO4 Control 55.1876 3.8895 409 14.19 <.0001
Sample*Group NaPO4 Dialysis 52.8365 5.2427 386 10.08 <.0001
Sample*Group Urea Control 24.1239 3.8900 409 6.20 <.0001
Sample*Group Urea Dialysis 16.2154 5.2280 390 3.10 0.0021
Sample*Group Water Control 61.4560 3.8865 410 15.81 <.0001
Sample*Group Water Dialysis 55.3946 5.2498 384 10.55 <.0001 518 519 520 521
Type 3 Tests of Fixed Effects
Effect Num DF Den DF F Value Pr > F
Sample 9 343 28.12 <.0001
Group 1 95 0.78 0.3794
Sex 1 97.5 0.01 0.9423
YOB 1 97.5 0.00 0.9626
Sample*Group 9 343 0.72 0.6940 522 523

Differences of Least Squares Means
Effect Sample Group _Sample _Group Estimate Standard Error
DF t Value Pr > |t|
Group Control Dialysis 3.8873 4.4018 95 0.88 0.3794
Sample*Group CaCl Control CaCl Dialysis 7.3844 6.8725 355 1.07 0.2833
Sample*Group FeSO4 Control FeSO4 Dialysis -4.0616 7.0238 344 -0.58 0.5635
Sample*Group First Control First Dialysis 0.3290 7.0239 344 0.05 0.9627
Sample*Group H3PO4 Control H3PO4 Dialysis 12.0130 6.8721 355 1.75 0.0813
Sample*Group KCl Control KCl Dialysis -1.7699 6.8689 356 -0.26 0.7968
Sample*Group MSG Control MSG Dialysis 4.4803 6.8691 356 0.65 0.5147
Sample*Group NaCl Control NaCl Dialysis 4.1768 6.8654 357 0.61 0.5433
Sample*Group NaPO4 Control NaPO4 Dialysis 2.3511 6.8712 355 0.34 0.7324
Sample*Group Urea Control Urea Dialysis 7.9085 6.8602 358 1.15 0.2498
Sample*Group Water Control Water Dialysis 6.0613 6.8748 355 0.88 0.3786 524
525 526
527 528
529 530 531
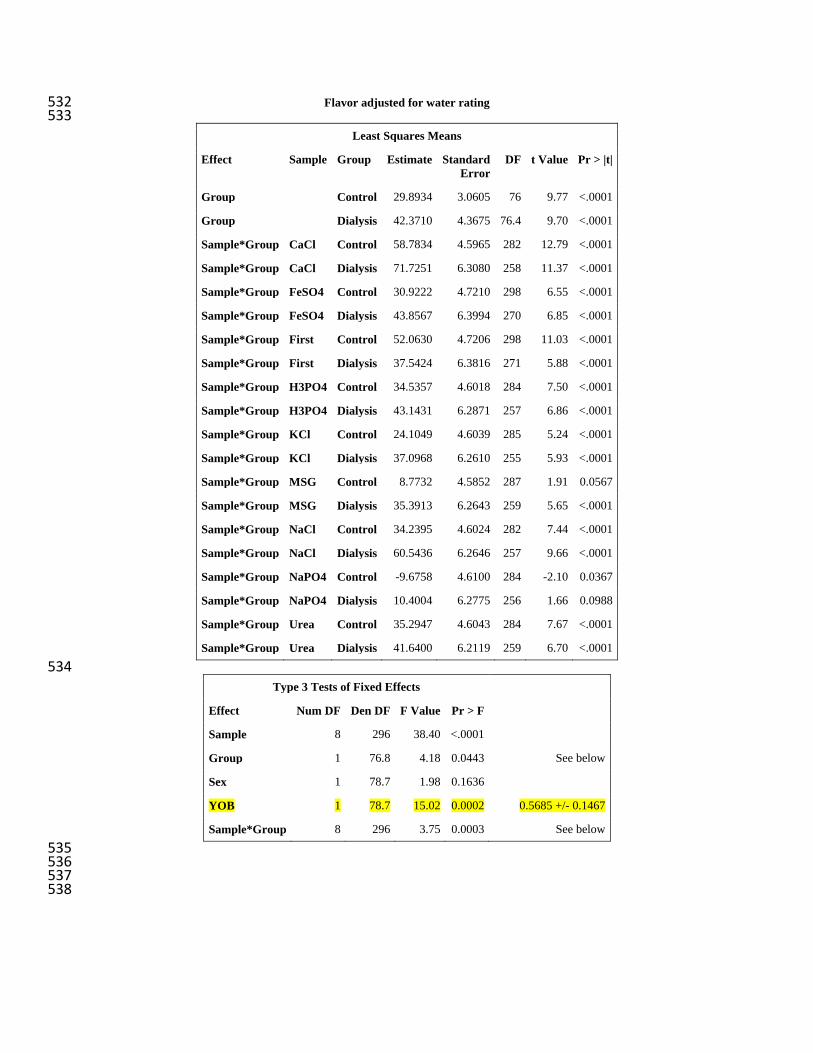
Flavor adjusted for water rating 532 533
Least Squares Means
Effect Sample Group Estimate Standard Error
DF t Value Pr > |t|
Group Control 29.8934 3.0605 76 9.77 <.0001
Group Dialysis 42.3710 4.3675 76.4 9.70 <.0001
Sample*Group CaCl Control 58.7834 4.5965 282 12.79 <.0001
Sample*Group CaCl Dialysis 71.7251 6.3080 258 11.37 <.0001
Sample*Group FeSO4 Control 30.9222 4.7210 298 6.55 <.0001
Sample*Group FeSO4 Dialysis 43.8567 6.3994 270 6.85 <.0001
Sample*Group First Control 52.0630 4.7206 298 11.03 <.0001
Sample*Group First Dialysis 37.5424 6.3816 271 5.88 <.0001
Sample*Group H3PO4 Control 34.5357 4.6018 284 7.50 <.0001
Sample*Group H3PO4 Dialysis 43.1431 6.2871 257 6.86 <.0001
Sample*Group KCl Control 24.1049 4.6039 285 5.24 <.0001
Sample*Group KCl Dialysis 37.0968 6.2610 255 5.93 <.0001
Sample*Group MSG Control 8.7732 4.5852 287 1.91 0.0567
Sample*Group MSG Dialysis 35.3913 6.2643 259 5.65 <.0001
Sample*Group NaCl Control 34.2395 4.6024 282 7.44 <.0001
Sample*Group NaCl Dialysis 60.5436 6.2646 257 9.66 <.0001
Sample*Group NaPO4 Control -9.6758 4.6100 284 -2.10 0.0367
Sample*Group NaPO4 Dialysis 10.4004 6.2775 256 1.66 0.0988
Sample*Group Urea Control 35.2947 4.6043 284 7.67 <.0001
Sample*Group Urea Dialysis 41.6400 6.2119 259 6.70 <.0001 534
Type 3 Tests of Fixed Effects
Effect Num DF Den DF F Value Pr > F
Sample 8 296 38.40 <.0001
Group 1 76.8 4.18 0.0443 See below
Sex 1 78.7 1.98 0.1636
YOB 1 78.7 15.02 0.0002 0.5685 +/- 0.1467
Sample*Group 8 296 3.75 0.0003 See below 535 536 537 538
Differences of Least Squares Means
Effect Sample Group _Sample _Group Estimate Standard Error
DF t Value Pr > |t|
Group Control Dialysis -12.4776 6.1024 76.8 -2.04 0.0443
Sample*Group CaCl Control CaCl Dialysis -12.9416 8.3506 227 -1.55 0.1226
Sample*Group FeSO4 Control FeSO4 Dialysis -12.9345 8.4852 238 -1.52 0.1287
Sample*Group First Control First Dialysis 14.5206 8.4729 239 1.71 0.0879
Sample*Group H3PO4 Control H3PO4 Dialysis -8.6074 8.3379 227 -1.03 0.3030
Sample*Group KCl Control KCl Dialysis -12.9919 8.3199 226 -1.56 0.1198
Sample*Group MSG Control MSG Dialysis -26.6181 8.3112 228 -3.20 0.0016
Sample*Group NaCl Control NaCl Dialysis -26.3041 8.3136 226 -3.16 0.0018
Sample*Group NaPO4 Control NaPO4 Dialysis -20.0762 8.3413 227 -2.41 0.0169
Sample*Group Urea Control Urea Dialysis -6.3453 8.2794 227 -0.77 0.4442 539 540
541
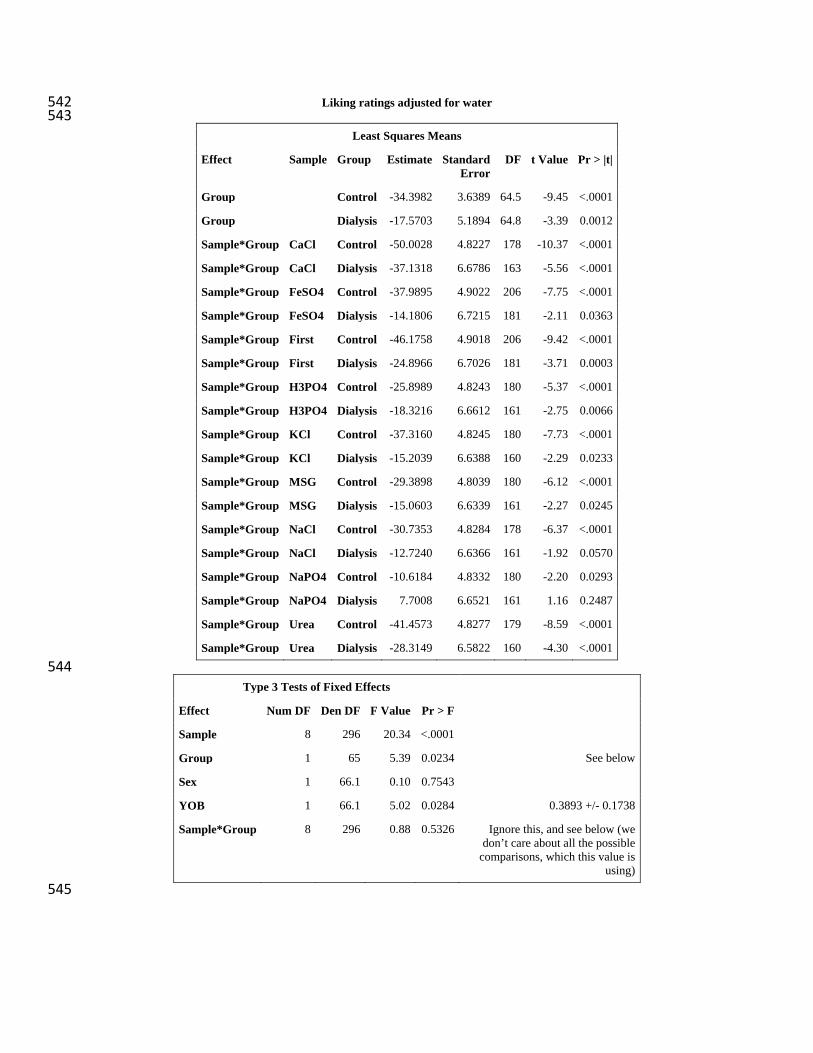
Liking ratings adjusted for water 542 543
Least Squares Means
Effect Sample Group Estimate Standard Error
DF t Value Pr > |t|
Group Control -34.3982 3.6389 64.5 -9.45 <.0001
Group Dialysis -17.5703 5.1894 64.8 -3.39 0.0012
Sample*Group CaCl Control -50.0028 4.8227 178 -10.37 <.0001
Sample*Group CaCl Dialysis -37.1318 6.6786 163 -5.56 <.0001
Sample*Group FeSO4 Control -37.9895 4.9022 206 -7.75 <.0001
Sample*Group FeSO4 Dialysis -14.1806 6.7215 181 -2.11 0.0363
Sample*Group First Control -46.1758 4.9018 206 -9.42 <.0001
Sample*Group First Dialysis -24.8966 6.7026 181 -3.71 0.0003
Sample*Group H3PO4 Control -25.8989 4.8243 180 -5.37 <.0001
Sample*Group H3PO4 Dialysis -18.3216 6.6612 161 -2.75 0.0066
Sample*Group KCl Control -37.3160 4.8245 180 -7.73 <.0001
Sample*Group KCl Dialysis -15.2039 6.6388 160 -2.29 0.0233
Sample*Group MSG Control -29.3898 4.8039 180 -6.12 <.0001
Sample*Group MSG Dialysis -15.0603 6.6339 161 -2.27 0.0245
Sample*Group NaCl Control -30.7353 4.8284 178 -6.37 <.0001
Sample*Group NaCl Dialysis -12.7240 6.6366 161 -1.92 0.0570
Sample*Group NaPO4 Control -10.6184 4.8332 180 -2.20 0.0293
Sample*Group NaPO4 Dialysis 7.7008 6.6521 161 1.16 0.2487
Sample*Group Urea Control -41.4573 4.8277 179 -8.59 <.0001
Sample*Group Urea Dialysis -28.3149 6.5822 160 -4.30 <.0001 544
Type 3 Tests of Fixed Effects
Effect Num DF Den DF F Value Pr > F
Sample 8 296 20.34 <.0001
Group 1 65 5.39 0.0234 See below
Sex 1 66.1 0.10 0.7543
YOB 1 66.1 5.02 0.0284 0.3893 +/- 0.1738
Sample*Group 8 296 0.88 0.5326 Ignore this, and see below (we don’t care about all the possible
comparisons, which this value is using)
545

Differences of Least Squares Means
Effect Sample Group _Sample _Group Estimate Standard Error
DF t Value Pr > |t|
Group Control Dialysis -16.8279 7.2466 65 -2.32 0.0234
Sample*Group CaCl Control CaCl Dialysis -12.8710 8.9565 143 -1.44 0.1529
Sample*Group FeSO4 Control FeSO4 Dialysis -23.8088 9.0286 158 -2.64 0.0092
Sample*Group First Control First Dialysis -21.2793 9.0156 158 -2.36 0.0195
Sample*Group H3PO4 Control H3PO4 Dialysis -7.5773 8.9445 143 -0.85 0.3983
Sample*Group KCl Control KCl Dialysis -22.1121 8.9283 142 -2.48 0.0144
Sample*Group MSG Control MSG Dialysis -14.3295 8.9128 143 -1.61 0.1101
Sample*Group NaCl Control NaCl Dialysis -18.0113 8.9226 142 -2.02 0.0454
Sample*Group NaPO4 Control NaPO4 Dialysis -18.3192 8.9469 143 -2.05 0.0424
Sample*Group Urea Control Urea Dialysis -13.1423 8.8851 141 -1.48 0.1413 546
547