characterization of solid-state forms of celecoxib · solubility and van’t hoff ... 2.3.1....
TRANSCRIPT

European Journal of Pharmaceutical Sciences 20 (2003) 305–317
Characterization of solid-state forms of celecoxib
Garima Chawlaa, Piyush Guptaa, R. Thilagavathib,Asit K. Chakrabortib, Arvind K. Bansala,∗
a Department of Pharmaceutical Technology (Formulations), National Institute of Pharmaceutical Education and Research (NIPER),S.A.S. Nagar, Punjab 160 062, India
b Department of Medicinal Chemistry, National Institute of Pharmaceutical Education and Research (NIPER), S.A.S. Nagar, Punjab 160 062, India
Received 17 April 2003; received in revised form 11 July 2003; accepted 15 July 2003
Abstract
This study deals with the generation and characterization of various solid-state forms of celecoxib, a selective cyclooxygenase-2 (COX-2)inhibitor. The drug was subjected to polymorphic screen using different solvents to explore the possibility of existence of different solidforms.N,N-Dimethyl acetamide (DMA) andN,N-dimethyl formamide (DMF) yielded solvates in 1:1 stoichiometric ratio. Quench coolingof the melt resulted in amorphous form of the drug. All these solid-state forms were characterized by thermoanalytical (DSC, TGA, HSM),crystallographic (XRD), microscopic (polarized, SEM), spectroscopic (FTIR), and elemental analysis techniques. Solubility and van’t Hoffstudies were carried out for their thermodynamic interpretation. Influence of morphology of different solid-state forms on flow behavior wasalso investigated. Molecular modeling studies were used to elucidate the interaction between solute and solvent molecules in the solvate.© 2003 Elsevier B.V. All rights reserved.
Keywords:Celecoxib; Polymorph; Pseudopolymorphs; Amorphous; Solid-state characterization
1. Introduction
Celecoxib, 4-[5-(4-methylphenyl)-3-(trifluoromethyl)-1H-pyrazol-1-yl] benzenesulphonamide (Fig. 1), belongsto a novel class of agents that selectively inhibit cyclo-oxygenase-2 (COX-2) enzymes. The introduction of this firstselective COX-2 inhibitor (375-fold selectivity) (Clemettand Goa, 2000) in the pharmaceutical market revolutionizedthe treatment of osteoarthritis (OA), rheumatoid arthritis(RA), and management of pain. It is one of the top sellingmolecules (ranked 8th), with a worldwide sales of $2614million in year 2000 (Anonymous, 2001). US FDA hasapproved its use in OA, RA, and dysmenorrhea with dosestrengths of 100–200 mg once/twice daily.
Celecoxib has a pKa of 11.1, and its low aqueous solu-bility (∼=5�g/ml) contributes to high variability in absorp-tion after oral administration (Paulson et al., 2001). Thus,it is important to enhance the solubility and dissolutionrate of celecoxib to improve its overall oral bioavailability.Celecoxib exists as long needle-shaped crystals that impart
∗ Corresponding author. Tel.:+91-172-214682/214687;fax: +91-172-214692.
E-mail address:[email protected] (A.K. Bansal).
it some undesirable properties like cohesiveness, low bulkdensity and compressibility, which complicates its process-ing into solid dosage forms (Leonard and Patricia, 2001).These crystals result in poor blend uniformity, have a ten-dency to separate out, agglomerate and form a monolithicmass upon compression in the tablet die, making it diffi-cult to process small quantities for formulation (Leonardand Patricia, 2001). Poor aqueous solubility and non-idealphysicotechnical properties of celecoxib can be improvedby utilizing alternate solid forms. A comparative assessmentof physicochemical and physicotechnical properties of vari-ous solid-state forms like, polymorphs, pseudopolymorphs,and amorphous form can help in selection of the best suitedform. Alternate solid-state forms of paracetamol, phenobar-bital, tolbutamide, etc. have been known to improve theirtableting behavior (Brittain and Fiese, 1999). Amorphousforms of several drugs (cephalexin, indomethacin, iopanoicacid, frusemide, novobiocin, etc.) have shown enhanced dis-solution rates and transient solubility, which translates intogreater bioavailability (Jozwiakowski, 2000).
In the present study, various solid-state forms of celecoxibwere generated and characterized by thermal, crystallo-graphic, microscopic, spectroscopic, and elemental analysistechniques. These forms were also studied for aqueous
0928-0987/$ – see front matter © 2003 Elsevier B.V. All rights reserved.doi:10.1016/S0928-0987(03)00201-X

306 G. Chawla et al. / European Journal of Pharmaceutical Sciences 20 (2003) 305–317
Fig. 1. Chemical structure of celecoxib.
solubility and van’t Hoff plots were generated. Physicotech-nical properties related to flow behaviour were also inves-tigated. Molecular modeling of the solvates was carriedout to explain the solute–solvent interactions in the crystallattice.
2. Materials and methods
2.1. Materials
Celecoxib was gifted by Ranbaxy Research Laboratories,Gurgaon, India. All solvents were AR/HPLC grade.
2.2. Preparation of solid-state forms
Solvent recrystallization approach was used for poly-morph screening. Solvents belonging to various classes asper ICH Q3C guidelines were used—acetone, ethanol, ethylacetate, isopropanol, tetrahydrofuran (Class III); acetoni-trile, chloroform, dichloromethane,N,N-dimethyl acetamide(DMA) and N,N-dimethyl formamide (DMF), methanol(Class II); and carbontetrachloride (Class I). Supersaturatedsolution of the drug was prepared by dissolving its excessamount in solvent at 60◦C, and the filtered solution wasallowed to evaporate at room temperature. In case of highboiling solvents, like DMA and DMF, the solution wasevaporated under reduced pressure, and kept overnight inrefrigerator to allow crystallization. The crystals were col-lected and dried under reduced pressure at about 40◦C.The amorphous form was prepared by quench coolingwhere in the molten drug was spontaneously cooled over anice bath.
2.3. Characterization
All characterization studies were performed in triplicate.
2.3.1. Differential scanning calorimetry (DSC)DSC analysis was performed using Mettler Toledo 821e
DSC (Mettler Toledo, Switzerland) operating with Stare
software version Solaris 2.5.1. Temperature axis and cellconstant were calibrated using indium. The samples wereexposed to heating rates of 1, 5, and 10◦C/min over atemperature range of 25–200◦C under nitrogen purging(80 ml/min) in pin-holed aluminium pans.
2.3.2. Thermogravimetric analysis (TGA)TGA was performed using Mettler Toledo 851e
TGA/SDTA in aluminium crucibles at a heating rate of10◦C/min from 25 to 200◦C under nitrogen purging(20 ml/min).
2.3.3. Hot stage microscopy (HSM)HSM was carried out using Leica DMLP polarized mi-
croscope and Leica LMV hot stage (Leica, Germany). Pho-tographs were taken using RICOH XR-X 3000D camera(RICOH, Japan). Samples were mounted in air and/or sili-cone oil, and heated from 25 to 200◦C.
2.3.4. X-ray powder diffraction (XRD)The XRD patterns of solid-state forms of celecoxib
were measured with Philips PW 1729 X-ray diffractometer(Philips, Holland) using an online recorder (PM 8203A).Radiations generated from CuK� source and filtered throughNi filters with a wavelength of 0.154 nm at 20 mA and35 kV were used to study the X-ray diffraction patterns.The instrument was operated over the 2θ range of 5–55◦.
2.3.5. Fourier transform infrared spectroscopy (FTIR)FTIR spectra of the samples were obtained on a Nico-
let FTIR Impact 410 spectrophotometer (Nicolet, USA)equipped with OMNIC analyzing software, by the conven-tional KBr pellet method. Liquid samples were taken neaton KBr discs.
2.3.6. Scanning electron microscopy (SEM)The samples were viewed under Jeol JSM 6100 scanning
electron microscope (Jeol, Japan) after sputter coating withgold in Fine Coat Ion JFC 1100 sputter (Jeol, Japan).
2.3.7. Elemental analysisElemental analysis was carried out with an elemental an-
alyzer (Elementar Vario El, Germany) instrument. About5 mg of sample was taken in tin boat and analyzed usinghelium as the carrier gas at a flow rate of 200 ml/min. Com-bustion was carried out at 1150◦C and the reduction tubewas maintained at 850◦C.
2.3.8. Solubility determinationSolubility was determined by placing an excess amount
of sample in 5 ml of water (maintained at 37◦C) inscrew-capped glass vials. Shaking at 200 rpm was achievedusing shaker water bath (Heto, Denmark). Samples werewithdrawn at regular intervals, filtered, and analyzed afterappropriate dilution using UV spectrometer (Perkin-ElmerLambda 20, USA) at aλmax of 252 nm.
2.3.9. van’t Hoff plotSolubility of crystalline forms was determined in temper-
ature range of 5–45◦C by placing an excess amount of sam-ple in 30 ml of 50:50 methanol:water solution, maintained atspecific temperature in jacketed glass bottles. The solutionwas stirred at 400 rpm on a magnetic stirrer. Samples were
G. Chawla et al. / European Journal of Pharmaceutical Sciences 20 (2003) 305–317 307
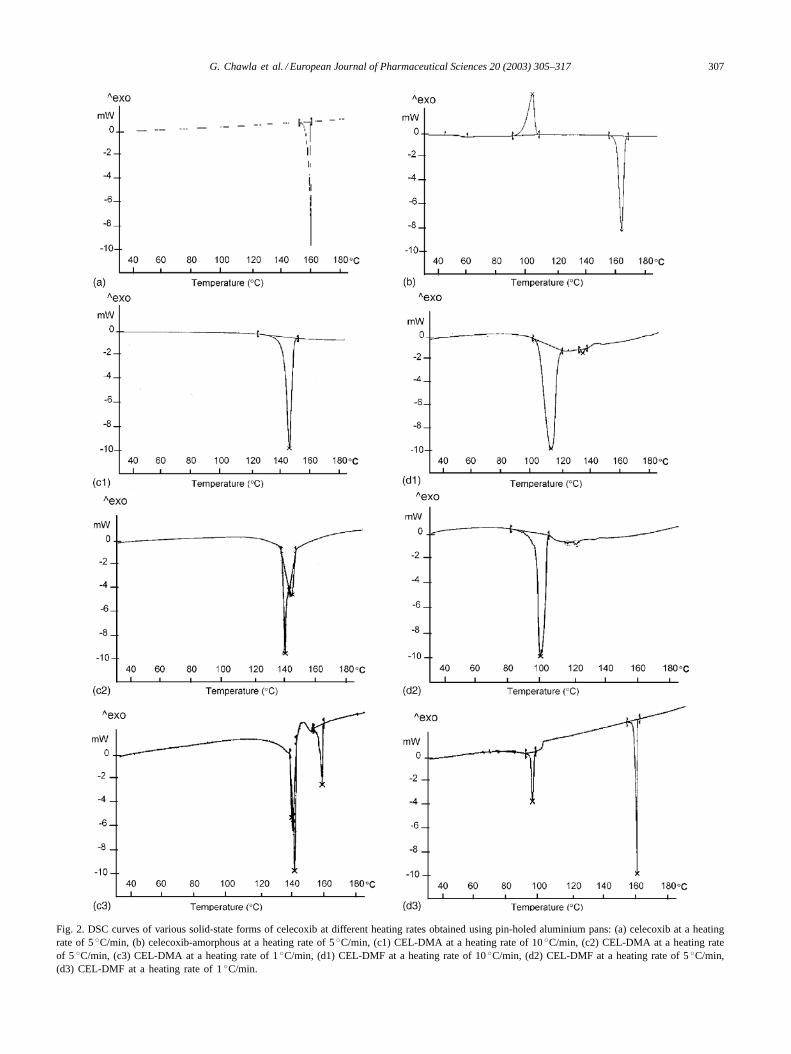
Fig. 2. DSC curves of various solid-state forms of celecoxib at different heating rates obtained using pin-holed aluminium pans: (a) celecoxib at a heatingrate of 5◦C/min, (b) celecoxib-amorphous at a heating rate of 5◦C/min, (c1) CEL-DMA at a heating rate of 10◦C/min, (c2) CEL-DMA at a heating rateof 5◦C/min, (c3) CEL-DMA at a heating rate of 1◦C/min, (d1) CEL-DMF at a heating rate of 10◦C/min, (d2) CEL-DMF at a heating rate of 5◦C/min,(d3) CEL-DMF at a heating rate of 1◦C/min.

308 G. Chawla et al. / European Journal of Pharmaceutical Sciences 20 (2003) 305–317
Fig. 3. TG curves of solvates of celecoxib along with DSC curves (at heating rate of 10◦C/min). TG has been done in aluminium crucibles at heatingrate of 10◦C/min: (a) CEL-DMA, (b) CEL-DMF.

G. Chawla et al. / European Journal of Pharmaceutical Sciences 20 (2003) 305–317 309
withdrawn at regular intervals and analyzed spectrophoto-metrically at 252 nm.
2.3.10. Measurement of flow propertiesBulk and tap density of samples was determined using
Electrolab tap density tester (ETD-1020, India). Accuratelyweighed samples of known volume were tapped 300, 500,and 750 times, and change in volume was noted. The bulkdensity, tap density, Carr’s index and Hausner ratio of dif-ferent solid-state forms of celecoxib were calculated.
2.3.11. Molecular modelingAll calculations were performed using Sybyl 6.8 (Tripos
Associates, Inc., 1699 S. Hanley, St. Louis, MI) installed onSGI octane2 system. The structure of celecoxib was obtainedby few alterations of X-ray crystal structure co-ordinatesof SC-558, extracted from 1CX2.pdb (Abola et al., 1987).The structures of solvent molecules, DMF and DMA, werebuilt. Celecoxib molecule was solvated with DMF and DMAmolecules using molecular silverware method. The chargeswere calculated using MMFF94 (Halgren, 1990). The sol-vated systems were then subjected to energy optimizationusing MMFF94 force field till the gradient convergence of0.05 kcal/mol was reached.
2.3.12. Accelerated stability studyThe various crystalline and amorphous products, packed
in polyethylene laminated aluminium foils of thickness0.04 mm, were stored under ICH specified accelerated sta-bility conditions of storage for zones III and IV at 40◦C/75%RH. Crystalline samples, packed in screw-capped glassvials, were also subjected to accelerated stability study atthese storage conditions in presence of light. The samples
Table 1The enthalpy values corresponding to endothermic peaks obtained by DSC, at different heating rates, for different solid-state forms of celecoxib
Sample Heating rate (◦C/min) Enthalpya (kJ/mol) Temperatureb (◦C) onset–peak–endset
Celecoxib 10 34.35 (90.07 J/g)c 160.79–161.80–164.64e
5 35.76 (93.77 J/g)c 161.42–162.55–164.36e
1 38.74 (101.59 J/g)c 162.87–163.50–164.11e
CEL-DMA 10 8.57 (98.32 J/g)d 147.92–149.78–152.68f
5 4.11 (47.20 J/g)d 140.28–141.63–142.97f
144.86–146.48–148.38f
1 2.90 (33.25 J/g)d 140.63–141.47–142.26f
142.45–142.91–144.57f
11.75 (30.82 J/g)c 160.10–160.63–161.39e
CEL-DMF 10 5.33 (61.19 J/g)d 99.71–102.10–106.77f
5 4.54 (62.05 J/g)d 99.80–101.92–106.69f
1 4.31 (58.90 J/g)d 98.89–101.72–103.97f
24.70 (64.77 J/g)c 154.87–162.68–164.13e
a Reported values are within±3 standard deviation.b Reported values are within±0.8 standard deviation.c Enthalpy of fusion.d Enthalpy of desolvation (sum of two desolvation peaks, in case of CEL-DMA).e Melting temperature.f Desovation temperature.
were characterized using thermal and spectroscopic meth-ods of analysis after 7, 15, 30, and 90 days.
3. Results and discussion
3.1. Solid-state screening: thermal methods
Crystalline celecoxib, quench cooled and solvent recrys-tallized products were initially characterized by DSC andTGA at heating rate of 10◦C/min for identification of anysolid-state alterations. DSC analysis of celecoxib (Fig. 2a)showed a single endothermic event of fusion in the temper-ature range of 160.79–164.64◦C (�Hf = 90.07 J/g). DSCanalysis of solvent recrystallized products exhibited curvessimilar to crystalline celecoxib with identical values of melt-ing points and heats of fusion, except for those obtained fromDMF and DMA. Products recrystallized from DMF (here-after mentioned as CEL-DMF) and DMA (hereafter men-tioned as CEL-DMA) showed a shift of endothermic peak tolower temperature values and absence of peak in the aboverange, indicating the possibility of polymorph and/or pseu-dopolymorph formation.
These solvent recrystallized products were also char-acterized by TGA for assessing any solvate formation.Only CEL-DMF and CEL-DMA, exhibited weight loss of16.082±0.4% (molar ratio 1.008), and 18.904±0.5% (mo-lar ratio 1.012), respectively. When compared with DSCcurves (Fig. 3), the TG curves of CEL-DMF and CEL-DMAconfirmed the endothermic event observed in DSC to cor-respond to desolvation, hence indicating solvate formationwith DMA and DMF. The experimentally determined per-centage weight loss values were in close agreement with

310 G. Chawla et al. / European Journal of Pharmaceutical Sciences 20 (2003) 305–317
theoretical values of 16.148 and 18.595% for CEL-DMFand CEL-DMA, respectively, representing a stoichiometryof nearly 1:1.
In order to trace the absence of melting endotherm inCEL-DMF and CEL-DMA at 10◦C/min, DSC analysis wasperformed at lower heating rates.Fig. 2c and dshows theDSC curves of CEL-DMA and CEL-DMF, respectively atdifferent heating rates. A single endothermic peak was ob-served at heating rate of 5◦C/min for CEL-DMF, whereasadditional endothermic events were observed at heating rateof 1◦C/min. The desolvation peak of CEL-DMA was ob-served to split into two at heating rate of 5◦C/min. This unre-solved peak reflects the coupling of two simultaneous events.First, the breaking of interactions such as hydrogen bondsbetween DMA and celecoxib molecules, and second cor-responding to desolvation, i.e. release of solvent moleculesfrom the crystal lattice.
A complete desolvation and transition to high meltingform was observed at a heating rate of 1◦C/min. CEL-DMAexhibited a recrystallization exothermic event after desol-vation, followed by sharp endothermic peak at 161◦C/mincorresponding to melting of crystalline form, into which ittransforms after loosing the solvent molecules. CEL-DMFalso showed a sharp melting endotherm at 161◦C, character-izing the transformation of solvate to its crystalline counter-part. No significant change was observed in the desolvationenthalpies and temperature of CEL-DMF, with the changein heating rates. CEL-DMA, on the other hand, showed anincrease in the enthalpy values with the increase in heat-ing rate. The enthalpy and melting ranges of celecoxib,CEL-DMF and CEL-DMA are enlisted inTable 1. In addi-tion, desolvation at higher temperature in CEL-DMA sug-gests relatively a stronger interactive force between DMAand celecoxib molecules and also greater compactness ofcrystal packing as compared to CEL-DMF.
Heating rates may greatly influence the kinetics and reso-lution of peaks in DSC curves (Giron, 1995). A high heatingrate may not provide sufficient time for recrystallization, andonly desolvation peak may be observed with the absenceof melting peak of stable form. The shifting of location ofthe endothermic peak to higher temperature in CEL-DMAand the absence of exothermic peak at higher heating ratesof 5 and 10◦C/min may be attributed to the time requiredfor desolvation. The higher the heating rate, the lower isthe time for desolvation to occur, which ultimately resultsin higher temperature for desolvation, and higher desolva-tion enthalpy (Behme et al., 1985). This is supported bythe fact that at slowest heating rate of 1◦C/min, exother-mic peak of recrystallization appeared suggesting desol-vation and recrystallization to high melting form beforemelting.
DSC thermogram of amorphous form (Fig. 2b) showedglass transition onset peak at 50.84 ± 0.08◦C followedby recrystallization exotherm at 98.81 ± 0.1◦C (�HC =51.70± 2 J/g) and a melting endotherm at 164.40± 0.2 ◦C(�Hf = 84.86± 4 J/g). The glass transition and recrystal-
lization events observed in DSC prove the amorphous natureof quench cooled product (Kakumanu and Bansal, 2002).DSC can also be used to determine the degree of crys-tallinity, structural relaxation and crystallization kinetics ofthe amorphous form of celecoxib, as reported previously(Kakumanu and Bansal, 2002). The greatest advantages of-fered by the amorphous system in terms of higher solubility,improved bioavailability and performance characteristicscan be attributed to its “excess properties” with respectto enthalpy, entropy, and free energy. The high degree of
Fig. 4. HSM photographs of CEL-DMF mounted in silicone oil: (a) platycrystals at ambient temperature, (b) escape of solvent seen as bubblesbetween 104 and 106◦C, (c) droplets of melt at 161–164◦C.

G. Chawla et al. / European Journal of Pharmaceutical Sciences 20 (2003) 305–317 311
molecular mobility in these high energy disordered systemsleads to their spontaneous reversion to the thermodynami-cally stable crystalline form. Glass transition temperature, atwhich the molecular mobility is restricted, is a characteris-tic of amorphous systems and helps to distinguish betweenthe amorphous and microcrystalline states (Yu, 2001).
Fig. 5. X-ray diffractograms of various solid-state forms of celecoxib: (a) celecoxib, (b) CEL-DMA, (c) CEL-DMF, (d) CEL-amorphous.
Thermal events of solid-state forms of celecoxib werealso determined with HSM, and were found to be in closeagreement with those obtained from DSC and TGA. Whenobserved in the presence of silicone oil, loss of solvent wasviewed as the generation of bubbles (between 140–146◦Cin CEL-DMA and 98–106◦C in CEL-DMF) from within the

312 G. Chawla et al. / European Journal of Pharmaceutical Sciences 20 (2003) 305–317
crystal lattice (Fig. 4). Desolvation upon heating involvesinitial molecular loosening at the solvent sites and rupture ofplate habit of celecoxib solvates to provide diffusion pathsfor escape of solvent molecules, and complete reorganiza-tion to needle habit of celecoxib which melt near 161◦C, asobserved in DSC endotherms. In the amorphous form, re-crystallization was seen as origination of needles at around85–90◦C, followed by melting at around 165–168◦C. Theamorphous product being a high energy disordered form, ex-periences a significant enhancement in molecular mobilityabove glass transition temperature leading to loss of energyin terms of an exothermic event corresponding to molec-ular rearrangement to low energy ordered crystalline form(Hancock and Zografi, 1997).
3.2. XRD
XRD is one of the most sensitive and a foolproof methodfor solid-state characterization as the results are obtaineddirectly from the molecular arrangements of the crystallinematerial (Chao and Vail, 1987). Fig. 5 shows the XRD pat-terns of solid-state forms of celecoxib. Crystalline forms ofcelecoxib showed sharp diffraction peaks. The crystal latticeparameters of celecoxib have been reported as:a = 10.136,b = 16.778, c = 5.066,α = 97.62, β = 100.65, andγ =95.95, with triclinic unit cells (Dev et al., 1999). XRD pat-
Fig. 6. SEM photographs of various solid-state forms of CEL: (a) CEL, (b) CEL-DMA, (c) CEL-DMF, (d) celecoxib-amorphous.
tern of each solvate was featured by a scattering peak uniqueto each form at a scattering angle (2θ) where no diffractionwas observed for the other form hence, permitting an un-ambiguous identification and distinction between them. Thedistinct differences in the diffraction patterns of celecoxib,CEL-DMA and CEL-DMF are attributed to modificationsin the arrangement of molecules in the crystal lattice. Onthe other hand, the XRD pattern of amorphous form was de-void of diffraction peaks and a halo pattern was observed,confirming the lack of three-dimensional long range orderedstructure.
3.3. Microscopy
Crystal morphology plays a valuable role in pharmaceu-tical processing and product development of solid dosageforms. Differences in crystal habit may strongly influencethe particle orientation, modify flowability, packing, com-paction, compressibility and dissolution characteristics of adrug powder. Solid–liquid interface interactions can alter theroundness of the interfaces, change crystal growth kineticsand enhance or inhibit growth at certain crystal faces, re-sulting in different habits (acicular, plates, tabular, bladed,prismatic, etc.) (Tiwary, 2001).
The morphological features of various solid-state formsof celecoxib were visually examined using light microscopy.

G. Chawla et al. / European Journal of Pharmaceutical Sciences 20 (2003) 305–317 313
The stable crystalline form of celecoxib occurs as fine nee-dles. On the other hand, both the solvate forms were foundto exhibit plate-like crystal habit. The irregularity in mor-phology substantiates the amorphous nature of the quenchcooled product.
SEM photographs (Fig. 6) showed a distinct differencein the morphology of different solid-states forms. Celecoxibconsisted of blunt-ended needle-shaped crystals. Plates ofCEL-DMF had smooth surface in contrast to the rough sur-faced CEL-DMA platy crystals. Amorphous form appearedas aggregates of irregularly shaped particles.
Celecoxib crystals were found to exist in polycrystallineform with parallel grain boundaries when observed undercross polarizers. The polycrystalline behavior was charac-terized by the appearance of multi-colored (green, blue,pink, and yellow) grains arranged in parallel fashion. Thesolvates also retained the polycrystalline nature but withirregularly arranged grains. Triclinic crystals of celecoxiband solvates exhibit optical anisotropy as they displayednumerous optical effects, produced birefringes and showedregular extinction of plane polarized light on each 90◦ ro-tation of microscope stage. On the contrary, absence ofbirefringes under polarized light showed the amorphousbehavior of quench cooled product.
3.4. FTIR spectroscopy
FTIR spectroscopy has been successfully used for ex-ploring the differences in molecular conformations, crystal
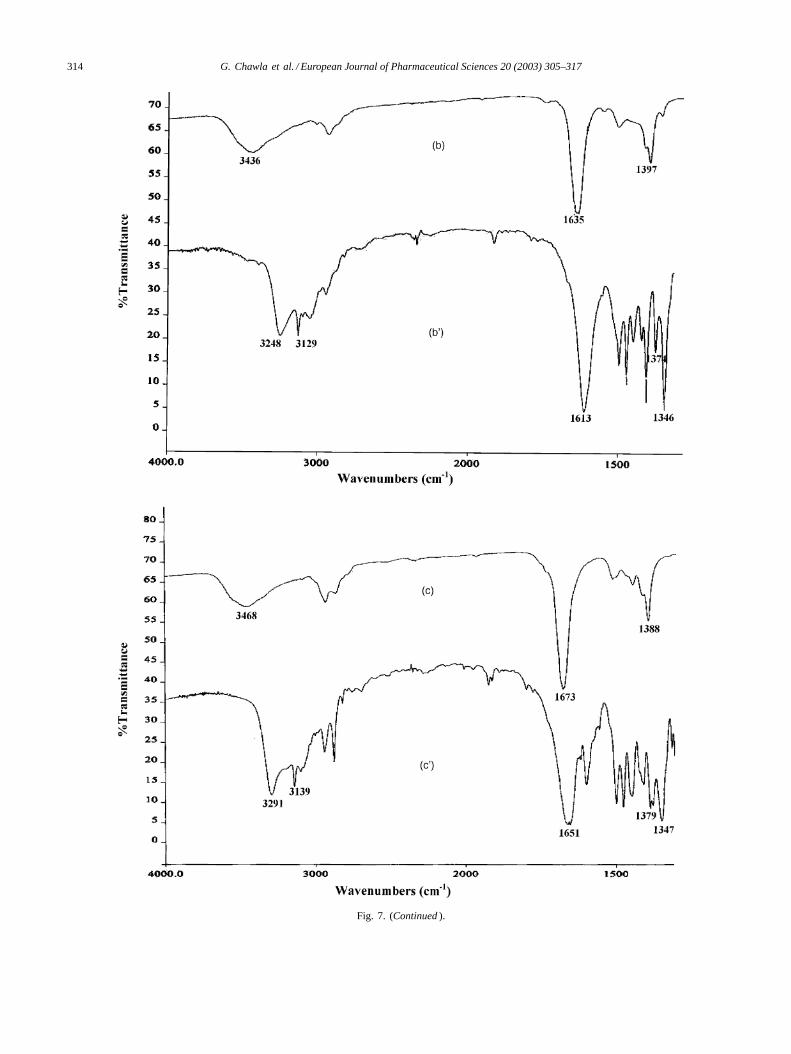
Fig. 7. IR spectra: (a) celecoxib, (b) DMA, (b′) CEL-DMA, (c) CEL-DMF, (c′) DMF, (d) celecoxib-amorphous.
packing and hydrogen bonding arrangements for differentsolid-state forms of an organic compound (Brittain, 1997).Spectral variations originate due to alteration in bondsthat exhibit characteristic vibrational frequencies, leadingto frequency shifts and splitting in absorption peaks. TheFTIR spectra of celecoxib (Fig. 7a) showed a characteris-tic S=O symmetric and asymmetric stretching at 1164 and1347 cm−1, respectively. Medium intensity bands at 3338and 3232 cm−1 were seen as a doublet, which are attributedto the N–H stretching vibration of –SO2NH2 group.
The C–N stretching band observed at 1397 and 1388 cm−1
for DMA and DMF (Fig. 7b and c′), respectively shiftedto lower frequencies of 1374 and 1379 cm−1 in CEL-DMAand CEL-DMF (Fig. 7b′ and c), respectively. Lowering offrequencies was also seen for C=O stretching bands from1635 to 1613 cm−1 in CEL-DMA (Fig. 7b′), and from 1673to 1651 cm−1 in CEL-DMF (Fig. 7c), as compared to neatsolvents. These shifts in frequencies indicate the possibilityof hydrogen bonding between the –C=O group of solventsand –NH2 group of sulfonamide moiety present in celecoxib.This hydrogen bonding leads to increase in negative chargeover oxygen atom caused by shift of� electrons of –C=Ogroup, resulting in the weakening of its double bond charac-ter (shown inScheme 1). Hydrogen bonding alters the forceconstant of C=O as well as C–N, thus altering the frequencyof stretching and bending vibrations.
The bands corresponding to N–H stretching of –NH2group became diffused and broadened in case of amorphousform as shown inFig. 7d, and also a shift to lower frequency
314 G. Chawla et al. / European Journal of Pharmaceutical Sciences 20 (2003) 305–317
Fig. 7. (Continued).

G. Chawla et al. / European Journal of Pharmaceutical Sciences 20 (2003) 305–317 315
Scheme 1.
(1339 cm−1) was observed in asymmetric stretching of –SO2group. This clearly indicates the participation of –NH2 and–SO2 groups in intermolecular hydrogen bonding betweencelecoxib molecules. The spatial arrangement of celecoxibmolecules in crystal lattice does not allow intermolecularhydrogen bonding which starts to occur once the orderlinessof crystalline lattice is disturbed by formation of amorphousform.
3.5. Elemental analysis
Results of elemental analysis are summarized inTable 2.These results agreed with the theoretical values for 1:1 stoi-chiometry as evidenced by TGA results and the molar ratios.
3.6. Solubility determination
Solubility determination is of vital importance for phar-maceutical compounds, especially BCS Class II drugs.CEL-DMA, CEL-DMF, and amorphous form gave higherpeak solubility values of 4.98±0.4�g/ml, 3.62±0.1�g/ml,and 4.66 ± 0.6�g/ml, respectively, as compared to3.56 ± 0.2�g/ml for higher melting crystalline form. In-clusion of organic solvents in the solvated form tends toincrease solubility and dissolution rate, presumably byweakening the crystalline lattice (Brittain and Grant, 1999).The amorphous form being the high energy state, due tolack of long range order, produces a greater molecularmobility and thermodynamic escaping tendency leading tofaster dissolution rates and higher solubility (Hancock andZografi, 1997).
The solvated and amorphous forms attained peak concen-trations within 15 min, but the initial solubility advantagewas lost and solubility values similar to the crystallineform were reached within 1 h for all the systems. This isa result of solvent-mediated transformation of solvates andamorphous form to the less soluble crystalline form. This
Table 2Percentage composition of different elements present in various solid-stateforms of celecoxib
Sample % Carbon % Nitrogen % Hydrogen % Sulphur
Celecoxib 53.61 (53.49)a 11.34 (11.01)a 3.89 (3.67)a 8.72 (8.39)a
CEL-DMA 53.83 (53.78)a 12.02 (11.95)a 4.93 (4.91)a 6.91 (6.83)a
CEL-DMF 52.39 (52.80)a 12.30 (12.30)a 4.81 (4.62)a 6.97 (7.04)a
a Theoretical values for 1:1 stoichiometry are given in parenthesis.
phenomenon was also visually observed under the micro-scope, as formation of needle-shaped crystals in presenceof water. Such solution-mediated phase transformationsdepend upon the solution phase to provide the mobilitynecessary to help molecules rearrange to the most stableform. After peak solubility is achieved, the system reachesa pseudoequilibrium state prior to conversion to the stableform. This rearrangement is caused due to the crystalliza-tion of stable solid, from its supersaturated solution, formeddue to dissolution of metastable form.
3.7. van’t Hoff plot
Plots of logarithmic values of peak concentration versusinverse of temperature resulted in superimposable curves ofcelecoxib and its solvates (Fig. 8). This is due to the transfor-mation of solvates back to the high melting needle-shapedcrystals in the presence of solvent. Hence, for such systems,where the solvates revert back to the stable form in the pres-ence of a solvent, equilibrium solubility and van’t Hoff plotscannot be used for their characterization.
3.8. Flow properties
The bulk density, tap density, Carr’s index, and Hausnerratio of various solid-state forms of celecoxib are enlisted
Fig. 8. van’t Hoff plots of celecoxib and its solvates.

316 G. Chawla et al. / European Journal of Pharmaceutical Sciences 20 (2003) 305–317
Table 3Density and other flow parameters of different solid-state forms of celecoxib
Sample Bulk density (g/ml) Tap density (g/ml) Carr’s index (%) Hausner ratio
Celecoxib 0.362± 0.04 0.517± 0.01 29.961± 1 1.428± 0.1CEL-DMA 0.564 ± 0.03 0.729± 0.03 22.542± 1 1.291± 0.1CEL-DMF 0.445± 0.04 0.645± 0.02 31.049± 1 1.450± 0.1Celecoxib-amorphous 0.475± 0.02 0.698± 0.02 31.964± 2 1.470± 0.1
in Table 3. The stable form existing as cohesive needlesshowed the poorest flow properties, though not much differ-ences were seen in the flowability of other forms. CEL-DMAshowed the best flowability which can further be enhancedby the addition of glidant.
3.9. Molecular modeling
Molecular modeling studies confirmed the hydrogenbonding between sulphonyl amino group of celecoxib andcarbonyl group of solvents (Fig. 9a and b), as observedby the shift in FTIR vibrational peaks of CEL-DMAand CEL-DMF. The solvation energies were found tobe −24.668 and−27.823 kcal/mol for CEL-DMA andCEL-DMF, respectively. The hydrogen bonding observedin solvated systems are: CEL-DMF: N–H· · · O 2.693 Å,H · · · O 1.679 Å and CEL-DMA: N–H· · · O 2.725 Å,H · · · O 1.723 Å.
3.10. Accelerated stability study
Crystalline samples stored at 40◦C/75% RH showed nochange in morphology, desolvation, and melting behaviors,
Fig. 9. Stereoview of celecoxib solvates: (a) CEL-DMA solvated model, (b) CEL-DMF solvated model. Celecoxib and solvent molecule in the solvateis represented by ball and stick model. The dotted line (encircled) represents the hydrogen bonding between the carbonyl group of solvent and aminogroup of sulfonamide moiety of celecoxib.
when viewed under hot stage microscope. CEL-DMA andCEL-DMF lost solvent molecules at about 141–148◦Cand 98–100◦C, respectively, and transformed back toneedle-shaped crystals that melt near 160–162◦C, as incase of freshly prepared samples. Thermal analysis ofCEL-DMA and CEL-DMF samples stored for 3 monthsshowed desolvation endotherms at 147.73±0.5◦C (�HD =68.83± 3 J/g) and 102.6 ± 0.3◦C (�HD = 61.61± 4 J/g),respectively. Also, samples were found to be stable un-der accelerated stability conditions of storage in presenceof light.
The transition behavior of amorphous form was alsoinvestigated since, it is a metastable state and might crys-tallize during storage. The amorphous sample was found torevert back to the crystalline form within 7 days of storageunder accelerated stability conditions. This transformationwas viewed as the absence of glass transition and crystal-lization exotherm (characteristic for amorphous systems)from DSC, and appearance of only a sharp endothermicpeak (�HC = 92.09 ± 2 J/g) which corresponded to themelting of crystalline form. FTIR spectra of these samplesalso showed the reappearance of N–H stretching doublet at3236 and 3346 cm−1 unique to the crystalline form.

G. Chawla et al. / European Journal of Pharmaceutical Sciences 20 (2003) 305–317 317
4. Conclusion
Celecoxib was found to form solvates with DMA andDMF in 1:1 stoichiometric ratio. Quench cooling of the meltresulted in the generation of amorphous form. The solvatesexhibited plate-like crystal habit in contrast to needle-likecrystal habit of the stable form, with polycrystalline behav-ior. The X-ray diffractograms and FTIR absorption spectraof the crystalline and amorphous forms also differed dis-tinctively. The absence of peaks in X-ray diffractogramsand the irregular morphology of the quench cooled prod-uct inferred its disorderliness. The desolvation peak in DSCcurves, weight loss in TGA and generation of bubbles inHSM further confirmed the existence of solvent in the crystallattice. Elemental analysis and molecular modeling studiesconfirmed the molar ratio and the bond formation of solventmolecules with the drug. Recrystallization of the amorphousform was observed in DSC and HSM. The higher aqueoussolubility of solvates and amorphous forms indicate the use-fulness of solid-state manipulation as a tool to overcomebiopharmaceutical hurdles in drug delivery. The solubilitybenefits from the amorphous form can be exploited if it canbe “stabilized” against reversion to stable crystalline form.Further, the thermodynamics of these solid-state forms canprovide a greater insight into their physical stability and fea-sibility for formulation development.
Acknowledgements
The authors thank Ranbaxy Research Laboratories, Gur-gaon, India, for providing the celecoxib sample. Servicesprovided by Central Instrumentation Laboratory, NIPER,India, and Regional Sophisticated Instrumentation Centre,Punjab University, India are gratefully acknowledged.
References
Abola, E.E., Berstein, F.C., Bryant, S.H., Koetzle, T.F., Weng, J., 1987.Protein data bank, crystallographic databases—information content,
software systems, scientific applications. In: Allen, F.H., Berjerhoff,G., Sievers, R. (Eds.), Data Commission of the International Unionof Crystallography. Bonn, pp. 171–200.
Anonymous, 2001. 50 top selling drugs ranked by worldwide sales for2000, Patent scan—a monthly proactive patents bulletin for pharma-ceutical industry. Med. Ad News 2 (12).
Behme, R.J., Brooke, D., Farney, R.F., Kensler, T.T., 1985. Characteriza-tion of polymorphism of gepirone hydrochloride. J. Pharm. Sci. 74,1041–1046.
Brittain, H., 1997. Spectral methods for the characterization of polymorphsand solvates. J. Pharm. Sci. 86, 405–412.
Brittain, H., Fiese, E., 1999. Effects of pharmaceutical processing on drugpolymorphs and solvates. In: Swarbrick, J. (Ed.), Polymorphism inPharmaceutical Solids. Marcel Dekker, New York, pp. 331–365.
Brittain, H.G., Grant, D.J.W., 1999. Effects of polymorphism andsolid-state solvation on solubility and dissolution rate. In: Swarbrick,J. (Ed.), Polymorphism in Pharmaceutical Solids. Marcel Dekker, NewYork, pp. 279–330.
Chao, R.S., Vail, K.C., 1987. Polymorphism of 1,2-dihydro-6-neopentyl-2-oxonicotinic acid: characterization, interconversion, and quantitation.Pharm. Res. 4, 429–432.
Clemett, D., Goa, K.L., 2000. Celecoxib a review of its use in osteoarthri-tis, rheumatoid arthritis and acute pain. Drugs 59, 957–980.
Dev, R.V., Rekha, K.S., Vyas, K., Mohanti, S.B., Kumar, P.R., Reddy,G.O., 1999. Celecoxib, a COX-II inhibitor. Acta Cryst. C55.
Giron, D., 1995. Thermal analysis and calorimetric methods in the char-acterization of polymorphs and solvates. Thermochim. Acta 248, 1–59.
Halgren, T., 1990. MOMEC force field parameters. J. Am. Chem. Soc.112, 4710–4725.
Hancock, B., Zografi, G., 1997. Characterization and significance of theamorphous state in pharmaceutical systems. J. Pharm. Sci. 86, 1–12.
Jozwiakowski, M., 2000. Alteration of the solid state of the drug sub-stance: polymorphs, solvates, and amorphous forms. In: Liu, R.(Ed.), Water Insoluble Drug Formulation. Interpharm Press, Colorado,pp. 525–562.
Kakumanu, V., Bansal, A., 2002. Enthalpy relaxation studies of celecoxibamorphous mixtures. Pharm. Res. 19, 1873–1878.
Leonard, F., Patricia, M., 2001. Polymorphic crystalline forms of cele-coxib. WO 01/42222 A1.
Paulson, S., Vaughn, M., Jessen, S., Lawal, Y., Gresk, C., Yan, B., Maziasz,T., Cook, C., Karim, A., 2001. Pharmacokinetics of celecoxib afteroral administration in dogs and humans: effect of food and site ofabsorption. J. Pharmacol. Exp. Ther. 297, 638–645.
Tiwary, A.K., 2001. Modification of crystal habit and its role in dosageform performance. Drug Dev. Ind. Pharm. 27, 699–709.
Yu, L., 2001. Amorphous pharmaceutical solids: preparation, characteri-zation and stabilization. Adv. Drug Del. Rev. 48, 27–42.