characterization of prune and walnut orchard soils...
TRANSCRIPT
CHARACTERIZATION OF PRUNE AND WALNUT ORCHARD SOILSFOR WATER INFILTRATION IMPROVEMENT POTENTIAL
Michael J. Singer, John R. Munn Jr., William E. Wildman
ABSTRACT
Characterization of nine soils from the Sacramento and San Joaquin Valleycontinued in 1982. Particle size distribution, pH, organic carbon,extractable bases, acidity, cation exchange capacity, liquid limit, plasticlimit, saturation moistur~ percentage, electrical conductivity of thez+ 2+ + + - - -sa~uration _ extra~~, Ca 2.1 Mg, Na, K, HC03, Cl, F,NO, N03, P04, S04 concentrations' in tne saturationextract, ana quantitative clay mineralogy were determined for the nine soils.
Percentage base saturation, exchangeable sodium percentage, sodium adsorptionratio, and plastic index were calculated. Additional characterization dataare being collected.
Preliminary data analysis indicates a range of physical, chemical, andmineralogical properties for the different soils which may be related to slowwater penetration. For example, the Wyman soil has 0.54% organic carbon, 4.8%exchangeable sodium, low total clay content and low expanding claypercentages. These characteristics increase the likelihood of breakdown of
surface structure with subsequent crusting and surface sealing when highquality water is used for irrigation. This problem can be partiallyalleviated by adding organic matter or soluble salts to the soil to improveaggregate stability and to decrease the influence of sodium.
Results from an infiltration trial on the Wyman soil in Yuba County wherephosphogypsum at a rate of 1650 lbs/ac was added to improve water infiltrationshowed that the plots with gypsum had infiltration rates of 0.08 in/hrcompared to 0.07 in/hr for untreated plots. In this case, the rate of gypsumapplication was apparently too low to substantially improve water penetration.
OBJECTIVES
1. To collect samples of important prune and walnut orchard soils, with andwithout water infiltration problems, and determine for these, the physical andchemical characteristics that contribute most to surface sealing, soil com-paction, and slow water infiltration, taking into consideration the inter-action of these characteristics with various irrigation water qualities.
2. To develop criteria for predicting the likelihood of improving waterinfiltration in these orchard soils by use of the following practices: (a) achange in irrigation management or method; (b) clean cultivation vs. annual
cover crop or permanent sod; (c) ripping or slip plowing between trees;(d) applying amendments to the soil or irrigation water.
PROCEDURES
Laboratory: Soil physical, chemical, and mineralogical characteristics whichmay influence aggregate stability and water penetration were selected fordetermination by standard laboratory methods.
102
--- ---

Field: On June 30 and July 1, 1982, a six plot trial of phosphogypsum as apossible amendment was established on the Fred Shaeffer ranch in Yuba County.The six contiguous plots were in a portion of a mature prune orchard. Eachplot was 9 x 3 trees (0.18 ac). Each of three plots was treated with 300pounds (165b 1bs/ac) of phosphogypsum prior to an irrigation. Irrigationwater was applied by flooding the plots for 3~ hours. Water depth wasmeasured at various times over the following 22~ hours. An initial infiltra-tion rate, and a final percolation rate was calculated for each plot.
RESULTS AND CONCLUSIONS
Laboratory: Particle size distribution for the nine test soils indicates thatall of the soils are medium to coarse textured (Table 1). Only two, theVerna1is and Yolo have over 20% clay. All but the Wyman have over 30% silt,and all but Wyman and Ryer have over 35% silt. Each soil has a unique sandfraction distribution. At the extremes are the Columbia soil with 53.4 of thesand fraction as fine and very fine sand and Wyman with ~4. 4% of the sandfraction as coarse and very coarse sand. The significanct:: of particle sizedistribution on water penetration is not clear because several of the soilswith quite different particle size distributions appear to have similarinfiltration rates.
The chemical characteristics of the nine soils are more uniform than theparticle size distribution,but some apparent differencesdo exist among thesoils (Table 2, 3, 4). Organic carbon is less than 1% in six of the nine.Note that the Wyman soil from the Shaeffer ranch is lowest of all. Pooraggregate stabili ty is often equated with low organic carbon content. Theonly other data from Table 1 which are notable at this time are the 4.5 and4.8 percent exchangeable sodium percentages (ESP) values of the Sorrento andWyman soils. These values are well below the 15% considered high by theU.S. Salinity Laboratory, but they are at a level which could lead to claydispersion in orchards where high quality irrigationwater is used and thesoil has a low ability to release soluble salts. Sodium content is alsoreflected in the SAR of the saturation extract of the Wyman soil (Table 3).
Atterberg limits are the only "physical" properties measured thus far. Theseengineering test data are useful as an index of the moisture content over
which the soils will be susceptible to compaction (Plastic index) and themoisture content at which the soil loses most of its ability to support loads.Thus the Wyman, although plastic over a very small range of moisture contents,
loses strength at a low moisture content and is thus susceptible to severecompaction problems when wet.
Tables 5 and 6 summarize the clay mineralogydata for the soils. We have notcompleted the interpretation of these data in terms of the mechanisms throughwhich the clays may affect crusting and sealing. It is clear that the soilsdiffer in their qualitative(Table5) and quantitative (Table 6) clay miner-alogy. Two examples are sufficient to illustrate the diversity and possibleimportance of the clay mineralogy to the problem of water penetration.
The Verna1is soil has a large proportion of smectite and intergrade clayminerals which will shrink and swell with changingwater content,thus formingaggregates and, when dry, cracks, that allow some water penetration. In
103
- ---

contrast, the San Joaquin soil is dominated by non-expanding, Kaolin clayminerals that do not readily form soil aggregates or surface cracks.-
Additional work is required to complete the characterization of the soils and
interpretation of the data. Part of the characterization that is needed is a
quantitative measurement of salt release and crust formation in these soils.
Field: There was a large increase in initial water penetration rate for thegypsum plots compared to the control plots (Table 7). The final w~terpenetration rates were only slightly different. Two factors may help toexplain these results. First, previous work by Bill Wildman showed that theripping done at this site in past years to break up a well developed plowpanquickly lost effectiveness. Thus some of the reason for slow waterpenetration may be subsoil density. Second, the laboratory data indicate alow salt release relative to exchangeable sodium percentage for this Wymansoil. The rate of phosphogypsumapplication (1650 lbs/ac) may have simplybeen to low to show a positive effect on infiltration rates.
In the future, laboratory studies to determine the appropriate amendmentrates, and field studies to determine the effect of deep ripping will help tosolve the problem of slow water infiltration in California Prune and WalnutOrchards.
pjl:12/6/82dw
104
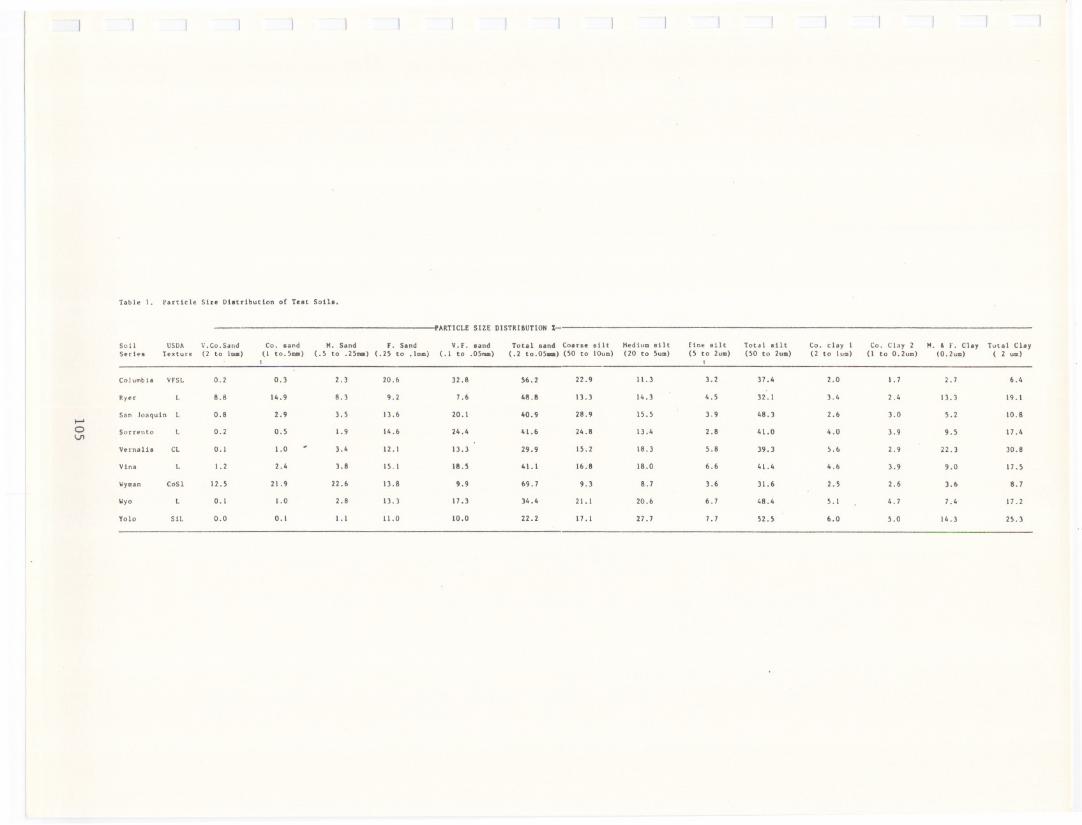
table I. Particle She D18tr1butlon of te.t Sotl..
'ARTICLE SIZE DISTRIBUTION1-
5011 USDA V.Co.Sand Co. .and H. Sand F. Sand V.f. .and Toul ..nel Coarse silt Hedina 81It fine 8ilt toul stlt Co. clay 1 Co. Clay 2 N. & r. Clay Tvt.l ChySeri. TeJl:ture (2 to 1_) (I to. ....) (. to .2...) (.2 to .1...) (.1 to .O_) (.2 to.O_) (O to 10um) (20 to um) ( to 2U8) (O to 2uII) (2 to lUll) (I to 0.2uII) (0.2U8) ( 2 um)
I t
Columbi. vrSL 0.2 0.3 2.3 20.6 32.8 6.2 22.9 11.3 3.2 37.4 2.0 1.7 2.7 6.4
Ryer L 8.8 14.9 B.3 9.2 7.6 48.8 13.3 14.3 4 . 32.1 3.4 2.4 13.3 19.1
San Joaquin L 0.8 2.9 3. 13.6 20.1 40.9 28.9 I. 3.9 48.3 2.6 3.0 .2 10.Bto-'0 Sorrnto L 0.2 O. 1.9 14.6 24.& 41.6 24.8 13.4 2.8 41.0 4.0 3.9 9. 17.4VI
Vernal1s CL 0.1 1.0 # 3.4 12.1 13.3 29.9 I. 2 18.3 .8 39.3 .6 2.9 22.3 30.8
Vine L 1.2 2.4 3.8 I. I 18. 41.1 16.8 18.0 6.6 41.4 4.6 3.9 9.0 17 .
WYllan CoSI 12 . 21.9 22.6 13.8 9.9 69.7 9.3 B.7 3.6 31.6 2. 2.6 3.6 8.7
Wyo L 0.1 1.0 2.B 13.3 17.3 34.4 21.1 20.6 6.7 48.4 .I 4.7 7.4 17. 2
Yolo SlL 0.0 0.1 1.1 11.0 10.0 22.2 17.1 27.7 7.7 2. 6.0 5.0 14 .3 2. 3

Table 2. Organic Carbon, Extractable Cations and Acidity, Cation Exchange Capacity, Base Saturation,Exchangeable Sodium Percentage and pH for the Test Soils.
Extractable Cations & Acidity
Ca Mg K Na Acidity EC+EA CEC *Soil OC meq/ meq/ meq/ meq/ meq/ meq/ meq/ Base ESP pH pHSeries % 100g 100g 100g 100g 100g 100g 100g Sat. (%) (%) Sat.Paste 1:1
Columbia 0.92 5.7 3.7 0.63 0.33 1.6 12.0 11.7 89 2.8 6.8 6.54
Ryer 0.79 7.9 2.8 0.97 0.32 2.4 14.4 14.5 83 2.2 6.7 6.62
San Joaquin 0.98 3.4 0.81 0.52 0.22 3.6 8.6 8.6 58 2.6 5.5 5.70
0 Sorrento 0.97 11.2 3.8 0.97 0.81 2.0 16.8 18.0 93 4.5 6.7 6.48(J\
Verna1is 0.70 14.4 6.9 1.0 0.79 1.5 24.6 25.1 93 3.1 6.95 6.91
Vina 1.78 13.4 5.3 1.3 0.30 5.1 25.4 27.4 74 1.1 6.65 6.51
Wyman 0.54 3.4 1.5 1.0 0.43 2.8 9.1 9.0 70 4.8 6.6 6.70
Wyo 2.12 12.1 3.6 0.80 0.17 2.7 16.7 20.0 83 0.8 7.0 6.70
Yolo 1.54 13.4 8.3 1.3 0.45 2.1 25.6 26.4 890 1.7 7.1 7.10-* sum of cationsPercentage base saturation = CEC x 100

Table 3. Chemistry of the Saturation Extract Solution for the Nine Test So11s.
Solution Cations Solution Anions
WaterECI
++ Tota 1PO -3 SO -7
rotl
5011 Content++ + ++
IICO - - -NO - NO - Anions SARCa Hg K Na Ca t ions CI F
Series 1; (mmhos/cm) (meq/l) (meq!1) (meq/l) (me'll 1) (meq!1) (meqh) (meq/l) (meq/l) (meqh) (meq1t) (mcqll) (me/l) (m.q/l)
Columbia 32 0.33 1.2 1.0 0.3 0,3 2.8 1.2 0.2 0.1 0.0 0.0 0.6 0.7 2.8 0.29
Rycr 32 1.6, 8.9 5.2 0.8 1.4 16.3 3.0 0.6 0.4 0.0 0.0 4.8 4.3 13. I 0.53
.....Sn Joaquin 29 2.2 10.9 5.2 2.0 2.4 18.5 1.2 0.2 0.0 1.0 0.0 15.0 2.1 19.5 0.25
0-...J
S(lrrento 35 4.5 31.9 18.0 1.3 9.3 60.5 2.4 7.3 0.8 2.0 0.0 6.8 43.5 62.11 1.86
V..rna 11s 42 1.35 4.6 3.5 0.3 3.1 11.5 2.5 2.6 0.4 2.2 0.0 3.0 4.2 14.9 I. 54
\'ina 41 0.38 1.4 1.3 0.4 0.6 4.0 2.4 0.2 0.1 0.1 0.6 . 0.2 1.0 4.6 0.52
Wym.ln 24 0.55 0.6 0.5 0.4 2.4 3.9 1.9 1.7 0.4 0.0 0.0 1.2 2.0 7.2 3.24
Wyo 39 0.68 4.4 2.8 0.2 0.7 8.1 6.1 0.4 0.1 0.0 0.0 0 0.6 7.2 0.19
\",.10 43 0.48 1.4 1.7 0.2 1.6 4.9 3.1 0.4 0.1 0.0 0.0 0 0.8 4.4 I. 29
IElcctriralconductivity

108
Table 4. Atterberg Limits of the Nine Test Soils.
Atterberg Limits
Soil Liquid Plastic PlasticSeries Limit Limit Index
Columbia 25.9 28.6 NP
Ryer 25.9 17.0 8.9
San Joaquin 19.9 20.2 NP
Sorrento 24.0 20.0 4.0
Verna1is 32.6 19.6 13.0
Vina 28.3 24.1 4.3
Wyman 18.5 17.9 0.6
Wyo 27.8 23.0 4.8
Yolo 34.0 24.2 9.8

Table S. Summary of X-Ray Diffraction Analyses, 2.0 ~m Fraction.
*Soil Series/Mineral Abundance
Mineral Columbia Ryer San Joaquin Sorrento Vernalis Vina Wyman Wyo Yolo
Kaolin +++ ++ +++ +++ ++ ++ +++ +++ ++
Mica ++ ++ ++ ++ ++ ++ ++ ++
Vermiculites +++ ++ +++ +++ ++ ++
Smectites ++ +++ +++ ++++ ++++ ++ +++
Chlorite +++ ++ ++ ++
.....0
Chlorite-Vermiculite Intergrade ? ? ? ? ? ? ?\0
Chlorite-Smectite Intergrade ? ++ ++ +++ ? ? ?
Undifferentiated Intergrades ++ ++ ++ +++ ++ ++ +++
Chlorite-Vermiculite Interstratified ++ ? ? ++
Chlorite-Smectite Interstratified ? ? ++
Vermiculite-Smectite Interstratified ? ?
Mica-Vermiculite Interstratified
Undifferentiated Interstratified ++ ++
*Relative Abundance: ++ = presence apparent, ++++ = presence dominates other peaks,? = can't specifically differentiate.

Table 6. Summary of Quantitative Clay Mineralogy.
Soil Series
*Clay Components (%)
Vermiculite Smectite Non-Exp.
*Whole Soil (%)
Vermiculite Smectite Non-Exp.
110

Table 7. A Comparison of Initial and Final Water Penetration Rates from a
Field Trial on the Wyman Soil.
111
Plot No. Treatment Initial Final
1 Gypsum 0.22 0.08
2 Control 0.09 0.06
3 Control 0.15 0.08
4 Gypsum 0.12 0.07
5 Gypsum 0.19 0.08
*6 Control 0.08-
Mean Gypsum 0.18 0.08
Values Control 0.12 0.07
*not measured