characterization of preexisting mage-a3-specific … of preexisting mage-a3-specific cd4 t cells...
TRANSCRIPT

of June 13, 2018.This information is current as
Activation by Protein VaccinationPatients and Healthy Individuals and Their
T Cells in Cancer+MAGE-A3-Specific CD4Characterization of Preexisting
and Sacha GnjaticTakemasa Tsuji, Nasser K. Altorki, Gerd Ritter, Lloyd J. Old
http://www.jimmunol.org/content/183/7/4800doi: 10.4049/jimmunol.0900903September 2009;
2009; 183:4800-4808; Prepublished online 4J Immunol
MaterialSupplementary
3.DC1http://www.jimmunol.org/content/suppl/2009/09/04/jimmunol.090090
Referenceshttp://www.jimmunol.org/content/183/7/4800.full#ref-list-1
, 20 of which you can access for free at: cites 34 articlesThis article
average*
4 weeks from acceptance to publicationFast Publication! •
Every submission reviewed by practicing scientistsNo Triage! •
from submission to initial decisionRapid Reviews! 30 days* •
Submit online. ?The JIWhy
Subscriptionhttp://jimmunol.org/subscription
is online at: The Journal of ImmunologyInformation about subscribing to
Permissionshttp://www.aai.org/About/Publications/JI/copyright.htmlSubmit copyright permission requests at:
Email Alertshttp://jimmunol.org/alertsReceive free email-alerts when new articles cite this article. Sign up at:
Print ISSN: 0022-1767 Online ISSN: 1550-6606. Immunologists, Inc. All rights reserved.Copyright © 2009 by The American Association of1451 Rockville Pike, Suite 650, Rockville, MD 20852The American Association of Immunologists, Inc.,
is published twice each month byThe Journal of Immunology
by guest on June 13, 2018http://w
ww
.jimm
unol.org/D
ownloaded from
by guest on June 13, 2018
http://ww
w.jim
munol.org/
Dow
nloaded from
Characterization of Preexisting MAGE-A3-Specific CD4� TCells in Cancer Patients and Healthy Individuals and TheirActivation by Protein Vaccination1
Takemasa Tsuji,* Nasser K. Altorki,† Gerd Ritter,* Lloyd J. Old,* and Sacha Gnjatic2*
Vaccination with cancer/testis Ag MAGE-A3 in the form of recombinant protein often induces specific humoral and cellularimmune responses. Although Ag-specific CD4� T cells following vaccination are detectable by cytokine production after a singlein vitro stimulation, their detection before vaccination is difficult because of low frequency. In this study, we have applied asensitive method using CD154 (CD40L) staining to detect MAGE-A3-specific CD4� T cells. MAGE-A3-specific T cell responseswere analyzed in four healthy donors, two lung cancer patients with spontaneous serum Abs to MAGE-A3, and two baselineseronegative lung cancer patients throughout vaccination with MAGE-A3 protein. MAGE-A3-specific CD4� T cells were detectedin all individuals tested, at low frequency in healthy donors and seronegative cancer patients and higher frequency in patientsseropositive for MAGE-A3. Polyclonal expansion of CD154-expressing CD4� T cells after cell sorting generated a large numberof MAGE-A3-specific CD4� T cell lines from all individuals tested, enabling full characterization of peptide specificity, HLA-restriction, and avidity. Application of this method to cancer patients vaccinated with MAGE-A3 protein with or without adjuvantrevealed that protein vaccination induced oligoclonal activation of MAGE-A3-specific CD4� T cells. It appeared that MAGE-A3protein vaccination in the presence of adjuvant selectively expanded high avidity CD4� T cells, whereas high avidity T cellsdisappeared after multiple vaccinations with MAGE-A3 protein alone. The Journal of Immunology, 2009, 183: 4800–4808.
C ertain tumor Ags are known to frequently induce spon-taneous immune responses in cancer patients who haveAg-expressing tumors but not in patients with Ag-nega-
tive tumors or healthy individuals (1–4). In addition, vaccinationwith various forms of tumor Ags successfully induced humoraland cellular immune responses, even in patients who had no spon-taneous immunity against the Ag (5–7). Such spontaneous andvaccine-induced tumor Ag-specific T cells were detectable after invitro stimulation (presensitization) with synthetic Ag peptides orother forms of Ags, such as recombinant viral vectors or proteins.In contrast, detection of tumor Ag-specific T cells in patients with-out spontaneous immunity before vaccination or in healthy indi-viduals is difficult because of low frequency and/or suppression byregulatory T cells (8–11). In general, multiple stimulations of Tcells from healthy donors with tumor Ag-loaded dendritic cells(DC)3 are required to induce tumor Ag-specific T cells (12). How-ever, this method is not always applicable to cancer patients be-
cause of the requirement of large numbers of PBMC to generateDC. In addition, multiple stimulations by DC could induce a clonalexpansion of a rare tumor Ag-specific T cell not representative ofthe donor’s T cell precursors against the Ag.
MAGE-A3 is a cancer/testis Ag with expression in normal tis-sues limited to testis but that shows high level of expression invarious types of tumor (13). Because of its high expression in awide array of tumor types, MAGE-A3 is an attractive target forcancer vaccines. Furthermore, MAGE-A3 has been shown to beimmunogenic and induce specific T cell responses. SpontaneousCD4� T cell responses against MAGE-A3 in melanoma patientswere detectable after two consecutive stimulations of CD4� Tcells with selected MAGE-A3 peptides by proliferative responseand cytokine release against the peptides (14). Interestingly, five ofeight responders indicated MAGE-A3-specific IL-5 production, incontrast to two of eight responders that showed IFN-� production,indicating that MAGE-A3-specific CD4� T cells were differenti-ated to Th2 in advanced melanoma patients in vivo. MAGE-A3-specific T cell responses in healthy donors were also reported andsignificant MAGE-A3-specific proliferative response over back-ground proliferation required four to six weekly stimulations (15).We and others have reported the results of immunomonitoring can-cer patients who received MAGE-A3 protein with or without ad-juvant AS02B, a formulation of saponin QS21 and monophospho-lipid A (16–18). None of the non-small cell lung cancer patientsenrolled in the study showed significant spontaneous humoral orcellular immune responses before vaccination (16, 17). However,significant humoral and CD4� T cell responses were developedafter a single presensitization in most patients who were vacci-nated with MAGE-A3 and AS02B. In contrast, most of patientsvaccinated with MAGE-A3 protein alone showed no immune re-sponses against the Ag. We also found a striking difference in theinduction of immune responses after the second course of vacci-nation with MAGE-A3 with AS02B to both groups of patients(17). Patients first vaccinated with MAGE-A3 protein alone failed
*Ludwig Institute for Cancer Research, New York Branch at Memorial Sloan-Ket-tering Cancer Center, New York, NY 10065; and †Presbyterian Hospital, Division ofThoracic Surgery, Weill Medical College of Cornell University, New York, NY10065
Received for publication March 23, 2009. Accepted for publication July 22, 2009.
The costs of publication of this article were defrayed in part by the payment of pagecharges. This article must therefore be hereby marked advertisement in accordancewith 18 U.S.C. Section 1734 solely to indicate this fact.1 This work was supported in part by the Cancer Vaccine Collaborative, funded byCancer Research Institute and Ludwig Institute for Cancer Research.2 Address correspondence and reprint requests to Dr. Sacha Gnjatic, Ludwig Institutefor Cancer Research, New York Branch, Memorial Sloan-Kettering Cancer Center,1275 York Avenue, Box 32, New York, NY 10065. E-mail address: [email protected] Abbreviation used in this paper: DC, dendritic cells; EBV-B cells, EBV-transformedB cells; ICCS, intracellular cytokine staining; T-APC, PHA-activated CD4� T anti-gen presenting cells.
Copyright © 2009 by The American Association of Immunologists, Inc. 0022-1767/09/$2.00
The Journal of Immunology
www.jimmunol.org/cgi/doi/10.4049/jimmunol.0900903
by guest on June 13, 2018http://w
ww
.jimm
unol.org/D
ownloaded from

to respond to the second course of vaccination with MAGE-A3protein with the adjuvant whereas patients who had previouslyreceived MAGE-A3 with AS02B continuously responded to thevaccines. It is very important to investigate the detailed character-istics of MAGE-A3-specific immune responses in both groups ofpatients to explain the different induction of immune responsesdepending on the adjuvant. However, a more sensitive assay toanalyze specific T cell responses has to be developed because lowfrequency of MAGE-A3-specific CD4� T cells prevents detailedanalyses, especially in patients first vaccinated with MAGE-A3protein alone.
The main objective of this study was to establish a protocol tofully characterize low frequency tumor Ag-specific CD4� T cells,such as those in healthy donors and seronegative cancer patientsbefore vaccination. Such information is considered to be very im-portant to understand the effect of vaccination by comparison withthat of vaccine-induced CD4� T cells. Recently, Ag-specificCD4� T cells were shown to be detected by CD154 expression. Inaddition, using this method, Ag-specific T cells were able to beisolated by cell sorting. In the present study, we have applied thissensitive method to detect low-frequency tumor Ag-specific CD4�
T cells in cancer patients or healthy donors who showed no spon-taneous immune responses against the Ag in conventional immu-nomonitoring assays. Using this method, MAGE-A3-specificCD4� T cells were detected and fully characterized in four healthydonors and four cancer patients, two with spontaneous Ab re-sponse to MAGE-A3 and two seronegative. In addition, CD4� Tcells before vaccination were characterized and compared withspecific CD4� T cells observed after vaccination in the two sero-negative cancer patients. It was found that MAGE-A3 protein, es-pecially when formulated in AS02B, efficiently stimulated somepreexisting CD4� T cells and also induced newly elicited MAGE-A3-specific CD4� T cells. By using this method, it was also pos-sible to compare peptide specificities, avidity, and their HLA-re-strictions for all MAGE-A3-specific CD4� T cells detected beforeand after vaccination.
Materials and MethodsPatient and donor samples
Non-small cell lung cancer patients undergoing surgery at New York Pres-byterian Hospital (New York, NY) consented to participate in a clinicalstudy, LUD1999–010, sponsored by the Ludwig Institute for Cancer Re-search (16, 17). PBMC samples collected throughout the study from tworepresentative patients, WS07 and GO17, were used in the current study.WS07 and GO17 had stage IIB (T2N1M0) squamous carcinoma and stageIB (T2N0M0) adenocarcinoma, respectively, and both patients were male.Additionally, PBMC and serum specimens were collected with informedconsent from non-small cell lung cancer patients under a protocol approvedby the Institutional Review Board of Weill Medical College of CornellUniversity, and samples from two patients spontaneously seropositive forMAGE-A3, LU-649, and LU-729 were used in the current study. Samplesfrom healthy donors with no history of autoimmune disease were collectedwith informed consent at the New York Blood Center, and PBMC fromfour individuals, NC173, NC193, NC229, and NC236, were used in thecurrent study.
In vitro sensitization (presensitization)
PBMC were collected from peripheral blood using Ficoll gradient andstored in liquid nitrogen. CD4� and CD8� T cells were isolated fromtypically 1 � 107 PBMC by using Dynabeads (Invitrogen). In some ex-periments, CD4� T cells were further separated into CD45RA� andCD45RO� T cells by CD45RO beads (Miltenyi Biotec). Remaining Tcell-depleted PBMC were pulsed overnight with overlapping peptides forMAGE-A3 and were irradiated. CD4� T cells (5 � 105) were stimulatedby peptide-pulsed and irradiated T cell-depleted PBMC (1 � 106) in 96-well round-bottom plate in RPMI 1640 medium supplemented with 10%human AB serum (Gemini Bio-Products), 2 mM L-glutamine, 100 U/mlpenicillin, 100 �g/ml streptomycin, and 1% nonessential amino acids
(RPMI 1640 � 10%SAB). The cultures were maintained for 20 days in thepresence of 10 U/ml IL-2 (Roche) and 20 ng/ml IL-7 (R&D Systems) toallow the expansion of specific T cells. Separately, a part of CD4� T cellswere stimulated with 10 �g/ml PHA (REMEL) and cultured in RPMI 1640 �10%SAB with IL-2 and IL-7, to be used as APC (T-APC) (19). AutologousEBV-transformed B (EBV-B) cells were generated from T cell-depletedPBMC by supernatant from B95–8 cells. Allogeneic HLA-compatibleEBV-B cells had been generated and stored in our cell bank. EBV-B cellswere maintained in RPMI 1640 medium supplemented with 10% FBS, 2mM L-glutamine, 100 U/ml penicillin, 100 �g/ml streptomycin, and 1%nonessential amino acids (RPMI 1640 � 10%FCS).
ELISPOT assay
IFN-� ELISPOT assay was performed as described previously (16).Briefly, nitrocellulose-coated microtiter plates (Millipore) were coatedovernight with 2 �g/ml anti-IFN-� mAb (1-D1K, Mabtech) and blockedwith 10% human serum (Sigma-Aldrich) in RPMI 1640 medium. Indicatednumber of effector T cells were cocultured with Ag-pulsed target cells,such as 5 � 104 EBV-B cells or 1 � 105 T-APC, for 24 h in RPMI 1640medium without serum. Plates were developed using 0.2 �g/ml biotinyl-ated anti-IFN-� mAb (7-B6–1-biotin, Mabtech), 1 U/ml streptavidin-alka-line phosphatase conjugate (Roche Diagnostics), and 5-bromo-4-chloro-3-indolyl phosphate/NBT (Sigma-Aldrich). The number of spots wasevaluated using C.T.L. Immunospot analyzer and software (Cellular Tech-nology). Results were shown as the number of spots without subtracting thenumber of background spots.
Detection and isolation of MAGE-A3-specific CD4� T cells
MAGE-A3-specific CD4� T cells were isolated by using CD154 expres-sion sorting as described (20). Briefly, presensitized CD4� T cells wererestimulated for 6 h in 500 �l X-Vivo15 (BioWhittaker) with T-APC thatwere pulsed overnight with MAGE-A3 overlapping peptide pool (30 pep-tides with 20 amino acids length; 3 �g/ml for each peptide) and labeledwith CFSE (Invitrogen-Molecular Probes) in the presence of 20 �l of PE-conjugated anti-CD154 mAb and 0.3 �l GolgiStop (BD Biosciences).CFSE�CD154� MAGE-A3-specific effector T cells were sorted byFACSAria instrument and FACSDiva software (BD Biosciences). Sortedcells were stimulated with 10 �g/ml PHA in the presence of irradiatedallogeneic PBMC. Cells were expanded for �20 days in RPMI 1640 �10%SAB in the presence of 10 U/ml IL-2 and 20 ng/ml IL-7.
Measurement of cytoplasmic cytokines
MAGE-A3-specific CD4� T cell lines were cocultured for 6 h in 250 �lX-Vivo in the presence of 0.17 �l GolgiStop with autologous EBV-B cellsthat were pulsed overnight with MAGE-A3 peptide pool and labeled withCFSE. Cytoplasmic cytokines were stained using a BD Cytofix/Cytopermkit (BD Biosciences) according to manufacturer’s instructions with PE-conjugated anti-IL-2, -IL-4, -IL-13, and -GM-CSF mAbs, allophycocya-nin-conjugated anti-IFN-� mAb, and allophycocyanin-conjugated anti-IL-5 mAb (anti-IL-4 mAb was purchased from eBioscience, all other mAbswere purchased from BD Biosciences). CFSE� effector CD4� T cells weremeasured and analyzed for their fluorescent intensity by FACSCalibur in-strument with CellQuest software (BD Biosciences).
Measurement of cytokine levels
To evaluate the cytokine production from MAGE-A3-specific CD4� T celllines, autologous or HLA-compatible allogeneic EBV-B cells were pulsedovernight with MAGE-A3 peptides. Peptide-pulsed EBV-B cells (5 � 105)and effector CD4� T cell line (5 � 105) were cocultured for 20 h in 96-wellround-bottom plate in 250 �l RPMI 1640 � 10%FCS and supernatant washarvested. Cytokine levels in the supernatant were measured by ELISA.Unlabeled and biotin-conjugated mAbs against GM-CSF, IFN-�, andIL-4 were purchased from BD Biosciences. Unlabeled anti-IL-13 mAband biotin-conjugated anti-IL-13 polyclonal Ab were purchased fromeBioscience. ELISA kits for the measurement of IL-5, IL-10, TGF-�,and IL-17 were obtained from eBioscience.
To calculate apparent avidity of peptide-specific T cells, GM-CSF pro-duction was measured against graded amounts (from 10,000 to 1 ng/ml) ofthe peptide pulsed on autologous EBV-B cells. The dose-dependent curvefor GM-CSF production was fitted by nonlinear regression analysis byusing Prism 5 software (GraphPad Software) and the concentration to in-duce half of the amount of GM-CSF production against EBV-B cellspulsed with 10,000 ng/ml peptide was calculated by interpolation.
4801The Journal of Immunology
by guest on June 13, 2018http://w
ww
.jimm
unol.org/D
ownloaded from
ResultsDetection of preexisting MAGE-A3-specific CD4� T cells incancer patients and healthy donors
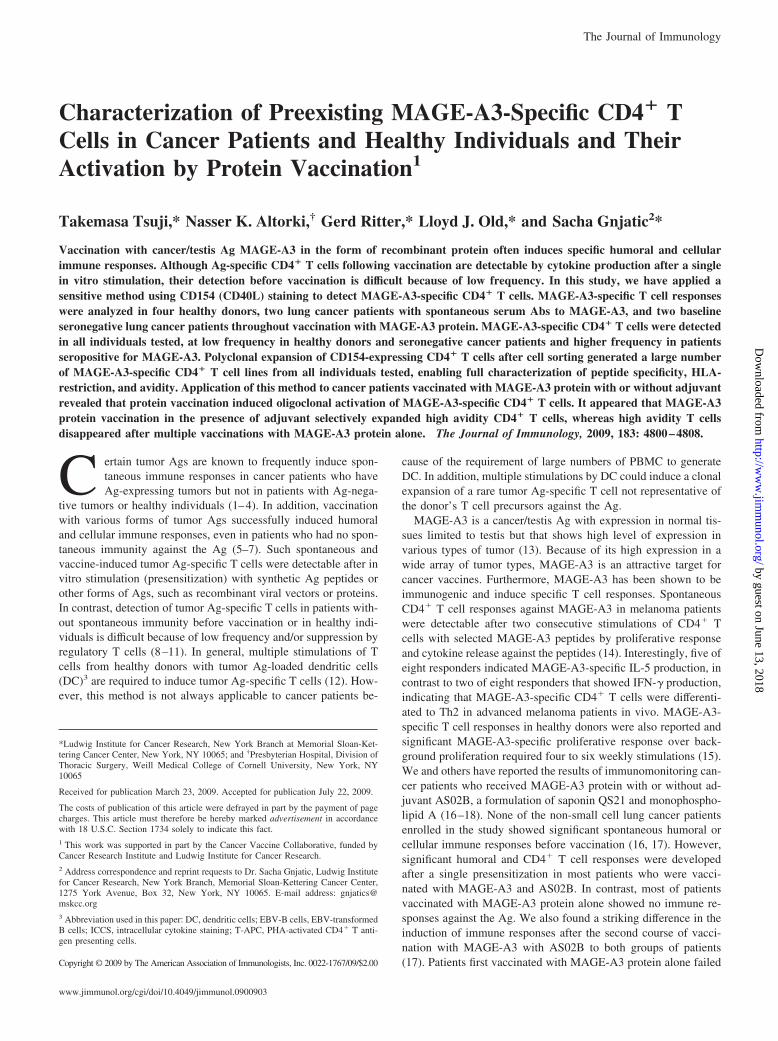
To increase the chance of detecting MAGE-A3-specific CD4� Tcells from PBMC, we first focused on patients with rare sponta-neous Ab response against MAGE-A3. CD4� T cells from twonon-small cell lung cancer patients, LU-649 and LU-729, seropos-itive for MAGE-A3 (titers 1/13,000 and 1/8,000 respectively, datanot shown) were stimulated with a pool of 30 MAGE-A3 over-lapping peptides that were 20 amino acids long and had a 10 aminoacids overlap (supplemental Table S14 for peptide sequences). Af-ter 20 days, IFN-� producing MAGE-A3-specific T cells wereevaluated by IFN-� ELISPOT assay using autologous T-APC astarget cells. Strong CD4� T cell responses were observed againstMAGE-A3 peptides in these seropositive cancer patients againstmultiple epitopes (Fig. 1A and supplemental Fig. S1). We thenevaluated MAGE-A3-specific T cell precursors in four healthy do-nors whose CD4� T cells were similarly presensitized and ana-lyzed by IFN-� ELISPOT assay. In contrast to seropositivepatients, no significant IFN-�-producing CD4� T cells were ob-served in healthy donors, consistent with a previous observationthat no measurable proliferative response over the background pro-liferation could be obtained after two consecutive Ag stimulationsof CD4� T cells from healthy donors (15). However, the results ofIFN-� ELISPOT assays could not exclude the existence of non-IFN-�-producing, MAGE-A3-specific CD4� T cells in healthy do-nors. Thus, we took advantage of CD154 (CD40L) staining, a re-
cently described method to detect Ag-specific CD4� T cells withany cytokine-producing capability (20). When presensitized CD4�
T cells from seropositive patients were stimulated with target cellspulsed with overlapping peptides in the presence of anti-CD154mAb, significant number of CD4� T cells up-regulated CD154compared with those stimulated with unpulsed target cells (Fig. 1Band Figure S1). CD154-expressing cells in LU729 (2.4%) weremuch less frequent than that in LU649 (29%). Because serum fromLU729 also showed reactivity against another MAGE familymember, MAGE-A4, it is possible that serum Ab titer againstMAGE-A3 was due to a cross-reaction of anti-MAGE-A4 Ab andpatient LU729 did not show as strong spontaneous CD4� T cellresponses to MAGE-A3. The same method also detected CD154-expressing CD4� T cells from healthy donors, albeit with muchlower percentages of frequency (Fig. 1B). Fig. 1C summarizes thepercentages of CD154-expressing CD4� T cells of four healthydonors after stimulation with MAGE-A3 peptides-pulsed and un-pulsed target cells. Increased CD154-expressing CD4� T cellswere found in all healthy donors tested after stimulation withMAGE-A3 peptide pool compared with unpulsed target cells, al-though the percentage of specific cells was lower (0.4–1.3%) thanseropositive cancer patients (29 and 2.4%). The percentage ofCD154-expressing T cells is expected to correlate with frequencyof preexisting MAGE-A3-specific T cells in healthy donors andcancer patients. However, because cells were expanded for 20 daysafter peptide stimulation and the doubling time for specific-CD4�
T cells in bulk culture was very difficult to estimate, specific T cellfrequency could not be precisely determined without more com-plex experiments such as limiting dilution.
Characterization of MAGE-A3-specific CD4� T cells in cancerpatients and healthy donors
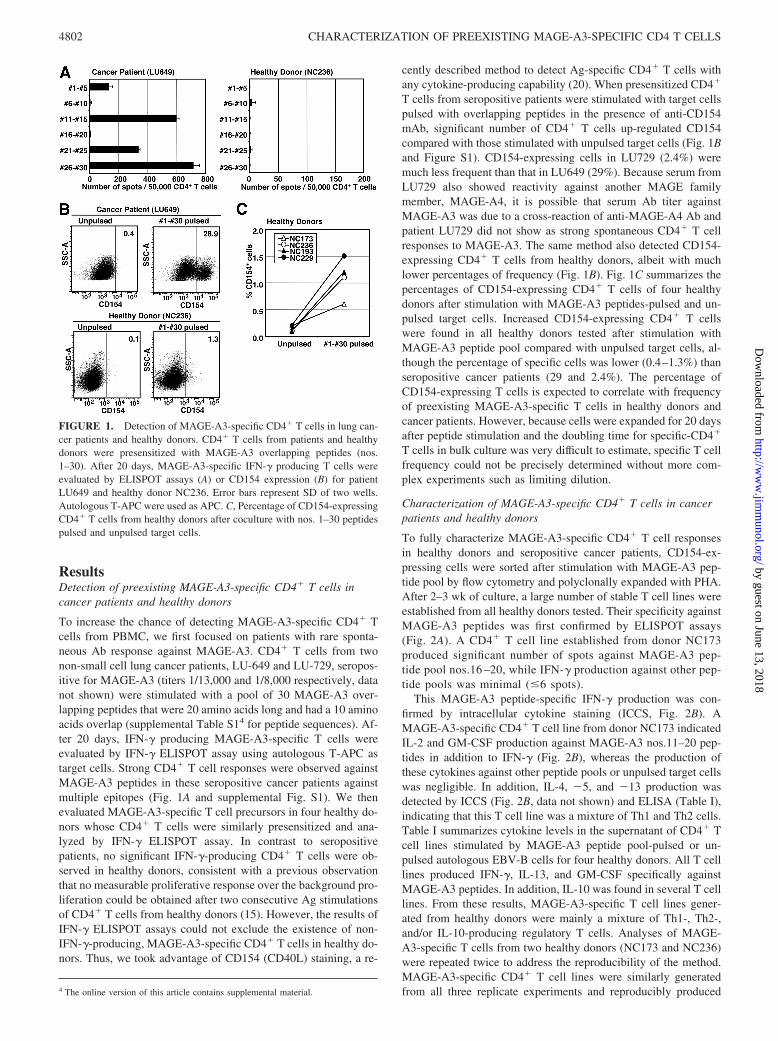
To fully characterize MAGE-A3-specific CD4� T cell responsesin healthy donors and seropositive cancer patients, CD154-ex-pressing cells were sorted after stimulation with MAGE-A3 pep-tide pool by flow cytometry and polyclonally expanded with PHA.After 2–3 wk of culture, a large number of stable T cell lines wereestablished from all healthy donors tested. Their specificity againstMAGE-A3 peptides was first confirmed by ELISPOT assays(Fig. 2A). A CD4� T cell line established from donor NC173produced significant number of spots against MAGE-A3 pep-tide pool nos.16 –20, while IFN-� production against other pep-tide pools was minimal (�6 spots).
This MAGE-A3 peptide-specific IFN-� production was con-firmed by intracellular cytokine staining (ICCS, Fig. 2B). AMAGE-A3-specific CD4� T cell line from donor NC173 indicatedIL-2 and GM-CSF production against MAGE-A3 nos.11–20 pep-tides in addition to IFN-� (Fig. 2B), whereas the production ofthese cytokines against other peptide pools or unpulsed target cellswas negligible. In addition, IL-4, �5, and �13 production wasdetected by ICCS (Fig. 2B, data not shown) and ELISA (Table I),indicating that this T cell line was a mixture of Th1 and Th2 cells.Table I summarizes cytokine levels in the supernatant of CD4� Tcell lines stimulated by MAGE-A3 peptide pool-pulsed or un-pulsed autologous EBV-B cells for four healthy donors. All T celllines produced IFN-�, IL-13, and GM-CSF specifically againstMAGE-A3 peptides. In addition, IL-10 was found in several T celllines. From these results, MAGE-A3-specific T cell lines gener-ated from healthy donors were mainly a mixture of Th1-, Th2-,and/or IL-10-producing regulatory T cells. Analyses of MAGE-A3-specific T cells from two healthy donors (NC173 and NC236)were repeated twice to address the reproducibility of the method.MAGE-A3-specific CD4� T cell lines were similarly generatedfrom all three replicate experiments and reproducibly produced4 The online version of this article contains supplemental material.
FIGURE 1. Detection of MAGE-A3-specific CD4� T cells in lung can-cer patients and healthy donors. CD4� T cells from patients and healthydonors were presensitized with MAGE-A3 overlapping peptides (nos.1–30). After 20 days, MAGE-A3-specific IFN-� producing T cells wereevaluated by ELISPOT assays (A) or CD154 expression (B) for patientLU649 and healthy donor NC236. Error bars represent SD of two wells.Autologous T-APC were used as APC. C, Percentage of CD154-expressingCD4� T cells from healthy donors after coculture with nos. 1–30 peptidespulsed and unpulsed target cells.
4802 CHARACTERIZATION OF PREEXISTING MAGE-A3-SPECIFIC CD4 T CELLS
by guest on June 13, 2018http://w
ww
.jimm
unol.org/D
ownloaded from

large amount of IFN-�, IL-13, and GM-CSF, whereas the levels ofIL-4, IL-5, and/or IL-10 were much less or negligible (data notshown).
We previously demonstrated that NY-ESO-1-specific CD4� Tcell precursors were detectable from CD45RA� naive T cell subset
after a single presensitization by removal of CD25� regulatory Tcells (9). To find out whether MAGE-A3-specific CD4� T cellprecursors in healthy donors are present in naive T cell population,CD45RA� naive and CD45RO� memory CD4� T cells fromNC173 and NC236 were presensitized and MAGE-A3-specificCD4� T cell lines were generated. In contrast to NY-ESO-1-spe-cific CD4� T cells, MAGE-A3-specific CD4� T cells were de-tectable from both naive and memory populations in both healthydonors (data not shown). NY-ESO-1-specific CD4�CD45RA� Tcell precursors were shown to have high avidity and recognizenaturally processed NY-ESO-1 protein (8). Interestingly, onlyMAGE-A3-specific CD4� T cells obtained from naive populationof both healthy donors were able to recognize MAGE-A3 protein,compared with memory populations (Fig. 2C and data not shown).
MAGE-A3-specific CD4� T cell lines established from sero-positive lung cancer patients were evaluated by ELISPOT assay(data not shown), ICCS (Fig. S2), and measurement of cytokinelevels in the supernatant by ELISA (Table I). As apparent fromTable I, CD4� T cell lines from these cancer patients were char-acterized by very strong IFN-� production compared with healthydonors-derived T cells. In addition, Th2 cytokines (IL-4, �5, and�13) were also produced. ICCS also showed strong IFN-� stain-ing in addition to IL-4 staining after stimulation with MAGE-A3peptide pools, indicating that MAGE-A3-specific CD4� T cells inseropositive cancer patients were a mixture of Th1 and Th2 cells(Fig. S2).
Frequency of MAGE-A3-specific CD4� T cells in cancerpatients before and after vaccination with MAGE-A3 protein
Detection and characterization of MAGE-A3-specific T cell precur-sors in healthy donors with CD154 staining as mentioned above en-abled us to detect preexisting MAGE-A3-specific T cells in cancerpatients before vaccination, which were difficult to measure by con-ventional immunomonitoring methods such as ELISPOT assay orICCS. We applied this method to two cancer patients vaccinated witha fusion protein of MAGE-A3 and protein D with or without adjuvantAS02B. Patients WS07 and GO17, who were previously shown tohave no spontaneous immune response before vaccination, receivedMAGE-A3 protein alone intradermally and MAGE-A3 plus AS02Bi.m., respectively (16, 17). As reported previously, patient GO17 de-veloped strong humoral and cellular immune responses after vacci-nation, whereas WS07 showed no immune response during vaccina-tion with MAGE-A3 protein alone (17). After completing this firstcycle of vaccination, both patients received an additional course ofvaccination with MAGE-A3-protein D fusion protein formulated in
FIGURE 2. Characterization of MAGE-A3-specific CD4� T cell linesobtained from a healthy donor, NC173. MAGE-A3-specific CD4� T celllines were obtained from presensitized CD4� T cells by isolation ofCD154-expressing cells after stimulation with MAGE-A3 peptides and ex-pansion with PHA. A, MAGE-A3-specific IFN-� production was evaluatedby ELISPOT assays. Error bars represent SD of two wells. B, Cytokineproduction was evaluated by cytoplasmic cytokine staining after stimula-tion with nos. 10–20 peptides. Autologous EBV-B cells were used as APC.Numbers in each quadrant indicate the percentage of cells and parenthe-sized numbers indicate the background production of cytokines againstunpulsed target cells. C, Recognition of naturally processed MAGE-A3protein by MAGE-A3-specific T cell lines-derived from CD45RA� andCD45RO�CD4� T cell subsets was evaluated by GM-CSF production.Autologous EBV-B cells were pulsed overnight with 20 �g/ml MAGE-A3protein, washed, and cocultured with CD4� T cell lines. After 24 h, su-pernatant was harvested and GM-CSF level was measured by ELISA.
Table I. Cytokine levels (ng/ml) in supernatant of MAGE-A3-specific CD4� T cell lines of healthy donorsand seropositive cancer patientsa
IFN-� IL-4 IL-5 IL-13 GM-CSF IL-10
Healthy donorsNC173b 17.1 (0.0) 1.1 (0.0) 1.8 (0.1) 6.4 (0.0) 16.3 (0.0) 0.2 (0.1)NC236b 2.4 (0.0) 0.0 (0.0) 0.3 (0.0) 2.9 (0.1) 3.0 (0.0) 0.4 (0.2)NC193c 4.7 (0.0) 0.4 (0.0) 3.2 (0.0) 10.0 (0.0) 13.6 (0.0) 3.3 (0.0)NC229c 5.2 (0.0) 0.0 (0.0) 0.1 (0.0) 3.0 (0.2) 6.1 (0.2) 0.5 (0.1)
Seropositive cancerpatients
LU649b 68.0 (0.0) 2.2 (0.0) 0.5 (0.1) 9.1 (0.0) 28.8 (0.0) 0.4 (0.1)LU729b 72.8 (0.0) 2.3 (0.1) 1.6 (0.1) 11.0 (0.0) 27.1 (0.0) 1.0 (0.1)
a MAGE-A3-specific T cell lines (50,000 cells) and peptides-pulsed autologous EBV-B cells (50,000 cells) were coculturedfor 20 h and cytokines levels in the supernatant were measured by ELISA. Numbers in parentheses indicate background cytokineproduction against unpulsed autologous EBV-B cells. MAGE-A3-specific cytokine production exceeding the limit of detectionand five times higher than background production was considered to be significant and is shown in boldface.
b Sum of cytokine levels produced against nos. 1–10, 11–20, and 21–30 pools.c Sum of cytokine levels produced against nos. 1–14 and 15–30 pools.
4803The Journal of Immunology
by guest on June 13, 2018http://w
ww
.jimm
unol.org/D
ownloaded from

AS02B. Interestingly, although GO17 continuously responded to thesecond course of vaccination, WS07 did not show any immune re-sponse against additional course of vaccination with MAGE-A3 pro-tein in the presence of AS02B (17). In contrast, both patients devel-oped strong humoral immune response against protein D, indicatingthat a selective suppressed or nonresponsive state was induced duringprotein vaccination without adjuvant (17).
To evaluate MAGE-A3-specific CD4� T cells before and aftervaccination, CD4� T cells from selected time points were presen-sitized with MAGE-A3 peptide pool and CD154 expression wasevaluated by flow cytometry after restimulation with MAGE-A3peptides, as shown in Fig. 3. Although conventional IFN-� ELIS-POT assays with CD4� T cells from WS07 and GO17 showed nospecific response before vaccination, there were significantly moreCD154-expressing cells (2.4 and 5.8%, respectively) after restimu-lation with MAGE-A3 peptide pool compared with unstimulatedcells (0.5 and 0.6%, respectively), indicating the presence ofMAGE-A3-specific T cells in these two seronegative cancer pa-tients. Although both patients were seronegative before vaccina-tion, these percentages of CD154-expressing cells before vaccina-tion were slightly higher than those in healthy donors, whichpossibly indicated that MAGE-A3-specific CD4� T cell precur-sors in these cancer patients were primed in vivo by tumor cell-derived MAGE-A3. There was a striking change in the frequencyof CD154-expressing cells in WS07 during vaccination withMAGE-A3 protein alone. After a single vaccine injection, CD154-expressing cells dramatically increased to �20% in CD4� T cellsand then rapidly decreased to baseline levels after the next injec-tions. In our previous study, similar transient induction of MAGE-A3-specific CD4� T cells after vaccination with MAGE-A3 pro-tein alone was observed in another patient, ST-04, by IFN-�ELISPOT assay and ICCS (16). In sharp contrast, when MAGE-A3 protein was formulated with adjuvant AS02B and administeredto patient GO17, CD154-expressing MAGE-A3-specific CD4� Tcells were increased from 5.2% before vaccination to 9.6% afterthe first vaccination (Fig. 3B), and were further expanded after thesecond vaccination at day 43 (16.5%) and the third vaccination at
day 64 (36.1%), confirming previous observations for most pa-tients who received MAGE-A3 protein in AS02B by IFN-�ELISPOT assay and/or ICCS (16, 17).
During the second course of vaccination with MAGE-A3 pro-tein with AS02B, MAGE-A3-specific CD4� T cells in GO17 wereboosted. However, as consistent with our previous study, althoughpatient WS07 received the same treatment with adjuvant for thesecond course, MAGE-A3-specific CD4� T cells remained atbaseline level (Fig. 3).
Characterization of MAGE-A3-specific CD4� T cells before andafter vaccination
To fully characterize MAGE-A3-specific CD4� T cells observedin each vaccination point, we generated MAGE-A3-specific CD4�
T cell lines by isolating specific cells based on their CD154 ex-pression after restimulation with MAGE-A3 overlapping peptidesand polyclonal expansion with PHA. Obtained MAGE-A3-specificCD4� T cell lines were tested by cytokine release for their reac-tivity against MAGE-A3 overlapping peptides pulsed on autolo-gous EBV-B cells. All CD4� T cell lines showed strong reactivityagainst a pool of MAGE-A3 overlapping peptides, even those de-rived from samples taken before vaccination, which are consideredto be precursors of MAGE-A3-specific T cells (Tables II and III).
Specificity
As shown in Table II, MAGE-A3-specific T cell lines obtainedfrom WS07, who received MAGE-A3 protein alone, recognizedmultiple epitopes as measured by GM-CSF, which is produced byboth Th1 and Th2 cells (21) and was thus selected to show thespecificity of MAGE-A3-specific Th1 and Th2 cells. GM-CSFproduction against some peptides, such as nos.11, 12, and 25 inpatient WS07, were consistently observed before and during thecourse of vaccination. In addition, some responses were observedtransiently after vaccination. Similar observations were made forGO17, who was vaccinated in the presence of AS02B (Table III).GM-CSF production against no.12 was already seen before vac-cination as well as during the vaccination period. Similarly, no. 29peptide-specific T cells were marginally detected before vacci-nation but became one of the dominant responses after the firstinjection of MAGE-A3 with adjuvant. In contrast, the strongest
FIGURE 3. CD154 expression by CD4� T cells from cancer patientsbefore and after vaccination. Patients WS07 (A) and GO17 (B) receivedMAGE-A3 protein in the absence and presence of adjuvant AS02B, re-spectively. During the second course of vaccination, both of them re-ceived MAGE-A3 protein with AS02B. CD4� T cells from these pa-tients were presensitized with MAGE-A3 peptides and CD154-expressingcells after restimulation with T-APC loaded with the same peptide poolwas evaluated by flow cytometry. Pre, Before vaccination; d, day.
Table II. GM-CSF production by MAGE-A3-specific CD4� T cell linesgenerated from patient WS07a
Peptides(no.)
MAGE-A3 alone (ng/ml)MAGE-A3 � AS02B
(ng/ml)
Pre d22 d43 d64 Pre d22 d43 d85
7 0.0 0.0 0.1 0.0 0.2 0.0 2.7 0.011 0.6 3.1 2.1 1.2 0.1 0.8 0.2 0.112 0.7 3.1 2.2 1.9 0.1 0.7 0.2 7.813 0.0 5.5 0.1 0.0 0.0 0.1 0.0 0.015 1.9 0.4 1.5 0.0 0.0 0.1 0.2 0.017 0.0 0.0 0.1 0.0 0.0 1.2 0.0 0.622 0.0 9.4 0.1 0.0 0.0 0.1 0.0 0.025 3.2 3.0 1.6 1.2 2.8 2.0 1.3 1.528 0.0 0.0 1.7 0.0 0.0 0.1 0.0 0.029 0.0 0.0 0.1 0.0 0.0 7.3 0.0 0.01–30 4.5 9.9 4.7 2.2 3.0 8.3 3.8 8.1None 0.0 0.0 0.1 0.0 0.0 0.1 0.0 0.0
a Sequences are given in Table S1. Peptides that induced less than 1.0 ng/mlGM-CSF are not shown. GM-CSF production exceeding the limit of detection (0.6ng/ml) and five times higher than background production was considered to be sig-nificant and is shown in bold.
Pre, Before vaccination; d, day.
4804 CHARACTERIZATION OF PREEXISTING MAGE-A3-SPECIFIC CD4 T CELLS
by guest on June 13, 2018http://w
ww
.jimm
unol.org/D
ownloaded from
response against no.17 peptide before vaccination disappearedafter the first injection.
Th1/Th2 differentiation during vaccination
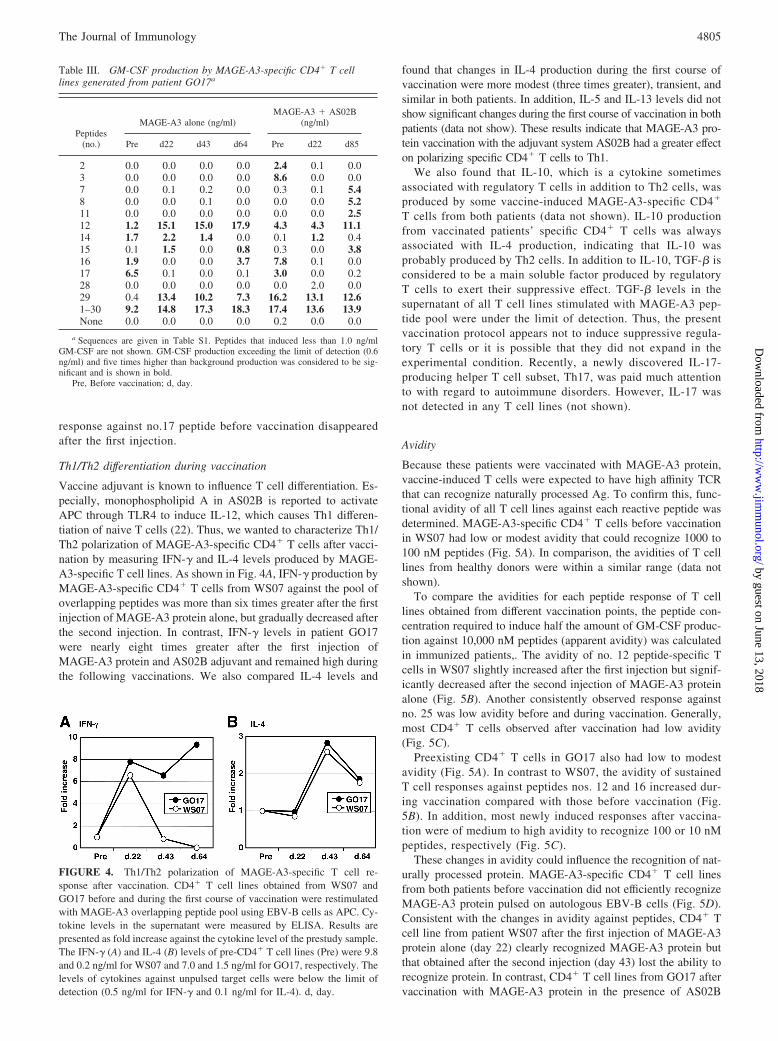
Vaccine adjuvant is known to influence T cell differentiation. Es-pecially, monophospholipid A in AS02B is reported to activateAPC through TLR4 to induce IL-12, which causes Th1 differen-tiation of naive T cells (22). Thus, we wanted to characterize Th1/Th2 polarization of MAGE-A3-specific CD4� T cells after vacci-nation by measuring IFN-� and IL-4 levels produced by MAGE-A3-specific T cell lines. As shown in Fig. 4A, IFN-� production byMAGE-A3-specific CD4� T cells from WS07 against the pool ofoverlapping peptides was more than six times greater after the firstinjection of MAGE-A3 protein alone, but gradually decreased afterthe second injection. In contrast, IFN-� levels in patient GO17were nearly eight times greater after the first injection ofMAGE-A3 protein and AS02B adjuvant and remained high duringthe following vaccinations. We also compared IL-4 levels and
found that changes in IL-4 production during the first course ofvaccination were more modest (three times greater), transient, andsimilar in both patients. In addition, IL-5 and IL-13 levels did notshow significant changes during the first course of vaccination in bothpatients (data not show). These results indicate that MAGE-A3 pro-tein vaccination with the adjuvant system AS02B had a greater effecton polarizing specific CD4� T cells to Th1.
We also found that IL-10, which is a cytokine sometimesassociated with regulatory T cells in addition to Th2 cells, wasproduced by some vaccine-induced MAGE-A3-specific CD4�
T cells from both patients (data not shown). IL-10 productionfrom vaccinated patients’ specific CD4� T cells was alwaysassociated with IL-4 production, indicating that IL-10 wasprobably produced by Th2 cells. In addition to IL-10, TGF-� isconsidered to be a main soluble factor produced by regulatoryT cells to exert their suppressive effect. TGF-� levels in thesupernatant of all T cell lines stimulated with MAGE-A3 pep-tide pool were under the limit of detection. Thus, the presentvaccination protocol appears not to induce suppressive regula-tory T cells or it is possible that they did not expand in theexperimental condition. Recently, a newly discovered IL-17-producing helper T cell subset, Th17, was paid much attentionto with regard to autoimmune disorders. However, IL-17 wasnot detected in any T cell lines (not shown).
Avidity
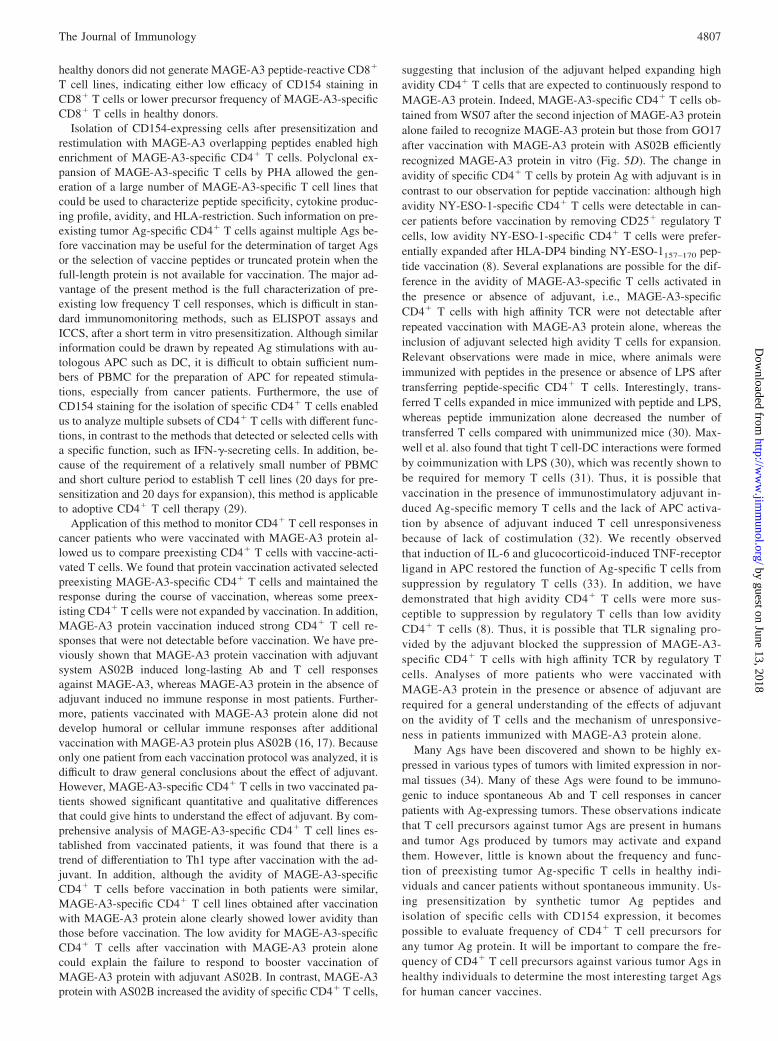
Because these patients were vaccinated with MAGE-A3 protein,vaccine-induced T cells were expected to have high affinity TCRthat can recognize naturally processed Ag. To confirm this, func-tional avidity of all T cell lines against each reactive peptide wasdetermined. MAGE-A3-specific CD4� T cells before vaccinationin WS07 had low or modest avidity that could recognize 1000 to100 nM peptides (Fig. 5A). In comparison, the avidities of T celllines from healthy donors were within a similar range (data notshown).
To compare the avidities for each peptide response of T celllines obtained from different vaccination points, the peptide con-centration required to induce half the amount of GM-CSF produc-tion against 10,000 nM peptides (apparent avidity) was calculatedin immunized patients,. The avidity of no. 12 peptide-specific Tcells in WS07 slightly increased after the first injection but signif-icantly decreased after the second injection of MAGE-A3 proteinalone (Fig. 5B). Another consistently observed response againstno. 25 was low avidity before and during vaccination. Generally,most CD4� T cells observed after vaccination had low avidity(Fig. 5C).
Preexisting CD4� T cells in GO17 also had low to modestavidity (Fig. 5A). In contrast to WS07, the avidity of sustainedT cell responses against peptides nos. 12 and 16 increased dur-ing vaccination compared with those before vaccination (Fig.5B). In addition, most newly induced responses after vaccina-tion were of medium to high avidity to recognize 100 or 10 nMpeptides, respectively (Fig. 5C).
These changes in avidity could influence the recognition of nat-urally processed protein. MAGE-A3-specific CD4� T cell linesfrom both patients before vaccination did not efficiently recognizeMAGE-A3 protein pulsed on autologous EBV-B cells (Fig. 5D).Consistent with the changes in avidity against peptides, CD4� Tcell line from patient WS07 after the first injection of MAGE-A3protein alone (day 22) clearly recognized MAGE-A3 protein butthat obtained after the second injection (day 43) lost the ability torecognize protein. In contrast, CD4� T cell lines from GO17 aftervaccination with MAGE-A3 protein in the presence of AS02B
FIGURE 4. Th1/Th2 polarization of MAGE-A3-specific T cell re-sponse after vaccination. CD4� T cell lines obtained from WS07 andGO17 before and during the first course of vaccination were restimulatedwith MAGE-A3 overlapping peptide pool using EBV-B cells as APC. Cy-tokine levels in the supernatant were measured by ELISA. Results arepresented as fold increase against the cytokine level of the prestudy sample.The IFN-� (A) and IL-4 (B) levels of pre-CD4� T cell lines (Pre) were 9.8and 0.2 ng/ml for WS07 and 7.0 and 1.5 ng/ml for GO17, respectively. Thelevels of cytokines against unpulsed target cells were below the limit ofdetection (0.5 ng/ml for IFN-� and 0.1 ng/ml for IL-4). d, day.
Table III. GM-CSF production by MAGE-A3-specific CD4� T celllines generated from patient GO17a
Peptides(no.)
MAGE-A3 alone (ng/ml)MAGE-A3 � AS02B
(ng/ml)
Pre d22 d43 d64 Pre d22 d85
2 0.0 0.0 0.0 0.0 2.4 0.1 0.03 0.0 0.0 0.0 0.0 8.6 0.0 0.07 0.0 0.1 0.2 0.0 0.3 0.1 5.48 0.0 0.0 0.1 0.0 0.0 0.0 5.211 0.0 0.0 0.0 0.0 0.0 0.0 2.512 1.2 15.1 15.0 17.9 4.3 4.3 11.114 1.7 2.2 1.4 0.0 0.1 1.2 0.415 0.1 1.5 0.0 0.8 0.3 0.0 3.816 1.9 0.0 0.0 3.7 7.8 0.1 0.017 6.5 0.1 0.0 0.1 3.0 0.0 0.228 0.0 0.0 0.0 0.0 0.0 2.0 0.029 0.4 13.4 10.2 7.3 16.2 13.1 12.61–30 9.2 14.8 17.3 18.3 17.4 13.6 13.9None 0.0 0.0 0.0 0.0 0.2 0.0 0.0
a Sequences are given in Table S1. Peptides that induced less than 1.0 ng/mlGM-CSF are not shown. GM-CSF production exceeding the limit of detection (0.6ng/ml) and five times higher than background production was considered to be sig-nificant and is shown in bold.
Pre, Before vaccination; d, day.
4805The Journal of Immunology
by guest on June 13, 2018http://w
ww
.jimm
unol.org/D
ownloaded from

efficiently recognized MAGE-A3 protein-pulsed EBV-B cells evenafter multiple injections (Fig. 5D).
HLA-restriction
Finally, the generation of MAGE-A3-specific T cell lines allowedus to precisely determine HLA-restriction of CD4� T cell re-
sponses, which was difficult to do by using bulk T cells obtainedby presensitization because of limited number of cells and highbackground reactivity against allogeneic EBV-B cells. As shownin supplemental Fig. S3, HLA-restriction of most peptide re-sponses was determined and HLA restrictions were found to bedistributed to most of patients’ HLA types.
DiscussionMonitoring T cell response against vaccinated Ag is important todeveloping better vaccine formulations or protocols. Recently,full-length tumor Ags, such as recombinant protein or viral vec-tors, instead of defined short peptides were used for vaccinationbecause they were considered to activate multiple T cell precursorswithout limitation by HLA types (5, 6, 16, 23–25). Many studiesreported successful induction of multiple T cell responses againstthe vaccine Ag, however, functional comparison to preexisting Tcell responses before vaccination was hampered because of thelow frequency of specific T cells in nonvaccinated patients withoutspontaneous immunity against the Ag. Thus, it is not clear whichrepertoire of T cells preexist in patients and which are activated orrecruited by tumor Ag vaccination. Furthermore, comparison ofthe functional difference of preexisting tumor Ag-specific T cellsand vaccine-induced T cells is important for better understandingthe effect of vaccination. In the present study, we have applied asensitive method using CD154 staining to detect and isolate pre-existing tumor Ag-specific T cells in healthy individuals and can-cer patients who showed no significant T cell response in conven-tional immunomonitoring methods.
Staining with anti-CD154 mAb detected MAGE-A3-specificCD4� T cells from all eight individuals tested, with low frequencyin four healthy donors and two seronegative cancer patients beforevaccination, but higher percentages in two cancer patients withspontaneous seropositivity for MAGE-A3. The precursor fre-quency is expected to be higher than 2 � 10�6 from the initialnumber of CD4� T cells (5 � 105), although the precise estimationof precursor frequency is difficult because cells were expanded for20 days after peptide stimulation. In addition, when peptide spec-ificity of MAGE-A3-specific CD4� T cell lines from three inde-pendent cultures of healthy donors, NC173 and NC236, were com-pared, some peptides-specific T cells were detected only in one Tcell line (data not shown), indicating that the precursor frequencyfor some epitopes is less than 2 � 10�6 in healthy individuals.This indicated the requirement of multiple cultures to estimate thewhole spectrum of peptides-specificity and their frequencies inhealthy donors in the present protocol, similarly to other tech-niques. However, this precursor frequency for healthy donors waswithin the range of 1.4 � 10�6–3.1 � 10�7 in healthy donors,determined for several HLA-DP4-restricted peptides from otherMAGE-A gene family proteins (26). Their estimation is based onthe detection rate of IFN-�-producing CD4� T cells from multiplewells containing a limited number of CD4� T cells after stimula-tion four times with peptide-loaded DC (26). NY-ESO-1- andSSX-2-specific CD4� T cell precursor frequency in healthy donorswas estimated to be 1.1–9.1 � 10�6 and 5–25 � 10�6, respec-tively, by IFN-� ICCS (27, 28), which is similar to that of anti-MAGE-A4 CD4� T cell frequency. With some modification, suchas limiting dilution, the present protocol is expected to become analternative method to estimate precursor frequency of tumor Ag-specific CD4� T cell precursors that produce any cytokines. Nosignificant MAGE-A3-specific CD8� T cells were detected inhealthy donors or cancer patients tested in the present study byIFN-� ELISPOT assays. In addition, isolation and expansion ofCD154-expressing CD8� T cells after presensitization and re-stimulation with MAGE-A3 overlapping peptides from two
FIGURE 5. Avidity of MAGE-A3-specific CD4� T cells before andduring the courses of vaccination. A, CD4� T cell lines established fromWS07 and GO17 before vaccination were stimulated with autologousEBV-B cells pulsed with graded concentration of MAGE-A3 peptides andGM-CSF levels in the supernatant were determined ELISA. Results areshown against the GM-CSF level induced by 10,000 ng/ml peptide. B,Change in the avidity of CD4� T cell lines during the first course ofvaccination by MAGE-A3 protein in the absence (WS07) or presence(GO17) of AS02B. Peptide concentration to induce 50% of GM-CSF pro-duction against 10,000 ng/ml peptides (apparent avidity) was calculated byinterpolation of dose-dependent GM-CSF production shown in A. Re-sults are presented as relative change of apparent avidity of CD4� T celllines compared with apparent avidity of CD4� T cell lines before vac-cination (Pre). Positive and negative values indicate fold decrease andincrease in apparent avidity, respectively. C, Apparent avidities weredetermined for all significant responses against peptides observed be-fore and during vaccination. D, GM-CSF production by MAGE-A3-specific CD4� T cell lines obtained from cancer patients before andduring the first course of vaccination against MAGE-A3 protein-pulsedautologous EBV-B cells. GM-CSF production against unpulsed EBV-Bcells was below 0.1 ng/ml. d, day.
4806 CHARACTERIZATION OF PREEXISTING MAGE-A3-SPECIFIC CD4 T CELLS
by guest on June 13, 2018http://w
ww
.jimm
unol.org/D
ownloaded from
healthy donors did not generate MAGE-A3 peptide-reactive CD8�
T cell lines, indicating either low efficacy of CD154 staining inCD8� T cells or lower precursor frequency of MAGE-A3-specificCD8� T cells in healthy donors.
Isolation of CD154-expressing cells after presensitization andrestimulation with MAGE-A3 overlapping peptides enabled highenrichment of MAGE-A3-specific CD4� T cells. Polyclonal ex-pansion of MAGE-A3-specific T cells by PHA allowed the gen-eration of a large number of MAGE-A3-specific T cell lines thatcould be used to characterize peptide specificity, cytokine produc-ing profile, avidity, and HLA-restriction. Such information on pre-existing tumor Ag-specific CD4� T cells against multiple Ags be-fore vaccination may be useful for the determination of target Agsor the selection of vaccine peptides or truncated protein when thefull-length protein is not available for vaccination. The major ad-vantage of the present method is the full characterization of pre-existing low frequency T cell responses, which is difficult in stan-dard immunomonitoring methods, such as ELISPOT assays andICCS, after a short term in vitro presensitization. Although similarinformation could be drawn by repeated Ag stimulations with au-tologous APC such as DC, it is difficult to obtain sufficient num-bers of PBMC for the preparation of APC for repeated stimula-tions, especially from cancer patients. Furthermore, the use ofCD154 staining for the isolation of specific CD4� T cells enabledus to analyze multiple subsets of CD4� T cells with different func-tions, in contrast to the methods that detected or selected cells witha specific function, such as IFN-�-secreting cells. In addition, be-cause of the requirement of a relatively small number of PBMCand short culture period to establish T cell lines (20 days for pre-sensitization and 20 days for expansion), this method is applicableto adoptive CD4� T cell therapy (29).
Application of this method to monitor CD4� T cell responses incancer patients who were vaccinated with MAGE-A3 protein al-lowed us to compare preexisting CD4� T cells with vaccine-acti-vated T cells. We found that protein vaccination activated selectedpreexisting MAGE-A3-specific CD4� T cells and maintained theresponse during the course of vaccination, whereas some preex-isting CD4� T cells were not expanded by vaccination. In addition,MAGE-A3 protein vaccination induced strong CD4� T cell re-sponses that were not detectable before vaccination. We have pre-viously shown that MAGE-A3 protein vaccination with adjuvantsystem AS02B induced long-lasting Ab and T cell responsesagainst MAGE-A3, whereas MAGE-A3 protein in the absence ofadjuvant induced no immune response in most patients. Further-more, patients vaccinated with MAGE-A3 protein alone did notdevelop humoral or cellular immune responses after additionalvaccination with MAGE-A3 protein plus AS02B (16, 17). Becauseonly one patient from each vaccination protocol was analyzed, it isdifficult to draw general conclusions about the effect of adjuvant.However, MAGE-A3-specific CD4� T cells in two vaccinated pa-tients showed significant quantitative and qualitative differencesthat could give hints to understand the effect of adjuvant. By com-prehensive analysis of MAGE-A3-specific CD4� T cell lines es-tablished from vaccinated patients, it was found that there is atrend of differentiation to Th1 type after vaccination with the ad-juvant. In addition, although the avidity of MAGE-A3-specificCD4� T cells before vaccination in both patients were similar,MAGE-A3-specific CD4� T cell lines obtained after vaccinationwith MAGE-A3 protein alone clearly showed lower avidity thanthose before vaccination. The low avidity for MAGE-A3-specificCD4� T cells after vaccination with MAGE-A3 protein alonecould explain the failure to respond to booster vaccination ofMAGE-A3 protein with adjuvant AS02B. In contrast, MAGE-A3protein with AS02B increased the avidity of specific CD4� T cells,
suggesting that inclusion of the adjuvant helped expanding highavidity CD4� T cells that are expected to continuously respond toMAGE-A3 protein. Indeed, MAGE-A3-specific CD4� T cells ob-tained from WS07 after the second injection of MAGE-A3 proteinalone failed to recognize MAGE-A3 protein but those from GO17after vaccination with MAGE-A3 protein with AS02B efficientlyrecognized MAGE-A3 protein in vitro (Fig. 5D). The change inavidity of specific CD4� T cells by protein Ag with adjuvant is incontrast to our observation for peptide vaccination: although highavidity NY-ESO-1-specific CD4� T cells were detectable in can-cer patients before vaccination by removing CD25� regulatory Tcells, low avidity NY-ESO-1-specific CD4� T cells were prefer-entially expanded after HLA-DP4 binding NY-ESO-1157–170 pep-tide vaccination (8). Several explanations are possible for the dif-ference in the avidity of MAGE-A3-specific T cells activated inthe presence or absence of adjuvant, i.e., MAGE-A3-specificCD4� T cells with high affinity TCR were not detectable afterrepeated vaccination with MAGE-A3 protein alone, whereas theinclusion of adjuvant selected high avidity T cells for expansion.Relevant observations were made in mice, where animals wereimmunized with peptides in the presence or absence of LPS aftertransferring peptide-specific CD4� T cells. Interestingly, trans-ferred T cells expanded in mice immunized with peptide and LPS,whereas peptide immunization alone decreased the number oftransferred T cells compared with unimmunized mice (30). Max-well et al. also found that tight T cell-DC interactions were formedby coimmunization with LPS (30), which was recently shown tobe required for memory T cells (31). Thus, it is possible thatvaccination in the presence of immunostimulatory adjuvant in-duced Ag-specific memory T cells and the lack of APC activa-tion by absence of adjuvant induced T cell unresponsivenessbecause of lack of costimulation (32). We recently observedthat induction of IL-6 and glucocorticoid-induced TNF-receptorligand in APC restored the function of Ag-specific T cells fromsuppression by regulatory T cells (33). In addition, we havedemonstrated that high avidity CD4� T cells were more sus-ceptible to suppression by regulatory T cells than low avidityCD4� T cells (8). Thus, it is possible that TLR signaling pro-vided by the adjuvant blocked the suppression of MAGE-A3-specific CD4� T cells with high affinity TCR by regulatory Tcells. Analyses of more patients who were vaccinated withMAGE-A3 protein in the presence or absence of adjuvant arerequired for a general understanding of the effects of adjuvanton the avidity of T cells and the mechanism of unresponsive-ness in patients immunized with MAGE-A3 protein alone.
Many Ags have been discovered and shown to be highly ex-pressed in various types of tumors with limited expression in nor-mal tissues (34). Many of these Ags were found to be immuno-genic to induce spontaneous Ab and T cell responses in cancerpatients with Ag-expressing tumors. These observations indicatethat T cell precursors against tumor Ags are present in humansand tumor Ags produced by tumors may activate and expandthem. However, little is known about the frequency and func-tion of preexisting tumor Ag-specific T cells in healthy indi-viduals and cancer patients without spontaneous immunity. Us-ing presensitization by synthetic tumor Ag peptides andisolation of specific cells with CD154 expression, it becomespossible to evaluate frequency of CD4� T cell precursors forany tumor Ag protein. It will be important to compare the fre-quency of CD4� T cell precursors against various tumor Ags inhealthy individuals to determine the most interesting target Agsfor human cancer vaccines.
4807The Journal of Immunology
by guest on June 13, 2018http://w
ww
.jimm
unol.org/D
ownloaded from

AcknowledgmentsWe thank E. Ritter for the measurement of MAGE-A3-specific serum Abtiter in cancer patients.
DisclosuresThe authors have no financial conflict of interest.
References1. Jager, E., Y. Nagata, S. Gnjatic, H. Wada, E. Stockert, J. Karbach, P. R. Dunbar,
S. Y. Lee, A. Jungbluth, D. Jager, et al. 2000. Monitoring CD8 T cell responsesto NY-ESO-1: correlation of humoral and cellular immune responses. Proc. Natl.Acad. Sci. USA 97: 4760–4765.
2. Gnjatic, S., D. Atanackovic, E. Jager, M. Matsuo, A. Selvakumar, N. K. Altorki,R. G. Maki, B. Dupont, G. Ritter, Y. T. Chen, A. Knuth, and L. J. Old. 2003.Survey of naturally occurring CD4� T cell responses against NY-ESO-1 in can-cer patients: correlation with antibody responses. Proc. Natl. Acad. Sci. USA 100:8862–8867.
3. Kubuschok, B., F. Neumann, R. Breit, M. Sester, C. Schormann, C. Wagner,U. Sester, F. Hartmann, M. Wagner, K. Remberger, M. Schilling, andM. Pfreundschuh. 2006. Naturally occurring T-cell response against mutated p21ras oncoprotein in pancreatic cancer. Clin. Cancer Res. 12: 1365–1372.
4. Ayyoub, M., D. Rimoldi, P. Guillaume, P. Romero, J. C. Cerottini, D. Valmori,and D. Speiser. 2003. Tumor-reactive, SSX-2-specific CD8� T cells are selec-tively expanded during immune responses to antigen-expressing tumors in mel-anoma patients. Cancer Res. 63: 5601–5606.
5. Davis, I. D., W. Chen, H. Jackson, P. Parente, M. Shackleton, W. Hopkins,Q. Chen, N. Dimopoulos, T. Luke, R. Murphy, et al. 2004. Recombinant NY-ESO-1 protein with ISCOMATRIX adjuvant induces broad integrated antibodyand CD4� and CD8� T cell responses in humans. Proc. Natl. Acad. Sci. USA101: 10697–10702.
6. Jager, E., J. Karbach, S. Gnjatic, A. Neumann, A. Bender, D. Valmori,M. Ayyoub, E. Ritter, G. Ritter, D. Jager, et al. 2006. Recombinant vaccinia/fowlpox NY-ESO-1 vaccines induce both humoral and cellular NY-ESO-1-spe-cific immune responses in cancer patients. Proc. Natl. Acad. Sci. USA 103:14453–14458.
7. Odunsi, K., F. Qian, J. Matsuzaki, P. Mhawech-Fauceglia, C. Andrews,E. W. Hoffman, L. Pan, G. Ritter, J. Villella, B. Thomas, et al. 2007. Vaccinationwith an NY-ESO-1 peptide of HLA class I/II specificities induces integratedhumoral and T cell responses in ovarian cancer. Proc. Natl. Acad. Sci. USA 104:12837–12842.
8. Nishikawa, H., F. Qian, T. Tsuji, G. Ritter, L. J. Old, S. Gnjatic, and K. Odunsi.2006. Influence of CD4�CD25� regulatory T cells on low/high-avidity CD4� Tcells following peptide vaccination. J. Immunol. 176: 6340–6346.
9. Nishikawa, H., E. Jager, G. Ritter, L. J. Old, and S. Gnjatic. 2005. CD4� CD25�
regulatory T cells control the induction of antigen-specific CD4� helper T cellresponses in cancer patients. Blood 106: 1008–1011.
10. Elkord, E., D. J. Burt, J. W. Drijfhout, R. E. Hawkins, and P. L. Stern. 2008.CD4� T-cell recognition of human 5T4 oncofoetal antigen: implications for ini-tial depletion of CD25� T cells. Cancer Immunol. Immunother. 57: 833–847.
11. Danke, N. A., D. M. Koelle, C. Yee, S. Beheray, and W. W. Kwok. 2004.Autoreactive T cells in healthy individuals. J. Immunol. 172: 5967–5972.
12. Hasegawa, K., Y. Noguchi, F. Koizumi, A. Uenaka, M. Tanaka, M. Shimono,H. Nakamura, H. Shiku, S. Gnjatic, R. Murphy, et al. 2006. In vitro stimulationof CD8 and CD4 T cells by dendritic cells loaded with a complex of cholesterol-bearing hydrophobized pullulan and NY-ESO-1 protein: identification of a newHLA-DR15-binding CD4 T-cell epitope. Clin. Cancer Res. 12: 1921–1927.
13. Van den Eynde, B. J., and P. van der Bruggen. 1997. T cell defined tumorantigens. Curr. Opin. Immunol. 9: 684–693.
14. Marturano, J., R. Longhi, V. Russo, and M. P. Protti. 2008. Endosomal proteasesinfluence the repertoire of MAGE-A3 epitopes recognized in vivo by CD4� Tcells. Cancer Res. 68: 1555–1562.
15. Manici, S., T. Sturniolo, M. A. Imro, J. Hammer, F. Sinigaglia, C. Noppen,G. Spagnoli, B. Mazzi, M. Bellone, P. Dellabona, and M. P. Protti. 1999. Mel-anoma cells present a MAGE-3 epitope to CD4� cytotoxic T cells in associationwith histocompatibility leukocyte antigen DR11. J. Exp. Med. 189: 871–876.
16. Atanackovic, D., N. K. Altorki, E. Stockert, B. Williamson, A. A. Jungbluth,E. Ritter, D. Santiago, C. A. Ferrara, M. Matsuo, A. Selvakumar, et al. 2004.Vaccine-induced CD4� T cell responses to MAGE-3 protein in lung cancer pa-tients. J. Immunol. 172: 3289–3296.
17. Atanackovic, D., N. K. Altorki, Y. Cao, E. Ritter, C. A. Ferrara, G. Ritter,E. W. Hoffman, C. Bokemeyer, L. J. Old, and S. Gnjatic. 2008. Booster vacci-nation of cancer patients with MAGE-A3 protein reveals long-term immunolog-ical memory or tolerance depending on priming. Proc. Natl. Acad. Sci. USA 105:1650–1655.
18. Vantomme, V., C. Dantinne, N. Amrani, P. Permanne, D. Gheysen, C. Bruck,G. Stoter, C. M. Britten, U. Keilholz, C. H. Lamers, et al. 2004. Immunologicanalysis of a phase I/II study of vaccination with MAGE-3 protein combined withthe AS02B adjuvant in patients with MAGE-3-positive tumors. J. Immunother.27: 124–135.
19. Atanackovic, D., M. Matsuo, E. Ritter, G. Mazzara, G. Ritter, E. Jager, A. Knuth,L. J. Old, and S. Gnjatic. 2003. Monitoring CD4� T cell responses against viraland tumor antigens using T cells as novel target APC. J. Immunol. Methods 278:57–66.
20. Chattopadhyay, P. K., J. Yu, and M. Roederer. 2005. A live-cell assay to detectantigen-specific CD4� T cells with diverse cytokine profiles. Nat. Med. 11:1113–1117.
21. Cousins, D. J., T. H. Lee, and D. Z. Staynov. 2002. Cytokine coexpression duringhuman Th1/Th2 cell differentiation: direct evidence for coordinated expression ofTh2 cytokines. J. Immunol. 169: 2498–2506.
22. Martin, M., S. M. Michalek, and J. Katz. 2003. Role of innate immune factors inthe adjuvant activity of monophosphoryl lipid A. Infect. Immun. 71: 2498–2507.
23. Sharma, P., D. F. Bajorin, A. A. Jungbluth, H. Herr, L. J. Old, and S. Gnjatic.2008. Immune responses detected in urothelial carcinoma patients after vaccina-tion with NY-ESO-1 protein plus BCG and GM-CSF. J. Immunother. 31:849–857.
24. Valmori, D., N. E. Souleimanian, V. Tosello, N. Bhardwaj, S. Adams, D. O’Neill,A. Pavlick, J. B. Escalon, C. M. Cruz, A. Angiulli, et al. 2007. Vaccination withNY-ESO-1 protein and CpG in Montanide induces integrated antibody/Th1 re-sponses and CD8 T cells through cross-priming. Proc. Natl. Acad. Sci. USA 104:8947–8952.
25. Uenaka, A., H. Wada, M. Isobe, T. Saika, K. Tsuji, E. Sato, S. Sato, Y. Noguchi,R. Kawabata, T. Yasuda, et al. 2007. T cell immunomonitoring and tumor re-sponses in patients immunized with a complex of cholesterol-bearing hydropho-bized pullulan (CHP) and NY-ESO-1 protein. Cancer Immun. 7: 9.
26. Wang, X. F., W. M. Cohen, F. A. Castelli, C. Almunia, B. Lethe,S. Pouvelle-Moratille, G. Munier, D. Charron, A. Menez, H. M. Zarour, et al.2007. Selective identification of HLA-DP4 binding T cell epitopes encoded bythe MAGE-A gene family. Cancer Immunol. Immunother. 56: 807–818.
27. Valmori, D., N. E. Souleimanian, C. S. Hesdorffer, L. J. Old, and M. Ayyoub.2005. Quantitative and qualitative assessment of circulating NY-ESO-1 specificCD4� T cells in cancer-free individuals. Clin. Immunol. 117: 161–167.
28. Godefroy, E., Y. Wang, N. E. Souleimanian, L. Scotto, S. Stevanovic,Y. T. Chen, D. Valmori, and M. Ayyoub. 2007. Assessment of CD4� T cellsspecific for the tumor antigen SSX-1 in cancer-free individuals. Cancer Immunol.Immunother. 56: 1183–1192.
29. Hunder, N. N., H. Wallen, J. Cao, D. W. Hendricks, J. Z. Reilly, R. Rodmyre,A. Jungbluth, S. Gnjatic, J. A. Thompson, and C. Yee. 2008. Treatment of met-astatic melanoma with autologous CD4� T cells against NY-ESO-1. N. Engl.J. Med. 358: 2698–2703.
30. Maxwell, J. R., R. J. Rossi, S. J. McSorley, and A. T. Vella. 2004. T cell clonalconditioning: a phase occurring early after antigen presentation but before clonalexpansion is impacted by Toll-like receptor stimulation. J. Immunol. 172:248–259.
31. Scholer, A., S. Hugues, A. Boissonnas, L. Fetler, and S. Amigorena. 2008. In-tercellular adhesion molecule-1-dependent stable interactions between T cells anddendritic cells determine CD8� T cell memory. Immunity 28: 258–270.
32. Bachmann, M. F., D. E. Speiser, T. W. Mak, and P. S. Ohashi. 1999. Absence ofco-stimulation and not the intensity of TCR signaling is critical for the inductionof T cell unresponsiveness in vivo. Eur. J. Immunol. 29: 2156–2166.
33. Nishikawa, H., T. Tsuji, E. Jager, G. Briones, G. Ritter, L. J. Old, J. E. Galan,H. Shiku, and S. Gnjatic. 2008. Induction of regulatory T cell-resistant helperCD4� T cells by bacterial vector. Blood 111: 1404–1412.
34. Van den Eynde, B. J., and T. Boon. 1997. Tumor antigens recognized by Tlymphocytes. Int. J. Clin. Lab. Res. 27: 81–86.
4808 CHARACTERIZATION OF PREEXISTING MAGE-A3-SPECIFIC CD4 T CELLS
by guest on June 13, 2018http://w
ww
.jimm
unol.org/D
ownloaded from