characterization of permanent deformation mondher neifar, hervé di benedetto, berthe dongmo...
TRANSCRIPT

Characterization of
Permanent deformation
Mondher Neifar, Hervé Di Benedetto, Berthe Dongmo
Berthe-Julienne DONGMO-ENGELAND
NABin Conferense - 26. october 2004 .
2
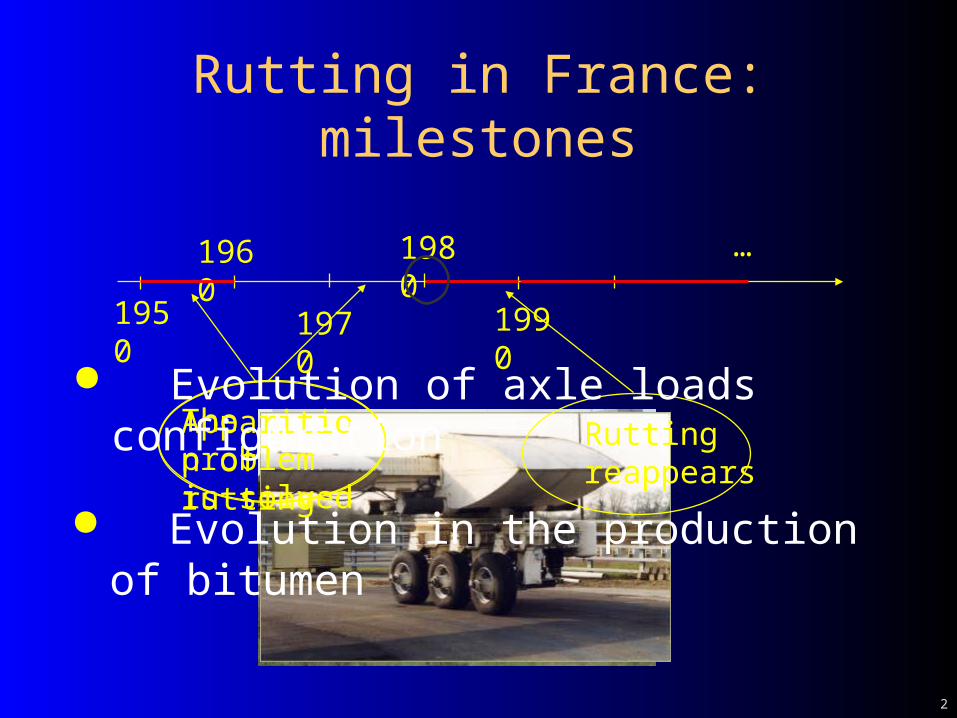
Evolution in the production of bitumen
Rutting in France: milestones
Apparition of ruttingThe problem is solved
Rutting reappears
Evolution of axle loads configuration
1950
1960 1980
1970 1990
…

3
Bituminous layers
Origins of rutting in bituminous roads
Arase de terrassementPlate –forme support de chaussée Accotement
Partie supérieure des terrassements
1m
RoulementLiaison
Base
Fondation
Couches de surface
Couches d’assise
Couche de forme
Sol support
Unbound layers
15 to 50 cm

4
Homogeneous test rheological model Measure both “large” (10-2) permanent
deformation and “small” (10-6) cyclic deformation
complex modulus
Aim

5
Triaxial test on bituminous mixesTest developed
h=12cm d=8cm

6
Triaxial test on bituminous mixes
High resolution
A mechanical system to move axial targets
Test developed
Temperature regulation

7
Stress path history

8
Type of loading
Cycles & rest periods
max
t
Time (s)
Stress

9
)N( sin*)N()N( (N))N,( 0 axaxttt av
axaxax
0,340
0,345
0,350
0,355
0,360
0,365
0,370
0,375
0,380
0,385
0 0,5 1 1,5 2
Time (s)
Axi
al s
trai
n (%
)
approched signal measured signal
0
0,1
0,2
0,3
0,4
0,5
0,6
0,7
0 0,5 1 1,5 2
Time (s)
Stre
ss (M
Pa) 1
Great strain evolution
Possible to obtain Complex modulus
0<t<2/fr
Experimental
Cycle N & N+1

10
0
0,5
1
1,5
2
2,5
3
3,5
0 100000 200000 300000 400000 500000 600000
Time (s)
Axia
l str
ain
(%
)
Compression and
tension type tests
Experimental
max
t
T = 25°C; max = 0,4 Mpa; f = 1Hz
Stress
Time (s)
Rest periods
Cyclic loading periods

11
0
0.5
1
1.5
2
2.5
3
3.5
0 5000 10000 15000
Number of cycles
Ax
ial s
tra
in (
%)
0.3%
Cumulated number of cycles
0
0.5
1
1.5
2
2.5
3
3.5
0 100000 200000 300000 400000 500000 600000
Equiv alent number of cycles
Ax
ial
str
ain
(%
)
T = 25°C - f = 1 Hz max = 0,4 MPa
Strain-number of cycles Experimental
T = 25°C; max = 0,4 Mpa; f = 1Hz

12
0,00
0,50
1,00
1,50
2,00
2,50
3,00
3,50
4,00
0 20000 40000 60000 80000 100000 120000
Cycle number
Per
man
ent d
efor
mat
ion
(%)
Phase I Phase II Phase III
General curve for continuous loading
max
t
Experimental
Information in the linear domain (LVE)
Small strainmeasured
T = 35°C; max = 0,4 Mpa; f = 1Hz
13
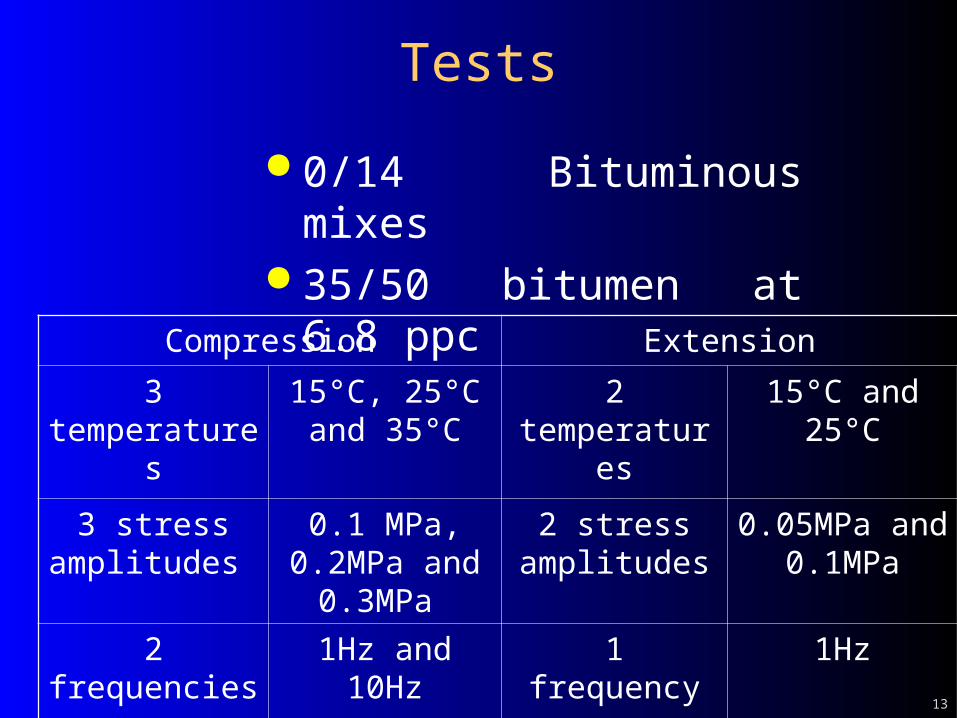
Tests
Compression Extension
3 temperatures 15°C, 25°C and 35°C
2 temperatures 15°C and 25°C
3 stress amplitudes
0.1 MPa, 0.2MPa and
0.3MPa
2 stress amplitudes
0.05MPa and 0.1MPa
2 frequencies 1Hz and 10Hz 1 frequency 1Hz
0/14 Bituminous mixes 35/50 bitumen at 6.8 ppc

14
Results
15
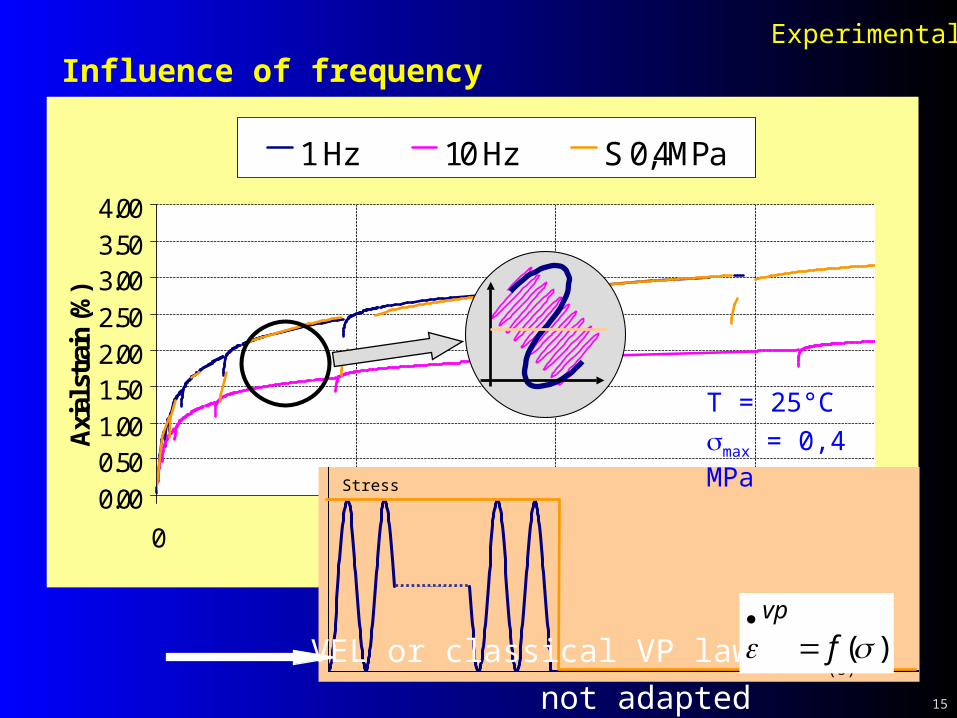
0.000.501.001.502.002.503.003.504.00
0 5000 10000 15000Time (s)
Axi
al s
trai
n (%
)
1 Hz 10 Hz S 0,4MPa
Influence of frequencyExperimental
Stress
Time (s)
T = 25°C
max = 0,4 MPa
VEL or classical VP laws
not adapted
)( fvp

16
0,00
2,00
4,00
6,00
8,00
10,00
12,00
0 50000 100000 150000 200000 250000 300000 350000 400000
Number of Cycles
Axi
al s
tra
in (
%)
15°C-1Hz-0,1MPa 15°C-10Hz-0,1MPa 15°C-1Hz-0,2MPa
15°C-10Hz-0,2MPa 15°C-1Hz-0,3MPa 15°C-10Hz-0,3MPa
25°C-10Hz-0,1MPa 25°C-1Hz-0,2MPa 25°C-10Hz-0,2MPa
25°C-1Hz-0,3MPa 35°C-10Hz-0,1MPa 35°C-1Hz-0,2MPa
35°C-10Hz-0,2MPa 35°C-1Hz-0,3MPa 35°C-10Hz-0,3MPa
Experimental
Tests in compression
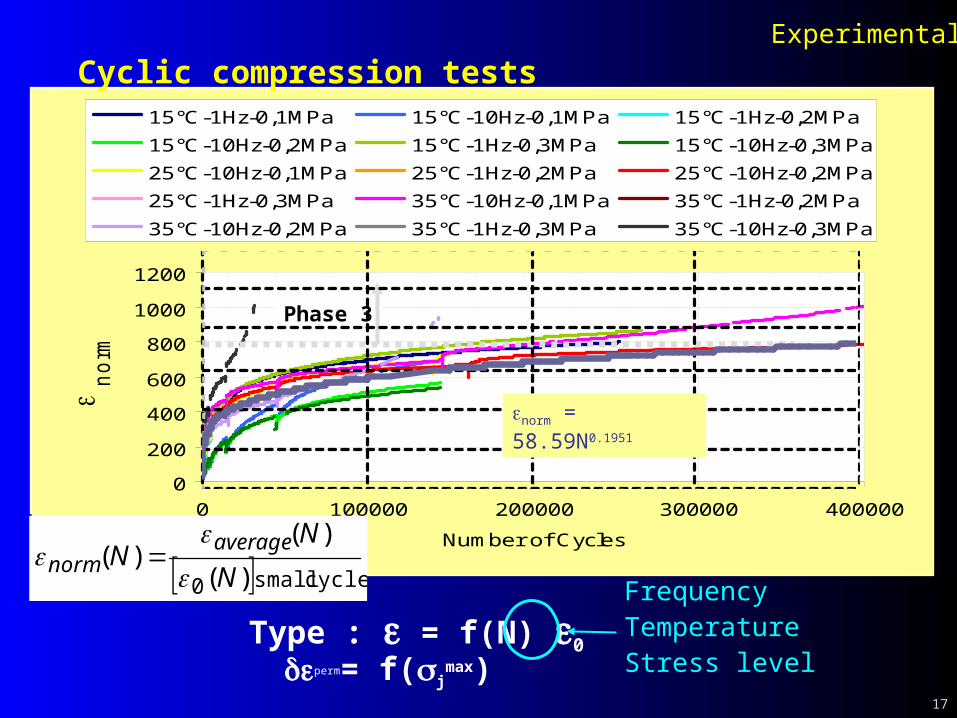
17
0
200
400
600
800
1000
1200
0 100000 200000 300000 400000
Number of Cycles
n
orm
15°C-1Hz-0,1MPa 15°C-10Hz-0,1MPa 15°C-1Hz-0,2MPa
15°C-10Hz-0,2MPa 15°C-1Hz-0,3MPa 15°C-10Hz-0,3MPa
25°C-10Hz-0,1MPa 25°C-1Hz-0,2MPa 25°C-10Hz-0,2MPa
25°C-1Hz-0,3MPa 35°C-10Hz-0,1MPa 35°C-1Hz-0,2MPa
35°C-10Hz-0,2MPa 35°C-1Hz-0,3MPa 35°C-10Hz-0,3MPa
Phase 3
Type : = f(N) 0
FrequencyTemperatureStress level
Experimental
Cyclic compression tests
norm = 58.59N0.1951
cycles small0 )(
)()(
N
NN
averagenorm
perm= f(jmax)

18
CompressionTraction
-20
-15
-10
-5
0
5
-10 -5 0 5 10 15 20 25
v(%
)
q(%)
avrad
avaxq
Volume variation
avrad
avaxv 2
Tension Compression
-0.1
-0.05
0
0.05
0.1
0.15
0.00 0.20 0.40 0.60 0.80 1.00
q(%)

19
0
2000
4000
6000
8000
10000
0 5000 10000 15000 20000
Number of cycles
lE*l
(MPa
)
15°C 25°C 35°C
2300
2800
3300
4600 5600 6600
Complex modulus evolution
f = 1Hz max = 0,4 MPa
cycles small0
max
)(NE

20
Conclusion New test
Permanent deformation Small cycle properties
Results for compression and extension tests Classical laws not adapted
Cyclic effect Suitable developments
Prediction

21
THANK YOU

Modelling