characterization of mixed amorphous/crystalline cerium oxide supported on sio2
TRANSCRIPT

Solid State Ionics 110 (1998) 83–93
Characterization of mixed amorphous /crystalline cerium oxide1supported on SiO2
*Radu CraciunDepartment of Chemical Engineering, University of Pennsylvania Philadelphia, PA 19104, USA
Received 26 September 1997; accepted 18 March 1998
Abstract
Various analyses techniques were employed for characterization of mixed amorphous /crystalline CeO supported on SiO2 241catalysts prepared by incipient wetness using (i) Ce -ammonium nitrate (CeqN) aqueous solution, and by grafting using
41(ii) Ce -methoxyethoxide (CeqA) alcoholic solution. X-ray diffraction (XRD), temperature programmed reduction (TPR),and transmission electron microscopy-energy dispersive X-ray analysis (TEM-EDX) were used to obtain information aboutthe CeO dispersion and crystallinity supported on SiO . After calcination at 5008C, XRD analysis indicated formation of2 2
larger CeO crystallites on CeqN catalysts compared to CeqA catalysts. Catalysts calcination at 8008C led to a higher degree2
of crystallinity and larger particles of CeO compared with the catalysts calcined at 5008C. TEM electron diffraction2
revealed that ceria is present on CeqA catalysts mostly as an amorphous phase, whereas on CeqN catalysts as crystallineCeO . The CeO particle size calculated from XRD data, the TPR profile, and the XPS I /I intensity ratio, indicated a2 2 Ce3d Si2p
better ceria dispersion on the SiO support for CeqA than for CeqN catalysts. EPR data showed the presence of231paramagnetic Ce as defects in the CeO crystalline structure only in CeqN catalysts. XPS analysis indicated that cerium is2
41present on CeqN and CeqA catalysts surface as Ce . The observed differences between the CeqA and CeqN catalystsstructure were presented in correlation with activity data obtained from ethylbenzene oxidative dehydrogenation and COoxidation. 1998 Elsevier Science B.V. All rights reserved.
Keywords: CeO /SiO catalysts; XRD; XPS; TEM-EDX; EPR; TPR; Ethylbenzene oxidative dehydrogenation; CO oxidation2 2
1. Introduction in the last decades. Generally, the structural promo-tion effect was attributed to the cerium capability of
Cerium oxide has been employed extensively as a forming crystalline oxides with lattice defects whichcatalyst or as a textural and structural promoter for may act as catalytic active sites [2–4], whereas itssupported metal or metal oxide catalysts. In a recent textural promotion effect is given by the excellentreview, Trovarelli [1] summarized the catalytic prop- thermal and mechanical resistance which CeO2
erties and characterization studies reported for CeO confers to catalysts [2–15]. Pure ceria or ceria-2
promoted Al O or SiO were utilized as catalysts in2 3 2
various reactions such as CO oxidation or water-gas*Corresponding author. E-mail: [email protected] shift [7,8] and CH hydrogenolysis [16,17]; their useData were collected at Michigan State University, Department of 4
Chemistry, USA. in automotive catalytic converters, for example,
0167-2738/98/$19.00 1998 Elsevier Science B.V. All rights reserved.PI I : S0167-2738( 98 )00127-1
84 R. Craciun / Solid State Ionics 110 (1998) 83 –93
vender them as valuable catalysts [1,5,9–18]. Ceria ceria supported on SiO when various precursors and2
thermal treatments were applied for catalysts prepa-was found to act as a textural promoter when addedration. The crystalline nature and dispersion of CeOon a Fe O /Al O catalyst active in ethylbenzene 22 3 2 3
on the SiO support were investigated by TEM,dehydrogenation [19]. In this reaction, CeO helped 22
XRD, and TPR analyses. Additional informationto preserve catalyst surface area, pore size distribu-about the structure of supported CeO was providedtion and catalytic activity. 2
by electron paramagnetic resonance (EPR) and XPSCeria-promoted Rh, Pd or Pt supported on SiO2
analysis. The catalytic activity and selectivity ofcatalysts were found to be more active than theCeO /SiO catalysts in the oxidative dehydrogena-unpromoted catalysts [7,8,18,20–22]. In CO oxida- 2 2
tion of ethylbenzene and CO oxidation were summa-tion, Rh acted as a site for CO adsorption and ceriarized and presented in correlation with their bulk andprovided lattice oxygen necessary for CO forma-2
surface structure.tion. When supported on SiO , ceria has strongly2
influenced the microstructure of Rh and determined aslight increase in its catalytic activity for ethane
2. Experimentalhydrogenolysis [16,17]. The CeO /SiO structure2 2
showed significant changes only after exposure at2.1. Materialstemperatures higher than 6008C, either under O or2
under H [16,17,20]. When supported on ceria, Pt2
Catalysts were prepared by the impregnation of awas found to diffuse into ceria at room temperatureSiO support with Ce(NH ) (NO ) in water (Mal-under vacuum, while at elevated temperature it may 2 4 2 3 4
linckrodt Co.; catalysts designated as CeqN) andform Pt–Ce bonds. This encapsulation effect was notCe(O–C H –OCH ) (methoxyethoxide) 18–20%observed in the case of Pt supported on ceria-pro- 2 4 3 4
in methoxyethanol (Gelest Co.; catalysts designatedmoted SiO catalysts [21].2
as CeqA) precursors. The support consists of finelyImpregnation of SiO with Ce-acetylacetonate led2
ground ( , 230 mesh) silica-gel (Davison Chemicalto smaller ceria particles (1–3 nm) as compared toCo.), which was calcined in air at 5008C (8008C) forimpregnation with a Ce-nitrate precursor (5–9 nm)24 h, prior to impregnation. Standard CeO material[22]. In addition, previous studies on the influence of 2
was prepared by Ce(NH ) (NO ) calcination atthe cerium precursor used for preparation of ceria- 4 2 3 4
8008C. The cerium content in the catalysts corre-promoted g-Al O catalysts indicated that a cerium-2 3
sponds to a Ce/Si atomic ratio, q 5 0.08 (or ¯ 15%methoxyethoxide impregnation leads to more amor-by wt. CeO ). The impregnation techniques em-phous CeO deposits on the support [23,24]. X-ray 22
ployed for catalysts preparation were: (i) incipientphotoelectron spectroscopy (XPS) photoreduction41wetness, using Ce -nitrate (CeqN) at a pH 5 7, andstudies combined with information from transmission
41electron microscopy (TEM) and semi-quantitative (ii) ‘hot grafting’ using the Ce -methoxyethoxideX-ray diffraction (XRD) were used to prove the solution (CeqA) monitored under inert (Ar) atmos-formation of amorphous or small CeO crystallites phere with continuous mixing for 48 h, under reflux2
[23,24]. However, no reactivity data, such as tem- (80–858C). After impregnation, all catalyst samplesperature programmed reduction (TPR) or catalytic were dried at 1208C for 16 h and calcined in air atactivity correlated with the amorphous or small CeO 5008C or 8008C. The actual cerium concentrations in2
crystallites phase formed by grafting impregnation, the catalysts were confirmed by inductively coupledhave been reported previously. Because of its struc- plasma (ICP) analysis. The results showed a 610%tural characteristics, a high surface area SiO will error when compared to the cerium concentration2
interact differently with a highly reactive metal- calculated from the amount of precursor addedalkoxide compound, in comparison with the g- during preparation.Al O . It was shown that high temperature annealing2 3
of ceria before deposition of a novel metal (Pd, Pt or 2.2. MethodsRh) led to a significant decrease or total loss ofcatalysts activity [25,26]. Surface area measurements were performed using
This work reports the structural transformations of a Quanta-Chrome Quantasorb Jr. Sorption System.
R. Craciun / Solid State Ionics 110 (1998) 83 –93 85
Approximately 0.1 g of catalyst was outgassed in N reference was placed together with the catalyst2
at 1658C for 12 h, prior to adsorption measurements. samples into the quartz tube for accurate g-valueThe measurements were made using N partial determinations. Accordingly, the value for g was2 s
pressures in He of 0.05, 0.08, and 0.15 (N surface evaluated based on the relation (2) given below:22area 5 0.162 nm ) at liquid N temperature (77 K). g 5 g B /B [28]. X-ray photoelectron spectros-2 s ref ref s
The estimated error for surface area measurements is copy (XPS) analyses of the catalyst samples were65%. The TEM bright field images, EDX, and carried out using a Perkin-Elmer Physical Electronicselectron diffraction patterns images were recorded XPS 5400 spectrometer equipped with a hemispheri-with a Jeol 100CX II instrument equipped with an cal analyzer. Instrument control, data collection andX-ray analyzer for EDX analysis, at accelerating manipulation were performed with an Apollo 3500voltages of 120 V. Catalyst samples were deposited workstation, running a PHI ESCA version 3.0 soft-on a carbon-dusted copper grid coated with a holey ware. The standard Mg Ka X-ray source was usedfilm, and introduced into the analysis chamber on a for all samples analysis and was operated at 15 kV,beryllium grid holder. The catalyst particles above a 20 mA, and 300 W. The catalysts were mounted onhole of the holey film was chosen for analysis, in sample stubs using double sided tape and placed intoorder to avoid interference from the film structure. the analysis chamber for XPS analysis. The bindingEDX spectra were collected from the same spot energies for catalyst samples were referenced to thewhere the TEM electron diffraction patterns were Si peak (103.4 eV). XPS binding energies were2p
recorded. X-ray powder diffraction patterns were measured with a precision of 60.2 eV, or better. Theobtained with a Rigaku XRD diffractometer employ- reported XPS I /I values are the average ofCe3d Si2p
˚ing Cu Ka radiation (l 5 1.541838 A) and operated three consecutive analyses.at 45 kV and 100 mA. Diffraction patterns wereobtained using a scan rate of 0.5 deg/min with 1/2 2.3. Catalytic activitymm slits. Powdered samples were mounted on glassslides by pressing the powder into an indentation on Temperature-programmed reduction (TPR) pro-
¯one side of the slide. The mean crystallite size (d ) of files for the CeqN and CeqA catalysts were obtainedCeO particles was determined from XRD line using a classical U-shaped quartz reactor connected2
broadening measurements using the Scherrer equa- to a thermal conductivity detector (TCD) for H2¯tion: d 5 kl /bcosu, where l is the X-ray wave- consumption analysis. The temperatures were mea-
length, k is the particle shape factor, taken as 0.9 for sured with a Ni–CrNi thermoelement placed directlycubic particles, b is the full width at half maximum in the catalyst bed. A reducing agent mixture of 10%(fwhm) of the CeO k111l line (in radians), and u is H in N was passed over 0.1 g catalyst powder, at2 2 2
the diffraction angle [27]. Semi-quantitative X-ray 30 ml /min flow rate. The temperature intervaldiffraction data were obtained by comparing considered for analysis is from 258C to 9508C (108C/CeO k111l /SiO peak ratios measured for catalyst min heating rate). The TPR profiles are presented as2 2
samples with those of CeO and SiO physical H consumption (arbitrary units) versus temperature2 2 2
mixtures of known concentration. This method as- (8C).sumes that cerium addition does not disrupt the SiO Oxidative dehydrogenation of ethylbenzene (EB)2
structure, and consequently, does not affect the to styrene and CO oxidation were used as probeintensity of the SiO line. The error in this method reactions for catalyst testing. The two test reactions2
was estimated to be approximately 620%. Powder were chosen based on the difference in the reactioncatalyst samples were analyzed in quartz sample temperature of the processes. CO oxidation occurs attubes at 2 1608C using a Varian E4 spectrometer. low temperatures, around 200–3008C, whereas ethyl-The magnetic field was set at 3200 G with a benzene oxidative dehydrogenation takes place atmodulation frequency of 100 kHz. The g-factor ( g ) 450–5008C. Thus, significant variation in the CeO /s 2
for cerium-containing samples (B ) was determined SiO catalytic activity of the two processes iss 2
by comparison with the field value at resonance for expected. The reactions were performed in a vertical,a reference (B ), in this case the diphenylpicryl- fixed-bed quartz reactor equipped with a heatingref
hydrazyl radical (DPPH, g 5 2.0036 [28]). The system capable of controlling the temperature withref
86 R. Craciun / Solid State Ionics 110 (1998) 83 –93
618C accuracy. The EB oxidative dehydrogenation 3. Results and discussionwas run at three different temperatures (4508C,4758C, and 5008C), maintaining all the other con- 3.1. Catalyst textureditions constant (EB flow rate 5 0.13 ml /min, airflow rate 5 4.2 ml /min, atmospheric pressure, m 5 BET measurements for the neat support andcat
0.5 g). Product analyses were performed using a cerium catalysts (see Table 1) indicate a decrease of2Perkin Elmer 8500 gas chromatograph equipped with surface area for the SiO support from 300 m /g2
2FID detector and a Supelco packed column (GP 5% (precalcined at 5008C) to 210 m /g after calcinationSP-1200/1.75% bentone 34 on 100/120 supel- at 8008C. This process can be attributed to thecoport). EB conversions and selectivities were re- collapse of the silica porous structure at elevatedported as average of three consecutive tests. temperature, a process well known for high surface
CO oxidation was used to test the catalytic activity area materials [3,24]. Ceria was found capable toof the ceria-promoted silica, as well. The purpose of stabilize the g-Al O structure and to reduce the2 3
using this probe reaction in addition to ethylbenzene thermally induced surface area loss [3,13,14,24]. Inoxidative dehydrogenation, is to observe how the the case of ceria-silica, after cerium fixation, theCeqN and CeqA structural differences influence their surface area of the CeqN and CeqA catalysts cal-activity when used in low temperature processes cined at 5008C, remains unchanged. Since CeO is2
( ¯ 2008C). Rates for CO oxidation were measured known to have no significant porosity which mayby placing a thin catalyst pellet (to minimize diffu- influence the texture of the promoted catalyst, unlesssion effects) into a quartz reactor. The total pressure a special preparation technique is employed [29], itsin the reactor was maintained at atmospheric pres- contribution to the total surface area of CeqA andsure (P 5 5 torr). Air was used as oxidant (P 5 CeqN catalysts can be negligible. For catalystsCO O2
6 torr) and helium as carrier gas. Differential con- calcined at 8008C, a decrease in the surface area wasditions were maintained for all measurements, the observed; however, the magnitude of the decrease isCO conversions being typically less than 1%. Rates very much attenuated due to the textural promoterwere highly reproducible and remain constant over a effect of CeO .2
period of several hours. Product analysis (CO and2
CO) was performed with an on-line Hewlett-Packard 3.2. CeO crystallinity and dispersion2
5730A gas chromatograph, equipped with amethanator and FID detector. All the reported rates Information about the crystallinity of CeO de-2
have been normalized to the weight of the catalyst posited on SiO support was obtained from TEM and2
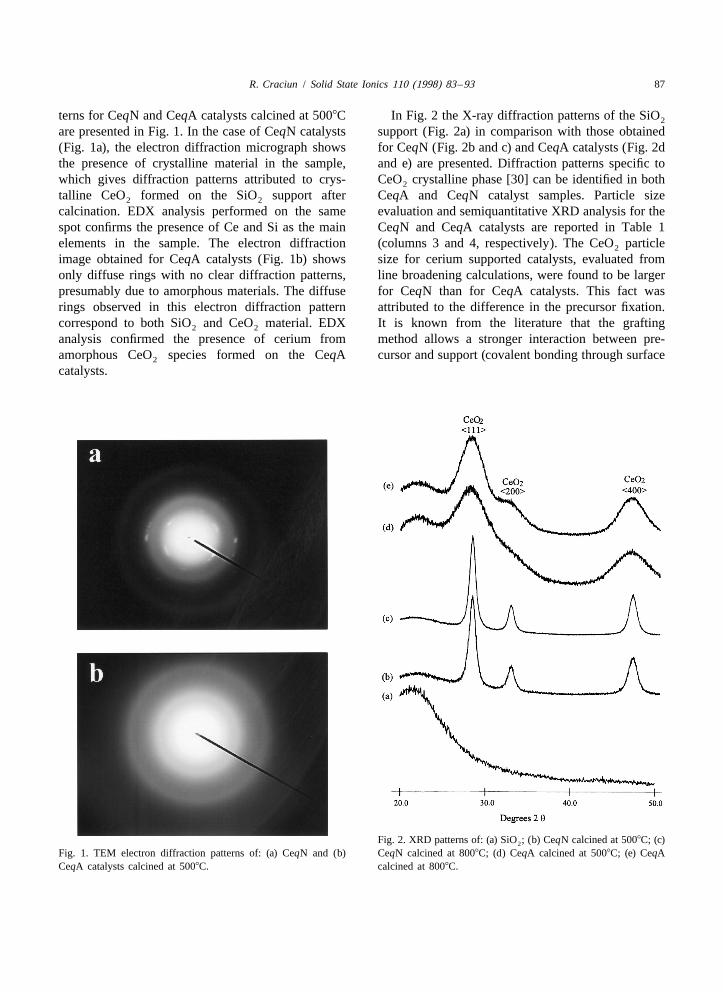
pellets. XRD analyses. The TEM electron diffraction pat-
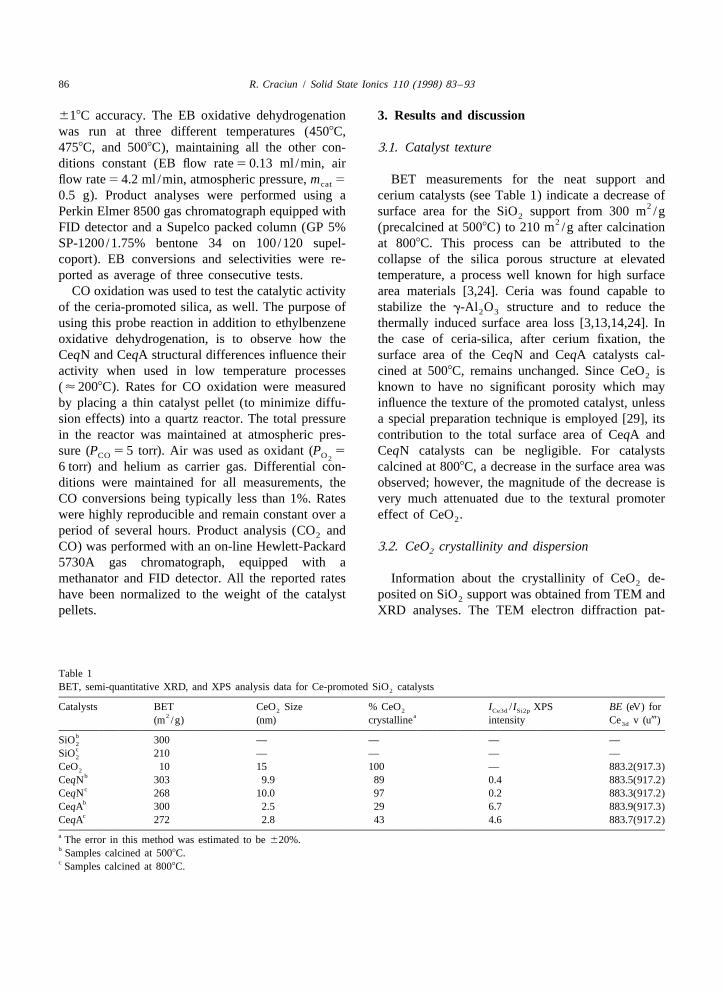
Table 1BET, semi-quantitative XRD, and XPS analysis data for Ce-promoted SiO catalysts2
Catalysts BET CeO Size % CeO I /I XPS BE (eV) for2 2 Ce3d Si2p2 a(m /g) (nm) crystalline intensity Ce v (u-)3d
bSiO 300 — — — —2cSiO 210 — — — —2
CeO 10 15 100 — 883.2(917.3)2bCeqN 303 9.9 89 0.4 883.5(917.2)cCeqN 268 10.0 97 0.2 883.3(917.2)bCeqA 300 2.5 29 6.7 883.9(917.3)cCeqA 272 2.8 43 4.6 883.7(917.2)
a The error in this method was estimated to be 620%.b Samples calcined at 5008C.c Samples calcined at 8008C.
R. Craciun / Solid State Ionics 110 (1998) 83 –93 87
terns for CeqN and CeqA catalysts calcined at 5008C In Fig. 2 the X-ray diffraction patterns of the SiO2
are presented in Fig. 1. In the case of CeqN catalysts support (Fig. 2a) in comparison with those obtained(Fig. 1a), the electron diffraction micrograph shows for CeqN (Fig. 2b and c) and CeqA catalysts (Fig. 2dthe presence of crystalline material in the sample, and e) are presented. Diffraction patterns specific towhich gives diffraction patterns attributed to crys- CeO crystalline phase [30] can be identified in both2
talline CeO formed on the SiO support after CeqA and CeqN catalyst samples. Particle size2 2
calcination. EDX analysis performed on the same evaluation and semiquantitative XRD analysis for thespot confirms the presence of Ce and Si as the main CeqN and CeqA catalysts are reported in Table 1elements in the sample. The electron diffraction (columns 3 and 4, respectively). The CeO particle2
image obtained for CeqA catalysts (Fig. 1b) shows size for cerium supported catalysts, evaluated fromonly diffuse rings with no clear diffraction patterns, line broadening calculations, were found to be largerpresumably due to amorphous materials. The diffuse for CeqN than for CeqA catalysts. This fact wasrings observed in this electron diffraction pattern attributed to the difference in the precursor fixation.correspond to both SiO and CeO material. EDX It is known from the literature that the grafting2 2
analysis confirmed the presence of cerium from method allows a stronger interaction between pre-amorphous CeO species formed on the CeqA cursor and support (covalent bonding through surface2
catalysts.
Fig. 2. XRD patterns of: (a) SiO ; (b) CeqN calcined at 5008C; (c)2
Fig. 1. TEM electron diffraction patterns of: (a) CeqN and (b) CeqN calcined at 8008C; (d) CeqA calcined at 5008C; (e) CeqACeqA catalysts calcined at 5008C. calcined at 8008C.
88 R. Craciun / Solid State Ionics 110 (1998) 83 –93
hydroxyl groups) [24], as compared to the incipientwetness method, where the precursor / support inter-action is mostly based on a physical adsorptionprocess [24,31]. The data from semiquantitativeXRD analysis indicate the percentage of ceriumpresent as crystalline CeO in the catalyst. Crys-2
talline CeO accounts for most of the ceria (.90%)2
in the CeqN catalysts, but for less than 30% in thecase of CeqA catalysts; consequently, the rest of thecerium is present either as amorphous phase or assmall crystallites (see Table 1). Relating these resultsto those obtained from TEM electron diffraction, itcan be stated that the rest of the cerium from CeqAcatalysts is present as amorphous cerium oxide.
41Furthermore, simple calcination of Ce -nitrate isknown to lead to crystalline CeO , in agreement with2
the results observed for CeqN catalysts [13,23,24].For CeqA, the amorphous CeO formation can be2
attributed to cerium alkoxide polymerization duringimpregnation, which favors formation of amorphousand/or small CeO particles after calcination. Previ-2
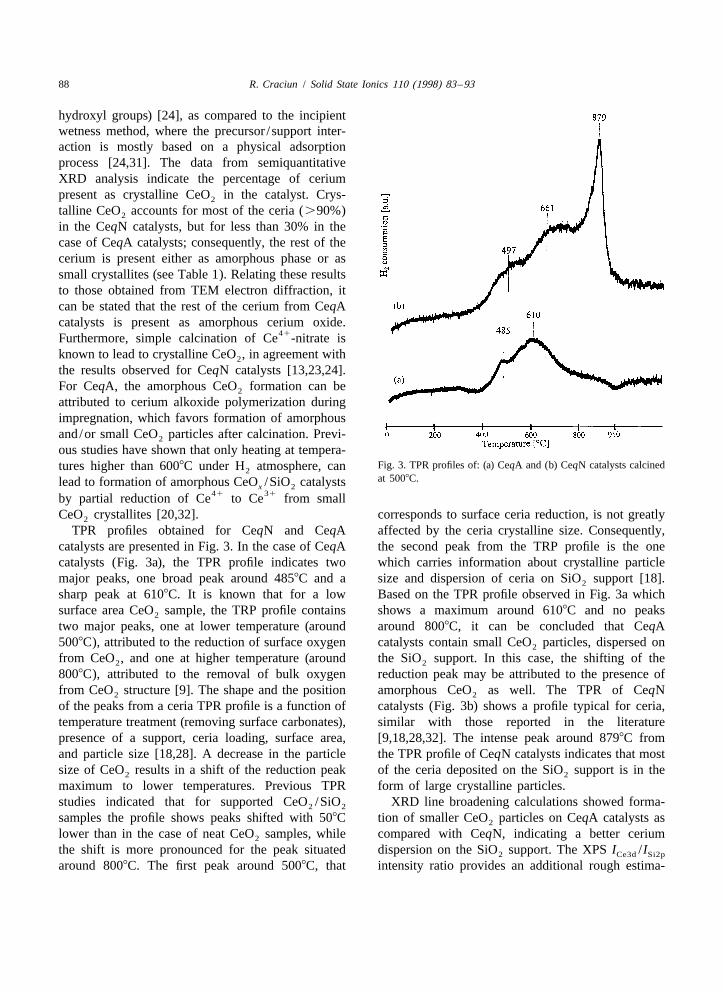
ous studies have shown that only heating at tempera-Fig. 3. TPR profiles of: (a) CeqA and (b) CeqN catalysts calcinedtures higher than 6008C under H atmosphere, can2at 5008C.lead to formation of amorphous CeO /SiO catalystsx 2
41 31by partial reduction of Ce to Ce from smallCeO crystallites [20,32]. corresponds to surface ceria reduction, is not greatly2
TPR profiles obtained for CeqN and CeqA affected by the ceria crystalline size. Consequently,catalysts are presented in Fig. 3. In the case of CeqA the second peak from the TRP profile is the onecatalysts (Fig. 3a), the TPR profile indicates two which carries information about crystalline particlemajor peaks, one broad peak around 4858C and a size and dispersion of ceria on SiO support [18].2
sharp peak at 6108C. It is known that for a low Based on the TPR profile observed in Fig. 3a whichsurface area CeO sample, the TRP profile contains shows a maximum around 6108C and no peaks2
two major peaks, one at lower temperature (around around 8008C, it can be concluded that CeqA5008C), attributed to the reduction of surface oxygen catalysts contain small CeO particles, dispersed on2
from CeO , and one at higher temperature (around the SiO support. In this case, the shifting of the2 2
8008C), attributed to the removal of bulk oxygen reduction peak may be attributed to the presence offrom CeO structure [9]. The shape and the position amorphous CeO as well. The TPR of CeqN2 2
of the peaks from a ceria TPR profile is a function of catalysts (Fig. 3b) shows a profile typical for ceria,temperature treatment (removing surface carbonates), similar with those reported in the literaturepresence of a support, ceria loading, surface area, [9,18,28,32]. The intense peak around 8798C fromand particle size [18,28]. A decrease in the particle the TPR profile of CeqN catalysts indicates that mostsize of CeO results in a shift of the reduction peak of the ceria deposited on the SiO support is in the2 2
maximum to lower temperatures. Previous TPR form of large crystalline particles.studies indicated that for supported CeO /SiO XRD line broadening calculations showed forma-2 2
samples the profile shows peaks shifted with 508C tion of smaller CeO particles on CeqA catalysts as2
lower than in the case of neat CeO samples, while compared with CeqN, indicating a better cerium2
the shift is more pronounced for the peak situated dispersion on the SiO support. The XPS I /I2 Ce3d Si2p
around 8008C. The first peak around 5008C, that intensity ratio provides an additional rough estima-
R. Craciun / Solid State Ionics 110 (1998) 83 –93 89
tion of the ceria dispersion, large values beingindicative of a high dispersion [33]. The results fromthe XPS analysis presented in Table 1 (column 5) arein agreement with the dispersion data from XRD andTPR analyses, showing a small value for I /ICe3d Si2p
in the case of CeqN catalysts and a large value forCeqA catalysts. XRD particle size, semiquantitativeXRD and XPS analyses indicated that calcination at8008C led to lower ceria dispersion and highercrystallinity (see Table 1). This fact suggests that thesmall crystallites formed on the silica surface aremobile enough to get together and form largecrystalline particles. However, in the case of theCeqA catalysts, the ceria particles formed afterannealing to 8008C reached only 2.8 nm, signifi-cantly lower than that formed on the CeqN catalysts(10 nm). The implication of this finding is that thegrafting method can be used as an alternative methodto prepare ceria-promoted noble metals with thecatalytic activity preserved at high temperature.Previous data on ceria-promoted Pd (Rh, Pt) showedthat annealing the ceria at high temperatures de-creased significantly the catalytic activity when used
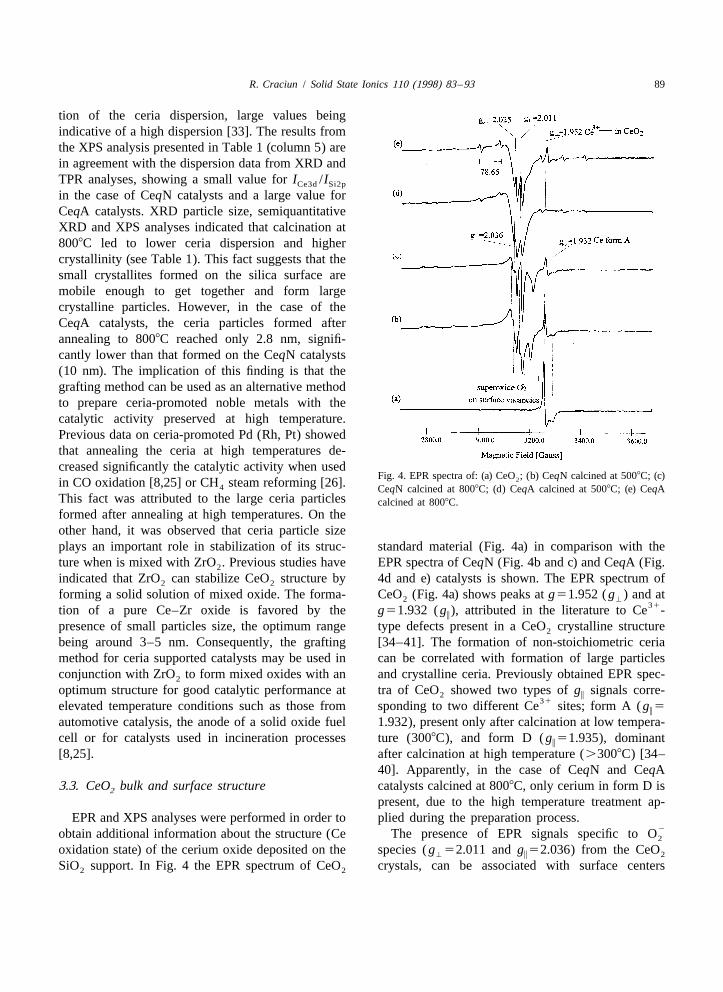
Fig. 4. EPR spectra of: (a) CeO ; (b) CeqN calcined at 5008C; (c)2in CO oxidation [8,25] or CH steam reforming [26].4 CeqN calcined at 8008C; (d) CeqA calcined at 5008C; (e) CeqAThis fact was attributed to the large ceria particles calcined at 8008C.formed after annealing at high temperatures. On theother hand, it was observed that ceria particle sizeplays an important role in stabilization of its struc- standard material (Fig. 4a) in comparison with theture when is mixed with ZrO . Previous studies have EPR spectra of CeqN (Fig. 4b and c) and CeqA (Fig.2
indicated that ZrO can stabilize CeO structure by 4d and e) catalysts is shown. The EPR spectrum of2 2
forming a solid solution of mixed oxide. The forma- CeO (Fig. 4a) shows peaks at g51.952 ( g ) and at2 '31tion of a pure Ce–Zr oxide is favored by the g51.932 ( g ), attributed in the literature to Ce -i
presence of small particles size, the optimum range type defects present in a CeO crystalline structure2
being around 3–5 nm. Consequently, the grafting [34–41]. The formation of non-stoichiometric ceriamethod for ceria supported catalysts may be used in can be correlated with formation of large particlesconjunction with ZrO to form mixed oxides with an and crystalline ceria. Previously obtained EPR spec-2
optimum structure for good catalytic performance at tra of CeO showed two types of g signals corre-2 i31elevated temperature conditions such as those from sponding to two different Ce sites; form A ( g 5i
automotive catalysis, the anode of a solid oxide fuel 1.932), present only after calcination at low tempera-cell or for catalysts used in incineration processes ture (3008C), and form D ( g 51.935), dominanti
[8,25]. after calcination at high temperature (.3008C) [34–40]. Apparently, in the case of CeqN and CeqA
3.3. CeO bulk and surface structure catalysts calcined at 8008C, only cerium in form D is2
present, due to the high temperature treatment ap-EPR and XPS analyses were performed in order to plied during the preparation process.
2obtain additional information about the structure (Ce The presence of EPR signals specific to O2
oxidation state) of the cerium oxide deposited on the species ( g 52.011 and g 52.036) from the CeO' i 2
SiO support. In Fig. 4 the EPR spectrum of CeO crystals, can be associated with surface centers2 2

90 R. Craciun / Solid State Ionics 110 (1998) 83 –93
identifiable as anion vacancies with extra electrons main 3d features at 883.2 eV (v), 889.2 eV (v0),5 / 2
[39,40]. Oxygen species adsorbed on the ceria and 899.4 eV (v-) and three main Ce3d features3 / 2
surface can have the spin oriented parallel or perpen- which appear at 901.1 eV (u), 907.7 eV (u0), anddicular to the magnetic field from the EPR instru- 917.3 eV (u-) [42–44]. The Ce XPS spectra of the3d
ment. The signals at g 52.011 and g 52.036 were CeqA catalysts were collected and analyzed after' i2 41attributed to O species bonded to surface Ce ions short X-ray exposure (less than 15 min), in order to2
41from non-stoichiometric ceria [34–41]. At these g avoid Ce photoreduction [23]. As observed fromvalues, oxygen nuclei are located in the CeO column 6 (Table 1), the BE values specific to Ce2 3d
structure, equidistant from the surface. With higher peaks (v and u-) for CeqN and CeqA catalysts are2temperature, other O species ( g 52.025) are similar to those observed for the standard CeO and2 i 2
formed in relation to the appearance of new vac- correspond to species containing cerium mostly as41 31ancies or other defects into the ceria structure Ce . No surface Ce was observed by XPS
[37,38]. The process which shows the vacancies analysis.formation can be represented by the followingreaction: 3.4. Catalytic activity data
21]O → O (g) 1 V 1 elattice 2 O2 Conversion and selectivity data from ethylbenzene
where O is the lattice oxygen near the surface of (EB) oxidative dehydrogenation on CeO /SiOlattice 2 2
a non-stoichiometric ceria crystalline cluster, O (g) catalysts at three different temperatures are presented2
is the molecular oxygen and V is an oxygen in Table 2. As observed, at low temperature (4508C)O
vacancy formed on the ceria surface [34,35]. The for both CeO /SiO catalysts the EB conversion2 2
large percentage of crystalline CeO phase formed in reached ¯39% and high selectivity in styrene22CeqN catalysts results in the observation of more O (57%), whereas on the neat SiO support the conver-2 2
species (Fig. 4b). A similar effect was observed for sion is high (51%), with low selectivity in styrenecatalysts calcined at 8008C (Fig. 4c and e). These (46%). It is known from previous studies that due totypes of oxygen species provide the oxygen storage the labile oxygen from its structure, CeO can2
properties to the catalyst, capable of generating the provide selectively the oxygen necessary for oxida-molecular oxygen necessary for oxidation reactions. tion system enhancing the catalytic activity of a
2Previous studies used successfully the O signal to noble metal (Pt, Pd, Rh) [1,7,8,12,13]. In addition, it2
monitor and evaluate the oxygen storage capabilitity was found that smaller CeO crystallites act better as2
and catalytic activity of ceria or ceria-promoted structural promoters than large clusters [24]. Theo-catalysts (e.g. Rh/CeO ) [39,40]. retical calculations of lattice energies in CeO single2 2
In Table 1 the binding energies (BE) of the v and crystal or small crystallites have indicated that lower31u- peaks from the Ce XPS spectra, specific to energy is required to form Ce O (Ce ) with the3d 2 3
41cerium species with Ce are presented. The XPS formation of oxygen vacancies, whereas in largeCe spectrum measured for CeO contains three clusters this process takes more energy [45,46]. On3d 2
Table 2Conversion and selectivity data from ethylbenzene oxidative dehydrogenation reaction
aCatalyst Ethylbenzene Selectivity (%)conversion (%)
Styrene Benzene Toluene
4508C 4758C 5008C 4508C 4758C 5008C 4508C 4758C 5008C 4508C 4758C 5008C
SiO 51 51 83 46 44 32 35 38 56 23 13 82
CeqA 39 58 80 57 44 34 23 32 28 22 22 30CeqN 37 54 75 55 42 31 17 19 39 6 16 22a CO, CO , CH and C H were the main components of the gas product; CO and CO are formed mainly on the ceria-promoted catalysts;2 4 2 4 2
only SiO shows C-black deposits.2
R. Craciun / Solid State Ionics 110 (1998) 83 –93 91
both CeqA and CeqN catalysts surface, cerium is41present as Ce -species (see XPS data from Table 1)
2and O surface superoxide species were identified in2
the EPR spectra (see Fig. 3). Considering the aboveinformation, the higher conversion and selectivityobserved for CeqA than for CeqN catalysts can becorrelated with the presence of small CeO crys-2
2 31tallites. In many previous studies Ce defectsobserved by EPR were correlated with the catalyticactivity of CeO [4,36,38]. In this case, the CeqA2
31catalysts which show no presence of Ce defects,have catalytic activity higher than that of CeqNcatalysts. From this observation, it can be concludedthat in this particular case, the catalytic activity is
31independent of the presence of Ce defects. Thehigh conversion observed on SiO was attributed to2
the presence of acid sites (mostly surface –OHgroups, easily identifiable in the IR spectrum [24]),which catalyzes the cleavage of the C (ethyl group)–C (benzene ring) rather then the partial oxidationprocess (C–H bond cleavage). The presence of CeO2
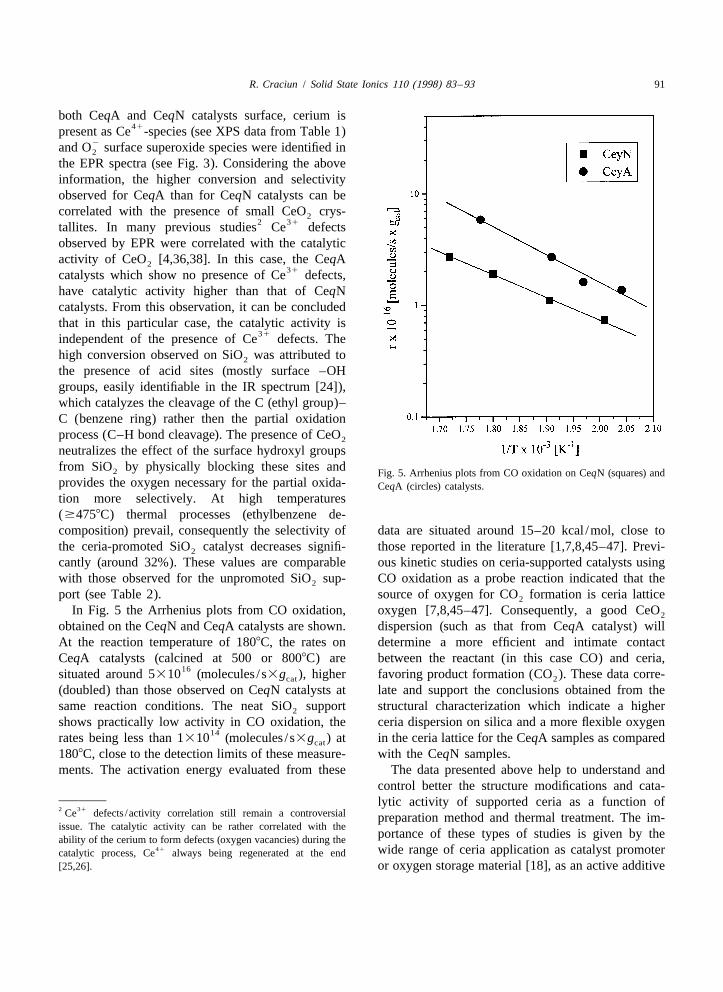
neutralizes the effect of the surface hydroxyl groupsfrom SiO by physically blocking these sites and2 Fig. 5. Arrhenius plots from CO oxidation on CeqN (squares) andprovides the oxygen necessary for the partial oxida- CeqA (circles) catalysts.tion more selectively. At high temperatures($4758C) thermal processes (ethylbenzene de-composition) prevail, consequently the selectivity of data are situated around 15–20 kcal /mol, close tothe ceria-promoted SiO catalyst decreases signifi- those reported in the literature [1,7,8,45–47]. Previ-2
cantly (around 32%). These values are comparable ous kinetic studies on ceria-supported catalysts usingwith those observed for the unpromoted SiO sup- CO oxidation as a probe reaction indicated that the2
port (see Table 2). source of oxygen for CO formation is ceria lattice2
In Fig. 5 the Arrhenius plots from CO oxidation, oxygen [7,8,45–47]. Consequently, a good CeO2
obtained on the CeqN and CeqA catalysts are shown. dispersion (such as that from CeqA catalyst) willAt the reaction temperature of 1808C, the rates on determine a more efficient and intimate contactCeqA catalysts (calcined at 500 or 8008C) are between the reactant (in this case CO) and ceria,
16situated around 5310 (molecules / s3g ), higher favoring product formation (CO ). These data corre-cat 2
(doubled) than those observed on CeqN catalysts at late and support the conclusions obtained from thesame reaction conditions. The neat SiO support structural characterization which indicate a higher2
shows practically low activity in CO oxidation, the ceria dispersion on silica and a more flexible oxygen14rates being less than 1310 (molecules / s3g ) at in the ceria lattice for the CeqA samples as comparedcat
1808C, close to the detection limits of these measure- with the CeqN samples.ments. The activation energy evaluated from these The data presented above help to understand and
control better the structure modifications and cata-lytic activity of supported ceria as a function of
2 31Ce defects /activity correlation still remain a controversial preparation method and thermal treatment. The im-issue. The catalytic activity can be rather correlated with the
portance of these types of studies is given by theability of the cerium to form defects (oxygen vacancies) during the41 wide range of ceria application as catalyst promotercatalytic process, Ce always being regenerated at the end
[25,26]. or oxygen storage material [18], as an active additive

92 R. Craciun / Solid State Ionics 110 (1998) 83 –93
for anode design in solid oxide fuel cell applications References[48], and oxygen permeable membranes based on
[1] A. Trovarelli, Catal. Rev. 38 (1996) 439.mixed ceria / transition metal oxide materials [49].[2] T.H. Fleisch, R.F. Hicks, A.T. Bell, J. Catal. 87 (1984) 398.[3] J.T. Kummer, Y. Yao, D. McKee, SAE Paper No. 760143,
1976.[4] T. Miki, T. Ogawa, M. Haneda, N. Kakuta, A. Ueno, S.4. Conclusions
Tateishi, S. Matsuura, M. Sato, J. Chem. Phys. 94 (1990)6464.
XRD and electron diffraction patterns obtained by [5] G. Nunan, H.J. Robota, M.J. Cohn, S.A. Bradley, in: A.TEM have identified crystalline CeO phase in the Crucq (Ed.), Catalysis and Automotive Pollution Control II,2
Elsevier, Amsterdam, 1991, p. 210.CeqN catalysts and mostly amorphous phase in the[6] Y.F. Yu-Yao, J.T. Kummer, J. Catal. 106 (1987) 307.CeqA catalysts. Larger ceria crystalline particles are[7] S.H. Oh, C.C. Eickel, J. Catal. 112 (1988) 543.
formed on the SiO in the case of CeqN than in the2 [8] T. Bunluesin, R.J. Gorte, G.W. Graham, Appl. Catal. B 14case CeqA catalysts. Air calcination at 8008C led to (1997) 105.a higher degree of crystallinity and larger CeO [9] H.C. Yao, Y.F. Yu-Yao, J. Catal. 86 (1984) 254.2
[10] J.K. Yang, W.E. Swartz, Spectrosc. Lett. 17 (1984) 331.particles. The particle size shown by XRD, the low[11] T. Yamaguchi, N. Ikeda, H. Hattony, K. Tanabe, J. Catal. 67temperature peak from the TPR profile, and the
(1981) 324.relative high XPS I /I intensity ratio indicate aCe3d Si2p [12] F. LeNormand, L. Hilaire, K. Kili, G. Krill, G. Maire, J.higher ceria dispersion on the SiO support in the Phys. Chem. 92 (1988) 2561.2
case of CeqA catalysts as compared with CeqN [13] J.Z. Shyu, K. Otto, W.L.H. Watkins, G.W. Graham, R.K.Belitz, H.S. Gandhi, J. Catal. 114 (1988) 23.catalysts. XPS analysis indicated only the presence
41 [14] G.W. Graham, H.-W. Jen, R.W. McCabe, Catal. Lett. 44of Ce -species on the surface of both CeqN and(1997) 185.
CeqA catalysts. EPR spectra showed the presence of [15] M. Haneda, T. Mizushima, N. Kakuta, A. Ueno, Y. Sato, S.31paramagnetic Ce only as defects in the large ceria Matsuura, K. Kasahara, M. Sato, Bull. Chem. Soc. Jpn. 66crystalline clusters (mostly in CeqN catalysts). The (1993) 1279.
2 [16] T. Chojnacki, K. Krause, L.D. Schmidt, J. Catal. 128 (1991)large signal corresponding to surface O shows the2161.presence of lattice oxygen capable of forming O2 [17] K.R. Krause, P. Schabes-Retchkiman, L.D. Schmidt, J. Catal.
molecules that further can be involved into a cata- 134 (1992) 204.lytic oxidation process. The high activity of ceria can [18] A. Trovarelli, C. Leitenburg, G. Dolcetti, J.L. Lorca, J. Catal.
2be correlated to the presence of O superoxide 151 (1995) 111.2[19] N. Dulamita, A. Pop, V. Corbeanu, Studia 29 (1984) 3.species observed on both types of catalysts (CeqA[20] L. Kepinski, M. Wolcyrz, Catal. Lett. 15 (1992) 329.and CeqN). No clear correlation was observed[21] Y. Zhou, M. Nakashima, J.M. White, J. Phys. Chem. 9231between the presence of Ce defects and the (1988) 812.
catalytic activity. CeqA catalysts have proven to be [22] A. Bensalem, F. Bozon-Verduraz, M. Delamar, G. Bugli,more selective toward styrene formation and led to Appl. Catal. 121 (1995) 81.
[23] P.W. Park, J.S. Ledford, Langmuir 12 (1996) 1794.higher rates in CO oxidation.[24] R. Craciun, Master Thesis, Michigan State University, East
Lansing, U.S.A., 1996.[25] T. Bunluesin, R.J. Gorte, G.W. Graham, Appl. Catal. B 15
(1998) 107.Acknowledgements[26] R. Craciun, B. Shereck, R.J. Gorte, Catal. Lett. (1998) in
press.The author is grateful for the assistance of Dr. [27] H.P. Klug, L.E. Alexander, X-ray Diffraction Procedures for
Raymond J. Gorte from Chemical Engineering De- Polycrystalline and Amorphous Materials, 1st ed., Wiley,New York, 1954.partment at University of Pennsylvania, of Dr. James
[28] M. Che, E. Giamello, in: B. Delmon, J.T. Yates (Eds.),E. Jackson and Dr. Cara Wieztager from MichiganStudies in Surface Science and Catalysis, vol. 57, Elsevier,
State University, and of Florin Patcas from Chemical Amsterdam, 1990, p. B265.Engineering Department, Lehrstuhl fur Technishe [29] L.A. Bruce, M. Hoang, A.E. Hughes, W. Turney, Appl.Chemie, Chemnitz, Germany. Catal. 134 (1996) 151.
R. Craciun / Solid State Ionics 110 (1998) 83 –93 93
[30] W.F. McClune, Powder diffraction file, Inorganic phases, [39] J. Soria, A. Martinez-Arias, J.C. Conesa, J. Chem. Soc.International center for diffraction data, Swarthmore, 1983, Faraday Trans. 91(11) (1995) 1669.pp. 730–731. [40] A. Martinez-Arias, J. Soria, J.C. Conesa, J. Catal. 168 (1997)
[31] M. Nabavi, O. Spalla, B.J. Cabane, Colloid Interface Sci. 364.160 (1993) 459. [41] N. Kaufherr, L. Mendelovici, M. Steinberg, J. Less-Common
[32] A. Laachir, V. Perrichon, A. Badri, J. Lamotte, E. Catherine, Metals 107 (1985) 281.J.C. Lavalley, J. ElFallah, L. Hilaire, F. Le Normand, E. [42] E. Wuilloud, B. Delley, W.D. Schneider, Y. Baer, Phys. Rev.Quemere, G.N. Sauvion, O. Touret, J. Chem. Soc. Faraday Lett. 53 (1984) 202.Trans. 87 (1991) 1601. [43] A. Fujimori, Phys. Rev. B 28 (1984) 2281.
[33] J.W. Niemantsverdriet, Spectroscopy in Catalysis, VCH, [44] E. Wuilloud, B. Delley, W.D. Schnieder, Y. Baer, Phys. Rev.Weinheim, 1993, p. 51. Lett. 53 (1984) 2519.
[34] M. Che, J.F.J. Kibblewhite, A.J. Tench, J. Chem. Soc. [45] T. Bunluesin, H. Cordatos, R.J. Gorte, J. Catal. 157 (1995)Faraday Trans. 69 (1973) 857. 222.
[35] Y.M. Chiang, E.B. Lavik, D.A. Blom, Nanostruct. Mat. 6 [46] H. Cordatos, T. Bunluesin, J. Stubenrauch, J.M. Vohs, R.J.(1997) 633. Gorte, J. Phys. Chem. 100 (1996) 785.
[36] X. Zhang, K.J. Klabunde, Inorg. Chem. 31 (1992) 1706. [47] H. Cordatos, D. Ford, R.J. Gorte, J. Phys. Chem. 100 (1996)[37] E. Abi-Aad, R. Bechara, J. Grimblot, A. Aboukais, Chem. 18128.
Mater. 5 (1993) 793. [48] E.S. Putna, J. Stuberauch, J.M. Vohs, R.J. Gorte, Langmuir[38] E. Abi-Aad, A. Bennani, J.P. Bonnelle, A. Aboukais, J. 11 (1995) 4832.
Chem. Soc. Faraday Trans. 91 (1995) 99. [49] T. Tsai, S.A. Barnett, Solid State Ionics 98 (1997) 191.