characterization of laser induced plasmas in nitrogen using an ungated spectrometer
TRANSCRIPT

Contents lists available at SciVerse ScienceDirect
Journal of Quantitative Spectroscopy &Radiative Transfer
Journal of Quantitative Spectroscopy & Radiative Transfer 118 (2013) 1–7
0022-40
http://d
n Corr
Technol
150080
E-m
lixiaohu
journal homepage: www.elsevier.com/locate/jqsrt
Characterization of laser induced plasmas in nitrogen usingan ungated spectrometer
Xiaohui Li a,b, Rongwei Fan a,b, Hai Zhu a,b, Xin Yu a,b, Deying Chen a,b,n
a National Key Laboratory of Science and Technology on Tunable Laser, Harbin Institute of Technology, Harbin 150080, Chinab Institute of Opto-electronics, Harbin Institute of Technology, Harbin 150080, China
a r t i c l e i n f o
Article history:
Received 12 July 2012
Received in revised form
16 October 2012
Accepted 14 January 2013Available online 23 January 2013
Keywords:
Laser induced plasma
Ungated
Excitation temperature
Electron number density
Spark energy
73/$ - see front matter & 2013 Elsevier Ltd.
x.doi.org/10.1016/j.jqsrt.2013.01.009
esponding author at: National Key Labora
ogy on Tunable Laser, Harbin Institute of
, China. Tel.: þ86 451 86403268; fax: þ86
ail addresses: [email protected],
[email protected] (X. Li), [email protected] (
a b s t r a c t
The effects of pressure and laser energy on the excitation temperature, electron number
density and spark energy of laser induced plasmas (LIPs) in nitrogen were investigated
using an ungated spectrometer with an electron multiplying charge-coupled device
(EMCCD) camera as the detector. The plasmas were generated in nitrogen of 1.2�104 Pa
to 1.0�105 Pa by 532 nm output of a 10 Hz Q-switched Nd:YAG laser with pulse energy
ranging from 20 mJ to 100 mJ. The excitation temperatures were found around 3 eV, and
varied little with pressure and laser energy. The electron number densities increased
from 5.8�1017 cm�3 to 4.7�1018 cm�3 when the pressure was increased from
1.2�104 Pa to 1.0�105 Pa, but varied little with laser energy. The spark energy
increased linearly with the input laser energy, and saturated at 35–60% of the input
energy. Comparisons with results of time-resolved measurements and of other authors
indicate that the ungated spectrometer can give reasonable results on excitation
temperature and electron number density of LIPs, although it suffers intrinsic limitations
involved with its inability to be time-resolved, and can serve as an option to lower
systematic cost for practical applications of laser induced plasmas.
& 2013 Elsevier Ltd. All rights reserved.
1. Introduction
Laser spark ignition has been investigated continu-ously in the last two decades because of its manypotential benefits in combustion systems, especially thelean-burn combustion systems characterized with lowerNOx exhaust emission and higher efficiency [1–7]. It hasseveral advantages over conventional electronic sparkignition systems. Firstly, the easy controllability of igni-tion position can simplify the engine and combustionchamber design. Secondly, laser spark ignition does nothave electrodes, thus reduces the heat loss toward com-bustion wall. Thirdly, the precise control of ignitiontiming makes it easier to synchronize the laser spark
All rights reserved.
tory of Science and
Technology, Harbin
451 86412753.
D. Chen).
ignition with optical diagnostic systems[7]. Finally, multi-point ignition can be easily realized to reduce the induc-tion time [3].
Since the laser induced plasmas (LIPs) play an impor-tant role in laser ignition processes, a few investigationson characterizations of LIPs in combustion gases havebeen performed recently. Phuoc and White experimen-tally measured the absorption and emission of LIPs in air,oxygen, nitrogen, and methane using the fundamentaland second harmonic generation of a Nd:YAG laser [8].Chen et al. studied the spatial and temporal evolution of1064 nm Nd:YAG laser induced plasmas in air, anddetermined the laser induced breakdown thresholds [9].Yalc)in et al. [10] investigated the effects of laser energy,background gas, humidity and presence of particles on theexcitation temperature and electron number density ofLIPs in atmospheric nitrogen. They concluded the experi-mental conditions investigated had little effects onthe excitation temperature and electron numberdensity. Glumac and Elliott [11] investigated the effects

X. Li et al. / Journal of Quantitative Spectroscopy & Radiative Transfer 118 (2013) 1–72
of ambient pressure in the range of 0.1 atm to 1 atm onthe properties of LIPs in air, including the size, excitationtemperature, electron number density, and absorption oflaser energy. They found that the temporal excitationtemperature profile remained constant down to 0.2 atm,while the electron number density decreased graduallywith reduced pressure. Kawahara et al. [12] obtainedspatially and temporally resolved spectra of laser inducedplasma in air with a framing ICCD camera and a Casse-grain mulit-fiber optics system, and confirmed the lowimpact of the spark energy on excitation temperature.
Most of the studies on characterization of LIPs in gasesperformed so far used spectrometers with expensiveintensified charge-coupled device (ICCD) camera as thedetector. However, in practical applications, the systemcost is also an important consideration. A spectrometerwith an ungated camera would cut down the system costgreatly. Ungated measurements have been conductedrecently in laser-induced breakdown spectroscopy (LIBS)and laser spark ignition applications by several groups,using smaller and cheaper spectrometers. Reasonableresults on equivalence ratio [13,14] and fuel concentra-tion [15] measurements in flames were obtained. In thispaper, we present the characterization of laser inducedplasmas in nitrogen of 1.2�104 Pa to 1.0�105 Pa withdifferent laser energies by using an ungated spectrometerwith an electron multiplying CCD (EMCCD) camera as thedetector. The effects of pressure and laser energy on theexcitation temperature, electron number density, andspark energy of the LIPs are investigated, and the applic-ability and limitations of ungated spectrometer in thecharacterization of LIPs are also discussed.
2. Experimental
The schematic of the experimental apparatus is shownin Fig. 1. Laser induced plasmas were generated using a25 mm, f¼150 mm BK7 plano-convex lens to focus thesecond harmonic generation (532 nm, �7 ns) of a 10 Hz
f=1
f=150mm
Continuum Nd:YAG
Shamrok SR750 EMC
Energy meter
PMT
Q-switch
Fig. 1. Schematic of the e
Q-switched Nd:YAG laser (Precision II 9010, Continuum)at the center of the gas chamber. The laser can provide532 nm output with pulse energy of up to 1 J. In themeasurements presented here, the laser pulse energy wasvaried from 20 mJ to 100 mJ. Pure nitrogen (99.9%) wasfilled into the chamber to the specific pressure. Thepressures were varied from 1.2�104 Pa to 1.0�105 Pa.The spectra of the LIPs were collected in the directionperpendicular to the direction of laser propagationto avoid the impacts of scattered laser radiation. Theplasma was imaged 1:1 onto the fiber head by a 50 mm,f¼100 mm quartz biconvex lens, and then coupled intothe entrance slit of a 0.75 m monochromator (ShamrockSR-750, Andor). There are two detectors mounted on themonochromator: one electron multiplying CCD (EMCCD)camera (Newton DU971P, Andor), and one Andor fast (risetime o2 ns) photomultiplier tube (PMT). There is a foldmirror near the monochromator exit slit to switchbetween the two detectors. The EMCCD camera utilizes a1600�400 array of 16 mm�16 mm pixels each ofwhich can be multiplied on the sensor before readout.The camera can be thermoelectrically cooled down to�100 1C to minimize dark currents. The entrance slitwidth was set to 10 mm throughout the measurements.With a 1200 g/mm, 1000 nm blazed grating, the instru-mental width of the monochromator was determined as0.072 nm by measuring the linewidth (full-width-at-half-maximum, FWHM) of the emissions of a low pressuremercury hollow cathode lamp. The narrowest gatewidththe EMCCD camera can be set is 670 ms, which is muchlonger than the typical lifetime of LIPs in gases. For themeasurements presented here, the gatewidth for EMCCDcamera was fixed to 700 ms. The EMCCD camera wassynchronized to the plasma radiation through the externaltrigger provided by the Q-switch of the Nd:YAG laser. Thespectra were collected using the software Solis (version4.11.30001.0, Andor), and typically 500 times of accumu-lation was processed to improve the signal-to-noise ratio(SNR). For comparison, time-resolved measurements were
00mm
Energy meter
EPM2000
CD
SR250 SR245
xperimental setup.

Table 1Atomic parameters of NII lines used for Boltzmann plot.
Element l (nm) Ek (eV) Aki (s�1) gk
NII 504.510 20.939 3.37e7 3
NII 553.536 27.746 6.04e7 9
NII 568.621 20.646 1.78e7 3
NII 571.077 20.654 1.17e7 5
NII 592.781 23.239 3.19e7 3
NII 595.239 23.242 1.24e7 5
400 450 500 550 600 6500.0
2.0x10⁶
4.0x10⁶
6.0x10⁶
8.0x10⁶
1.0x10⁷
1.2x10⁷
1.4x10⁷
1.6x10⁷
Inte
nsity
(a.u
.)
Wavelength (nm)
Fig. 2. Typical spectrum of laser induced plasma in nitrogen of
1.2�104 Pa.
Fig. 3. Boltzmann plots for laser induced plasmas in nitrogen of
4.0�104 Pa with different laser energies.
X. Li et al. / Journal of Quantitative Spectroscopy & Radiative Transfer 118 (2013) 1–7 3
also performed using a combination of the PMT and agated integrator and Boxcar averager (SR250, StanfordResearch Systems). The gate of SR250 can be set down to2 ns, and the delay can be continuously adjusted from afew nanoseconds to 10 ms, which allows for the time-resolved measurements of plasma radiation. The output ofSR250 was collected by the SR272 software (StanfordResearch Systems) through SR245 (Stanford ResearchSystems) computer interface module. The spark energy(the laser energy coupled into the plasmas) was obtainedby measuring the difference of the laser energy before andafter the breakdown using two energy meters (J-50MB-YAG, Coherent). The output of the two energy meters werecollected by a dual-channel Joulemeter (EPM2000, Molec-tron), and then processed in a personal computer.
3. Results and discussion
3.1. Excitation temperature measurement
The excitation temperature is one of the most impor-tant parameters to characterize the properties of plasmas.Accurate knowledge of the excitation temperature willlead to correct understanding of the excitation andionization processes in plasmas.
When plasma is in the local thermodynamic equili-brium (LTE) condition, and is optically thin, the intensityof an atomic or ionic emission line originating from upperlevel k to lower level i can be expressed as follows [16]:
I¼hcNgkAki
4plQ ðTÞexp �Ek=kBT
� �ð1Þ
where Aki is the Einstein transition probability of sponta-neous emission, gk¼2Jkþ1 is the statistical weight, Ek isthe energy of level k, N is the total number of the emittingspecies, l is the wavelength, Q(T) is the partition func-tion, h is the Plank’s constant, c is the speed of light invacuum, kB is the Boltzmann constant, T is the excitationtemperature.
Eq. (1) can be rearranged as:
lnIl
gkAki
� �¼�Ek=kBTþ ln
hcN
4pQ ðTÞ
� �ð2Þ
The excitation temperature of plasma can be obtainedfrom the slope of the so called linear Boltzmann plot ofEq. (2) for several atomic or ionic lines. In this paper,nitrogen ionic (NII) lines were chosen for Boltzmann plot,following some rules including no interference and largeupper level energy gap for accuracy. The atomic para-meters [17] of the chosen NII lines are listed in Table 1.Since these ionic lines cover a wide spectral range, toobtain accurate spectral intensities, relative spectralresponse calibration of the measurement system wasperformed using an irradiance standard generated withan integral sphere (SLM-40-C, SphereOptics-Hoffman)and a standard quartz halogen lamp issued by NationalInstitute of Metrology of China.
Shown in Fig. 2 is the typical spectrum of LIP innitrogen of 1.2�104 Pa. Since it is obtained using theungated spectrometer, there is obvious continuum radia-tion, especially in the range 400–450 nm. The intensities
of the chosen NII lines were calculated by integrating theline profiles above the continuum, to minimize the effectsof continuum radiation. Fig. 3 shows the Boltzmann plotsof LIPs in 4.0�104 Pa nitrogen with different laser ener-gies ranging from 25 mJ to 100 mJ. The energy gap ofupper levels is as large as 7.10 eV, ensuring the accuracyof the excitation temperature. All the R2 coefficients ofdetermination of these linear fittings are over 0.97,indicating high goodness of fitting.
The excitation temperatures of LIPs in nitrogen of differ-ent pressures with different laser energies are presented in
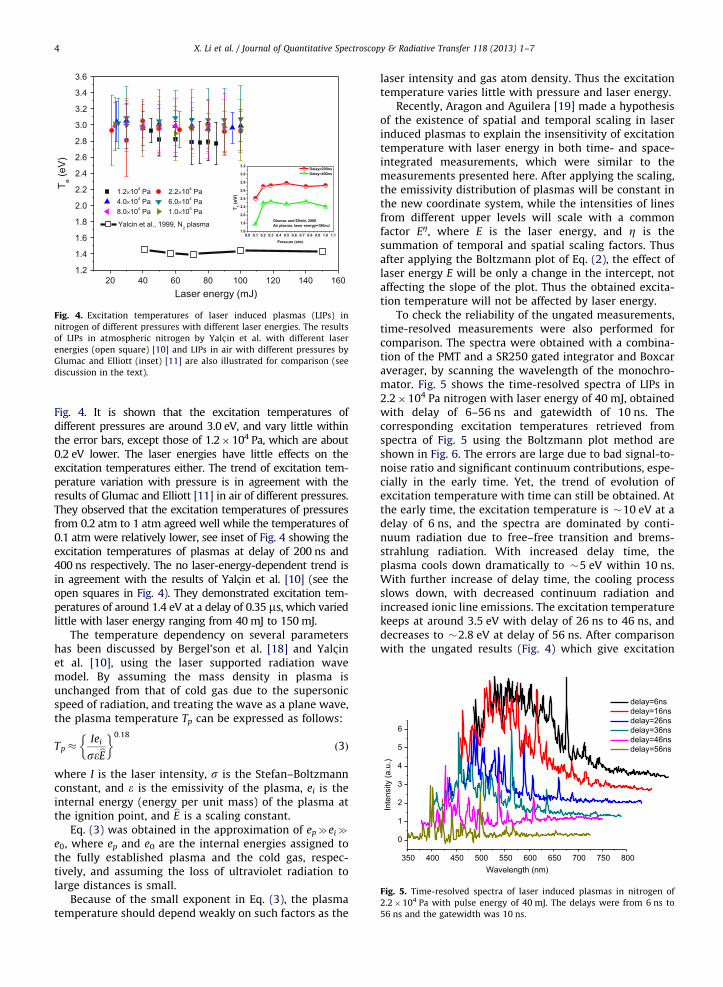
Fig. 4. Excitation temperatures of laser induced plasmas (LIPs) in
nitrogen of different pressures with different laser energies. The results
of LIPs in atmospheric nitrogen by Yalc- in et al. with different laser
energies (open square) [10] and LIPs in air with different pressures by
Glumac and Elliott (inset) [11] are also illustrated for comparison (see
discussion in the text).
350 400 450 500 550 600 650 700 750 800
0
1
2
3
4
5
6
delay=6ns delay=16ns delay=26ns delay=36ns delay=46ns delay=56ns
Inte
nsity
(a.u
.)
Wavelength (nm)
Fig. 5. Time-resolved spectra of laser induced plasmas in nitrogen of
2.2�104 Pa with pulse energy of 40 mJ. The delays were from 6 ns to
56 ns and the gatewidth was 10 ns.
X. Li et al. / Journal of Quantitative Spectroscopy & Radiative Transfer 118 (2013) 1–74
Fig. 4. It is shown that the excitation temperatures ofdifferent pressures are around 3.0 eV, and vary little withinthe error bars, except those of 1.2�104 Pa, which are about0.2 eV lower. The laser energies have little effects on theexcitation temperatures either. The trend of excitation tem-perature variation with pressure is in agreement with theresults of Glumac and Elliott [11] in air of different pressures.They observed that the excitation temperatures of pressuresfrom 0.2 atm to 1 atm agreed well while the temperatures of0.1 atm were relatively lower, see inset of Fig. 4 showing theexcitation temperatures of plasmas at delay of 200 ns and400 ns respectively. The no laser-energy-dependent trend isin agreement with the results of Yalc)in et al. [10] (see theopen squares in Fig. 4). They demonstrated excitation tem-peratures of around 1.4 eV at a delay of 0.35 ms, which variedlittle with laser energy ranging from 40 mJ to 150 mJ.
The temperature dependency on several parametershas been discussed by Bergel’son et al. [18] and Yalc)inet al. [10], using the laser supported radiation wavemodel. By assuming the mass density in plasma isunchanged from that of cold gas due to the supersonicspeed of radiation, and treating the wave as a plane wave,the plasma temperature Tp can be expressed as follows:
Tp �Iei
sebE� �0:18
ð3Þ
where I is the laser intensity, s is the Stefan–Boltzmannconstant, and e is the emissivity of the plasma, ei is theinternal energy (energy per unit mass) of the plasma atthe ignition point, and bE is a scaling constant.
Eq. (3) was obtained in the approximation of epceic
e0, where ep and e0 are the internal energies assigned tothe fully established plasma and the cold gas, respec-tively, and assuming the loss of ultraviolet radiation tolarge distances is small.
Because of the small exponent in Eq. (3), the plasmatemperature should depend weakly on such factors as the
laser intensity and gas atom density. Thus the excitationtemperature varies little with pressure and laser energy.
Recently, Aragon and Aguilera [19] made a hypothesisof the existence of spatial and temporal scaling in laserinduced plasmas to explain the insensitivity of excitationtemperature with laser energy in both time- and space-integrated measurements, which were similar to themeasurements presented here. After applying the scaling,the emissivity distribution of plasmas will be constant inthe new coordinate system, while the intensities of linesfrom different upper levels will scale with a commonfactor EZ, where E is the laser energy, and Z is thesummation of temporal and spatial scaling factors. Thusafter applying the Boltzmann plot of Eq. (2), the effect oflaser energy E will be only a change in the intercept, notaffecting the slope of the plot. Thus the obtained excita-tion temperature will not be affected by laser energy.
To check the reliability of the ungated measurements,time-resolved measurements were also performed forcomparison. The spectra were obtained with a combina-tion of the PMT and a SR250 gated integrator and Boxcaraverager, by scanning the wavelength of the monochro-mator. Fig. 5 shows the time-resolved spectra of LIPs in2.2�104 Pa nitrogen with laser energy of 40 mJ, obtainedwith delay of 6–56 ns and gatewidth of 10 ns. Thecorresponding excitation temperatures retrieved fromspectra of Fig. 5 using the Boltzmann plot method areshown in Fig. 6. The errors are large due to bad signal-to-noise ratio and significant continuum contributions, espe-cially in the early time. Yet, the trend of evolution ofexcitation temperature with time can still be obtained. Atthe early time, the excitation temperature is �10 eV at adelay of 6 ns, and the spectra are dominated by conti-nuum radiation due to free–free transition and brems-strahlung radiation. With increased delay time, theplasma cools down dramatically to �5 eV within 10 ns.With further increase of delay time, the cooling processslows down, with decreased continuum radiation andincreased ionic line emissions. The excitation temperaturekeeps at around 3.5 eV with delay of 26 ns to 46 ns, anddecreases to �2.8 eV at delay of 56 ns. After comparisonwith the ungated results (Fig. 4) which give excitation

0 10 20 30 40 50 60
2
4
6
8
10
12
14
16
T e (e
V)
Delay (ns)
Fig. 6. Time-resolved excitation temperatures of laser induced plasmas
in nitrogen retrieved from spectra shown in Fig. 5.
503.0 503.5 504.0 504.5 505.0 505.5 506.00
1x10⁵
2x10⁵
3x10⁵
4x10⁵
5x10⁵
6x10⁵
7x10⁵ raw data Voigt fit of rawdata
Inte
nsity
(a.u
.)
Wavelength (nm)
Fig. 7. Typical spectral profile and the Voigt fitting of NII 504.5 nm line.
X. Li et al. / Journal of Quantitative Spectroscopy & Radiative Transfer 118 (2013) 1–7 5
temperatures of �3.0 eV, it can be stated that althoughthe ungated measurements cannot reflect the dramaticdecrease of excitation temperature in the very early time(delay o16 ns), they can still give a reasonable demon-stration of the excitation temperatures of plasmas duringthe relatively stable evolution periods (delay 426 ns).
3.2. Electron number density measurement
Electron number density of the LIPs was obtainedusing the Stark broadening of nitrogen ionic lines. Griemhas tabulated the Stark broadening parameters for neutraland singly ionized atoms in his two books [20,21].
Besides the Stark broadening, there are also otherbroadening mechanisms contributing to the profile ofthe measured lines, including natural broadening, reso-nance broadening, Doppler broadening, and instrumentalbroadening. Among these broadening mechanisms, Dop-pler broadening and instrumental broadening generateGaussian profiles, while other broadening mechanismsgenerate Lorentzian profiles. The measured line profilesusually have Voigt profiles as a result of the convolutionof the Gaussian and Lorentzian profiles.
In most LIBS cases, the natural, resonance and Dopplerbroadening are much smaller than Stark broadening andcan be omitted safely. In this paper, we omitted thenatural and resonance broadening widths, and the Starkbroadening width which makes the main contribution tothe Lorentzian part profiles was deconvoluted using theformula below [22]:
wVoigt ¼wStark
2
� 2
þðwGaussÞ2
�1=2
þwStark
2ð4Þ
where wVoigt is the measured Voigt line width, wStark andwGauss are the Stark broadening width and Gaussian width,respectively. When Doppler broadening is considered,wGauss can be calculated by [23]
wGauss ¼ ½ðwDopplerÞ2þðwInstrumentÞ
2�1=2 ð5Þ
where wDoppler and wInstrument are the Doppler width andinstrumental width, respectively.
Doppler width can be calculated with the followingformula [24]:
wDoppler ¼ 7:16� 10�7lffiffiffiffiffiffiffiffiffiffiffiffiTg=M
qð6Þ
where Tg is the temperature of the plasma, M is the massof the radiating atomic element (in atomic mass unit), andl is the central wavelength of the emission line.
The total width of a Stark broadened singly ionizedline (full width at half maximum, FWHM) can beexpressed as [25],
wStark ¼ 2 1þ1:75A 1�1:2Rð Þ½ �wNe
1016
� �ð7Þ
where A is the ion broadening parameter, R is the ratio ofmean distance between ions to Debye length of plasma, w
is the electron-impact width, Ne is the electron numberdensity.
If we omit the ion impact broadening, Eq. (7) can bereduced as:
wStark ¼ 2wNe
1016: ð8Þ
In our measurement, the instrumental width wasdetermined as 0.072 nm by measuring the FWHM of theemissions of a low pressure mercury hollow cathodelamp. NII 504.5 nm line was chosen for the electronnumber density measurement. The electron-impact widthw corresponding to the excitation temperature was deter-mined by interpolation of the values given for 20,000 Kand 40,000 K, which are 6.54�10�3 A and 8.79�10�3 Arespectively [20]. The measured line width was deter-mined by Voigt fitting the NII 504.5 nm line. A typical lineprofile and the corresponding Voigt fitted line profile ofNII 504.5 nm are illustrated in Fig. 7. Stark broadeningwidth was obtained using Eq. (4), and electron numberdensity was then calculated using Eq. (8).
The electron number densities of the LIPs in nitrogen ofdifferent pressures with different laser energies are illu-strated in Fig. 8. The error bars correspond to the errors indetermination of the Stark broadening widths. It is shownthat the pressure has great effects on the electron numberdensity. The electron number density increases almost anorder from 5.8�1017 cm�3 to 4.7�1018 cm�3 when the

Fig. 8. Electron number densities of laser induced plasmas in nitrogen of
different pressures with different laser energies.Fig. 9. Spark energies of laser induced plasmas in nitrogen of different
pressures with different laser energies.
Fig. 10. Percentages of spark energy of laser induced plasmas on input
energy with different experimental conditions.
X. Li et al. / Journal of Quantitative Spectroscopy & Radiative Transfer 118 (2013) 1–76
pressure was increased from 1.2�104 Pa to 1.0�105 Pa.However, the laser energy has little effects on the electronnumber density. The results presented here are consistentwith the results obtained by Yalc)in et al. [10] in which theelectron number density in atmospheric nitrogen was about2�1018 cm�3 at delay of 0.2 ms. However, the increase ofelectron number density with laser energy they hadreported was not observed here. It should be noted thatthe spectral profiles obtained in the ungated measurementsare summations of profiles at different time points of theplasma evolution with quite different excitation tempera-tures and electron number densities. According to Aragonand Aguilera’s hypothesis [19], after spatial and temporalscaling, the spectral emissivity el is independent of laserenergy, and laser energy only affects the amplitude of wholespectral profile, leaving the spectral profile unchanged.Thus, the effects of laser energy on the electron numberdensity will not be observed in the ungated measurements.This is a limitation of the ungated spectrometers.
3.3. Evaluation of the LTE
When calculating the excitation temperature, it isassumed that the plasma is in the LTE condition.A necessary but not sufficient conditions for LTE is theMcWhirter criterion [25]:
NeZ1:6� 1012ffiffiffiffiffiTe
pðDEÞ3ðcm�3Þ ð9Þ
where Te is the excitation temperature in Kelvin, DE is theenergy difference (in eV) between the upper levels whichare expected to be in LTE. For the NII lines used in thispaper, DE¼7.10 eV, and Te¼3.48�104 K, thus the criticalelectron number density for LTE is 1.07�1017 cm�3. Themeasured electron number density of LIPs were at leastfive times as the critical density, thus LTE is a validassumption for the conditions of our plasma.
3.4. Spark energy measurement
For laser ignition applications, the spark energy is animportant parameter which determines the energy effi-ciency of the whole ignition system and the difficulty ofignition laser design. The spark energy is defined as the
difference of the input laser energy and residual energyafter the generation of plasmas. The spark energies of LIPsof different pressures with different input laser energiesare presented in Fig. 9. The spark energy increases linearlywith the increasing laser energy. However, the slopes ofthe increase are different for different pressures. Theslopes increase with the increased pressures, and finallyreach a constant when the pressure approaches1.0�105 Pa. The percentage of spark energy on the inputenergy is shown in Fig. 10. It is shown that, with increasedinput energy, the percentage of spark energy on inputenergy increases gradually and finally saturates at aspecific value, from 35% of 2.2�104 Pa to 60% of1.0�105 Pa. The results are in consistent with that ofother authors [9,26].
4. Conclusions
Characterization of laser induced plasmas (LIPs) innitrogen of different pressures from 1.2�104 Pa to1.0�105 pa with different laser energies ranging from

X. Li et al. / Journal of Quantitative Spectroscopy & Radiative Transfer 118 (2013) 1–7 7
20 mJ to 100 mJ were performed using an ungated spec-trometer with an EMCCD camera as detector. The excita-tion temperature, electron number density and sparkenergy of LIPs with different experimental conditionswere obtained. The excitation temperatures were almostconstant around 3.0 eV, and varied little with pressureand laser energy. The electron number densities increasedfrom 5.8�1017 cm�3 to 4.7�1018 cm�3 when the pres-sures were increased from 1.2�104 Pa to 1.0�105 Pa, butvaried little with the laser energy. The invariance ofexcitation temperature and electron number density withlaser energy was explained with the laser supportedradiation wave model and the hypothesis of spatial andtemporal scaling of plasmas. The spark energy increasedlinearly with increased laser energy, and saturated at 35–60% of input energy. Comparison with the time-resolvedmeasurements confirms that the ungated measurementcan give reasonable demonstration of excitation tempera-tures of plasmas during the relatively stable evolutionperiods (delay 426 ns) after the very early time. Theconsistency of the results of ungated measurements withthose of other authors indicates the applicability ofungated spectrometer in characterization of excitationtemperature and electron number density of LIPs exceptsome intrinsic limitations involved with its inability to betime-resolved. The cheaper ungated spectrometer can bean option for researchers to cut down the systematic costin practical applications of laser induced plasmas, such aslaser spark ignition. Of course, in the situations involvedwith temporal evolutions of the parameters of the LIPs,gated spectrometers would be favored.
Acknowledgment
This work is supported by the National Natural ScienceFoundation of China (Grant no. 60978016).
References
[1] Ronney PD. Laser versus conventional ignition of flames. Opt Eng1994;33:501–21.
[2] Spiglanin TA, Mcilroy A, Fournier EW, Cohen RB, Syage JA. Time-resolved imaging of flame kernels: laser spark ignition of H2/O2/Armixtures. Combust Flame 1995;102:310–28.
[3] Phuoc TX. Laser-induced spark ignition fundamental and applica-tions. Opt Laser Eng 2006;44:351–97.
[4] Bradley D, Sheppard CGW, Suardjaja IM, Woolley R. Fundamentals ofhigh-energy spark ignition with lasers. Combust Flame 2004;138:55–77.
[5] Weinrotter M, Kopecek H, Wintner E, Lackner M, Winter F.Application of laser ignition to hydrogen-air mixtures at highpressures. Int J Hydrogen Energy 2005;30:319–26.
[6] Zimmer L, Okai K, Kurosawa Y. Combined laser induced ignitionand plasma spectroscopy: fundamentals and application to ahydrogen-air combustor. Spectrochim Acta Part B 2007;62:1484–95.
[7] Beduneau JL, Kawahara N, Nakayama T, Tomita E, Ikeda Y. Laser-induced radical generation and evolution to a self-sustaining flame.Combust Flame 2009;156:642–56.
[8] Phuoc TX, White CM. Experimental studies of the absorption andemission from laser-induced spark in combustible gases. OptCommun 2000;181:353–9.
[9] Chen Y-L, Lewis JWL, Parigger C. Spatial and temporal profiles ofpulsed laser-induced air plasma emissions. J Quant SpectroscRadiat Transfer 2000;67:91–103.
[10] Yalc)in S- , Crosley DR, Smith GP, Faris GW. Influence of ambientconditions on the laser air spark. Appl Phys B 1999;68:121–30.
[11] Glumac N, Elliott G. The effect of ambient pressure on laser-induced plasmas in air. Opt Laser Eng 2007;45:27–35.
[12] Kawahara N, Beduneau J-L, Nakayama T, Tomita E, Ikeda Y.Spatially, temporally, and spectrally resolved measurement oflaser-induced plasma in air. Appl Phys B 2007;86:605–14.
[13] Eseller KE, Yueh FY, Singh JP. Laser-induced breakdown spectro-scopy measurement in methane and biodiesel flames using anungated detector. Appl Opt 2008;47:G144–8.
[14] Kiefer J, Troger JW, Li ZS, Alden M. Laser-induced plasma inmethane and dimethyl ether for flame ignition and combustiondiagnostics. Appl Phys B 2011;103:229–36.
[15] Letty C, Pastore A, Mastorakos E, Balachandran R, Couris S.Comparison of electrical and laser spark emission spectroscopyfor fuel concentration measurements. Exp Therm Fluid Sci 2010;34:338–45.
[16] Cremers DA, Radziemski LJ. Handbook of laser-induced breakdownspectroscopy. John Wiley & Sons, Ltd;; 2006.
[17] Ralchenko Y, Kramida AE, Reader J, NIST ASD Team. NIST atomicspectra database (ver. 4.0.1) [Online]. National Institute of Stan-dards and Technology. Gaithersburg, MD; 2010. Available from:/http://physics.nist.gov/asdS.
[18] Bergel’son VI, Loseva TV, Nemchinov IV, Orlova TI. Propagation ofplane supersonic radiation waves. Sov J Plasma Phys 1975;1:498–503.
[19] Aragon C, Aguilera JA. Spatial and temporal scaling and commonapparent excitation temperature of laser-induced plasmas gener-ated at constant irradiance with different pulse energies. J ApplPhys 2008;103.
[20] Griem HR. Plasma spectroscopy. McGraw-Hill Book Company;1964.
[21] Griem HR. Spectral line broadening by plasmas. Academic Press;1974.
[22] Whiting EE. An empirical approximation to Voigt profile. J QuantSpectrosc Radiat Transfer 1968;8:1379–84.
[23] Laux CO, Spence TG, Kruger CH, Zare RN. Optical diagnostics ofatmospheric pressure air plasmas. Plasma Sour Sci Technol2003;12:125–38.
[24] Konjevic N. Plasma broadening and shifting of non-hydrogenicspectral lines:present status and applications. Phys Rep 1999;316:339–401.
[25] Aragon C, Aguilera JA. Characterization of laser induced plasmas byoptical emission spectroscopy: a review of experiments and meth-ods. Spectrochim Acta Part B 2008;63:893–916.
[26] Beduneau JL, Ikeda Y. Spatial characterization of laser-inducedsparks in air. J Quant Spectrosc Radiat Transfer 2004;84:123–39.