characterization of green infrastructure at the local
TRANSCRIPT

Characterization of Green
Infrastructure at the Local Level with
Geographical Information System,
Tunja (Colombia)
Cristian Hernández-Rojas; Rigaud Sanabria-Marín
Citation: C. Hernández-Rojas, R. Sanabria-Marín,
“Characterization of Green Infrastructure at the Local Level
with Geographical Information System, Tunja (Colombia),”
Revista Facultad de Ingeniería, vol. 29 (54), e10294, 2020.
https://doi.org/10.19053/01211129.v29.n54.2020.10294
Received: October 15, 2019; Accepted: December 15, 2019;
Published: December 16, 2019
Copyright: This is an open access article distributed under
the terms of the CC BY
Competing interests: The authors have declared that no
competing interests exist.

Cristian Hernández-Rojas; Rigaud Sanabria-Marin
Revista Facultad de Ingeniería (Rev. Fac. Ing.) Vol. 29 (54), e10294. 2020. Tunja-Boyacá, Colombia. L-ISSN: 0121-1129, e-ISSN: 2357-5328, DOI: https://doi.org/10.19053/01211129.v29.n54.2020.10294
Characterization of Green
Infrastructure at the Local Level with
Geographical Information System,
Tunja (Colombia)
Cristian Hernández-Rojas1
Rigaud Sanabria-Marín2
Abstract
This article presents a characterization of the areas likely to integrate a Green
Infrastructure (GI) for the Tunja city at local scale and spatial analysis is mainly
applied to the land cover and land use of the study area. To identify the areas that
could be integrated into the GI, four thematic dimensions were first zoned (ecological
connectivity, multifunctionality, ecological status and accessibility to the population);
they were later normalized on a scale of 1 to 10 to make them comparable; the
dimensions were combined by an Analytic Hierarchy Process (AHP) and finally those
areas whose pixel values were above the third quartile were selected in the
integration of the dimensions. The zoned dimensions the following weights were
obtained: ecological connectivity (48%), multifunctionality (30%), ecological status
(13%) and accessibility to the population (9%). It was found that the main areas likely
to integrate into the GI are concentrated in the western fringe of the city; however,
the northwestern area has a greater fragmentation and lower ecological status than
the southwestern zone (which refers mainly to the Protective Forest Reserve El
Malmo). Likewise, several areas or patches were identified to the south of the city
(referring mainly to wooded areas and presence of wetlands) as well as small
1 Independent researcher. ORCID: 0000-0002-8394-0158. 2 Ph.D. Universidad Pedagógica y Tecnológica de Colombia (Tunja-Boyacá, Colombia). [email protected]. ORCID: 0000-0003-3914-3407.

Characterization of Green Infrastructure at the Local Level with Geographical Information System, Tunja (Colombia)
Revista Facultad de Ingeniería (Rev. Fac. Ing.) Vol. 29 (54), e10294. 2020. Tunja-Boyacá, Colombia. L-ISSN: 0121-1129, e-ISSN: 2357-5328, DOI: https://doi.org/10.19053/01211129.v29.n54.2020.10294
wooded areas in the urban perimeter, but with greater isolation among the other
areas of GI. Within the urban perimeter the zoning of areas that could be integrated
into a GI was practically null.
Keywords: accessibility; connectivity; ecological status; green infrastructure;
multifunctionality; spatial analysis.
Caracterización de la Infraestructura Verde a nivel local con Sistemas de
Información Geográfica, Tunja (Colombia)
Resumen
Se presenta una caracterización de las áreas susceptibles de integrarse a la
Infraestructura Verde (IV) del municipio de Tunja a una escala local y aplicando
principalmente análisis espacial sobre las coberturas y usos del suelo de la zona de
estudio. Para identificar las áreas susceptibles de integrarse a la IV se zonificó en
primer lugar cuatro dimensiones temáticas (conectividad ecológica,
multifuncionalidad, estado ecológico y accesibilidad a la población); posteriormente
se normalizaron en una escala de 1 a 10 para hacerlas comparables; enseguida se
combinaron las dimensiones mediante un Proceso de Análisis Jerárquico (AHP,
siglas en inglés) y finalmente se seleccionaron aquellas zonas cuyos valores de
pixel estaban por encima del tercer cuartil de datos en la integración de las
dimensiones. En las dimensiones zonificadas se obtuvieron los siguientes pesos:
conectividad ecológica (48%), multifuncionalidad (30%), estado ecológico (13%) y
accesibilidad a la población (9%). Se encontró que las principales áreas
susceptibles de integrarse a la IV se concentran en la franja occidental del municipio;
sin embargo, la zona noroccidental presenta una mayor fragmentación y menor
estado ecológico que la zona suroccidental (la cual hace referencia principalmente
a la Reserva Forestal Protectora El Malmo). Igualmente se identificaron varias áreas
o parches al sur del municipio (haciendo referencia principalmente a zonas
arboladas y presencia de humedales) así como pequeñas áreas arboladas en el
perímetro urbano, pero con un mayor aislamiento entre las demás áreas de IV.

Cristian Hernández-Rojas; Rigaud Sanabria-Marin
Revista Facultad de Ingeniería (Rev. Fac. Ing.) Vol. 29 (54), e10294. 2020. Tunja-Boyacá, Colombia. L-ISSN: 0121-1129, e-ISSN: 2357-5328, DOI: https://doi.org/10.19053/01211129.v29.n54.2020.10294
Dentro del perímetro urbano la zonificación de áreas susceptibles de integrarse a
una IV fue prácticamente nula.
Palabras clave: accesibilidad; análisis espacial; conectividad; estado ecológico;
infraestructura verde; multifuncionalidad.
Caracterização da Infraestrutura Verde a nível local com Sistemas de
Informação Geográfica, Tunja (Colômbia)
Resumo
Apresenta-se uma caracterização das áreas susceptíveis de integrar-se à
Infraestrutura Verde (IV) do município de Tunja a uma escala local e aplicando
principalmente análise espacial sobre as coberturas e usos do solo da zona de
estudo. Para identificar as áreas susceptíveis de integrar-se à IV zoneou-se em
primeiro lugar quatro dimensões temáticas (conectividade ecológica,
multifuncionalidade, estado ecológico e acessibilidade à população); posteriormente
normalizaram-se em uma escala de 1 a 10 para fazê-las comparáveis; em seguida
combinaram-se as dimensões mediante um Processo de Análise Hierárquica (AHP,
sigla em inglês) e finalmente selecionaram-se aquelas zonas cujos valores de pixel
estavam acima do terceiro quartil de dados na integração das dimensões. Nas
dimensões zoneadas obtiveram-se os seguintes pesos: conectividade ecológica
(48%), multifuncionalidade (30%), estado ecológico (13%) e acessibilidade à
população (9%). Encontrou-se que as principais áreas susceptíveis de se integrar à
IV concentram-se na franja ocidental do município; porém, a zona noroeste
apresenta uma maior fragmentação e menor estado ecológico que a zona sudeste
(a qual faz referência principalmente à Reserva Florestal Protetora El Malmo).
Igualmente identificaram-se várias áreas ou parches ao sul do município (fazendo
referência principalmente a zonas arborizadas e presença de pântanos) assim como
pequenas áreas arborizadas no perímetro urbano, mas com um maior isolamento
entre as demais áreas de IV. Dentro do perímetro urbano o zoneamento de áreas
susceptíveis de integrar-se a uma IV foi praticamente nula.

Characterization of Green Infrastructure at the Local Level with Geographical Information System, Tunja (Colombia)
Revista Facultad de Ingeniería (Rev. Fac. Ing.) Vol. 29 (54), e10294. 2020. Tunja-Boyacá, Colombia. L-ISSN: 0121-1129, e-ISSN: 2357-5328, DOI: https://doi.org/10.19053/01211129.v29.n54.2020.10294
Palavras chave: acessibilidade; análise espacial; conectividade; estado ecológico;
infraestrutura verde; multifuncionalidade.

Cristian Hernández-Rojas; Rigaud Sanabria-Marin
Revista Facultad de Ingeniería (Rev. Fac. Ing.) Vol. 29 (54), e10294. 2020. Tunja-Boyacá, Colombia. L-ISSN: 0121-1129, e-ISSN: 2357-5328, DOI: https://doi.org/10.19053/01211129.v29.n54.2020.10294
I. INTRODUCTION
According to the European Commission [1] the Green Infrastructure (GI) is a
strategically planned network of high quality natural and semi-natural zones with
other environmental elements designed and managed to provide a wide number of
ecosystem services and protect the biodiversity of both rural and urban settlements.
Therefore, the identification, connection and preservation of the aforementioned
networks is essential in the sustainable ordering of the territory. That is how Canto
[2] acknowledges it, who points that at a European level, the implementation of GI
projects has become a normalized element in the territorial ordination and
development. The application of GI projects contributes ecological, economic, and
social benefits, which grant a tenable development, as long as the conservation and
management of the green zone is integrated with the territory progress and the
planning of the already constituted infrastructure [3]. Vasquez [4] considers GI as a
pivotal component in the planning of urban-ecological systems that are resilient to
the climate change, through the provision of ecosystem services of mitigation of
adaptation, for instance, in the storage and seizure of carbon dioxide; temperature
regulation; or the possibility of the use of tenable transportation (and the
correspondent reduction of greenhouse effect gases generation). Likewise, Jones
and Samper [5] acknowledge the role of GI as an answer to face the climate change
in London. In [3, 6] are summarized the main benefits which the GI projects
implementation could give to, for example, the improvement of ecological and
landscape quality, habitat management, local climate regulation, improvement of
quality of life, among others.
In order to create GI zones, the Green Infrastructure Center [7] offers a six-step
process oriented to create and apply GI plans: i) community goals setting, ii) local
data review, iii) ecological mapping and assets generation, iv) assets liability
evaluation, v) opportunities of the risks and set goals, and vi) implementation of
opportunities. In addition, Esri [3] proposes three fundamental steps to generate GI
zones where areas with ecological, culture, and scenic value are identified to create
core areas and, therefore generate corridors and links among them. On the other
hand, Aguilera, Rodriguez and Gomez [8] present a methodology, from a completely

Characterization of Green Infrastructure at the Local Level with Geographical Information System, Tunja (Colombia)
Revista Facultad de Ingeniería (Rev. Fac. Ing.) Vol. 29 (54), e10294. 2020. Tunja-Boyacá, Colombia. L-ISSN: 0121-1129, e-ISSN: 2357-5328, DOI: https://doi.org/10.19053/01211129.v29.n54.2020.10294
spatial point of view, about the coverage and uses of the soil for the selection of
areas susceptible to integrate to GI from the dimensions of multifunctionality,
ecological connectivity, permeability or accessibility to the population and ecological
value. Also, Liquete et al [9] propose a methodology based on the notions of
ecological connectivity, ecosystems multifunctionality, lending of ecosystem benefits
for the nature conservation. In the United States, Esri [3] has compiled an online
resource for the GI planning in the national framework, providing information about
“intact cores” as a starting input for the green infrastructure definition with further
detail. In Colombia there has not been advance in research about the generation of
areas to integrate to a GI from a spatial scope. However, Remolina [10] found,
through the review of thirty-two Territory Ordering Plans (TOP) of towns from
Cundinamarca, that sixteen reviewed towns could have a GI according to the
designations and classifications of the conservation elements that take part in each
TOP.
The City of Tunja, capital of the Department of Boyacá, is located on the East
Mountain Range. It has an extension of 121.4 Km2 and a population of, according to
the DANE in 2018, 167,991 inhabitants. Among the main economic activities,
agriculture and the trading of goods and services are the most important ones. In
accordance with the Alcaldía municipal de Tunja [11], the anthropic effect of a
dynamic of quick and disordered growth of the urban net show multiple risks related
to the lack of green coverage that protects the soil, disappearance of wetlands,
floodings and sedimentation of channels, among others. Moreover, Rincon [12]
states that Tunja received the 21st century as a complex city due to the production
of historic transformation of its spatial models: a compact, linear, dispersed, and
finally, fragmented city. This last model creates huge challenges in the adequate
ordination of the territory, and, thereupon, the sustainability of it, since in a
fragmented space the delimitation and connectivity of landscapes with ecological
values and ecosystem services for the population are completely lost.
Besides, Tunja, in the TOP adopted by the Act 0241 of 2014, has delimited zones
or areas with ecosystem importance where soils that take part of a Main Ecological
Structure are included, but it does not have as such an explicit delimitation of such

Cristian Hernández-Rojas; Rigaud Sanabria-Marin
Revista Facultad de Ingeniería (Rev. Fac. Ing.) Vol. 29 (54), e10294. 2020. Tunja-Boyacá, Colombia. L-ISSN: 0121-1129, e-ISSN: 2357-5328, DOI: https://doi.org/10.19053/01211129.v29.n54.2020.10294
structure, and much less it has a zoning of networks or areas that achieve a definition
or characteristics of a GI, which can be used as a supply for an appropriate ordination
of the territory according to the sustainability criteria and the input in the quality of
life of the population. Therefore, the goal of this investigation was to characterize the
areas susceptible to integrate to the GI of the city of Tunja in a local scale through a
Geographic Information System analysis.
II. METHODOLOGY
In the identification of the areas that are susceptible to integrate to a GI the zoning
was performed into a combination of four dimensions: multifunctionality,
accessibility, connectivity and ecological status; according to the methodology
proposed by Aguilera, Rodriguez and Gomez [8]. In this methodology, the base
inputs are i) the coverage and uses of the soil (1:25000 scale, correspondent to the
updates of river basin management and development plan of the Chicamocha High
River and the Garagoa River) and ii) the base cartography (1:25000 scale,
correspondent to the plates of Instituto Geográfico Agustín Codazzi - IGAC).
A. Multifunctionality
The potential input that each cover and soil use has was determined regarding the
arrangement of ecosystem services of provision (sweet water), regulation (air
quality, carbon storage, extreme events moderation, erosion prevention), culture
(recreation, tourism) and support (habitat). This input was evaluated through a
qualitative grade (1-null to 4-high) by an application of eight surveys to professionals
immersed in territory planning topics of different professional fields and experts of
the environment in Tunja, taking as a final multifunctionality value the average of the
grades of all the ecosystem services and the ones who were surveyed.
B. Ecological Connectivity
This was based on the work of Marull and Mallarach [13, 14, 15] in which, from the
coverage and the soil uses, and through the use of the implement CostDistance
(Arcmap), the Barrier Affectation Index (BAI) and the Ecological Connectivity Index

Characterization of Green Infrastructure at the Local Level with Geographical Information System, Tunja (Colombia)
Revista Facultad de Ingeniería (Rev. Fac. Ing.) Vol. 29 (54), e10294. 2020. Tunja-Boyacá, Colombia. L-ISSN: 0121-1129, e-ISSN: 2357-5328, DOI: https://doi.org/10.19053/01211129.v29.n54.2020.10294
(ECI) were identified by means of an affectation matrix, and the BAI with a matrix of
the affinity of areas to connect (functional ecological areas).
For the calculation of the BAI it was necessary the use of the classification of the
coverage and soil uses according to the affectation typology in the environment of
the Table 1. The cost surface was determined through the sum of raster surface for
each typology with the affection distance and coefficient registered in the Table 1.
Table 1. Soil coverage potential affectation matrix. Adapted from [13].
Description Affectation coefficient
(as)* Affectation Value
(Ʌs)
Neutral (N) 1000 0.10
Agricultural (Ag) 750 0.13
Forest (F) 500 0.20
Barriers (bs) 250 0.40
Connectors (C) 1 100.00
(*) maximum distance (m) affected by the typology b5 = 100, Class 5 barrier weight. (Table 2)
Ʌs = b5 / as
Through the implement CostDistance, beginning with the generated cost surface
and the origin of each subclassified barrier type (Table 2) a cost distance (ds) for
each origin (or each barrier type bs) was generated.
Table 2. Coverage and soil uses that act as barriers. Adapted from [13].
Barrier class Bs(*) Ks1
(**) Ks2 (**)
Landscaped spaces (b1) 20 11.10 0.253
Secondary lanes (b2) 40 22.21 0.123
Main lanes (b4) 80 44.42 0.063
Urban spaces (b5) 100 55.52 0.051
(*) Barrier affectation base weight (**) Constants for logarithmic decrease of the 30%
To calculate the effect that each barrier class has over the surrounding space (Ys)
and the BAI the equations (1) and (2) were used [13].
𝑌𝑆 = 𝐵𝑆 − 𝑘𝑠1 ln(𝑘𝑠2(𝐵𝑠 − 𝑑′𝑠) + 1) , 𝑌 = ∑ 𝑌𝑠 (1)
𝐵𝐴𝐼 = 10 (𝑌𝑖
𝑌𝑚𝑎𝑥⁄ ) (2)
Where, the values of Bs, ks1 y ks2, are registered in the Table 2, (d’s=Bs-ds, where Bs-
ds > 0), Yi is the value that each pixel of Y takes, Ymax is the maximum value of Y.

Cristian Hernández-Rojas; Rigaud Sanabria-Marin
Revista Facultad de Ingeniería (Rev. Fac. Ing.) Vol. 29 (54), e10294. 2020. Tunja-Boyacá, Colombia. L-ISSN: 0121-1129, e-ISSN: 2357-5328, DOI: https://doi.org/10.19053/01211129.v29.n54.2020.10294
Regarding the calculation of the ECI, the Functional Ecological Areas (FEA) were
selected in terms of the classification of the environmental conservation and
protection areas of the TOP and the area delimited as Paramo Altiplano
Cundiboyacense of the city. The cost surface was determined based on the effect
that the BAI provokes and the affinity matrix between the coverage and the soil uses
with each FEA (the affinity matrix was graded from 0 to 1, “related” to “non-related,”
respectively). With the cost surface adapted to each FEA and through the function
CostDistance, a cost distance (Xi) was found for each FEA. In this way, the equation
(3) was used [13, p. 12] to determine the relative Ecological Connectivity Index
(ECIr).
𝐸𝐶𝐼𝑟 = 10 − 9 [ln(1 + (𝑋𝑖 − 𝑋𝑚𝑖𝑛))
ln(1 + (𝑋𝑚𝑎𝑥 − 𝑋𝑚𝑖𝑛))]
3
(3)
Where, Xi is the value of each cost distance i pixel, Xmax and Xmin are the máximum
and minimum values, respectively, of the cost distance i.
Finally, with the equation (4) the absolute Ecological Connectivity Index (ECIa),
which takes into account all the FEA analyzed in the study zone, is derived.
𝐸𝐶𝐼𝑎 =∑ 𝐸𝐶𝐼𝑟
𝑛𝑢𝑚𝑏𝑒𝑟 𝑜𝑓 𝐸𝐶𝐼𝑟 (𝟒)
C. Accessibility to the Population
To determine the degree of accessibility that the population has to each point of the
surface of study, the implement CostDistance was once again used and a
subsequent linear reclassification for the outcomes interpretation. The cost surface
was generated through the classification of the soil pending and the grade of
displacement “difficulty” in each pending rank. Regarding the origin of the implement
CostDistance, the trail and path ways were selected in order to prioritize in some
way the movement on foot. The score of displacement cost was assigned in a way
that the zones with less inclination were prioritized, as shown in the Table 3.
Table 3. Pending Classification. Pending ranks from [16].
Pending (%) Classification Cost
0 – 3 Slightly flat 1
3 – 7 Slightly inclined 2

Characterization of Green Infrastructure at the Local Level with Geographical Information System, Tunja (Colombia)
Revista Facultad de Ingeniería (Rev. Fac. Ing.) Vol. 29 (54), e10294. 2020. Tunja-Boyacá, Colombia. L-ISSN: 0121-1129, e-ISSN: 2357-5328, DOI: https://doi.org/10.19053/01211129.v29.n54.2020.10294
Pending (%) Classification Cost
7 – 12 Moderately inclined 3
12 – 25 Highly inclined 5
25 – 50 Slightly steep 8
50 – 75 Moderately steep 9
> 75 Highly steep 10
D. Ecological Status
This dimension was evaluated as an approximation of the ecological status related
to the composition and configuration of the coverage and soil uses class [8]. This
approximation was made through the zoning of the naturalness and the contrast
among the present coverage and soil uses. According to Garcia [17], it implies the
recognition of the environment conditions, which is very tough to measure on
practice. This concept is normally more related to the seminatural systems, quasi-
natural, or artificial, that is to say, to systems with some anthropic influence degree.
The contrast meaning the affinity or difference magnitude between ecological
characteristics of adjacent coverage and soils uses.
Aguilera [8] determined naturalness in relation to the data of Sistema de Información
sobre Ocupación del Suelo de España (SIOSE), which allows to obtain several
factors (For each type of soil use/coverage and naturalness level) for each
tessellation of the territory. As the starting data of this study was CORINE LAND
COVER, it was necessary to modify the obtaining process. Therefore, for the
naturalness zoning, a net (square net of 100x100 parts, 5195 tessellations. The net
size was chosen arbitrarily so that it allowed a great intersection of adjacent
polygons) that covered the zone of study was created, and next an intersection
between the aforementioned net with the coverage and the soil uses was generated.
In this way, the area of each net tessellation and the area of each tessellation
intersected to the coverage. Then, according to the Table 4, the coverage and soil
uses were reclassified, and the naturalness degrees were determined taking into
account to area percentage of each intersected tessellation according to the area of
each respective net tessellation, which was used to generate a raster surface.

Cristian Hernández-Rojas; Rigaud Sanabria-Marin
Revista Facultad de Ingeniería (Rev. Fac. Ing.) Vol. 29 (54), e10294. 2020. Tunja-Boyacá, Colombia. L-ISSN: 0121-1129, e-ISSN: 2357-5328, DOI: https://doi.org/10.19053/01211129.v29.n54.2020.10294
Table 4. Naturalness degrees in each coverage and soil use. Adapted from [8].
Coverage and soil use Naturalness degree
1 2 3 4
Wooden – scrubland, water sheets < 20 % 20-50 % 50-70 % > 70 %
Plains, grassland > 50 % 20-50 % 10-20 % < 10 %
Farmland > 50 % 20-50 % 10-20 % < 10 %
Artificial soils > 25 % 10-25 % 5-10 % < 5 %
In relation to the contrast, the software Fragstats was used, through the use of the
metrics Mean Edge Contrast Index (ECON_MN) and the landscape level mobile
window, to obtain a contrast value for each pixel of the zone of study surface.
Likewise, it was necessary to get into a contrast matrix between the coverage and
the adjacent soil uses, whose grading is obtained in a scale from 0 to 1 (null to high
contrast, respectively) [18].
Both the naturalness surface and the zone of study contrast were normalized to an
equal value scale in order to subtract the contrast zones from the naturalness zones,
and obtain an approximation to the ecological status of the zone of study.
E. Dimension Integrity
With the four dimensions already zoned, their correlation degree was verified since
correlated variables may slant the outcomes; in case of integrating them by means
of a criteria evaluation, it would be necessary to distribute the weighing values [8].
Therefore, through the determination coefficient r2, it was found that there is not a
significant linear correlation between any of the four dimensions (the highest
correlation value was 0.13 between multifunctionality and ecological connectivity,
between the others it was lower than 0.04). In order to integrate the four dimensions,
they were analyzed in a scale from 1 to 10 to compare them, and then, by the means
of a Hierarchical Analysis Process-HAP prepared in HAP Excel template
(http://bpmsg.com), the weight of each dimension for their integration was
determined. Ecological connectivity (48%), multifunctionality (30%), ecological
status (13%), and accessibility to the population (9%) were the final outcomes.
The weight distribution is performed through a qualification of the importance of each
dimension over the others, in a scale from 1 to 9 (same importance to higher
importance). Such qualification was done taking into account their method and a

Characterization of Green Infrastructure at the Local Level with Geographical Information System, Tunja (Colombia)
Revista Facultad de Ingeniería (Rev. Fac. Ing.) Vol. 29 (54), e10294. 2020. Tunja-Boyacá, Colombia. L-ISSN: 0121-1129, e-ISSN: 2357-5328, DOI: https://doi.org/10.19053/01211129.v29.n54.2020.10294
higher number of calculation parameters in the dimensions. In other words, the
dimension that had a higher number of parameters for its zoning is more relevant
than the others.
F. Green Infrastructure
Bearing in mind the integration of the four dimensions, the GI index was found, so
the pixels that had a value higher than the third quartile were chosen (value that gets
the highest 25% of frequencies and observations in a data group) as the areas
susceptible to integrate to a GI being.
III. DISCUSSION
A. Multifunctionality
In the Figure 1(a), it is displayed the multifunctionality of Tunja, and in Table 5 there
are the average value of the surveyed grading and the ecosystem services evaluated
for each coverage and soil use. It was found that the coverage of dense, open, and
riparian forests, and wetlands showed a higher average in the grading (>3), followed
by the coverage of scrublands, grasslands, wooden plains and the tree plantations
(2.5 to 3). The coverage of mosaics with nature landscapes, green zones, and urban
recreational areas presented a lower value (2 to 2.5). Finally, the coverage of clean
plains, crop mosaics, urban, industrial, and degraded zones had the lowest average
of the grading (<2).

Cristian Hernández-Rojas; Rigaud Sanabria-Marin
Revista Facultad de Ingeniería (Rev. Fac. Ing.) Vol. 29 (54), e10294. 2020. Tunja-Boyacá, Colombia. L-ISSN: 0121-1129, e-ISSN: 2357-5328, DOI: https://doi.org/10.19053/01211129.v29.n54.2020.10294
Fig. 1. GI dimensions of Tunja. a) Multifunctionality b) Ecological connectivity, c) Accessibility to the
population, d) Ecological status. Own elaboration.
Table 5. Multifunctionality average evaluation. Survey-based elaboration.
Coverage and Soil use Value Coverage and soil use Value
Degraded lands 1.16 Tree plantation 2.63
Industrial zones 1.19 Dense grassland 2.69
Resources exploitation 1.22 Wooden plains 2.69
Urban area 1.78 Dense scrubland 2.81
Crop mosaic 1.8 Wetland 3.42
Clean grassland 1.92 Low open forest 3.47
Recreational facilities 2.09 High open forest 3.52
Crop and grass mosaics, nature zones 2.34 Riparian forest 3.59
Urban Green zones 2.44 Low dense forest 3.64
Grass mosaics with natural spaces 2.44 High dense forest 3.8
Open scrubland 2.61
The values above are product of the grading of eight professionals in the territory
planning field, who with several different approaches, give a systemic view of the
input that several coverage and soil uses in the lending of varied ecosystem services

Characterization of Green Infrastructure at the Local Level with Geographical Information System, Tunja (Colombia)
Revista Facultad de Ingeniería (Rev. Fac. Ing.) Vol. 29 (54), e10294. 2020. Tunja-Boyacá, Colombia. L-ISSN: 0121-1129, e-ISSN: 2357-5328, DOI: https://doi.org/10.19053/01211129.v29.n54.2020.10294
can provide. Nevertheless, it is necessary to involve more people in the grading who
can contribute, apart from theoretical knowledge, experiences about the particular
dynamics of the coverage and soil uses of Tunja.
B. Ecological Connectivity
Through the calculation of the BAI it was found that the urban zone, the main road
and railroad net are the most important ones for the spatial ecological connectivity
of Tunja. Therefore, these zones represent the lowest values obtained in the
Ecological Connectivity Index. In this index (Figure 1(b)), the highest value was 8,
being there the zones with the highest connectivity in the west of the town, bordering
on the towns of Cucaita and Samaca (referring to the area of the Protective Forest
Reserve El Malmo and the Paramo Altiplano Cundiboyacense). Moreover, zones
with high value in this connectivity in surrounding areas of the wetland located to the
southwest of the town are presented along with the forest coverage of it as well.
C. Accessibility
It was found a predominantly permeable or approachable surface in relation to the
trail and path ways, especially from downtown to the north of Tunja, as shown in the
Figure 1(c). However, this is a simplification as it was not taken into account the
population concentration or thickness as a displacement object.
D. Ecological Status
It is shown in Figure 1(d) the presence of negative values that represent low-medium
naturalness zones and high contrast. Nevertheless, the proportion of these negative
values, which represent the worst ecological status, is relatively low, and are
concentrated mainly on the wetlands and the tree vegetation. a) Naturalness: the
coverage with some sort of anthropic intervention (For instance, crop mosaics, clean
grasslands, urban zones, among others.), obtained the lowest naturalness value (0
to 2); nature-type coverage, where the arboreal coverage proportion is higher, like
forests and wetlands, received the highest values (3 to 4). The medium average (2
to 3) are normally in relation to the adjacencies of the tessellation with different
Cristian Hernández-Rojas; Rigaud Sanabria-Marin
Revista Facultad de Ingeniería (Rev. Fac. Ing.) Vol. 29 (54), e10294. 2020. Tunja-Boyacá, Colombia. L-ISSN: 0121-1129, e-ISSN: 2357-5328, DOI: https://doi.org/10.19053/01211129.v29.n54.2020.10294
coverage and soil uses types. b) Contrast: An important highlight in the wetland zone
located to the southeast of the town (Paso Amarillo Wetland) was found along with
the arboreal vegetation predominance zones; moreover, while analyzing the contrast
as a relationship among the coverage adjacencies, zones with a high quantity of
different types of coverage stand out, showing an ecological fragmentation in the
territory.
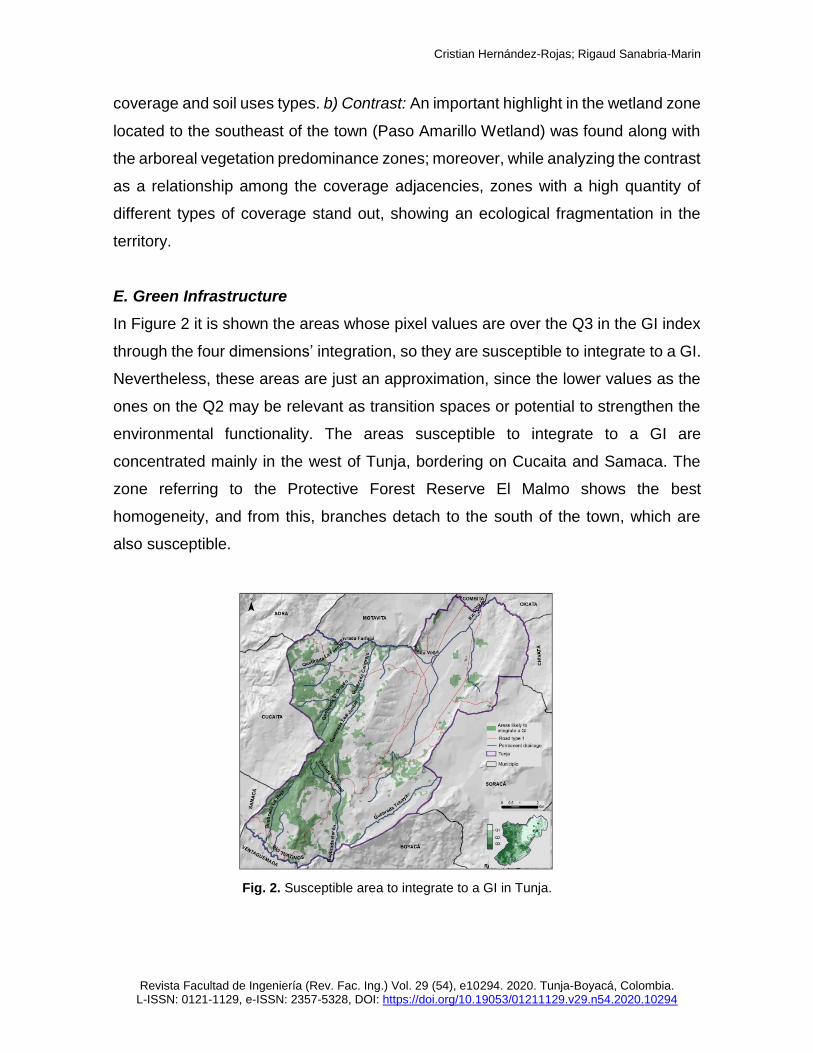
E. Green Infrastructure
In Figure 2 it is shown the areas whose pixel values are over the Q3 in the GI index
through the four dimensions’ integration, so they are susceptible to integrate to a GI.
Nevertheless, these areas are just an approximation, since the lower values as the
ones on the Q2 may be relevant as transition spaces or potential to strengthen the
environmental functionality. The areas susceptible to integrate to a GI are
concentrated mainly in the west of Tunja, bordering on Cucaita and Samaca. The
zone referring to the Protective Forest Reserve El Malmo shows the best
homogeneity, and from this, branches detach to the south of the town, which are
also susceptible.
Fig. 2. Susceptible area to integrate to a GI in Tunja.

Characterization of Green Infrastructure at the Local Level with Geographical Information System, Tunja (Colombia)
Revista Facultad de Ingeniería (Rev. Fac. Ing.) Vol. 29 (54), e10294. 2020. Tunja-Boyacá, Colombia. L-ISSN: 0121-1129, e-ISSN: 2357-5328, DOI: https://doi.org/10.19053/01211129.v29.n54.2020.10294
Specifically, in the urban area it was found that the zoning of areas susceptible to a
GI is practically null. This does not mean that there are not zones whose intrinsic
and contextual characteristics do not allow the grading under this concept, but that
it is necessary the adaptation of the starting data to a greater scale, and the use of
another methodology according to such scale as, if the purpose were to calculate
the ecological connectivity (by the use of the BAI) for an urban scale, the analysis
would be virtually based almost entirely on barrier typology. Likewise, the
prioritization of ecosystem services must be focused on the urban area.
It is important to remark that in the integration of the dimensions; it would have been
possible to work with equal weights (25% each) by the means of a conservative
approach. Nevertheless, the weight distribution according to the calculation types
and characteristics of each dimension, allowed to somehow prioritize those areas
which possess a potential connectivity and multifunctionality in the territory facing
the possibility of accessibility to the population and the ecological status in
accordance with interaction of coverage typology adjacencies.
From the areas determined as susceptible to integrate to the GI, it is possible to take
as reference four zones (Z1a, Z1b, Z2, Z3 and Z4) given their characteristics such
as closeness, fragmentation, micro basin, and present coverage, as seen in Figures
3 and 4.
Fig. 3. Homogeneous zones in the GI of Tunja by satellite image. Satellite image of Sentinel 2
(February, 2019).

Cristian Hernández-Rojas; Rigaud Sanabria-Marin
Revista Facultad de Ingeniería (Rev. Fac. Ing.) Vol. 29 (54), e10294. 2020. Tunja-Boyacá, Colombia. L-ISSN: 0121-1129, e-ISSN: 2357-5328, DOI: https://doi.org/10.19053/01211129.v29.n54.2020.10294
Figure 4. Detail of homogeneous zones in the GI of Tunja by satellite image. a) Zone Z1a, b) Zone
Z4, c) Zone Z1b, d) Zone Z2 and Z3. Satellite image of Sentinel 2 (February, 2019).
1) Zone Z1a. Western strip (Centre to north). This zone is composed mainly of
clean grasslands and farmlands coverage, as well as little forest areas, wooded
grasslands and natural spaces. The Wetland “El Cardon” in El Porvenir County does
not show any isolation, so surrounding agricultural activities affect the native
vegetation and the emergence of surfactants (substance that decreases the surface
tension) in the water due to the use of detergents [19], altering in this way the
ecological quality of such system. In the area determined as “Paramo Altiplano
Cundiboyacense” is located the source of creeks (or minor drainage) such as La
Fuente, El Origen, El Cangrejo, and Las Juntas (microbasins being Farfaca, El
Floral, and El Cangrejo), which are affluent from the Farfaca creek and the La Vega
River, and therefore the subbasin La Vega. According to Acero and Cortes [20] this
subbasin has deteriorated its soil and fauna and flora species due to the local
activities, so it is necessary to implement ecological restoration strategies.

Characterization of Green Infrastructure at the Local Level with Geographical Information System, Tunja (Colombia)
Revista Facultad de Ingeniería (Rev. Fac. Ing.) Vol. 29 (54), e10294. 2020. Tunja-Boyacá, Colombia. L-ISSN: 0121-1129, e-ISSN: 2357-5328, DOI: https://doi.org/10.19053/01211129.v29.n54.2020.10294
2) Zone Z1b. Western strip (Centre to south). This zone is composed mainly of
the forest and the dense scrubland (Protective Forest Reserve area El Malmo),
gallery forest in the strip of the different drainages, wooden grasslands and
farmlands located on the reserve area perimeter. Likewise, there are the wetlands
“Aposentos”, “Fuente Negra”, and “Yerbabuena” in La Hoya, Barón Germania and
La Fajita Counties. In the area surrounding the reserve, there are source of creeks
like La Hoja, Las Perdices, Barón, Verbenal ravine, (microbasins being Barón
Gallero, Teatinos-Verde, and Yerbabuena), which are affluent from the Teatinos
river and therefore the Teations subbasin as well. The forest of this subbasin is
characterized by generating the processes of water catchment, storage, and
regulation to the Tunja aquifer and many aqueducts [21]. In [19] there is further
information about the existent species in the Protective Forest Reserve El Malmo.
3) Zone Z2. In this zone the agricultural and rancher activities domain the area,
which surround the wetland “Paso Amarillo” in the Chorro Blanco County, one of the
most extensive in town. Due to the agricultural activities present in the wetland, there
is agricultural waste [19] that affects the ecological status of this system. Moreover,
there is the Tobaya Creek (Tobaya microbasin), which is affluent from the subbasin
Teatinos.
4) Zones Z3 and Z4. These are focused mainly on forest areas and their closest
surroundings, with the particularity of being located on the Tunja urban area
perimeter, and having an evident fragmentation as well. To the south of the city is
located the forest area between the Jordan River (Chulo River) and Tobaya Creek,
which is what would be the urban area boundaries with the Runta County. In
addition, Zone 4 is focused on arboreal coverage patches. To the east are located
forest zones near La Colorada creek in Pirgua County, close to the Bogota-Tunja-
Sogamoso (BTS) freeway, and the freeway which points to Soraca. To the west are
located forest patches bordering on Motavita, along with the forest zone close to the
La Vega River and Universidad Pedagógica y Tecnológica de Colombia.

Cristian Hernández-Rojas; Rigaud Sanabria-Marin
Revista Facultad de Ingeniería (Rev. Fac. Ing.) Vol. 29 (54), e10294. 2020. Tunja-Boyacá, Colombia. L-ISSN: 0121-1129, e-ISSN: 2357-5328, DOI: https://doi.org/10.19053/01211129.v29.n54.2020.10294
IV. CONCLUSIONS
The input in the ecosystem services of coverage and soil uses of Tunja, or of the
multifunctionality, is tightly connected to the presence of forests and wetlands
coverage.
The urban area of Tunja and the main communication roads are the hugest obstacle
for the ecological connectivity of the city. In relation to the areas with the highest
ecological connectivity index, the western strip of Tunja presents more homogeneity,
mainly because of the presence of the Protective Forest Reserve El Malmo and the
Paramo Altiplano Cundiboyacense area. On the contrary, the middle zone in the
northeast of the city is the strip with the lowest ecological connectivity due to the
acting of the barriers.
The accessibility to the population of Tunja is very high from practically any point on
the surface. However, in this calculation, it was not taken into account factors like
population density, culture interest places, transport means, among others.
The ecological state, as a calculation approximation between coverage and soil uses
naturalness and contrast show the coverage fragmentation present especially from
the middle part to the northwest strip, referring to Paramo Altiplano Cundiboyacense.
In addition, it is observable the vulnerability that valuable ecosystems have due to
the soil uses on their perimeters.
The areas susceptible to integrate to a GI are concentrated mainly on the western
strip of the city, with more fragmentation on the northwest area tan on the southwest
area (which is related to the Protective Forest Reserve El Malmo). These zones must
be object of a more detailed evaluation that permits the prioritization of actions aimed
to the territory or GI planning. It is necessary to include areas with less integration
value, as well as transition spaces that ease the ecological connectivity.
The methodology used in this study has multiple benefits in the approximation of
areas susceptible to integrate to a GI in local and regional scales, and as a support
asset in the territory ordering. Nevertheless, in an urban level, the applicability of the
aforementioned methodology should be modified as the ecological connectivity and
status approach may alter the outcomes; that is why it would be necessary to focus

Characterization of Green Infrastructure at the Local Level with Geographical Information System, Tunja (Colombia)
Revista Facultad de Ingeniería (Rev. Fac. Ing.) Vol. 29 (54), e10294. 2020. Tunja-Boyacá, Colombia. L-ISSN: 0121-1129, e-ISSN: 2357-5328, DOI: https://doi.org/10.19053/01211129.v29.n54.2020.10294
more on the barrier analysis. Likewise, the identification of the ecosystem services
and the accessibility areas for the exploitation of these must be centered on the
urban aspect.
AUTHOR’S CONTRIBUTION
The methodology development was conducted by Cristian Hernandez Rojas under
the coordination of Rigaud Sanabria Marin. The data collection, data analysis and
writing of this paper was carried out by the two authors.
REFERENCES
[1] Comisión Europea, Construir una infraestructura verde para Europa. Oficina de Publicaciones Oficiales de
la Unión Europea, Luxemburgo. pp. 1-24. 2014. https://doi.org/10.2779/2738.
[2] M. Canto, “La ordenación de la Infraestructura Verde en el sudeste Ibérico (Comunidad Valenciana,
España),” Cuadernos de Biodiversidad, vol. 45, pp. 10-22, 2014.
https://doi.org/10.14198/cdbio.2014.45.03.
[3] Environmental Systems Research Institute-ESRI, Green Infrastructure for the US: Maps and Apps to
connect the most valuable landscapes in the nation. United States of America, pp. 1-35, 2016. Available
at: https://www.naco.org/sites/default/files/event_ attachments/ESri_Green_Infrastructure_Booklet.pdf.
[4] A. Vásquez, “Infraestructura verde, servicios ecosistémicos y sus aportes para enfrentar el cambio
climático en ciudades: el caso del corredor ribereño del río Mapocho en Santiago de Chile,” Revista de
Geografía Norte Grande, vol. 63, pp. 63-86, 2016. https://doi.org/10.4067/S0718-34022016000100005.
[5] S. Jones, and C. Somper, “The role of green infrastructure in climate change adaptation in London,” The
Geographical Journal, vol. 180 (2), pp. 191-196, 2014. https://doi.org/10.1111/geoj.12059.
[6] O. Moreno, C. Lillo, and V. Gárate, “La infraestructura verde como espacio de integración: análisis de
experiencias y estrategias sustentables para su consideración en la planificación, diseño y gestión del
paisaje en la Intercomuna Temuco - Padre las Casas, Chile,” in XI Simposio de la Asociación Internacional
de Planificación Urbana y Ambiente, Argentina, 2014. Available at:
https://sedici.unlp.edu.ar/handle/10915/53434.
[7] Environmental Systems Research Institute-ESRI, Planning a Sustainable Community Begins with You: Six
Step Process to Green Infrastructure. United States of America, 2018. Available at:
https://www.esri.com/about-esri/greeninfrastructure/plan.
[8] F. Aguilera, V. Rodríguez, and M. Gómez, “Definición de infraestructuras verdes: una propuesta
metodológica integrada mediante análisis espacial,” Documents D'Anàlisi Geogràfica, vol. 64 (2), pp. 313-
337, 2018. https://doi.org/10.5565/rev/dag.419.
[9] C. Liquete, S. Kleeschulte, G. Dige, J. Maes, B. Grizzetti, B. Olah, and G. Zulian, “Mapping green
infrastructure based on ecosystem services and ecological networks: A Pan-European case study,”
Environmental Science & Policy, vol. 54, pp. 268-280, 2015. https://doi.org/10.1016/j.envsci.2015.07.009.

Cristian Hernández-Rojas; Rigaud Sanabria-Marin
Revista Facultad de Ingeniería (Rev. Fac. Ing.) Vol. 29 (54), e10294. 2020. Tunja-Boyacá, Colombia. L-ISSN: 0121-1129, e-ISSN: 2357-5328, DOI: https://doi.org/10.19053/01211129.v29.n54.2020.10294
[10] F. Remolina, “Figuras municipales de conservación ambiental en Colombia: ¿áreas protegidas, redes
ecológicas o infraestructuras verdes?,” Revista nodo, vol. 11 (6), pp. 65-76, 2011.
[11] Alcaldía municipal de Tunja, Análisis de la situación de salud con el modelo conceptual de determinantes
sociales de la salud. Colombia, pp. 1-138, 2013. Available at:
https://www.boyaca.gov.co/SecSalud/images/Documentos/ASIS_2013/ASIS%20%TUNJA%202013.pdf.
[12] M. Rincón, “Procesos de transformación urbana: El caso de Tunja 1900-2005,” Perspectiva Geográfica,
vol. 1 (14), pp. 13-44, 2009.
[13] J. Marull, and J. Mallarach, “La conectividad ecológica en el Área Metropolitana de Barcelona,”
Ecosistemas, vol. 2, pp. 1-22, 2002.
[14] J. Mallarach, Análisis y diagnóstico de la conectividad ecológica y paisajística en el sector sur del Anillo
Verde de Vitoria-Gasteiz: Estudio de opciones y alternativas para maximizar el beneficio social y ecológico
de los enlaces potenciales del Anillo Verde con los Montes de Vitoria. Vitoria-Gasteiz, pp. 1-21, 2004.
[15] J. Marull, “Metodologías paramétricas para la evaluación ambiental estratégica,” Ecosistemas, vol. 2, pp.
1-9, 2005.
[16] Unidad de Planificación Rural Agropecuaria-UPRA, Evaluación de Tierras para la Zonificación con fines
Agropecuarios: Metodología a Escala General (1:100.000). Ministerio de Agricultura y Desarrollo Rural,
Colombia, pp. 1-111, 2013. Available at:
https://www.upra.gov.co/documents/10184/13821/Metodolog%C3%ADa_Evaluaci%C3%B3n_de_Tierras
+1-100000.pdf.
[17] L. García Leyton, Aplicación del análisis multicriterio en la evaluación de impactos ambientales, Doctoral
thesis, Universitat Politècnica de Catalunya, Departament de Projectes d’Enginyeria, 2004. Available at:
http://hdl.handle.net/10803/6830.
[18] K. McGarigal, Fragstats Help. University of Massachusetts, Amherst. pp. 1-182. 2015. Available at:
https://www.umass.edu/landeco/research/fragstats/fragstats.html.
[19] Universidad Nacional De Colombia, Primera Revisión POT de Tunja: Anexo Técnico Físico Biótico.
Alcaldía de Tunja, Colombia, pp. 1-111, 2014.
[20] A. Acero, and F. Cortés, “Propagación de especies nativas de la microcuenca del río La Vega, Tunja,
Boyacá, con potencial para la restauración ecológica,” Ciencias Naturales, vol. 38 (147), pp. 195-205,
2014.
[21] Corpoboyacá, Cartilla Plan de Manejo Ambiental Acuífero de Tunja, pp. 1-32. Available at:
https://www.corpoboyaca.gov.co/nuestra-gestion/planes/plan-de-manejo-ambiental-acuifero-de-tunja/.