characterization of gas hydrates with pxrd, dsc, nmr, and raman - copia
TRANSCRIPT

8/10/2019 Characterization of Gas Hydrates With PXRD, DSC, NMR, And Raman - Copia
http://slidepdf.com/reader/full/characterization-of-gas-hydrates-with-pxrd-dsc-nmr-and-raman-copia 1/10
Chemical Engineering Science 62 (2007) 3930–3939www.elsevier.com/locate/ces
Characterization of gas hydrates with PXRD, DSC, NMR, and Ramanspectroscopy
Robin Susilo a , b, John A. Ripmeester a ,∗, Peter Englezos b
aSteacie Institute for Molecular Sciences, National Research Council Canada, Ottawa, Ont., Canadab Department of Chemical and Biological Engineering, University of British Columbia, Vancouver, BC, Canada
Received 15 October 2006; received in revised form 23 March 2007; accepted 30 March 2007Available online 19 April 2007
Abstract
Structure I (sI) and H (sH) hydrates containing methane were synthesized and characterized with PXRD, DSC, NMR, and Raman spectroscopy.Three well-known large molecule guest substances (LMGSs) were selected as sH hydrate formers: 2,2-dimetylbutane (NH), methylcyclohexane(MCH), and tert -butyl methyl ether (TBME). The solid phase analysis conrmed the presence of sH hydrate whenever a LMGS was present.The presence of a non-hydrate former (n-heptane) did not affect the methane hydrate structure or cage occupancies. Ice to hydrate conversionwas limited when the LMGS amount was less than stoichiometric and synthesized at low methane pressure, but nearly complete conversion wasachieved with temperature ramping and excess LMGS. The methane occupancies were found to depend on the type of LMGS and increasedwith pressure. The hydrate with TBME was found to have the smallest methane content followed by the hydrates with NH and MCH. BothNMR and Raman identied methane and LMGS signals from the hydrate phase, however, the cage occupancy values of sH hydrate can onlybe obtained from NMR spectroscopy. The hydrate structures, ice to hydrate conversion, gas content in hydrate and cage occupancy from thevarious measurements are consistent with each other.
2007 Published by Elsevier Ltd.
Keywords: Structure H hydrate; Methane; LMGS; Gas storage
1. Introduction
Gas hydrates are non-stoichiometric crystals composed of water and guest molecules that generally form under high pres-sure and low temperature conditions. Thewater molecules serveas the crystal host framework that is stabilized by the inclusionof suitably sized guest molecules. There are three well-knownhydrate structures: cubic structure I (sI), cubic structure II (sII)and hexagonal structure H (sH). Studies on sI and sII hydratehave been carried out for more than 50 years but not for sHhydrate, which was just discovered in 1987 at the National Re-search Council of Canada (NRC) (Ripmeester et al., 1987 ). Inrecent years, the study of sH hydrates has emerged rapidly be-cause of their unique properties. Firstly, two guest moleculesof different sizes are required for sH hydrate, unlike sI and sIIwhere one guest molecule is enough to stabilize the crystal.
∗ Corresponding author. Tel.: +1613993 2011; fax: +1 613998 7833. E-mail address: [email protected] (J.A. Ripmeester).
0009-2509/$- see front matter 2007 Published by Elsevier Ltd.doi:10.1016/j.ces.2007.03.045
Secondly, sH hydrate has the largest cage among all the knownhydrate structures hence larger molecules like methylcyclohex-ane can t into the cavity. The addition of a large moleculeguest substance (LMGS) may also reduce the equilibrium pres-sure while maintaining high gas storage capacity due to the ac-cessibility of both small and medium cages. Hence sH hydrateis seen as a valid potential and attractive opportunity for gasstorage application ( Englezos and Lee, 2005; Khokhar et al.,1998; Tsuji et al., 2005; Mori, 2003 ). However, a solid foun-dation on which to base sH hydrate characterization is vitalbefore technological developments can be pursued.
The study on a molecular scale is essential to make surethat the hydrate properties are known prior to advancing toa larger synthetic scale. Powder X-Ray diffraction (PXRD),Raman and Nuclear Magnetic Resonance (NMR) spectroscopyare the well-known tools used for solid structural analysis,including that of gas hydrate ( Ripmeester and Ratcliffe, 1988,1999; Sloan, 2003; Tulk et al., 2000 ). Such techniques arerequired to obtain information on crystal structure, crystal

8/10/2019 Characterization of Gas Hydrates With PXRD, DSC, NMR, And Raman - Copia
http://slidepdf.com/reader/full/characterization-of-gas-hydrates-with-pxrd-dsc-nmr-and-raman-copia 2/10
R. Susilo et al. / Chemical Engineering Science 62 (2007) 3930 – 3939 3931
dimension/volume, and composition/cage occupancy values.A thermal analysis technique such as Differential ScanningCalorimetric (DSC) is also employed ( Dalmazzone et al., 2002;Giavarini et al., 2006; Parlouër et al., 2004 ). However, a com-bination of all instrumental methods to characterize the hydratephase has not been reported so that the information obtained
from each technique has not been used without relating to theothers to obtain a more complete model. Interpreting the ex-perimental data from PXRD and NMR for methane hydrate inall hydrate structures is already well established and often themeasurement from each instrumental method may explain theresults independently. However, Raman spectroscopy still re-quires attention especially in determining hydrate structure andthe composition for complex systems like sH hydrate.
Both Raman and NMR spectroscopy have been successfullyemployed to study gas hydrate at a molecular level ( Kini etal., 2004 ; Komai et al., 2004; Pietrass et al., 1995; Yoon etal., 2004). These instrumental methods are based on differentprinciples and hence have different advantages and limitations.Raman is convenient for in situ measurements but is not sodiagnostic for structure and composition whereas NMR is moresensitive to changes in local environment and is quantitativein terms of numbers and speciation, hence of greater value.A direct comparison between the two is required to establisha common understanding of the interpretation of the spectra.Both NMR and Raman gave comparable cage occupancy val-ues for methane in structure I (sI) hydrate (Uchida et al., 2003;Wilson et al., 2002 ) yet a discrepancy was reported for methanein mixed hydrate with carbon dioxide (Wilson et al., 2002 ).Methane occupancy in sH hydrate also has been reported fromNMR and single crystal diffraction study ( Seo and Lee, 2003 ;
Udachin et al., 2002a,b ). However, it is still unsure if Raman can also be used to obtain such occupancy values for sHalthough the identication of methane signals has been reported(Chou et al., 2000; Sum et al., 1997; Sun et al., 2005; Uchidaet al., 2006) and occupancy values were suggested (Uchidaet al., 2006). Due to the different chemical environment, bothRaman and NMR showthat when a molecule is encaged the sig-nal in the hydrate phase may be shifted from those in the liquidor gas phases. For the encaged methane molecule, its signaturein all three hydrate structures is shifted to a lower frequencyin Raman ( Sum et al., 1997 ) and lower eld in NMR ( Seo andLee, 2003; Subramanian et al., 2000 ). Generally the shifts in
Raman spectra are not structure specic and a large cage/smallcage occupancy ratio has to be derived from other considera-tions. Hence one has to be more careful in determining hydratestructure and its composition from Raman. The 13C methanechemical shift from NMR spectroscopy is more structure spe-cic so that there is rather less ambiguity. However, the chemi-cal shift of methane in the small cages of all hydrate structuresis quite similar due to the similar chemical environment andthe signal of methane in 5 12 and 435663 cages of sH hydratecan be expected to be very near to each other. Surprisingly, itwas reported recently that Raman signals for methane could beassigned to both contributions from both small cages (Uchidaet al., 2006). Most Raman spectra reported previously for sHhydrates in the literature have shown only one broad peak at
around ∼2913–2918cm − 1 (temperature dependent) that cor-responds to methane in both small and medium cages ( Chou etal., 2000; Sum et al., 1997; Sun et al., 2005 ). None of this work shows a distinct peak for the two except the last publishedspectra. So it is interesting to investigate this puzzle.
The objective of this study is to present a direct compar-
ison of the three solid-state analytical tools (PXRD, NMR,and Raman) plus DSC for sH hydrate characterization. In ad-dition, the presence of n-heptane (nC 7) as a non-hydrate for-mer will also be studied along with a system without LMGSadded. The structural information from PXRD will be linkedto both NMR and Raman shifts. The signals from NMR andRaman will be used to identify the corresponding moleculesin each phase and to determine the cage occupancy. The occu-pancy values obtained from thespectroscopic techniques will becompared with the gas content measured by decomposing thehydrate.
2. Experimental apparati and procedures
Hydrates were synthesized from freshly ground ice particlesthat were poured by gravity into a 50 ml pressure vessel. Ap-proximately ∼10g of ice powder was used, with the LMGSsprayed on top of the ice with a syringe after loading the icepowder. The amount of LMGS was varied from 200% (excess)to 50% of the stoichiometric composition. The list of chemi-cals/LMGS used in this study is summarized in Table 1 . Theloading procedure was performed in a freezer at ∼253K toprevent the melting of the ice. The vessel was then immersedin a constant temperature bath containing a water–methanolmixture and connected to a valve and pressure transducer. Thezero-time of the measurements was recorded as the gas pres-sure vessel reached the desired value. All measurements wereperformed at 253 K over about 20 h. At the end of the 20-hperiod the temperature was increased to a point above the ice-point (274K) within 5 min in order to enhance the conversionof ice into hydrate. It is well known that temperature ramp-ing enhances the conversion to hydrate ( Wang et al., 2002 ).Two starting pressure conditions were chosen, ∼43 (Low) and81 bars (High) which would give nal pressures well below andabove the equilibrium value for sI methane hydrate at 274K.The hydrate samples were collected at liquid nitrogen temper-ature (82 K) at the end of the experiment after signicant pres-sure drops were no longer observed (almost complete hydrateconversion achieved). The recovered hydrate samples were keptin liquid nitrogen for subsequent analysis.
Table 1List of chemicals used in this work
Chemical Certied purity Supplier
Methane UHP grade Praxairtert -Butyl methyl ether (TBME) 99.9% Sigma AldrichNeohexane (NH) 99% + Sigma AldrichMethylcyclohexane (MCH) 99% + Sigma Aldrichn-Heptane (nC 7) 99%+ Omnisolv
Water Distilled

8/10/2019 Characterization of Gas Hydrates With PXRD, DSC, NMR, And Raman - Copia
http://slidepdf.com/reader/full/characterization-of-gas-hydrates-with-pxrd-dsc-nmr-and-raman-copia 3/10
3932 R. Susilo et al. / Chemical Engineering Science 62 (2007) 3930– 3939
Crystal structures and lattice constants were obtained fromPXRD. The PXRD patterns were recorded at ∼85K on aRigaku Geigerex diffractometer ( = 1.79021) in the / 2scan mode. The XRD experiments were carried out in stepmode with a xed time of 5s and a step size of 0 .05◦ for2 = 5–50◦ with a total acquisition time of ∼75 min for each
hydrate sample. The crystal structure was then correlated toresults from 13C magic angle spinning (MAS) NMR at 193 Kand Raman spectroscopy at liquid nitrogen temperature. ABruker DSX 400 MHz NMR spectrometer was used to analyzethe hydrate structure and cage occupancies of methane andLMGS. Prior to the NMR measurements, hydrate samples wereground under liquid nitrogen and packed in a 7 mm zirconiarotor, which was loaded into a variable temperature probe. All13C NMR spectra were recorded at ∼2 kHz spinning rate. Asingle pulse excitation (90 ◦ of 5 s) and pulse repetition delayof 300 s under proton decoupling were employed. The cross-polarization technique was also employed to distinguish thesignals arising from the solid phase from those of the liquidphase. Adamantane was used as the external chemical shift ref-erence at 298 K and 38.56ppm. An Acton Raman spectrographwith ber optics and equipped with a 1200 grooves/mm gratingand a CCD detector was used in this study. An Ar-ion laser wasused as the excitation source emitting at 514.53 nm. The laserwas focused on the sample by a 5 × microscope objective. Thespectrograph was controlled with a computer and the spectrawere recorded with a 1 s integration time over 5–30 scans. Allspectra were referenced to methane gas at 2918cm − 1.
The amount of hydrate, unreacted ice and unreacted LMGSwas determined by DSC. Hydrate samples were sealed in analuminum pan under liquid nitrogen and placed in the DSC cell
at − 150 ◦ C. The sample was equilibrated at that temperature for∼10 min before heating to 30 ◦ C with the rate of 5 ◦ C/ min.Thesamples were all frozen at − 150 ◦ C so that a phase change dueto melting appeared at the melting point of the LMGS, hydrateand ice. The areas for each phase transition peak correspondto the energy absorbed due to decomposition or melting. Theamount of the corresponding phase can be calculated by cali-brating the peak area with the heat of fusion values given in theliterature (Anderson, 2004; Linstrom and Mallard, 2005 ). Thedissociation enthalpy of hydrate was calculated from the hy-drate phase equilibria data using the Clausius–Clapeyron equa-tion (Yoon et al., 2003 ). Hence the amount of unreacted ice and
LMGS can be calculated from the mass balance. The hydrateconversion and the gas stored in the hydrate were also cross-checked by measuring the gas release while decomposing thehydrate in a vacuum line of a known volume.
3. Results and discussions
All synthetic hydrate samples were rst analyzed with PXRDto conrm the presence of hydrate and to verify the crystalstructure. A typical PXRD pattern of sH hydrate is shown inFig. 1. The pattern was tted to a standard sH hydrate pattern(space group P6/mmm) to obtain the lattice constants and unitcell volumes, which are summarized in Table 2 . The unit cellvolumes were found to increase slightly on going from TBME,
10 20 30 40 502 [Degrees]
I n t e n s i t y
* * *
101
002
201
102 2
10
211
202
003
301
103
212
310
220 2
03
222
213
312
303
204
322
214
Fig. 1. PXRD pattern of sH hydrate (TBME + methane ) .
Table 2Lattice constants and unit cell volumes of synthesized hydrate obtained at82 K
System Hydratestructure
Latticeconstants ( A)
Unit cellvolume ( A3)
CH4 + H2O I a = 11.85 1665CH4 + H2O + nC7 I a = 11.85 1665CH4 + H2O + TBME H a = 12.16 1294
c = 10.10CH4 + H2O + NH H a = 12.18 1295
c = 10.08CH4 + H2O + MCH H a = 12.16 1297
c = 10.13
NH, to MCH. The presence of ice is indicated by the asterisk in Fig. 1. The intensity of the ice peaks for the sample corre-sponded to the amount of unreacted ice and some ice resultingfrom condensation of moisture in the air, which was found to beminimal for most samples. For those hydrates that were synthe-sized with an amount of LMGS that was less than stoichiomet-ric, the conversion of hydrate was very low at low pressure (sHstability region) as the intensity of ice peaks was predominant.Some ice particles that were not exposed to LMGS formed sIhydrate at higher pressures. Consequently, sI and sH hydrate
were detected by PXRD. Hydrates synthesized without LMGSor n-heptane as a non-hydrate former form sI hydrate. Once thePXRD conrmed that the solid phase contained hydrate, thegas stored in the hydrate phase was measured and the samplewas further analyzed to obtain the hydrate composition and un-reacted ice content by NMR, Raman spectroscopy, and DSC.
Table 3 summarizes the amount of gas stored in the hydrateas measured by decomposing the hydrate under vacuum. Thevolume ratio (v/v) of gas stored in the hydrate phase that isrelevant to practical interests is reported in the table. The ratioof gas per volume of water generated upon decomposition isalso given, which is slightly higher due to the higher densityof water than the hydrate phase. Synthetic hydrate made withn-heptane or without LMGS store the same amount of methane

8/10/2019 Characterization of Gas Hydrates With PXRD, DSC, NMR, And Raman - Copia
http://slidepdf.com/reader/full/characterization-of-gas-hydrates-with-pxrd-dsc-nmr-and-raman-copia 4/10
R. Susilo et al. / Chemical Engineering Science 62 (2007) 3930 – 3939 3933
Table 3Amount of gas stored in hydrate together with nal hydrate conversion achieved
LMGS amount/system Pressure [v/v] Gas/hydrate [v/v] Gas/water Conversion a (%)
No LMGS High 173 210 85200% nC 7 High 173 210 8550% TBME Low 32 41 22 b
High 131 c 166 98 d200% TBME Low 103 131 99
High 125 160 96 c
50% NH Low 20 26 14 b
High 144 c 184 96 d
200% NH Low 130 166 98High 139 177 91
50% MCH Low 72 c 92 45b,d
High 157 c 200 99 d
200% MCH Low 132 168 98High 142 181 87
aThe conversion was calculated from the total methane uptake divided by the uptake if all ice/water is converted into hydrate taking methane occupanciesinto account.
bThe conversion was obtained from the gas content measurements.cThe hydrate phase was calculated using lattice constants from sH hydrate.dThe conversion was calculated from total methane uptake divided by the uptake if all ice/water is converted into hydrate taking methane occupancy into
account for both sI and sH hydrate.
gas (173 v-gas/v-hydrate). The addition of LMGS lowers thehydrate formation pressure by forming sH hydrate so it is favor-able for methane storage and transport application, however, asa result the gas storage capacity in the hydrate phase decreases.The amount of methane gas stored in sH hydrates was found tobe approximately 20–40% lower (103–142 v-gas/v-hydrate, de-pending on the methane occupancy) than in sI hydrate. This isdue to the accessibility of all (both small and large cages) of sI
hydrate towards methane whereas only the small and mediumcages are accessible for sH hydrate. A methane molecule doesnot ll the large cavity of sH hydrate effectively, so the LMGSis preferred as cage occupant. The gas stored in sH hydrate de-pends on the type of LMGS used and on the pressure at whichthe hydrate is synthesized. The systems with MCH and NHhave higher methane content than TBME. A higher hydrate for-mation pressure increases the methane storage for all systems.Hydrate synthesized with 50% LMGS at lower pressures hasthe least methane content due to limited hydrate conversion.At higher pressures, the methane content increases due to theformation of sI hydrate.
Fig. 2 shows a DSC plot obtained from melting sH hydrate inthe presence of MCH. Similar plots were obtained for the otherhydrate forming systems. The melting curve obtained showsthat three distinct phases melt at different temperatures. Allphases are solid at the initial temperature of − 150 ◦ C. As thetemperature was increased, the unreacted LMGS melted rstfollowed by hydrate and nally ice. The amount of unreactedLMGS, hydrate, and ice (in moles) was calculated by calibrat-ing the peak areas with the corresponding heat of fusion. Therelevant heat of fusion data and hydration numbers are givenin Table 4 . The rst endothermic peak appeared at the meltingpoints of LMGS, which were at − 126, − 109, and − 100 ◦ C forMCH, TBME, and NH, respectively. Hydrate started to dis-
sociate at the corresponding hydrate equilibrium temperatures
-60
-50
-40
-30
-20
-10
0-140 -120 -100 -80 -60 -40 -20 0 20 40
Temperature [C]
H e a
t F l o w
[ m W ]
Excess MCH(282 mJ)
sH hydrate(3200 mJ)
Ice (6831 mJ)Unreacted iceplus dissociatedfrom hydrate
Fig. 2. DSC melting curve of ( methane + MCH) sH hydrate.
at 1 atm, which were approximately − 70, − 60 and − 55 ◦ Cfor TBME, MCH, and NH, respectively. The ice melting peak that appeared at 0 ◦ C resulted from unreacted ice and ice from
hydrate decomposition. Therefore, the ice that originated fromthe dissociated hydrate needed to be determined rst to ob-tain the amount of unreacted ice in the sample and hence thehydrate conversion. This was obtained by multiplying theamount of dissociated hydrate with the hydration number whichwas acquired from NMR measurements. It depends on the cageoccupancy and varies between ∼5.67 and 7.00. The amountof unreacted ice was then calculated by subtracting the totalamount of melted ice from that of the hydrate. The peak areaand the corresponding amount of each phase from Fig. 2 aregiven in Table 5 for the MCH system synthesized at lowerpressure. The hydrate conversion for that particular samplewas found to be 97%. This number is comparable to the totalconversion value calculated from the gas uptake taking into
8/10/2019 Characterization of Gas Hydrates With PXRD, DSC, NMR, And Raman - Copia
http://slidepdf.com/reader/full/characterization-of-gas-hydrates-with-pxrd-dsc-nmr-and-raman-copia 5/10
3934 R. Susilo et al. / Chemical Engineering Science 62 (2007) 3930– 3939
Table 4Heat of fusion and hydration number of LMGS, ice, and sH hydrate
System Heat of fusion(kJ/mol)
Hydration number a
TBME 7.60 – –NH 0.58 – –
MCH 6.75 – –Ice 6.01 – –(CH4 + TBME ) hydrate 16.21 7.00 b 6.19c
(CH4 + NH) hydrate 18.47 6.30 b 5.71c
(CH4 + MCH) hydrate 17.93 6.18 b 5.67c
aHydration number was calculated from the cage occupancy values obtainedby NMR.
bValues reported correspond to the hydrate system synthesized at lowpressure with LMGS excess (200%).
cValues reported correspond to the hydrate system synthesized at highpressure and LMGS excess (200%).
Table 5DSC summary of methane + MCH hydrate formed at low pressure withexcess LMGS
Phase Integratedarea (mJ)
Amount frommelting(mmol)
Amount fromhydrate(mmol)
Conversion intohydrate (%)
MCH 282 0.042 0.032 44(CH4+ MCH )hydrate
3200 0.179
Ice/water 6831 1.137 1.105 97
-20-1001020304050Chemical Shift [ppm]
I n t e n s i t y
High powerdecoupling
Cross-polarization
Fig. 3. 13C MAS-NMR spectra of ( methane + NH) sH hydrate, synthesizedwith 200% NH at low pressure condition (nal pressure ∼17bars at 274K).
account the cage occupancy and also from directly measuringthe gas stored in the hydrate phase, as given in Table 2 .
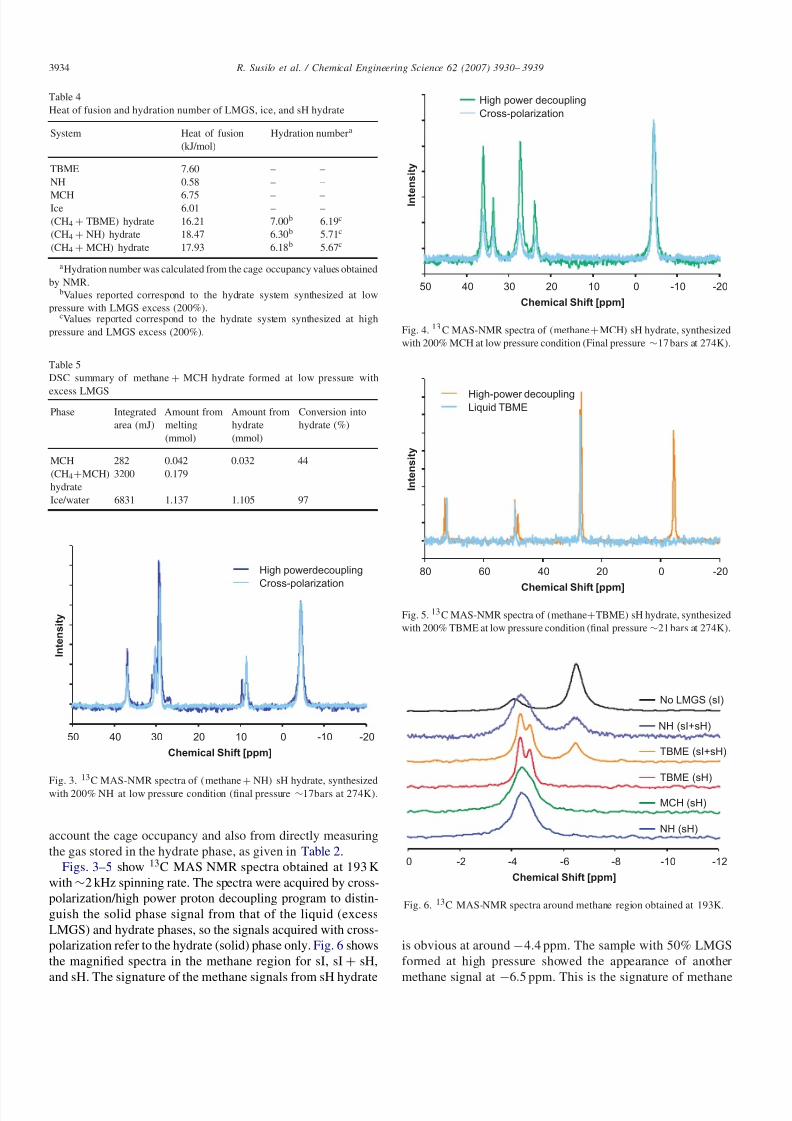
Figs. 3–5 show 13C MAS NMR spectra obtained at 193 Kwith ∼2 kHz spinning rate. The spectra were acquired by cross-polarization/high power proton decoupling program to distin-guish the solid phase signal from that of the liquid (excessLMGS) and hydrate phases, so the signals acquired with cross-polarization refer to the hydrate (solid) phase only. Fig. 6 showsthe magnied spectra in the methane region for sI, sI + sH,and sH. The signature of the methane signals from sH hydrate
-20-1001020304050Chemical Shift [ppm]
I n t e n s i t y
High power decouplingCross-polarization
Fig. 4. 13 C MAS-NMR spectra of (methane + MCH ) sH hydrate, synthesizedwith 200% MCH at low pressure condition (Final pressure ∼17bars at 274K).
-20020406080
Chemical Shift [ppm]
I n t e n s i t y
High-power decouplingLiquid TBME
Fig. 5. 13C MAS-NMR spectra of (methane + TBME ) sH hydrate, synthesizedwith 200% TBME at low pressure condition (nal pressure ∼21bars at 274K).
-12-10-8-6-4-20Chemical Shift [ppm]
No LMGS (sI)
NH (sI+sH)
TBME (sI+sH)
TBME (sH)
MCH (sH)
NH (sH)
Fig. 6. 13C MAS-NMR spectra around methane region obtained at 193K.
is obvious at around − 4.4 ppm. The sample with 50% LMGSformed at high pressure showed the appearance of anothermethane signal at − 6.5 ppm. This is the signature of methane

8/10/2019 Characterization of Gas Hydrates With PXRD, DSC, NMR, And Raman - Copia
http://slidepdf.com/reader/full/characterization-of-gas-hydrates-with-pxrd-dsc-nmr-and-raman-copia 6/10
R. Susilo et al. / Chemical Engineering Science 62 (2007) 3930 – 3939 3935
Table 6Chemical shift of methane and LMGS in the hydrate and liquid phase obtained from 13C NMR calibrated by adamantane at 298K
System Hydrate phase Liquid phase
Small cage Medium cage Large cage
CH4 hydrate − 4.10 – − 6.50 –
(CH4 + TBME ) hydrate − 4.30 − 4.70 26.91 27.2948.41 49.3773.14 72.47
(CH4 + NH) hydrate − 4.40a 8.53 9.6029.20 29.4630.27 31.0436.91b 36.95
(CH4 + MCH) hydrate − 4.40a 23.49 23.8827.24b,c 26.9533.71b 27.31
33.7236.08b 36.09
aMethane signals from the small and medium cages overlap.bThe chemical shift for these signals overlapped with the liquid phase (fairly close). The number given is just approximated. The intensity of these signals
was assigned by the corresponding molecular formula with respect to other distinguishable signal, generally from the methyl group (8.53 ppm for NH and23.49 ppm for MCH).
cMCH signals from the hydrate phase at around ∼ 27ppm are too close to be separated.
in the large cage of sI hydrate, as seen from pure sI methanehydrate (no LMGS) signals. The methane signal from the smallcage at − 4.1 ppm is not clearly seen because it overlaps withsH signals.
Methane molecules in the small and medium cages of NHandMCH systems were not distinguishable because of peak over-lap. Hence the occupancies of methane in the small and mediumcages for NH and MCH system are reported as the number-weighted average occupancy for the two cages. Interestingly,
the previously reported NMR spectra did show doublets evenfor the NH (Seo and Lee, 2003 ) and MCH (Yeon et al.,2006) systems whereas a resolved doublet was not seen in thisstudy. This can be ascribed to the difference in temperature(50 K) used for the measurements, reported here and those of Seo and Lee (2003) and Yeon et al. (2006) . We used a lowtemperature of 193K in this study to prevent hydrate decom-position during data acquisition in the non-pressurized sampletubes; the recording of data took a minimum of an hour to ob-tain a good signal to noise ratio because of long 13C relaxationtimes and the low natural abundance of 13C in the hydratesamples.
The dynamics of the guest and host molecules in the hy-drate lattice play a key role in determining the maximum reso-lution obtainable at any temperature ( Collins et al., 1990 ). Thesharpest lines are obtained when the water motions are fast asthen the hydrate cages have their proper high crystallographicsymmetry and the chemical shifts are sharp. If the water mo-tions are slow, the guests do not access all parts of the cage andthe chemical shifts are somewhat distributed and the resonancelines are broader. For the three guests studied here, the waterdynamics are fastest for TBME (a guest containing oxygen caninject Bjerrum defects into the lattice) and hence the resonancelines are sharp at low temperature even for sH hydrate contain-ing TBME (4.3 and − 4.7 ppm), but not for hydrates containing
NH or MCH (Collins et al., 1990; Ripmeester and Ratcliffe,
1999). Other evidence for the guest-dependent dynamics comesfrom dielectric measurements ( Davidson, 1972 ) and reactionrates for ice with polar and non-polar guests ( Gulluru andDevlin, 2006 ), and it is a key feature in the NMR spectroscopyof clathrate hydrates ( Ripmeester and Ratcliffe, 1996 ). This ex-plains the differences observed for the 13C NMR spectra of methane in sH hydrate in this study and that of Seo and Lee(2003) and Yeon et al. (2006) . The intensity ratio of the signalsat − 4.3 and − 4.7 ppm is approximately 3:2, which corresponds
to methane in the small and medium cages.The summary of chemical shifts from methane and LMGS in
the hydrate and liquid phases are summarized in Table 6 . TheLMGS signals from the hydrate phase are generally shifted tohigher eld from the corresponding liquid signals. A few excep-tions were observed where the signal did not shift much fromthe liquid signals (MCH), or, where it is shifted to lower eldin the case of the TBME resonance at ∼ 73 ppm. The intensityof the LMGS signals from the hydrate phase that were indis-tinguishable from that of the liquid phase was assigned fromthe corresponding molecular formula and the other signals thatwere distinguishable, generally those from the methyl groups.The intensity ratio of methane and LMGS peaks from the hy-drate phase was then used to calculate the cage occupancy aftertaking into account the number of molecules per cage and car-bon atoms per molecule. It is generally safe to assume that thelarge cage of the hydrate has to be completely lled to main-tain hydrate stability. Hence the determination of the methaneoccupancy was taken directly from the intensity ratio. For theTBME system, the cage occupancy was calculated from thestatistical thermodynamics equation for the hydrate phase:
− ow =
RT 34
[3 ln(1 − S ) + 2 ln(1 − M ) + ln(1 − L )].
The value of ow was 1187.5 J/mol (Mehta and Sloan, 1996 ).

8/10/2019 Characterization of Gas Hydrates With PXRD, DSC, NMR, And Raman - Copia
http://slidepdf.com/reader/full/characterization-of-gas-hydrates-with-pxrd-dsc-nmr-and-raman-copia 7/10
3936 R. Susilo et al. / Chemical Engineering Science 62 (2007) 3930– 3939
Table 7Cage occupancy values obtained by 13C MAS NMR
LMGS amount/system Pressure Hydratestructure
S M L
No LMGS High I 0.87 – 1.00200% nC 7 High I 0.87 – 1.00
50% TBME Low H 0.78 0.74 1.00High H a 0.92 0.63 1.00
200% TBME Low H 0.78 0.76 1.00High H 0.97 0.79 1.00
50% NH Low H 0.84 b 1.00High H a 0.94 b 1.00
200% NH Low H 0.88 b 1.00High H 0.99 b 1.00
50% MCH Low H a 0.91 b 1.00High H a 0.99 b 1.00
200% MCH Low H 0.90 b 1.00High H 1.00 b 1.00
aThe presence of methane in sI hydrate was also seen. The intensities of themethane in the small cage of sI and sH hydrate were overlapped, hence the
contribution from sI was calculated with the assumption that its occupancywas the same as sI methane hydrate by itself and subtracted from the totalamount. The occupancy values which belong to sH hydrate only are reported.
bThe spectra from NMR do not distinguish the methane in the small andmedium cages due to very close chemical shift and broader peak than TBMEsystem. Hence the average occupancy from the two cages is reported.
All cage occupancy values are summarized in Table 7 . Themethane content of the hydrates was found to increase withpressure for all systems and the methane cage occupancy wasfound to vary with the LMGS and hydrate formation pressurein the following order: MCH (0.90), NH (0.88), and TBME(0.77). This is interesting because the rate of hydrate forma-
tion obtained from the kinetics experiments through gas uptakeand spectroscopy indicated the opposite trend ( Lee et al., 2005;Susilo et al., 2006 ). Thus, reaction rates and methane contentof hydrates are not correlated with each other, as one indeedwould expect the rst being related to kinetics, the second tothermodynamics. However, the reaction rates were correlatedwith the solubility of the LMGS in the water phase (Susiloet al., 2005). The lower methane occupancy for the TBME sys-tem may be associated with a lower net driving force presentduring the hydrate synthesis. The driving force here is de-ned as the difference between the experimental and equilib-rium pressure at a given temperature. One factor may be that
TBME has more water solubility than NH and MCH, and sincewater soluble species will change the activity of the waterthey will show some activity for hydrate inhibition. Since allhydrates were synthesized under the same pressure and temper-ature conditions, the most stable system with the lowest equilib-rium pressure has the highest driving force. Among all systeminvestigated, NH and MCH systems are much more stable thanTBME system. Hence the methane occupancies for the NH andMCH hydrates are higher than for the TBME system. Althoughit is also important to note that the occupancy values reportedhere are based on non-isobaric and non-isothermal hydrate syn-thesis this is not seen as playing a major role in the results.
The methane occupancy for the MCH system was also re-ported from a single crystal study ( Udachin et al., 2002a,b ). The
reported occupancy was ∼ 0.80, which is lower than the valuesmeasured in this study, but this is due to the lower driving forceused during the synthesis of the crystals for diffraction. Themethane occupancies obtained from NMR are also consistentwith the amount of gas released by decomposing the hydrates.However, our measured gas content is signicantly lower than
the values suggested previously ( Khokhar et al., 1998 ) and infact it is difcult to understand how the latter values arose asthere seems to be no fundamental basis for these values basedon structure and maximum cage occupancies. However, it isclear that one has to consider all factors in selecting the bestLMGS for gas storage applications, namely the hydrate sta-bility conditions, the gas storage capacity, and the kinetics of formation and decomposition.
In the stability region of sI hydrate, the stable structure is sHhydrate when excess LMGS is present. A mixture of sI and sHhydrate was encountered when less LMGS was used, as seenin Fig. 6, although the amount of LMGS did not seem to affectthe methane occupancy. At this point it is clear that 13C MASNMR is quite capable of identifying hydrate structure and cageoccupancy in sH hydrate and systems that may contain sI/sHhydrate mixtures. The hydration number can be calculated fromthe occupancy values, as given in Table 4 . The chemical shiftof methane is specic and clear for each hydrate structure andthe intensity ratio can be used to determine the cage occupancy.However, the signals for methane in the small cages for allhydrate structures are in the same vicinity and hence it canbe difcult to separate them accurately when more than onestructure is present.
Hydrate samples were also analyzed with Raman spec-troscopy, as shown in Figs. 7–10. There are many signals
observed in the Raman spectra, however, those most intenseare those in the C–H and O–H bond stretching regions between2800 and 3500 cm − 1 . Unfortunately, the C–H stretching sig-nals from methane and the LMGS often will overlap althoughthe intensity of the methane peak can be expected to be muchhigher than those arising from the LMGS. Fig. 11 shows themagnied spectra in the methane region. There is only a single,strong C–H stretch signal at ∼ 2913 cm − 1 that corresponds tomethane in sH hydrate. No peak splitting was seen as could beattributed to methane in the two cages of sH hydrate. On the
2800 2900 3000 3100 3200 3300 3400 3500
Wavenumber [cm -1]
I n t e n s i t y
MCH liquidMethane +MCH (sHhydrate)
Fig. 7. Raman spectra of ( methane + MCH) sH hydrate at ∼85K.

8/10/2019 Characterization of Gas Hydrates With PXRD, DSC, NMR, And Raman - Copia
http://slidepdf.com/reader/full/characterization-of-gas-hydrates-with-pxrd-dsc-nmr-and-raman-copia 8/10
R. Susilo et al. / Chemical Engineering Science 62 (2007) 3930 – 3939 3937
2800 2900 3000 3100 3200 3300 3400 3500
Wavenumber [cm -1]
I n t e n s i t y
NH liquidMethane+NH (sH hydrate)
Fig. 8. Raman spectra of (methane + NH) sH hydrate at ∼85K.
2800 2900 3000 3100 3200 3300 3400 3500
Wavenumber [cm -1]
I n t e n s i t y
TBME liquidMethane+TBME hydrate (sHhydrate)
Fig. 9. Raman spectra of ( methane + TBME ) sH hydrate at ∼85K.
2800 2900 3000 3100 3200 3300 3400 3500
Wavenumber [cm -1]
I n t e n s i t y
TBME liquidMethane+TBME (sI+sH) hydrate
Fig. 10. Raman spectra of ( methane + TBME ) sI + sH hydrate at ∼85K.
other hand, the 13C methane NMR signal in TBME hydratedoes show such splitting. Another methane signal appears at∼ 2904 cm − 1 for the hydrate formed at high pressure and low(50%) LMGS. The intensity ratio for the signals at 2913 and2904 cm − 1 is ∼3:2, which coincides with the ratio of small tomedium cages. One could assign this second line at 2904cm − 1
as also arising from methane in the medium cage of sH hydrate.However, the PXRD and NMR measurements do not supportthis, suggesting that the sample is a mixture of sI and sH hydratewith the signal at 2904 cm − 1 arising from methane in the large
2880 2890 2900 2910 2920 2930 2940 2950
Wavenumber [cm -1]
No LMGS(sI)
TBME (sI+sH)
TBME (sH)
MCH (sH)
NH (sH)
Fig. 11. Raman spectra around methane region obtained at ∼85K.
cage of sI hydrate. Uchida et al. (2006) argued that indeed twomethane signals from sH hydrate were observed, the methanepeak in the medium cage being at 2901.5 and at 2911 .0 cm − 1
for the small cage, however, this study does not support suchan assignment.
Because of the complexity and low intensity of the LMGSspectra, it is very difcult to quantify the LMGS in the hydratephase. Hence it is impossible to determine the cage occupancyfrom Raman spectroscopy. Besides, an excess of free LMGS isalways present in the sample, making it more difcult to sepa-rate the signals from the hydrate phase. Full LMGS conversionor single crystals may be required to eliminate the interferenceof signal from the liquid. Raman spectra from the LMGS liq-uids are also shown in the gures. Generally the LMGS signals
arising from the hydrate phase are shifted slightly to higherwavenumber. The O–H stretching signals from sH hydrate arecomparable to those from ice or sI hydrate, with the most in-tense part of the signal at ∼ 3100 cm − 1 . Thus one has to berather careful if one wishes to use the O–H signals from Ramanto identify hydrate structure (Schicks et al., 2005 ). Especiallyfor solid mixtures likely it is not possible. Raman spectra ob-tained for complex methane-containing hydrates will not offermuch information in terms of structure and cage occupancy es-pecially when more than one guest molecule is present and canonly be used in conjunction with additional data. A combinedanalysis with PXRD and/or NMR is therefore required to inter-
pret the Raman spectra. From within the criteria of the “tightcage–loose cage model”, combined with the fairly large naturalline widths, one does not expect a great deal of discriminationamongst the group of either “tight” or “loose” cages.
An extra experiment was performed to further verify thearguments on peak assignment as presented above. Hydratewas formed in a pressure cell with a quartz window for in situRaman analysis during hydrate formation and decomposition.The design of the Raman cell is given elsewhere ( Schicks andRipmeester, 2004 ). Hydrate was grown from ice powder withTBME sprayed on top of the ice at − 5 ◦ C and ∼3.5MPa. Thehydrate was allowed to grow for 2 h before the temperaturewas ramping up to 5 ◦ C for additional reaction (20min). Aspectrum was recorded every minute by accumulating 5 scans

8/10/2019 Characterization of Gas Hydrates With PXRD, DSC, NMR, And Raman - Copia
http://slidepdf.com/reader/full/characterization-of-gas-hydrates-with-pxrd-dsc-nmr-and-raman-copia 9/10
3938 R. Susilo et al. / Chemical Engineering Science 62 (2007) 3930– 3939
2890 2900 2910 2920 2930 2940 2950
Wavenumber (cm -1)
I n t e n s i t y
t = 0 min at -5C
to = 120 min at -5Ct = (to+1) min at -2Ct = (to+2) min at 0.5Ct = (to+3) min at 2Ct = (to+4) min at 3.5Ct = (to+5) min at 5Ct = (to+6) min at 5Ct = (to+7) min at 5C
t = (to+8) min at 5Ct = (to+9) min at 5Ct = (to+10) minat 5C
t = (to+15) minat 5C
t = (to+20) minat 5C
2918
2913
Fig. 12. Raman spectra during hydrate formation from ice + TBME + methaneat ∼3.5MPa.
2890 2900 2910 2920 2930 2940 2950
Wavenumber (cm -1)
I n t e n s i t y
td = 0 min at 8C
td = 1 min at 10C
td = 2 min at 10C
td = 3 min at 10C
td = 4 min at 10C
2918
2913
Fig. 13. Raman spectra during (CH4 + TBME ) hydrate decomposition at∼ 3.5 MPa.
(5 s), as shown in Fig. 12. The LMGS signals were invisibledue to the few scans acquired and very low signal intensity.Initially, only methane gas was seen at ∼ 2918 cm − 1 and thenanother signal grew at ∼ 2913cm − 1 which corresponded tohydrate formation. No other signal was observed in this spectralregion. The hydrate was then decomposed by increasing thetemperature above the phase equilibrium line (10 ◦ C). Fig. 13shows the disappearance of the signal at ∼ 2913 cm − 1 leavingonly the gas phase. This further supports the fact that methanemolecules in small and medium cages of sH hydrate is notdistinguishable using Raman spectroscopy.
4. Conclusions
Structure I and structure H gas hydrate samples were synthe-sized, characterized and analyzed with PXRD, DSC, NMR, andRaman spectroscopy. Hydrate structures, lattice constants, de-
gree of conversion, gas content, and cage occupancies were ob-tained. The stable crystal structure is sH hydrate whenever thereis an excess of the large molecule guest substance (LMGS).The presence of only n-heptane (as a non-hydrate former) re-sults in a sI hydrate product. The methane content in sH hy-drate increases in the following order: TBME < NH< MCH and
is opposite to the trend in the observed rate of hydrate growth.Forming hydrate at a higher gas pressure increases the cageoccupancy. Hydrate conversion is limited when the amount of LMGS used is less than the stoichiometric amount and whenthe methane pressure (sH stability region) is low. Increasing thepressure above the sI hydrate equilibrium line produces a mix-ture of sI and sH hydrates. The optimum gas storage capacityof sH hydrate varies with the LMGS used and is approximately20–40% less than that of sI methane hydrate. The hydrate struc-ture, degree of conversion, and gas content in the hydrate phaseobtained from the different techniques are all consistent witheach other. Methane and LMGS signals could be identied withRaman and NMR spectroscopy, however, the hydrate composi-tion can only be acquired through NMR spectroscopy. Finally,some ambiguities in Raman results for sH hydrate reported inthe literature have been claried.
Acknowledgments
The nancial support from Natural Sciences and EngineeringResearch Council of Canada (NSERC) is greatly appreciated.Robin Susilo gratefully acknowledges nancial support fromCanada Graduate Scholarship (CGS).
References
Anderson, G.K., 2004. Enthalpy of dissociation and hydration number of methane hydrate from the Clapeyron equation. Journal of ChemicalThermodynamics 36, 1119–1127.
Chou, I.-M., Sharma, A., Burruss, R.C., Shu, J., Mao, H.-K., Hemley, R.J.,Goncharov, A.F., Stern, L.A., Kirby, S.H., 2000. Transformation in methanehydrate. Proceedings of the National Academy of Sciences 97 (25),13484–13487.
Collins, M.J., Ratcliffe, C.I., Ripmeester, J.A., 1990. Nuclear magneticresonance studies of guest species in clathrate hydrates: line-shapeanisotropies, chemical shifts, and the determination of cage occupancyratios and hydration numbers. Journal of Physical Chemistry 94, 157–162.
Dalmazzone, D., Kharrat, M., Lachet, V., Fouconnier, B., Clausse, D.,2002. DSC and PVT measurements—methane and trichlorouoromethanehydrate dissociation equilibria. Journal of Thermal Analysis andCalorimetry 70, 493–505.
Davidson, D.W., 1972. Clathrate hydrates. In: Franks, F. (Ed.), Water. AComprehensive Treatise, vol. 2. Plenum Press, New York.
Englezos, P., Lee, J.-D., 2005. Gas hydrates: a cleaner source of energyand opportunity for innovative technologies. Korean Journal of ChemicalEngineering 22, 671–681.
Giavarini, C., Maccioni, F., Santarelli, M.L., 2006. Modulated DSC forgas hydrates analysis. Journal of Thermal Analysis and Calorimetry 84,419–424.
Gulluru, D.B., Devlin, J.P., 2006. Rates and mechanisms of conversion of icenanocrystals to ether clathrate hydrates: guest-molecule catalytic effects at∼ 120K. Journal of Physical Chemistry A 110, 1901–1906.
Khokhar, A.A., Gudmundsson, J.S., Sloan, E.D., 1998. Gas storage in structureH hydrates. Fluid Phase Equilibria 150, 383–392.
Kini, R., Dec, S.F., Sloan Jr., E.D., 2004. Methane + propane structureII hydrate formation kinetics. Journal of Physical Chemistry A 108,9550–9556.

8/10/2019 Characterization of Gas Hydrates With PXRD, DSC, NMR, And Raman - Copia
http://slidepdf.com/reader/full/characterization-of-gas-hydrates-with-pxrd-dsc-nmr-and-raman-copia 10/10
R. Susilo et al. / Chemical Engineering Science 62 (2007) 3930 – 3939 3939
Komai, T., Kang, S.-P., Yoon, J.-H., Yamamoto, Y., Kawamura, T., Ohtake,M., 2004. In situ Raman spectroscopy investigation of the dissociationof methane hydrate at temperatures just below the ice point. Journal of Physical Chemistry B 108, 8062–8068.
Lee, J.-D., Susilo, R., Englezos, P., 2005. Kinetics of structure H gas hydrate.Energy and Fuels 19, 1008–1015.
Linstrom, P.J., Mallard, W.G. (Eds.), 2005. NIST Chemistry WebBook,
NIST Standard Reference Database Number 69, June, National Instituteof Standards and Technology, Gaithersburg, MD, 20899 http://webbook.nist.gov .
Mehta, A.P., Sloan, E.D., 1996. Improved thermodynamics parametersfor prediction of structure H hydrate equilibria. A.I.Ch.E. Journal 42,2036–2046.
Mori, Y.H., 2003. Recent advances in hydrate-based technologies for naturalgas storage—a review. Journal of Chemical Industry and Engineering(China) 54 (Suppl.), 1–17.
Parlouër, P.L., Dalmazzone, C., Herzhaft, B., Rousseau, L., Mathonat, C.,2004. Characterization of gas hydrates formation using a new high pressureMICRO-DSC. Journal of Thermal Analysis and Calorimetry 78, 165–172.
Pietrass, T., Gaede, H.C., Bifone, A., Pines, A., Ripmeester, J.A., 1995.Monitoring xenon clathrate hydrate formation on ice surfaces with opticallyenhanced 129Xe NMR. Journal of the American Chemical Society 117,
7520–7525.Ripmeester, J.A., Ratcliffe, C.I., 1988. Low-temperature cross-polarization/ magic angle spinning carbon-13 NMR of solid methane hydrates: structure,cage, occupancy, and hydration number. Journal of Physical Chemistry 92(2), 337–339.
Ripmeester, J.A., Ratcliffe, C.I., 1996. Solid state NMR spectroscopy. In:Davies, J.E.D., Ripmeester, J. (Eds.), A Comprehensive SupramolecularChemistry, vol. 8, Physical Methods in Supramolecular Chemistry.Pergamon, Elsevier, Oxford.
Ripmeester, J.A., Ratcliffe, C.I., 1999. On the contributions of NMRspectroscopy to clathrate science. Journal of Structural Chemistry 40 (5),654–662.
Ripmeester, J.A., Tse, J.S., Ratcliffe, C.I., Powell, B.M., 1987.A new clathratehydrate structure. Nature 325, 135–136.
Schicks, J.M., Ripmeester, J.A., 2004. The coexistence of two different
methane hydrate phases under moderate pressure and temperatureconditions: kinetic versus thermodynamic products. Angewandte ChemieInternational Edition 43, 3310–3313.
Schicks, J.M., Erzinger, J., Ziemann, M.A., 2005. Raman spectra of gashydrates—differences and analogies to ice 1 h and (gas saturated) water.Spectrochimica Acta Part A 61, 2399–2403.
Seo, Y.-T., Lee, H., 2003. 13C NMR analysis and gas uptake measurementsof pure and mixed gas hydrates: development of natural gas transport andstorage method using gas hydrate. Korean Journal of Chemical Engineering20, 1085–1091.
Sloan, E.D., 2003. Clathrate hydrate measurements: microscopic, mesoscopic,and macroscopic. Journal of Chemical Thermodynamics 35, 41–53.
Subramanian, S., Kini, R.A., Dec, S.F., Sloan Jr., E.D., 2000. Evidence of structure II hydrate formation from methane–ethane mixtures. ChemicalEngineering Science 55, 1981–1999.
Sum, A.K., Burruss, R.C., Sloan, E.D., 1997. Measurement of clathratehydrates via Raman spectroscopy. Journal of Physical Chemistry B 101,7371–7377.
Sun, Q., Duan, T.-Y., Zheng, H.-F., Ji, J.-Q., Wu, X.-Y., 2005. Phasetransformation of methane hydrate under high pressure. Journal of Chemical Physics 122 (2), 024174.
Susilo, R., Lee, J.D., Englezos, P., 2005. Liquid–liquid equilibrium data
of water with neohexane, methylcyclohexane tert-butyl methyl ether n-heptane and vapor–liquid–liquid equilibrium with methane. Fluid PhaseEquilibria 231 (1), 20–26.
Susilo, R., Moudrakovski, I.L., Englezos, P., Ripmeester, J.A., 2006. Hydratekinetics study in the presence of nonaqueous liquid by NMR spectroscopyand imaging. Journal of Physical Chemistry B 110, 25803–25809.
Tsuji, H., Kobayashi, T., Ohmura, R., Mori, Y.H., 2005. Hydrate formation bywater spraying in a methane + ethane + propane gas mixture: an attemptat promoting hydrate formation utilizing LMGS for sH hydrates. Energyand Fuels 19, 869–876.
Tulk, C.A., Ripmeester, J.A., Klug, D.D., 2000. The application of Ramanspectroscopy to the study of gas hydrates. Annals of the NewYorkAcademyof Sciences 912, 859–872.
Uchida, T., Takeya, S., Wilson, L.D., Tulk, C.A., Ripmeester, J.A., Nagao,J., Ebinuma, T., Narita, H., 2003. Measurements of physical properties
of gas hydrates and in situ observations of formation and decompositionprocesses via Raman spectroscopy and X-ray diffraction. Canadian Journalof Physics 81, 351–357.
Uchida, T., Ohmura, R., Ikeda, I.Y., Nagao, J., Takeya, S., Hori, A.,2006. Phase equilibrium measurements and crystallographic analyses onstructure-H type gas hydrate formed from the CH 4–CO2–neohexane–watersystem. Journal of Physical Chemistry B 110, 4583–4588.
Udachin, K.A., Ratcliffe, C.I., Ripmeester, J.A., 2002a. Hydrate structure andcomposition from single crystal X-ray diffraction: examples of structureI, II, and H hydrates. Proceedings of the Fourth International Conferenceon Gas Hydrates, vol. 2. pp. 604–607.
Udachin, K.A., Ratcliffe, C.I., Ripmeester, J.A., 2002b. Single crystaldiffraction studies of structure I, II and H hydrates: structure, cageoccupancy and composition. Supramolecular Chemistry 2, 405–408.
Wang, X., Schultz, A.J., Halpern, Y., 2002. Kinetics of methane hydrate
formation from polycrystalline deuterated ice. Journal of PhysicalChemistry A 106, 7304–7309.
Wilson, L.D., Tulk, C.A., Ripmeester, J.A., 2002. Instrumental techniques forthe investigation of methane hydrates: cross-calibrating NMR and Ramanspectroscopic data. Proceedings of the Fourth International Conference onGas Hydrates, vol. 2. pp. 614–618.
Yeon, S.-H., Seol, J., Lee, H., 2006. Structure transition and swappingpattern of clathrate hydrates driven by external guest molecules. Journalof American Chemical Society 128 (38), 12388–12389.
Yoon, J.-H., Yamamoto, Y., Komai, T., Haneda, H., 2003. Rigorous approachto the prediction of the heat of dissociation of gas hydrates. Industrial andEngineering Chemical Research 42, 1111–1114.
Yoon, J.-H., Kawamura, T., Yamamoto, Y., Komai, T., 2004. Transformationof methane hydrate to carbon dioxide hydrate: in situ Raman spectroscopicobservations. Journal of Physical Chemistry A 108, 5057–5059.