characterization of electrodes for lithium-ion batteries through
TRANSCRIPT

Research Collection
Doctoral Thesis
Characterization of electrodes for lithium-ion batteriesthrough electrochemical impedance spectroscopy and massspectrometry
Author(s): La Mantia, Fabio
Publication Date: 2008
Permanent Link: https://doi.org/10.3929/ethz-a-005707088
Rights / License: In Copyright - Non-Commercial Use Permitted
This page was generated automatically upon download from the ETH Zurich Research Collection. For moreinformation please consult the Terms of use.
ETH Library

DISS. ETH Nr. 17848
Characterization of Electrodes for Lithium-Ion
Batteries through Electrochemical Impedance
Spectroscopy and Mass Spectrometry
ABHANDLUNG
zur Erlangung des Titels
DOKTOR DER WISSENSCHAFTEN
der
ETH ZÜRICH
vorgelegt von
FABIO LA MANTIA
Dr. Ing., Universitá degli Studi di Palermo geboren am 25/08/1980 Bruneck (BZ) von italienische Staatsangehörigkeit
Angenommen auf Antrag von
Prof. Dr. R. Nesper, Referent
Prof. Dr. A. Wokaun, Korreferent
PD Dr. P. Novák, Korreferent
2008


Acknowledgement
This PhD work would be not possible without the support of many people in both my private
and working life.
I’m thankful to Professor Reinhard Nesper, my PhD advisor, and PD Petr Novák, my PhD
supervisor, for the fruitful discussions and scientific support during these three years, for the
new ideas, and the new insight in the scientific world. Without them the development of this
project would not be possible. In particular, I want to thank PD Petr Novák for being my
office mate. I’m sorry for the chaos on my desktop, but without it I cannot work! Thank you
again!
I’m thankful to the group of Batteries at Paul Scherrer Institut, for the friendship, for the
technical support (DEMS is like babies!), for the interesting discussions, for the laughs. In
particular, I would like to thank Hermann Kaiser and Werner Scheifele for being the best
technical support team in the world, without them the DEMS could not be improved to such
levels. Danke! Thanks to Jens Vetter and Michael Holzapfel for having introduced me to the
world of lithium-ion batteries. Thanks to Nicholas Tran, for having introduced and shared
with me the topic of NMC compounds, for his friendship and support! I would like to thank
both Hermann and Nicholas for having shared with me my passion for martial arts. Thanks to
See How Ng and Sau Yen Chew for their friendship and help in this year!
A special thank to Fabio Rosciano, member of the group of Batteries at Paul Scherrer Institut,
who shared with me name, group, scientific topic, and all the days at PSI! Good luck with
your new job! Grazie cumpá!
Ne approfitto anche per ringraziare alcune persone a me care e che mi sono state vicine in
questi anni.
Grazie Elisa! Incontrarti é stata la cosa piú bella che mi sia mai successa. Cosa posso
aggiungere se non: Ola, estupido de senior!

Ringrazio l’allegra brigata di Palermo, Daigo, Yuki, Giovanni, Valeria, Martina, Dario,
Giuseppe, Max, Emilio, Sofia, perché sono la prova vivente che esiste gente piú esaurita di
me (o almeno altrettanto esaurita). Grazie picciotti!
Ringrazio il professore Di Quarto, l’ingegnere Santamaria e l’ingegnere Bocchetta per il loro
aiuto durante l’anno precedente all’inizio di questa tesi. Voglio in particolare ringraziarli per
avermi trasmesso il loro amore per la ricerca, la loro sete di conoscenza e i loro insegnamenti
di vita.
Voglio ringraziare il sensei Mitsuya Seinosuke per avermi insegnato l’Hayashi-ha Shitoryu
Karate-do e per essere un maestro di vita.
Ultimo, ma non ultimo, ringrazio i miei genitori, Antonino La Mantia e Monica
Mutschlechner, e mia sorella, Simona La Mantia, per il loro sostegno di tutti i giorni, per il
loro tentativo di dissuadermi dal percorrere questa strada, per la forza che mi hanno insegnato
a trovare in me, per avermi costretto a imparare il tedesco e tanto altro ancora! Grazie mille!

Index
Motivation of the PhD Work ......................................................................................... 1
1 Introduction ........................................................................................................... 3
1.1 Lithium-ion Batteries ..................................................................................... 4
1.2 Active Materials for the Negative Electrode of the Lithium-Ion Batteries ... 7
1.3 Active Materials for the Positive Electrode of the Lithium-Ion Batteries ... 10
1.4 Electrolytes for Lithium-Ion Batteries ......................................................... 13
2 Theoretical Background ..................................................................................... 17
2.1 Electrochemistry .......................................................................................... 17
2.2 Mass Spectrometry....................................................................................... 22
2.3 Differential Electrochemical Mass Spectrometry (DEMS) ......................... 25
2.4 Electrochemical Impedance Spectroscopy................................................... 30
3 Development of the Mathematical Models........................................................ 41
3.1 Model of the Intercalation Process............................................................... 41
3.2 Models of the Porous Electrode ................................................................... 48
3.3 Models of the Transport in Pores ................................................................. 56
3.4 Mathematical Simulations ............................................................................ 61
4 Experimental Setup............................................................................................. 65
4.1 Preparation of the Electrodes ....................................................................... 65
4.2 Synthesis of the Electro-Active Materials ................................................... 66
4.3 Standard Electrochemical Experiments ....................................................... 66
4.4 Differential Electrochemical Mass Spectrometry (DEMS) ......................... 67
4.5 Electrochemical Impedance Spectroscopy (EIS) ......................................... 72
4.6 Multiple-Working-Electrode Cell (MWE)................................................... 73
5 Study of the Negative Electrodes........................................................................ 75
5.1 Introduction.................................................................................................. 75
5.2 Standard Electrochemical Measurements .................................................... 78
5.3 EIS measurements........................................................................................ 83

5.4 DEMS Measurements .................................................................................. 92
5.5 MWE Measurements.................................................................................... 99
6 Study of the Positive Electrodes....................................................................... 105
6.1 Introduction................................................................................................ 105
6.2 Structural, Morphological and Chemical Analysis .................................... 106
6.3 Standard Electrochemical Measurements .................................................. 110
6.4 DEMS Measurements ................................................................................ 119
6.5 On the Oxygen Evolution in NMC Compounds ........................................ 125
Conclusions and Outlook ........................................................................................... 131
Bibliography ................................................................................................................ 135
List of Symbols ............................................................................................................ 143

Abstract
The high specific energy and power available from lithium-ion batteries and the
possibility to charge / discharge them many times are the reasons of their key importance in
electronic portable devices, and future development of hybrid and fully electric vehicles.
Graphite and LiCoO2 are used as electro-active materials in standard commercially available
lithium-ion batteries. Despite their utilization, the current active materials have some severe
disadvantages. They are expensive, have slow kinetics of reaction for high-power applications,
cannot deliver the total charge stored inside, and LiCoO2 is carcinogenic.
Many challenges rise from the effort to increase the specific energy and power, and also
to increase the cycle life of the battery. A greater understanding of the Li+ exchange
mechanism will facilitate the development of new active materials with higher performances.
The motivation for this Ph.D. work was deepening the insight on the mechanisms of the
overall intercalation processes by using the electrochemical impedance spectroscopy
technique (EIS) and correlating the electro-catalytic properties of the active materials with
their structure by using the differential electrochemical mass spectrometry technique (DEMS).
Differential Electrochemical Mass Spectrometry permits a qualitative and quantitative
analysis of the electrochemically developed volatile compounds. It was used to determine the
interactions between the active materials and the electrolyte. These interactions are followed
by degradation of the active material, with loss of the electro-catalytic properties, or
passivation of the surface of the active material, which kinetically blocks further interactions.
Both these processes commonly involve gaseous products, which can be detected by a mass
spectrometer. A new cell and a new experimental setup were built to provide an increased
sensitivity of the experimental data. The new cell has given the possibility to implement a
third electrode as reference electrode for the electrochemical measurements. The new
experimental setup, based on two controlled argon fluxes, has reduced the influence of the
background intensity on the data quality. An analytical tool to process the experimental
results was developed, to subtract the background intensity from the mass signals. The DEMS
study on graphite particles has shown the development of CO2 at 1 V (Li/Li+) in the first
reductive half-cycle. The development of CO2 was indirectly suggested but never
experimentally proved before. It was possible thanks to the increased sensitivity of the DEMS
setup and the sophisticated subtraction of the background intensity from the mass signals. The
DEMS study on Li1+x(Mn1/3Ni1/3Co1/3)1-xO2 compounds, possible substitutes of LiCoO2, has
proved the development of oxygen in the first cycle at potentials above 4.5 V (Li/Li+) for the
compound with x = 0.1, while no oxygen was detected for the compound with x = 0. The
quantitative analysis of the DEMS data for the compound with x = 0.1 has confirmed that the
irreversible specific charge observed during the galvanostatic cycling experiments for the x =
0.1 compound in the first cycle is due to the oxygen loss.
Electrochemical Impedance Spectroscopy is an electrochemical tool which helps in the
detection of the kinetic limitations in the system under investigation. It can reach high time
resolution (10-6 s) and is particularly suitable to the study of reaction mechanisms (effects of
the surface energetic), current density distribution (effects of electrode geometry), and
transport of mass (diffusion and migration in the bulk). Several physico-chemical models
describing surface and bulk processes was developed and the correlation between EIS data
and kinetic properties of the system were obtained. A new electrochemical cell was designed,
to bring the experimental setup nearer to the mathematical description of the models. An
analytical tool to fit the experimental data with different models was successfully developed
and used. It was found out that the only plausible electrochemical process describing the EIS
data before the formation of the SEI for several types of graphite particles is an adsorption
through surface states. It was also observed that the limitations due to the pore structure in
electrodes based on graphite are dependent on the size of the particles; in particular, the
smaller the graphite particle, the higher is the resistance of the pores.
Beside the original PhD goals, a new cell for the study of the current density
distribution was developed and tested on electrodes based on graphite particles. The new cell
is called multiple-working-electrode (MWE) cell. Using the MWE cell, it was observed that
the layer of graphite nearer to the counter electrode has a higher value of the irreversible
specific charge with respect to the farer layers. A hypothesis for explaining this behavior of
the graphite electrodes was formulated.

Riassunto
L’elevata energia specifica e potenza disponibile nelle batterie a litio- ione e la
possibilitá di caricarle / scaricarle centinaia di volte sono la ragione della loro importanza nei
dispositivi elettronici portatili e per il futuro sviluppo di veicoli elettrici e/o ibridi. La grafite e
LiCoO2 sono i materiali elettro-attivi piú usati nelle batterie a litio- ione disponibili nel
mercato. Nonostante il loro utilizzo, gli attuali materiali elettro-attivi presentano gravi
svantaggi: sono costosi; la cinetica di elettrodo é lenta per applicazioni di potenza; non
possono rilasciare tutta la carica che immagazzinano; LiCoO2 é cancerogeno.
Molte sfide nascono dal tentativo di aumentare l’energia e la potenza specifica delle
batterie a litio- ione e di aumentare il loro numero di cicli di vita. Una comprensione migliore
del meccanismo di scambio di Li+ faciliterá lo sviluppo di nuovi materiali attivi con
prestazioni piú elevate. La motivazione di questo lavoro di dottorato é stata
l’approfondimento della conoscenza del meccanismo di reazione del processo di
intercalazione utilizzando la tecnica di spettroscopia di impedenza elettrochimica (EIS) e
correlare le proprietá elettro-catalitiche dei materiali attivi con la loro struttura utilizzando la
tecnica di spettrometria differenziale di massa elettrochimica (DEMS).
La spettrometria differenziale di massa elettrochimica permette un’analisi qualitativa e
quantitativa dei composti volatili sviluppati elettrochimicamente. É stata usata per
determinare le interazioni fra il materiale attivo e l’elettrolita. Queste interazioni si
manifestano come degradazione del materiale attivo, con perdita delle proprietá elettro-
catalitiche, o la passivazione della superficie del materiale attivo, che blocca cineticamente
ulteriori interazioni. Entrambi questi processi coinvolgono normalmente prodotti gassosi, che
possono essere osservati con uno spettrometro di massa. Una nuova cella e un nuovo apparato
sperimentale sono stati costruiti per incrementare la risoluzione dei dati sperimentali. La
nuova cella ha dato la possibilitá di includere un terzo elettrodo come elettrodo di riferimento
per le misure elettrochimiche. Il nuovo apparato sperimentale, basato su due flussi controllati
di argon, ha ridotto l’influenza dell’intensitá del background sulla qualitá dei dati. É stato

sviluppato uno strumento analitico per la sottrazione dell’intensitá del background dai segnali
di massa. Gli studi fatti con il DEMS su particelle di grafite hanno mostrato lo sviluppo di
CO2 a 1 V (Li/Li+) nel primo mezzo ciclo riduttivo. Lo sviluppo di CO2 era stato suggerito
indirettamente ma mai provato sperimentalmente prima. Questo é stato possibile grazie
all’aumentata risoluzione dell’apparato DEMS e alla sottrazione dell’intensitá del background
dai segnali di massa. Gli studi fatti col DEMS sui composti Li1+x(Mn1/3Ni1/3Co1/3)1-xO2,
possibili sostituti di LiCoO2, hanno dimostrato lo sviluppo di ossigeno nel primo ciclo a
potenziali superiori a 4.5 V (Li/Li+) per il composto con x = 0.1, mentre l’ossigeno non é
stato osservato per il composto con x = 0. L’analisi quantitativa dei dati DEMS per il
composto con x = 0.1 ha confermato che la carica specifica irreversibile osservata durante gli
esperimenti galvanostatici per il composto con x = 0.1 nel primo ciclo é dovuta al rilascio di
ossigeno dalla struttura del materiale attivo.
La spettroscopia di impedenza elettrochimica é uno strumento elettrochimico, che aiuta
nella determinazione dei limiti cinetici del sistema sotto osservazione. Puó raggiungere una
risoluzione temporale molto elevata (10-6 s) ed é particolarmente indicato per lo studio dei
meccanismi di reazione (effetto dell’energetica di superficie), della distribuzione di densitá di
corrente (effetto della geometria dell’elettrodo) e del trasporto di massa ( diffusione e
migrazione). Vari modelli fisico-chimici, che descrivono i processi di superficie e di bulk,
sono stati sviluppati e le correlazioni fra i dati di EIS e le proprietá cinetiche del sistema sono
state ottenute. Una nuova cella elettrochimica é stata sviluppata, per avvicinare l’apparato
sperimentale alla descrizione matematica dei modelli fisico-chimici. Uno strumento analitico
per fittare i dati sperimentali con diversi modelli é stato sviluppato con successo e usato. Si é
osservato che l’unico processo elettrochimico plausibile per descrivere i dati di EIS per vari
tipi di grafite prima della formazione del SEI é un adsorbimento tramite stati superficiali. É
stato anche osservato che le limitazioni dovute alla struttura dei pori negli elettrodi a base di
graphite sono dovute alle dimensioni delle particelle; piú piccole sono le particelle, maggiore
é la resistenza nei pori.
Accanto agli obiettivi del dottorato, una nuova cella per lo studio della distribuzione
delle densitá di corrente é stata sviluppata e testata su elettrodi a base di grafite. La nuova
cella é stata chiamata cella a elettrodi di lavoro multipli (MWE). Utilizzando la cella MWE, si
é osservato che lo strato di grafite piú vicino al contro elettrodo ha una carica specifica

irreversibile piú elevata degli strati piú lontani dal contro elettrodo. É stata formulata
un’ipotesi per spiegare questo comportamento degli elettrodi di grafite.


Den Unbedenklichen, die niemals zweifeln Begegnen die Bedenklichen, die niemals handeln. Sie zweifeln nicht, um zur Entscheidung zu kommen, sondern Um der Entscheidung auszuweichen. Köpfe Benützen sie nur zum Schütteln. Mit besorgter Miene Warnen sie die Insassen sinkender Schiffe vor dem Wasser. Unter der Axt des Mörders Fragen sie sich, ob er nicht auch ein Mensch ist. Mit der gemurmelten Bemerkung Daß die Sache noch nicht durchforscht ist, steigen sie ins Bett. Ihre Tätigkeit besteht in Schwanken. Ihr Lieblingswort ist: nicht spruchreif. Freilich, wenn ihr den Zweifel lobt So lobt nicht Das Zweifeln, das ein Verzweifeln ist! Was hilft zweifeln können dem Der sich nicht entschließen kann! Falsch mag handeln Der sich mit zu wenig Gründen begnügt Aber untätig bleibt in der Gefahr Der zu viele braucht. Du, der du ein Führer bist, vergiß nicht Daß du es bist, weil du an Führern gezweifelt hast! So gestatte den Geführten Zu zweifeln! (Bertolt Brecht, Lob des Zweifels) Science alone of all the subjects contains within itself the lesson of the danger of belief in the infallibility of the greatest teachers in the preceding generation ... Learn from science that you must doubt the experts. As a matter of fact, I can also define science another way: Science is the belief in the ignorance of experts. (Richard Feynman, The Pleasure of Finding Things Out : The Best Short Works of Richard Feynman)

- 1 -
Motivation of the PhD Work
The high specific energy and power available from lithium- ion batteries and the possibility
to charge / discharge them hundreds of times are the reasons of their key importance in electronic
portable devices and future development of hybrid and fully electric vehicles. Carbons (both
graphitized and amorphous) and lithium metal oxides (mainly LiCoO2) are used as electro-active
materials in standard commercially available lithium- ion batteries. Despite their utilization, the
current active materials have some severe drawbacks. They are expensive, have slow kinetics of
reaction for high-power applications, cannot deliver the total charge chemically stored inside, and
LiCoO2 is carcinogenic.
Many challenges rise from the effort to increase the specific energy and power, and also to
increase the cycle life of the battery, as required from the automotive market. The many
interactions between different properties of the electro-active material, related to both bulk and
surface, and interaction with the electrolyte, make this challenge an interdisciplinary effort. A
greater understanding of the Li+ exchange mechanism will facilitate the development of new
active materials with higher performances. The motivation for this Ph.D. work was deepening the
insight on the mechanisms of the overall intercalation processes by us ing the electrochemical
impedance spectroscopy technique (EIS) and correlating the electro-catalytic properties of the
active materials with their structure by using the differential electrochemical mass spectrometry
technique (DEMS).
Differential Electrochemical Mass Spectrometry permits a qualitative and quantitative
analysis of the electrochemically developed volatile compounds. It was used to determine the
interactions between the active materials and the electrolyte. These interactions are followed by
degradation of the active material, with loss of the electro-catalytic properties, or passivation of
the surface of the active material, which kinetically blocks further interactions. Both processes
commonly involve gaseous products, which can be detected by a mass spectrometer. The passive

- 2 -
film coating the particles is very important for the cycle life of the battery. The aim of the PhD
work was to build a new experimental setup, a new electrochemical cell, and to develop an
analytical tool for the analysis of the experimental data. The new setup has to provide an
increased resolution of the experimental data, by reducing the influence of the background line on
the data quality. The new electrochemical cell has to implement a third electrode as reference
electrode for the electrochemical measurements. The analytical treatment of the experimental
data is necessary to achieve high resolution of the gases developed in the cell; it purifies the data
from the background line.
Electrochemical Impedance Spectroscopy is an electrochemical tool which helps in the
detection of the kinetic limitations in the system under investigation. It can reach high time
resolution (10-6 s) and is particularly suitable to the study of reaction mechanisms (effect on the
surface energetic), current density distributions (effect of electrode geometry), and transport of
mass (diffusion and migration in the bulk). Even if this method is very popular in
electrochemistry, it is often misused. A rigorous mathematical treatment of the experimental data
is necessary to extract creditable kinetic parameters. The aim of the PhD work was to develop
several physico-chemical models describing surface and bulk processes, and to build a new
electrochemical cell. The physico-chemical models have to provide the correlation between
impedance data and kinetic properties of the system. An analytical tool to fit the experimental
data with different models is necessary to extract the kinetic properties of the system from the
experimental data. The new electrochemical cell has to adapt the experimental setup to the
mathematical description of the models.

- 3 -
1 Introduction
The technology of lithium-ion batteries is a main topic in the energy conversion field
thanks to the very interesting characteristics of this power source. A well designed lithium-ion
battery can reach high energy and power density, and can be recharged many times. The
research in the field of lithium-ion battery is focused on the development of systems with
even higher power and energy density and longer cycle life; the goal of the research is to use
the lithium-ion batteries as power source of hybrid or fully electric vehicles. For this purpose,
in the last years an intensive effort was spent in developing new materials for positive (oxides
[1-3], phosphates [4]) and negative electrodes (different graphite types, alloys [5], and carbon
based compounds), separators, electrolytes (ionic liquids, polymeric electrolytes, and
inorganic solids). Because of this strong push in material science direction, the
electrochemical aspects of this challenge and the intrinsic limitations of the system were
sometime disregarded. Lithium-ion batteries are complex systems; both bulk and surface
properties of the materials are important for the final performance of the system
Surface plays a very important role in the cycle life of a battery; the material has to be
stable in the battery electrolyte for the whole potential range used during the battery cycle,
and vice versa. This condition is quite always reached thanks to the formation of a protective
layer at the surface of the electrode [6-10]. The surface layer, called solid electrolyte
interphase (SEI), can be an oxidation/reduction product, in which case it consumes part of the
charge of the battery, or a chemical product, formed by contacting the particles with the
electrolyte [11-13]. The SEI influences the kinetic behavior of the electrode, the irreversible
charge consumed during cycling, and the cycle life. Investigation of SEI formation, its
stability and its influence on the kinetic behavior of the electrode are all aspects of primary
importance in enhanc ing the performances of lithium-ion batteries.
Moreover, the design of the electrochemical cell has a not negligible importance in the
performances of this power source, due to the low specific conductivity of the electrolyte
(~0.01 S·cm-1 [14]). From an electrochemical point of view, it is clear that a high power

- 4 -
battery will never work homogeneously, because even small differences in the distance,
thickness, and density of the electrodes can cause big kinetic limitations. As can be seen from
this short overview, the challenge to increase the performances of lithium-ion batteries covers
many scientific fields, which are interconnected and influence each other.
1.1 Lithium-Ion Batteries
The electrochemical systems for the storage of energy can be classified in three main
types: electrochemical capacitors; batteries; fuel cells. These power sources are composed of
two electrodes in contact with an electrolyte. To increase the contact surface area between
electrode and electrolyte, porous electrodes are used instead of solid ones. The increase of the
surface area has the advantage to decrease the kinetic limitations generated by the current
flow. In electrochemical capacitors the energy is stored in the double layer formed at the
interface electrode/electrolyte. The increase of the contact surface area electrode / electrolyte
increases the amount of charge stored. The charging process of the double layer is very fast
(10-8 s), the electrodes should provide only passage of electrons. These systems have high
specific power but low specific energy. In batteries, a part of the electrode, the so called active
mass, participate to a reaction with the components of the electrolyte, the charge is stored in
the bulk of the active mass or is accumulated in a precipitated compound. Compared to the
electrochemical capacitors, the increase in the specific energy is accompanied by a decrease
of the specific power, because of the slower faradaic reaction needed to store the charge
(between 10-2 and 10-4 s). In fuel cells the electrodes provide electrons for the faradaic
reaction; the reactant of the faradaic reaction is a fuel, which is stored in a tank outside the
electrochemical system and is transported to the electrodes of the fuel cell in gaseous phase.
Fuel cells are systems with low specific power, but high specific energy [15].
Batteries can be divided in primary and secondary batteries. The former can be used
only once and than have to be discarded. The latter can be recharged after discharge and are
also named accumulators or rechargeable batteries. The possibility to recharge a battery is
strictly connected with the reversibility of the electrochemical process and with the safety of
the battery. For battery systems it is important to have a large temperature range of operation.
Standard applications need a temperature range between 0 and 40 °C, while automotive or
military applications need operational temperatures between -40 and 85 °C. Self-discharge is
the loss of performance when a battery is not in use. Self-discharge phenomena have to be

- 5 -
maintained as slow as possible. In an ideal battery, the discharge has to occur at constant
potential, so that a constant power is delivered during the time; this requirement implies that
active materials having two phases during the discharge are preferred. High specific energy is
achieved by using electrodes which can deliver an high amount of specific charge at an high
voltage. High specific power is granted by fast electrochemical reaction, high specific
conductivity of the electrolyte, high electronic conductivity of the electrodes and current
collectors.
Spec
ific
Pow
er /
W k
g-1
Specific Energy / Wh kg-1
Spec
ific
Pow
er /
W k
g-1
Specific Energy / Wh kg-1
Figure 1.1: Ragone chart of the main secondary battery systems (Adapted from M. Broussely, in PSI
Tagessymposium, Villigen, Switzerland, 2005).
The combined properties to have the most negative equilibrium potential in the
electrochemical scale and a very low atomic mass make lithium a very interesting element in
the field of the energy storage. The advantage of storage systems based on lithium is clear
from a Ragone chart (see figure 1.1). (Safety problems are due to the high reactivity of
metallic lithium. Nonacqueous and aprotic solvents have to be used in the electrolyte).
Batteries based on the lithium technology can be divided in two classes: lithium batteries and
lithium-ion batteries. In the former metallic lithium is used as negative electrode, while in the
latter lithium ions are exchanged between compounds which contain lithium atoms. In

- 6 -
primary lithium batteries developed in the 70’s, the active material of the positive electrode is
a sulfide (MoS2, FeS2), an oxide (MnO2), or a fluorinated carbon (CFx) [16-19]. Depending on
the positive electrode, such batteries can reach voltage up to circa 3 V, therefore high specific
energy, have slow self-discharge processes, can be used at low temperature [16-18,20].
Nonacqueous and aprotic solvents have to be used in the electrolyte to avoid the complete
dissolution of the metallic lithium. To enhance the safety of the lithium battery, the metallic
lithium had to be substituted with less reactive compounds.
Figure 1.2 : Schematic description of a lithium-ion cell based on electrochemical intercalation process
(discharge). Anode is composed by graphite, while cathode is a layered oxide. Lithium ions are removed from
the graphene layers and simultaneously are accommodated in the layered oxide [21].
At the end of 70’s the first lithium-ion batteries are born. They were based on the
electrochemical process of insertion. The negative and positive electrodes were substituted
with host materials which can accommodate (release) lithium ions in (from) the structure. In
the case of two dimensional structures, this process is called intercalation (see figure 1.2). The
intercalation is an intrinsically reversible process. For this reason lithium-ion batteries are
commonly rechargeable. It is possible to distinguish between single phase systems and two-
phase systems. The former do not change structure during Li+ insertion and accommodate the

- 7 -
Li- ions through changes in the lattice parameters. The equilibrium potential of these
compounds depends on the amount of Li+ intercalated into the structure. The equilibrium
potential of two phase systems is independent from the amount of Li+ intercalated; the
structure arrangement is related to the lithium content. The most common active materials
used in lithium-ion batteries are graphite and LiCoO2.
There are other electrochemical processes which can be used as working principle in
lithium-ion batteries. Lithium can electrochemically alloy with numerous metals. Many
known Li alloys can be used as active materials for the negative electrode; the equilibrium
potential of such alloys in Li+ electrolytes is generally between 1.0 and 0.3 V (Li/Li+).
Lithium alloys are normally quite brittle, because of their ionic character, and the alloying
causes large volume expansion. Combination of these two effects results in the cracking of the
electrode after few cycles.
Theoretically, it could be possible to combine an intercalation compound at the positive
electrode with metallic lithium at the negative electrode. The problem in a practical
application is related to the surface stability of the metallic lithium. The electrolyte solvents
are not thermodynamically stable in contact with metallic lithium; they form an SEI at the
interface which protects the solvent molecules from further reduction. When fresh metallic
lithium is deposited at the negative electrode, it often forms a needle- like and brittle surface
(dendrites) [22-25], and the following non homogeneous dissolution of lithium will create
isolated lithium particles (loss of specific capacity), which eventually can short-circuit the
battery. It was found that the formation of the dendrites depends strongly on the electrolyte
salt used; in particular LiAsF6 minimizes this phenomenon, but should not be used in
commercial cells because of the toxicity of As.
1.2 Active Materials for the Negative Electrode of the Lithium-Ion Batteries
The negative electrode in lithium-ion batteries substitutes metallic lithium. As explained
before, this is necessary because metallic lithium has not a stable surface during charge /
discharge and the risk of a shot-circuit can arise. To obtain high specific energy, the active
material has to store high amount of charge and to have a more cathodic equilibrium potential
for the Li exchange. Some limits on the latter properties are set by the stability window of the
electrolyte (see paragraph 1.4) and the deposition potential of metallic lithium (electroplating)

- 8 -
on the electrode, which could result in the formation of dendrites. To avoid electroplating of
lithium, the equilibrium potential has to be higher than 60 mV (Li/Li+). It is possible to
classify the active materials for the negative electrode of the lithium-ion batteries are
classified in intercalation compounds and lithium alloys [26].
The most common active material for negative electrodes in lithium-ion batteries is
graphite. It is a layered compound formed by graphene sheets; in between these sheets the
lithium ions can intercalate. It forms four different compounds by intercalation of Li+ at low
potential, namely, LiyC6 (see Table 1.1). The theoretical maximum specific charge, obtained
at y = 1, is equal to 372 mAh g-1. Intercalation of lithium in graphite is highly ordered; there is
one intercalated layer each 1/y layers (stage formation) [27]. This order is repeated in the
whole crystallite. For this reason, lithium-graphite compounds have different structures, and
so different phases. Before the formation of the y = 1/3 phase, there is the so called diluted
phase. For 0 = y < 1/6, a single solid phase appears; the intercalation of lithium ions is
disordered. Intercalation potentials of the different phases are between 0.22 and 0.1 V (Li/Li+)
[28]. These characteristics make graphite a good compound for negative electrode in high
voltage batteries. The nature and surface of graphite influence strongly the cycle life of the
battery [6-10]. In the potential range of Li+ intercalation in graphite, most of the electrolytes
are thermodynamically unstable. The formation of a stable passivation film at the surface of
graphite particle is necessary. This passivation film, the so called Solid Electrolyte Interphase
(SEI), has to be electronically isolating and to allow the passage of Li+. It is composed by
organic (polymeric) and inorganic lithium salts, formed during the reduction of the electrolyte
[11-13]. The nature and the properties of the SEI are correlated with the surface groups in
graphite, as well as with the electrolyte solvents and solutes.
Many metals have shown the possibility to form alloys with lithium at low potential.
These alloys show very high specific charge (even higher than graphite); therefore they are
suitable substitutes of metallic lithium in lithium batteries. The theoretical maximum specific
charge of Si and Sn are circa 4000 and 1000 mAh g-1, respectively [5]. The equilibrium
potential of such alloys in electrolytes containing Li+ ranges between 1.0 and 0.3 V (Li/Li+)
[26,29-31]. Being the equilibrium potential of the lithium alloys more anodic than the
equilibrium potential of the lithium-graphite, the charge loss in alloys due to the reduction of
the solvents in the electrolyte is smaller with respect to graphite. The normally short cycle life,

- 9 -
due to embrittlement and large volume expansion of the particles during alloying, makes these
materials not competitive with graphite negative electrodes [5,29,32,33]. Trials to improve the
cycle life of lithium alloys were done by applying shallow charging and/or using matrix
compounds mixed with the active material [34-36]. The matrix should work as an expansion
absorber, to limit the stress in the active material. In both cases the result is an improvement
of the cycle life, but decrease of the specific charge. The cycle life of the lithium alloys were
also improved by electrochemically reducing compounds based on the alloying metal. During
the first cycle, the real active material has to be formed by reduction of the compounds. SnO
and SnxFey are two examples of this class of compounds [37-41]. In both cases a high amount
of irreversible specific charge was obtained in the first cycle, due to the electrochemical
formation of Sn from the starting compounds.
TiO2 and titanates are included in the list of negative intercalation electrodes for
lithium-ion batteries, even if it is possible to use them as positive ones. The equilibrium
potential of titanium oxide is 1.8 V (Li/Li+), while lithium titanate has an equilibrium
potential of 1.5 V (Li/Li+) [42,43]. Lithium-ion batteries using such negative electrodes show
low voltage (~2 V) with respect to standard batteries (~3.7 V). The maximum theoretical
capacity of TiO 2 is around 170 mAh g-1. These characteristics make TiO 2 aimed for low
energy lithium-ion batteries. Both titanium compounds form two phase systems during Li+
intercalation, thus showing a very well defined equilibrium potential [44]. The advantage of
using such electrodes is related to the more anodic equilibrium potential of the intercalated
compound. In this potential region the reduction of the electrolyte is not thermodynamically
favored and also lithium electroplating is impossible, allowing the usage of much higher
current density (high power and fast charge). This is no t the case of negative electrodes based
on graphite particles, for which the equilibrium potential of the richer Li compound is around
0.1 V (Li/Li+).
In table 1.1 the main characteristics of the most common active materials for the
negative electrode of lithium-ion batteries are given.

- 10 -
Reduced form Oxidized form Eeq (Li/Li+) / V(a) Qmax / mAh g-1(b) Negative electrode active materials
Li Li+(c) 0 3861 Graphite based compounds
LiC6 Graphite 0.1 372 Li1/2C6 Graphite 0.13 186 Li1/3C6 Graphite 0.22 124
Alloys LiAl Al 0.35 993 Li22Sn5 Sn 0.42 - 0.66 994 Li3Sb Sb 0.9 660 Li21Si5 Si 0.3 4000
Titanates LixTiO2 TiO2 1.8 170 Li4+xTi5O12 Li4Ti5O12 1.5 160
Table 1.1: Main characteristics of negative electrode active materials for lithium-ion batteries, including metallic
lithium. Eeq is the equilibrium potential and Qmax is the maximum theoretical specific charge. (a) The
electrochemical activity can be observed in a range of potentials. (b) The specific charge is relative to the weight
of the pristine active material. (c) Li+ is in solution. (Source ref. [26,43,45])
1.3 Active Materials for the Positive Electrode of the Lithium-Ion Batteries
In general, the active materials for positive electrodes are compounds based on
transition metals which can release lithium ions from the structure by oxidation of the
transition metal cations [19]. To obtain high rate capability and high reversibility, it is
important that during intercalation the structure of the active material remains unaltered. Most
of the active materials for the positive electrode of the lithium-ion batteries have a layered
structure, with transitional metal ions ordered in a layer (slab) and lithium ions in the
following layer (interslab). The disorder of the structure can be quantified from the amount of
transition metals which are in the interslab. Li+ can diffuse rapidly in the structure only if the
material is highly ordered [19,46]. Moreover, to obtain high enough specific energy density, it
is necessary that at least one Li+ per transition metal can be removed from (accommodated in)
the structure. Also the electronic conductivity of the compounds is important. If it is too low,
some conductive additives (mainly carbonaceous) have to be mixed in the electrode
composition, thus lowering the specific energy. In this case, the reaction can occur only in the
regions where the three phases (conductive additives, active material and electrolyte) meet
together.

- 11 -
The compounds which show electrochemical activity to lithium intercalation were
known before 1970 (layered dichalcogenides and trichalcogenides). Between them, TiS2 was
particularly appealing for lithium-ion intercalation [18,47]. LixTiS2 shows a single structure in
the whole range of composition 0 = x = 1 [48]. The disorder influences strongly the diffusion
of lithium ions; even a small amount of Ti in the interslab reduces drastically the diffusion
coefficient [46]. The equilibrium potential is around 2 V and the discharge/charge curve is
sloppy. These characteristics make the compound uninteresting for high energy applications
or when the delivery of constant power is required.
Vanadium oxide, V2O5, was one of the first layered oxides studied [48-51]. It has a
complex intercalation behavior, involving several phases in relationship with the lithium
content. After the first full charge, the lithiated compound shows a sloppy behavior during
galvanostatic cycling. This effect makes V2O5 uninteresting for practical applications. Other
vanadium oxide compounds were studied, such as V6O13 [52], which can intercalate up to 1 Li
per V, and LiV3O8 [53,54], which structure can be swelled to accommodate more lithium ions.
LiCoO2 was the first active material for positive electrode commercialized in large scale
[55]. The LiCoO2 has a layered structure. The complete removal of the lithium ions from the
interslab results structural changes. The oxygen layers rearrange in a hexagonal close packed
cell [56]. CoO2 is then electrochemically inactive with respect to Li+ intercalation. Removal
of more than 50% of lithium results in an increase of the amount of the irreversible specific
charge, without benefit for the reversible specific charge. For this reason, the maximum
practical specific charge results circa 135 mAh g-1. LiCoO2 is not the ideal material; it has
several and severe disadvantages, related to the safety of the battery, pollution, healthcare, and
cost of the cobalt.
LiNiO2 has the same structure of the cobalt equivalent, with the advantage of the lower
cost of Ni with respect to Co. Studies on this compound suggest an excess of nickel in the
structure, localized in the interslab [19]. This disorder causes a reduction of the diffusion
coefficient and consequently of the power capability [19]. Moreover, the de- intercalated
compound seems to be unstable and therefore dangerous in contact with organic liquids.
Many modifications were tried, by substituting part of the nickel with Co or Al [57-59]. The
effect of these additives is to reduce the disorder in the interslab and increase the stability of
the structure at low lithium content, respectively, thus bettering the reversibility and the life

- 12 -
cycle. Both nickel and cobalt compounds are so called first-generation cathodes for lithium-
ion batteries.
Second-generation cathodes include modifications of the LiNiO 2, spinel cathodes
LiMn2O4, layered LiMnO2, and its modifications. The LiMn2O4 spinel compound has three
equilibrium potentials for lithium ion intercalation, two are at 4.0 and 4.1 V (Li/Li+), one is at
circa 3.0 V (Li/Li+). Often only the lithium intercalation at 4.0 and 4.1 V (Li/Li+) is used, so
that the cell is constructed in the discharged state [60-62]. The average oxidation state of the
manganese is critical to obtain effective cycle life. When the oxidation state of the manganese
is 3.58 or higher, like in the Li1+xMn2-xO4 compounds, the dissolution of the manganese is
minimized and the spinel compound has a longer cycle life [62]. LiMnO2 has a layered
structure; it is a low cost compound, and environmental friendly. It is synthesized by ion
exchange process starting from NaMnO2 [63,64]. In de- intercalated state, the structure is not
stable and change to spinel [65]. To stabilize the structure, Ni and/or Co are used as
substitutes of Mn [66]. Good results are obtained with the compound LiNi1/2Mn1/2O2, which
has also a higher thermal stability with respect to LiCoO2. The substitution of Mn with Co, Ni
or Fe has beneficial effects on the electronic conductivity of the compound [19].
The layered oxide class Li(NiyMnzCo1-y-z)O2, the so called NMC compounds, is the
third generation of active materials for the positive electrode of lithium-ion batteries [1-3].
The most studied compounds are the ones with z = y. In particular the z = y = 1/3 compound
was extensively studied. As general rule, manganese and cobalt are present in the structure as
Mn+4 and Co+3 respectively, while nickel is observed as a mixing of Ni+2 and Ni+3. XPS
studies have confirmed that, when y = z, nickel ions are in divalent state [67]. The presence of
cobalt ions decreases the disorder in the interslab. The y = z compounds show good thermal
stability [68-70]. These compounds can reach high specific charge density (circa 170 mAh g-
1) and long cycle life. The overlithiated form of the NMC, with general formula
Li1+x(NiyMnzCo1-y-z)1-xO2, does exist.
LiFePO4 is the first positive material which is low cost, environmentally benign, and
can be charged reversibly up to 1 Li per Fe [4]. The compound is an olivine electrochemically
active to Li+ intercalation. During de- intercalation, it forms a two phase system; LiFePO4 is in
equilibrium with FePO4. The equilibrium potential of such a system in an electrolyte
containing Li+ is equal to 3.4 V (Li/Li+). The theoretical specific charge of the LiFePO4
- 13 -
compound is equal to 170 mAh g-1. The low electronic conductivity of such compounds (10-9
S/cm) does not permit to use them “as they are” in positive electrodes [71]. They have to be
mixed with carbonaceous compounds. Alternatively, doping with some parts per million of
Nb increases the conductivity by 8 order of magnitude [72]. Carbon coating was also used to
enhance the electronic transport [73].
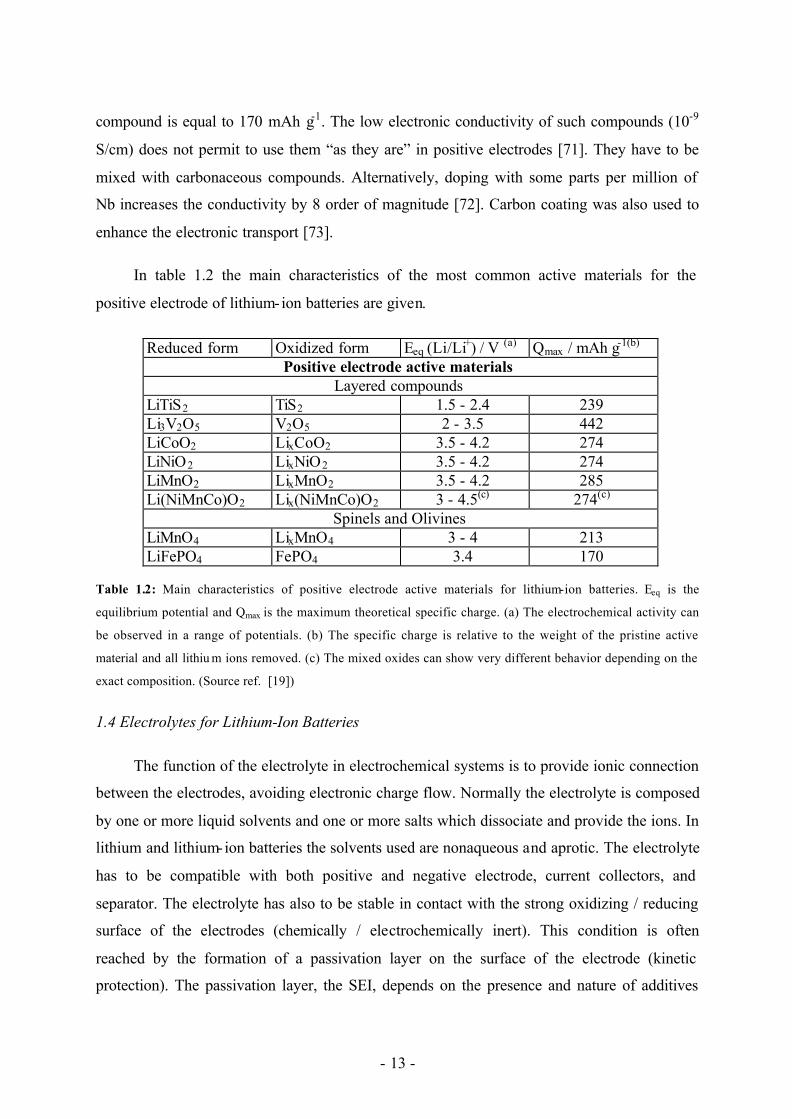
In table 1.2 the main characteristics of the most common active materials for the
positive electrode of lithium-ion batteries are given.
Reduced form Oxidized form Eeq (Li/Li+) / V (a) Qmax / mAh g-1(b)
Positive electrode active materials Layered compounds
LiTiS2 TiS2 1.5 - 2.4 239 Li3V2O5 V2O5 2 - 3.5 442 LiCoO2 LixCoO2 3.5 - 4.2 274 LiNiO2 LixNiO2 3.5 - 4.2 274 LiMnO2 LixMnO2 3.5 - 4.2 285 Li(NiMnCo)O2 Lix(NiMnCo)O2 3 - 4.5(c) 274(c)
Spinels and Olivines LiMnO4 LixMnO4 3 - 4 213 LiFePO4 FePO4 3.4 170
Table 1.2: Main characteristics of positive electrode active materials for lithium-ion batteries. Eeq is the
equilibrium potential and Qmax is the maximum theoretical specific charge. (a) The electrochemical activity can
be observed in a range of potentials. (b) The specific charge is relative to the weight of the pristine active
material and all lithiu m ions removed. (c) The mixed oxides can show very different behavior depending on the
exact composition. (Source ref. [19])
1.4 Electrolytes for Lithium-Ion Batteries
The function of the electrolyte in electrochemical systems is to provide ionic connection
between the electrodes, avoiding electronic charge flow. Normally the electrolyte is composed
by one or more liquid solvents and one or more salts which dissociate and provide the ions. In
lithium and lithium-ion batteries the solvents used are nonaqueous and aprotic. The electrolyte
has to be compatible with both positive and negative electrode, current collectors, and
separator. The electrolyte has also to be stable in contact with the strong oxidizing / reducing
surface of the electrodes (chemically / electrochemically inert). This condition is often
reached by the formation of a passivation layer on the surface of the electrode (kinetic
protection). The passivation layer, the SEI, depends on the presence and nature of additives
- 14 -
and impurities, solvents and solutes. Solutes have also to be mostly dissociated in the solvent,
and to have a large range of temperature stability. Other important factors which determine
the choice of an electrolyte are the cost, safety, health, and environmental compatibility. The
exact formulation of the electrolyte is very important for the cycle life of the battery [74].
From the electrochemical point of view, the ionic conductivity is the most important
property, because it is directly connected with the specific power of the cell. The specific
conductivity of a binary electrolyte (electrolyte composed of a single salt) is connected with
both mobility and number of the ions in the solvent. The latter is strictly connected with the
dissociation constant of the salt. The Stokes-Einstein relation connects the mobility of the ion
and the viscosity of the solvent [21]:
i
i r61
πη=µ (1.1)
where µi is the ionic mobility, η is the viscosity of the solvent, and ri is the ionic radius
(inclusive of the solvation shell). Solvents with low viscosity are necessary in the formulation
of the electrolyte. Moreover, the cations in the electrolyte (Li+) participate in the
electrochemical reaction at both electrodes and no support electrolyte is present in lithium-ion
batteries. The contribution of the lithium ions to the total conductivity becomes very
important. It is given by its transport number:
−+
+
+µ+µ
µ=
ALi
LiLi
t (1.2)
where ti is the transport number, and A- is the corresponding anion of the lithium salt. A
transport number near to 1 is much desired, because it would eliminate partially or completely
the limitations connected with the diffusion of lithium-ions in the electrolyte. Unfortunately,
the measured transference numbers for Li+ in standard nonaqueous electrolytes used in
lithium-ion batteries range from 0.2 to 0.4, due to the bigger solvation shell of Li+ with
respect to the one of A- [75,76].
The formulation of the electrolyte most used in commercially available lithium-ion
batteries is a combination of linear and cyclic carbonates as solvents, with presence of
passivating additives, and LiPF6 as electrolyte solute. The high dielectric cons tant of ethylene
carbonate (EC) and its low viscosity (with respect to other cyclic carbonates), makes it a good
candidate as electrolyte solvent [21]. At room temperature it is solid (see table 1.3). The most

- 15 -
used linear carbonate is dimethyl carbonate (DMC). The mixture of DMC and EC is liquid in
a large range of compositions. LiPF6 is chosen as solute because it has a good balance
between conductivity, safety and hazard for health. A 1M LiPF6 solution of EC:DMC 1:1
(wt.) has a conductivity of 10.7 mS cm-1 (see table 1.4), and it is usable in the temperature
range between -20 and 50 °C .The conductivity is quite high for a nonaqueous electrolyte, but
is still too low to avoid non-homogeneous usage of thick electrodes when high power is
required.
Apart LiPF6, other solutes are often used in laboratory to investigate the effect of the
anion on the battery cycle life, on the reduction and oxidation products generated during the
formation of the SEI, and on the temperature stability. LiClO 4 can create SEI films with
enhanced ionic conductivity, because of its relatively low reactivity with moisture [77]. LiPF6
reacts with moisture traces and the hydrolysis gives HF, which forms then LiF in the SEI, a
poor ionic conductor [78]. Unfortunately, by high current or high temperature, the ClO 4- is not
stable [79]. LiAsF6 has the same advantage as the perchlorate, and also prevents the formation
of dendrites in metallic lithium electrodes, making this electrolyte interesting for lithium
batteries [80]. But the toxicity of As makes this salt not usable in commercial batteries. LiBF4
has the inconvenience of a low conductivity, due to the low dissociation constant [75].
Polymer electrolytes and ionic liquids are believed to be the electrolytes for the next
generation of lithium-ion batteries [21]. Solid polymer electrolytes are not interesting for the
industry, because of the very low conductivity (< 1 mS cm-1) [81], and they show no practical
advantage with respect to the liquid ones. Also the application of ionic liquid electrolytes in
lithium-ion batteries seems to remain a long term goal [21]. Gel polymer electrolyte entered in
the market in 2000 (known as Li-polymer). They mainly consist of a rubber- like matrix
swollen in a liquid electrolyte. The liquid electrolytes used are the same described previously.
The ionic conductivity of this class of electrolytes is around 4 mS cm-1 [82]. Depending on
the composition of the matrix, they can show good mechanical strength, good
electrolyte/active material contact, good flexibility, and processability. Especially this last
point is very important in the choice of the polymeric matrix, because the electrochemical
performance is strictly dependent on the liquid electrolyte, as the thermal and potential
stability windows.

- 16 -
Solvent Tm / °C Tb / °C η / cP(a) ε (a)
Cyclic Carbonates EC 36.4 248 1.9(b) 89.8 PC -48.8 242 2.5 64.9
Linear Carbonates DMC 4.6 91 0.59 3.1 DEC -74.3 126 0.75 2.8 EMC -53 110 0.65 2.9
Table 1.3: Main characteristics of the commonest solvent used in lithium-ion batteries. Tm is the melting
temperature; Tb is the boiling temperature; η is the viscosity of the solvent; ε is the relative dielectric
constant. (a) Measured at 25 °C. (b) Measured at 40 °C. (Source ref. [21])
σ / mS cm-1 Solute Tdec / °C PC EC:DMC
LiBF4 > 100 3.4 4.9 LiPF6 ~ 80 5.8 10.7
LiAsF6 > 100 5.7 11.1 LiClO 4 > 100 5.6 8.4
Table 1.4: Main characteristics of the commonest solutes investigated in lithium-ion cells. Tdec is the
temperature of decomposition; σ is the specific conductivity of the solute in the indicated solvents. (Source
ref. [21])

- 17 -
2 Theoretical Background
The following paragraphs introduce the theoretical background of electrochemistry,
mass spectrometry, and the techniques used during the PhD work. For further information on
these themes, the textbooks cited at the end of the thesis are advised [83-86].
2.1 Electrochemistry
Electrochemistry concerns reduction/oxidation reactions (located at two different
positions of the system) and/or accumulation of charged particles (ions and/or electrons). The
simplest electrochemical system (also called electrochemical cell) is composed by two
electron-conductive phases, the electrodes, separated by an ion-conductive phase, the
electrolyte. The electrode at which the reduction occurs is called cathode. The electrode at
which the oxidation occurs is called anode. Commonly, electrodes are solids or liquids which
exchange electrons with the reactants and electrolytes are liquid solutions composed by a
solvent and a dissolved ionic solute. Complex electrochemical systems can be constituted by
other electron- and/or ion-conductive phases between electrode and electrolyte.
By contacting two phases, there is an exchange of the common species between them.
This exchange proceeds until the chemical potentials of the common species in the two phases,
µiα and µi
β, are equal (equilibrium condition). In the case of charged species, the equilibrium
condition is given by the equality of the electrochemical potentials, µ?iα and µ?iβ (see reference
[83], chapter 3). The electrochemical potentials are dependent on the concentration of the
species in the phase and the electric state of the phase. An electric potential difference
between the two phases in contact is established because of the exchange of charged particles
and orientation of the dipoles (see figure 2.1).
The charged particles are located near the boundary of the two phases: the interface.
They form a high electric field between the two phases even if a small exchange occurs. This
region of transition between the two phases in contact is called double layer, because it is
formed at both sides of the boundary. The charge stored on one side is equal in value and

- 18 -
opposite in sign with respect to the charge stored on the other side. If one of the two phases is
a liquid, there is a minimum distance that the solvated ions can reach, due to their solvation
shell. This region of minimum distance, indicated with dH, is the so called Helmholtz plane.
The region external to the Helmholtz plane is called the outer Helmholtz layer. The ions can
be located at distances below dH. This region is called the inner Helmholtz layer. To enter into
the inner Helmholtz layer, the ions have to lose partially or totally the solvation shell (see
reference [83], chapter 4). Their physico-chemical condition is different with respect to the ir
condition in the bulk of the electrolyte. The plane where the ions are adsorbed is called inner
Helmholtz plane, indicated with di (see figure 2.1).
V
+–+ +
+
+
+
–
–
–
–
–
Electrodes
Electrolyte
a)
x
+
+
Electrode
Electrolyte
dH
Outer Helmholtz
Layer
di
+
+
b)
–––––
+
V
+–+ +
+
+
+
–
–
–
–
–
Electrodes
Electrolyte
a)
VV
++––++ ++
++
++
++
––
––
––
––
––
Electrodes
Electrolyte
a)
x
+
+
Electrode
Electrolyte
dH
Outer Helmholtz
Layer
di
+
+
b)
–––––
+
x
+++
+++
Electrode
Electrolyte
dH
Outer Helmholtz
Layer
di
++
++
b)
––––––––––
+++
Figure 2.1: a) Representation of an electrochemical cell, with two solid electrodes and a liquid electrolyte
separating them. b) Representation of the interface electrode / electrolyte; dH is the Helmholtz plane and d i is the
inner Helmholtz plane. (Adapted from reference [83] figure 4.1)
The electrochemical reactions are classified in outer- and inner-sphere reactions,
depending on the position of the ions which participate in the reaction. This classification is
very important for the study of kinetics, because the two classes of reaction behave very
differently. The outer-sphere reactions involve ions located in the outer Helmholtz layer.
These are typically redox reactions, in which the ions change their valence state but still
remain in the same phase, such as
+−+
←→+ 2
)()(3
)( εσε FeeFe
where ε is indicating the electrolyte phase and σ the electrode phase. In such reaction, the
electrons have to tunnel through the inner Helmholtz layer. Because the tunnel probability

- 19 -
decreases with increasing distance, the reaction takes place mainly near the Helmholtz plane.
Such reactions are normally fast and weakly influenced by the electrode material.
Inner-sphere reactions involve ions that are located in the inner Helmholtz plane. The
reaction occurs with the change of the physico-chemical conditions and phase of the ions.
Typical of this class of reaction is the electrochemical adsorption of a species, e.g., H+,
•−+
←→+ )()()( iHeH σε
where i is indicating the inner Helmholtz layer. Because the adsorption process is specific for
the nature and the crystallographic structure of the solid phase, such reactions are strongly
influenced by the choice of the electrode; the kinetic parameters can change several orders of
magnitude. In this case one speaks about the electro-catalytic properties of the electrode. In
general the inner-sphere reactions are slower than the outer-sphere reactions. Electrochemical
insertion, intercalation and alloying are all processes involving inner-sphere mechanisms.
In an electrochemical system it is possible to control one more parameter with respect to
the standard chemical systems: the potential difference between the two electrodes. The
potential difference between the electrodes is generated by the equilibrium processes between
each electrode and the electrolyte. By changing the potential difference with respect to the
equilibrium value, electric current flows through the system. The current intensity is given by
the number of electrons produced at the anode and consumed at the cathode, which means it is
related to the rate of reaction. It is also possible to impose the current intensity, in which case
the potential difference in the cell will change to adapt to the current flow. Independently
from the experimental setup, it is only possible to impose one parameter between current
intensity and potential difference; the other will be set consequently.
The commonly used experimental setups to study electrochemical systems are cyclic
voltammetry and galvanostatic cycling. In cyclic voltammetry the potential difference is
changed continuously with a fixed slope, called sweep rate. The sweep rate is changed in sign
once a maximum or a minimum potential difference is reached. During such experiments, the
current intensity is registered as function of the potential and, in general, the shape depends on
the sweep rate. In galvanostatic cycling experiments the current intensity is imposed and
constant. The potential will be registered as function of the total charge passed through the
system. In general the shape of this curve is a function of the current intensity. Also in this

- 20 -
experiment, the current intensity is changed in sign once a maximum or a minimum potential
difference is reached. The shape of such curves is related to the reaction mechanism, transport
of the reactants from the bulk of the phase to the interface, and transport of the product in the
opposite direction.
An electrochemical cell can implement other auxiliary electrodes. The simplest case is
the use of a third electrode as a reference electrode. It is necessary when a reference potential
is needed to study only one electrode, also called working electrode (see figure 2.2). The
counter electrode is the electrode not connected to the reference electrode. The reference
electrode has to maintain the same potential even if some current is flowing through it (ideally
non-polarizable electrode). In a three electrode cell, the potential difference between working
and reference electrode is registered or controlled, while the current flows mainly between
working and counter electrode. By moving the reference electrode with respect to the working
one, the potential distribution along the electrolyte could be measured, both in equilibrium
and during current flow. In equilibrium condition, the bulk of the electrolyte is at constant
potential, while in the electrolyte nearer to the electrodes there is a potential distribution, due
to the accumulation of charged particles (see figure 2.2).
Working Electrode V
+
+
++++
–
–––
–
Reference Electrode
a)
–
–
–
+
+
ACounter
Electrode
x
Electrode
Electrolyte
dH
Outer Helmholtz
Layer
di
b)
ϕ
0
Working Electrode V
+
+
++++
–
–––
–
Reference Electrode
a)
–
–
–
+
+
ACounter
ElectrodeWorking Electrode VV
++
++
++++++++
––
––––––
––
Reference Electrode
a)
––
––
––
++
++
AACounter
Electrode
x
Electrode
Electrolyte
dH
Outer Helmholtz
Layer
di
b)
ϕ
0 x
Electrode
Electrolyte
dH
Outer Helmholtz
Layer
di
b)
ϕ
0 Figure 2.2: a) Representation of an electrochemical cell, containing working, counter and reference electrode.
The potential difference between the working and the reference electrode is registered or controlled. The current
flows between working and counter electrode. b) Representation of the potential distribution at the interface
electrode / electrolyte. Electrolyte is considered to have ϕ = 0. (Adapted from reference [83], figure 4.1)
- 21 -
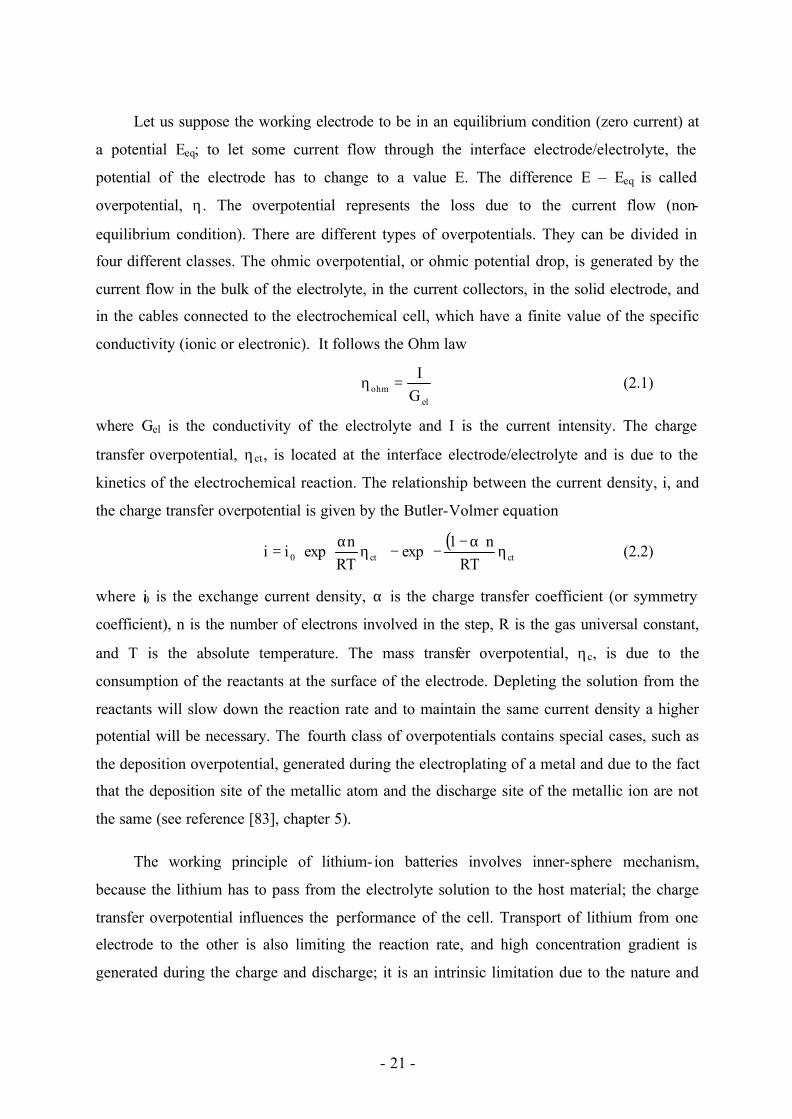
Let us suppose the working electrode to be in an equilibrium condition (zero current) at
a potential Eeq; to let some current flow through the interface electrode/electrolyte, the
potential of the electrode has to change to a value E. The difference E – Eeq is called
overpotential, η. The overpotential represents the loss due to the current flow (non-
equilibrium condition). There are different types of overpotentials. They can be divided in
four different classes. The ohmic overpotential, or ohmic potential drop, is generated by the
current flow in the bulk of the electrolyte, in the current collectors, in the solid electrode, and
in the cables connected to the electrochemical cell, which have a finite value of the specific
conductivity (ionic or electronic). It follows the Ohm law
el
ohm GI
=η (2.1)
where Gel is the conductivity of the electrolyte and I is the current intensity. The charge
transfer overpotential, ηct, is located at the interface electrode/electrolyte and is due to the
kinetics of the electrochemical reaction. The relationship between the current density, i, and
the charge transfer overpotential is given by the Butler-Volmer equation
( )
η
α−−−
η
α= ctct0 RT
n1exp
RTn
expii (2.2)
where i0 is the exchange current density, α is the charge transfer coefficient (or symmetry
coefficient), n is the number of electrons involved in the step, R is the gas universal constant,
and T is the absolute temperature. The mass transfer overpotential, ηc, is due to the
consumption of the reactants at the surface of the electrode. Depleting the solution from the
reactants will slow down the reaction rate and to maintain the same current density a higher
potential will be necessary. The fourth class of overpotentials contains special cases, such as
the deposition overpotential, generated during the electroplating of a metal and due to the fact
that the deposition site of the metallic atom and the discharge site of the metallic ion are not
the same (see reference [83], chapter 5).
The working principle of lithium-ion batteries involves inner-sphere mechanism,
because the lithium has to pass from the electrolyte solution to the host material; the charge
transfer overpotential influences the performance of the cell. Transport of lithium from one
electrode to the other is also limiting the reaction rate, and high concentration gradient is
generated during the charge and discharge; it is an intrinsic limitation due to the nature and

- 22 -
composition of the electrolyte. Finally, the electrolyte used in the lithium-ion batteries has a
relatively low specific conductivity, about 0.01 S cm-1. All the common classes of
overpotentials are determining the performance of the battery.
x
Bulk Electrolytea)
ϕ
0
x
Double Layer
b)
ϕ
0dHdi0
x
Inner Helmholtz
Layerd)
ϕ
0dHdi0x
Double Layer
c)
ϕ
0dHdi0
x
Bulk Electrolytea)
ϕ
0
x
Bulk Electrolytea)
ϕ
0
x
Double Layer
b)
ϕ
0dHdi0 x
Double Layer
b)
ϕ
0dHdi0
x
Inner Helmholtz
Layerd)
ϕ
0dHdi0 x
Inner Helmholtz
Layerd)
ϕ
0dHdi0x
Double Layer
c)
ϕ
0dHdi0 x
Double Layer
c)
ϕ
0dHdi0
Figure 2.3: Potential distribution in the different parts of the electrochemical cell at equilibrium conditions (---)
and under current flow (? ). a) Ohmic overpotential in the bulk of the electrolyte. b) Charge transfer
overpotential in the interface electrode/electrolyte. c) Mass transfer overpotential in the interface
electrode/electrolyte. d) Deposition overpotential in the inner Helmholtz layer. (See reference [83])
2.2 Mass Spectrometry
Mass spectrometry is a technique used in chemistry to study nature and composition of
gaseous mixtures. It is based on the separation of ionized gaseous compounds according to
mass/charge ratio (m/z or mass number). Commonly, the gaseous ions are produced in an ion
source. The ions are then separated by application of an electric and/or magnetic field into the
appropriate mass-charge groups. Finally, the ions are detected by a detector. In an ideal mass
spectrometer the ion travels form source to detector without interactions with the other ions.
To reach this condition, the pressure inside the mass spectrometer has to be lower than 10-5
mbar (see refernce [85], chapter 8). There are several types of instruments and they are

- 23 -
classified in static and dynamic instruments. The former are based on constant electric and
magnetic field, the latter on periodic electro-magnetic field (see reference [85], chapter 2).
The ion source has to produce the ion beam from gaseous molecules. There are some
common features that an ideal ion source should posses. The produced ion beam has to be
sufficiently intense for accurate measurements of the separated ions; the total intensity of the
beam should reach 10-10 A (see reference [85], chapter 4). The ion beam has to be stable. The
energy spread of the ion source has to be as low as possible, to obtain the highest resolving
power. The intensity of the background signal produced by the ion source as to be as low as
possible. The memory effect or cross contaminations between successive samples have to be
reduced to the minimum. Mass discrimination has to be negligible (all the ions should have
the same probability to enter the mass analyzer).
The most common ion source is the electron- impact source; it was also used during this
PhD work. This source is very stable, has a low energy spread, and intensity of 10-9 A. It has
the disadvantage to produce a quite intense background signal, due to residual gases. The
gaseous molecules are ionized by impact with an electron beam. The produced ions depend on
the energy of the electron beam. The threshold for ionization is the ionization potential of the
molecule. If the energy is lower than it, no ionization occurs. At energies slightly above this
threshold, ions of the corresponding molecule are produced (parent ions), mainly positive:
−+− +=+ e2MeM
where M indicates the gaseous molecule. If the energy of the electron beam is very high, the
molecule can be fragmented, due to the instability of the ion produced:
21 mmM += ++
where m1 and m2 are two fragments of the molecule M. It also happens that in the ionization
process two fragments with opposite charge are formed:
−−+− ++=+ emmeM 21
Some mass discrimination occurs in the source of this type, and is due to the trajectory of the
ions and the exit slit, which separate the ion source from the mass analyzer. It is also possible
to obtain ions with multiple charges.

- 24 -
a)
b)
Quadrupole
Stable Ions
Source
Unstable Ions
Accelerating field
Detector
c)
r
Q
A
Stability Window
A/Q constant
m1
m2
a)
b)
Quadrupole
Stable Ions
Source
Unstable Ions
Accelerating field
Detector
Quadrupole
Stable Ions
Source
Unstable Ions
Accelerating field
Detector
c)
r
Q
A
Stability Window
A/Q constant
m1
m2
Q
A
Stability Window
A/Q constant
m1
m2
Figure 2.4: a) Graphical representation and working principle of a quadrupole mass spectrometer. b) Cross
section view of the quadrupole mass spectrometer developed by Paul et al. c) Stability window of a quadrupole
mass spectrometer and resolution line (A/Q). (Adapted from reference [85], figures 2.17 and 2.18)
The mass spectrometer used during this PhD work is a quadrupole mass spectrometer.
The quadrupole mass spectrometer was developed by Paul et al. in 1955. The separation of
the mass numbers takes place in a quadrupole, radio-frequency electric field. The ion injected
in the quadrupole field start to oscillate. If the oscillations of the ion are stable, it can reach
the detector. In the opposite case, the ion is deviated outside the quadrupole and strikes one of
the electrodes. There is a region of stability, which depends on the values of the constant and
alternate electric field generated by the quadrupole, the distance between the quadrupoles and
the frequency of the alternate electric field. Also the shape of the electrodes is important in the
determination of the stability window. In the original instrument of Paul and coworkers, the
poles had a hyperbolic cross section. The stability region is represented in a diagram with the
dimensionless parameters A and Q:
2222 mr
eV4Q;
mreU8
Aω
=ω
= (2.4)
where U is the constant electric potential of the quadrupole, V the r- f electric potential of the
quadrupole, r a dimension depending on the geometry of the system, and ω the angular

- 25 -
frequency of the r- f electric potential (see reference [85], chapter 2). Constant values of A/Q
define the resolution of the instrument, and changing ω or U and V proportionally, the mass
spectrum of the molecule is scanned (see figure 2.4). By increasing the ratio A/Q, the
resolution of the instrument increases. There is a limit value of A/Q; all the ions are deviated
outside the quadrupole at values above it. The shape of the peaks results trapezoidal at low
resolution and triangular at high resolution. The detector of the quadrupole mass spectrometer
is an electrical detector. The electrical detector collects the ion current, and amplifies it. In
this way it is possible to detect ionic currents up to 10-15 A.
2.3 Differential Electrochemical Mass Spectrometry (DEMS)
The differential electrochemical mass spectrometry method (DEMS) allows the
qualitative and quantitative analysis of the electrochemically developed gases in an
electrochemical system, by using a mass spectrometer. The electrochemical cell is shifted
from its equilibrium condition by changing the voltage of the cell (cyclic voltammetry) or
applying a current intensity (galvanostatic cycling). If a reaction involving gaseous products
takes place, the developed gases can be detected from the mass spectrometer. The mass
spectrometer used is normally monoenergetic; it can detect the signal of one mass number per
time. The intensity of the mass signal is registered continuously and correlated with the
voltage of the cell (potential of the working electrode if a reference electrode is used).
It is possible to detect the intensity of many mass signals. In this way, a punctual mass
spectrum can be obtained, which gives more information on the composition of the gaseous
phase. The more mass signals are detected, the more precise is the mass spectrum, and the few
points are registered in the time unit (loss of time resolution). An optimum between the
resolution of the mass spectrum and of the time scale has to be found. A typical curve of the
intensity of the mass signals vs. the potential (mass signal cyclic voltammogram, MSCV) or
vs. the time (comparative plot) shows one or more peaks in a potential window where the
mass signal is sensitive to a gas developed (see figure 2.5). Normally, mass spectroscopic
cyclic voltammograms also report the current intensity flowing through the electrochemical
cell, and comparative plots report several mass numbers and the voltage of the cell (or the
potential of the working electrode).

- 26 -
The intensity of each mass signal has a background line, which depends on the mass
number (see figure 2.5). This background intensity depends on three factors: the background
intensity of the instrument (see the previous paragraph 2.2); the transport of the gaseous phase
from the surface of the electrode to the mass spectrometer; and the presence of low boiling
compounds in the electrolyte. Impurities and memory effects are also reflected in the signal,
but the instrument and the setup for the experiment can be purged to minimize them.
Generally, the higher is the background intensity, the lower is the resolution of the developed
gasses. In extreme cases, the gas signal is not detectable due to the background intensity.
0 5 10 150.00
0.05
0.10
0.15
0.20
0.25
0
1
2
3
I 2 / nA
t / h
I2
E v
s. L
i/Li+ /
V
E
Figure 2.5 : Comparative plot of the intensity of the mass signal 2, I2, for a graphite KS44 sample acquired
during a cyclic voltammetry at 0.2 mV s-1 in 1 M LiPF6, EC:DMC (1:1 by wt.) electrolyte. The peaks indicate
development of a gas in the potential window 0.5 – 0.01 V vs. Li/Li+ at each cycle, while the value 0.15 nA can
be assumed as the background intensity of mass signal I2.
The background intensity of the instrument cannot be avoided. It depends on the mass
number. It can be recorded and then subtracted by closing the instrument input and measuring
the mass spectrum, once the equilibrium condition is reached. Its value will be normally
constant. The background signal due to the transport of the gaseous phase depends on the

- 27 -
construction of the electrochemical cell. The gases can be sucked directly from the electrode,
if a membrane impermeable to the liquid electrolyte is used, or are removed continuously
from the top of the electrochemical cell. In both cases the flux of a carrier gas is needed. The
carrier gas generates a mass spectrum which adds to the instrument background intensity.
This background intensity is proportional to the concentration of the carrier gas in the gas flux.
If a concentration of few tenth or hundreds ppm of electrochemically developed gases has to
be measured, the concentration of the carrier gas remains constant and also the background
signal. The background signal due to the carrier gas can be calculated. If low boiling
compounds are present in the electrolyte, they are also removed continuously from the cell
and injected into the mass spectrometer. The vapors of the solvents of the electrolyte results in
another part of the background intensity. The intensity of the background depends on the
amount of evaporated solvent. Very precise instruments will be affected also by high boiling
solvents. Depending on the solvents of the electrolyte, the intensity of this background can be
intense and hide the detection of some important products.
Generally, the background intensity is defined by hand and then subtracted. During this
thesis work, an analytical procedure to eliminate the influence of the background intensity
was developed. If the pressure in the mass spectrometer is lower than 10-5 mbar, the ions in
the ion beam are not interacting (see refernce [85], chapter 8). In this case the total intensity of
the mass signals observed is the sum of the background intensity of the instrument and the
number of molecules generating that mass number times the senstivity of the molecule to that
mass number (see reference [85], chapter 9):
( ) ( ) ( )
+= ∑
−
=
1N
0im,iiISmm StytPBtI (2.5)
where Im is the intensity of the mass signal m, Bm the background signal of the instrument for
mass number m, PIS the pressure inside the ion source, yi the molar fraction of the i-th
molecule, Si,m the sensitivity factor of the i- th molecule with respect to the mass number m,
and N the total number of species in the gaseous phase. It is known that the sum of the molar
fractions is equal to 1. If the carrier gas is taken as reference, and indicated with the index 0,
eq. (2.5) is rewritten as:
( ) ( )( ) ( )( )∑
−
=
−+=−
=1N
1im,0m,iim,0
IS
mmm SStyS
tPBtI
tJ (2.6)

- 28 -
S0,m can be evalueted by injecting the pure carrier gas in the mass spectrometer and measuring
the mass spectrum; it is independent from the time. If S0,m is known, it can be subtracted from
the intensity of the mass signal:
( ) ( )( )∑−
=
−=−1N
1im,0m,iim,0m SStyStJ (2.7)
In this way it is possible to keep the DEMS measurement free from the background signal due
to the instrument and the gas carrier. The intensities obtained by eq. (2.7) are still affected by
the signal of the evaporated solvents, which is changing in time. By giving the index 1 to the
electrolyte solvent, eq. (2.7) is written as:
( ) ( )( ) ( )( )∑−
=
−+−=−1N
2im,0m,iim,0m,11m,0m SStySStyStJ (2.8)
To eliminate the background intensity of the solvent of the electrolyte, it is necessary to find a
mass number m' that is not influenced by the electrochemically developed gases and the
carrier gas, i.e. Si,m' and S0,m' equal to 0. In this case it results:
( ) ( )m,1
m1 S
tJty
′
′= (2.9)
At a time t0 after the purging of the cell and before starting the electrochemical test, the yi’s
are equal to 0:
( ) ( )( )m,0m,101m,00m SStyStJ −=− (2.10)
Finally, the value of the background intensity due to the solvent is equal to:
( )( ) ( )( ) ( )[ ] ( )
( )0m
mm,00m
01
1m,0m,101 tJ
tJStJ
tyty
SSty′
′−=− (2.11)
By substitution of eq. (2.11) in eq. (2.8), the signal of the developed gases can be separated by
the other part of the signal. This analytical procedure eliminates at least 95% of the
background line. The remaining part of the background signal has to be subtracted by hand. It
is due to unknown molecules and/or residual memory effects.
The signals Jm with the background intensity subtracted have to be transformed into the
values of the yi’s. It is necessary to know the values Si,m. This step needs a calibration of the
instrument. A calibration is required every time the settings of the ion source are changed,
because the sensitivity factors depend on them. The calibration is performed by injecting in

- 29 -
the mass spectrometer the i- th gas in known concentration. If only the i-th gas and the gas
carrier are injected in the mass spectrometer, eq. (2.8) becomes:
( ) ( )( )m,0m,iim,0m SStyStJ −+= (2.12)
The signal of several mass numbers can be measured for different concentrations of the
i-th gas. A linear regression of the data gives the value of Si,m (see figure 2.6). As can be
observed from figure 2.6, eq. (2.12) correctly predicts the linear behavior of the calibration
curve.
The quantitative analysis of the developed gas can be carried out only if the temperature,
the pressure, and the gas flux in the electrochemical cell are known. If it is the case, the law of
the ideal gases gives the correlation between the number of moles per time unit of the i-th gas
and the molar fraction yi. There is a time delay between the time at which the gas is generated
and the time at which it is detected. By increasing the gas flux rate, the time delay decreases,
but contemporary the gas concentration in the flux is lower (loss of resolution). The best
compromise has to be found and depends on the experimental setup.
0 20 40 60 80 100 1200.000
0.002
0.004
0.006
0.008
0.010
J 32 /
nA
y(O2) / ppm
Figure 2.6 : Calibration curve of oxygen in argon as carrier gas for the mass number m/z = 32. The sensitivity
factor S32(O2) is equal to 4.67·10-8 nA. This value can change with the settings of the ion source.

- 30 -
2.4 Electrochemical Impedance Spectroscopy
By using the electrochemical impedance spectroscopy technique (EIS), information on
the electrochemical reactions in the system and transport of reactants/products is obtained.
This technique is applied on an electrochemical system which is in equilibrium or under
steady state conditions. EIS is based on the application of a sinusoidal voltage (or current)
signal on the electrochemical cell. The response of the cell to the sinusoidal perturbation is a
sinusoidal current (or voltage), which has the same frequency as the perturbation and is
normally shifted in phase. It is possible to transform the voltage perturbation and the current
response in the Euler representation. The ratio between the perturbation and the answer is a
frequency-dependent complex number, called impedance.
~Z3Z
4
Z2Z 1
A
3
2
4
1
ZZ
ZZ
=~Z3Z
4
Z2Z 1
A
3
2
4
1
ZZ
ZZ
=~Z3Z
4
Z2Z 1
A~~Z3Z
4
Z2Z 1
A
Z3Z4
Z2Z 1
A
3
2
4
1
ZZ
ZZ
=
Figure 2.7: Schematic representation of an impedance bridge. The balancing arm Z2 can be modified, while Z1
is the arm with unknown impedance. When the current flowing trough the amperometer A is equal to 0, the
balancing condition is reached.
The first instrument used to measure the impedance of an electrochemical cell was the
impedance bridge (or universal bridge) (see reference [86], chapter 3). The basic principle of
an impedance bridge is similar to the principle of a balance comparing unknowns with their
built- in standards. The balance is established by adjusting the balancing arm manually. Once
the balancing condition is reached, the current flowing across the bridge is equal to 0 (see
figure 2.7). In the last century, this method was used, e.g., to measure the impedance of the
electrolyte solutions. The method is very time consuming, because the balancing arm has to

- 31 -
be adjusted manually, and in practice more than 60 points are required to obtain a good
impedance spectra in a standard frequency range.
Modern instruments to measure impedance spectra are the frequency response analyzers
(FRA), commercially available since the 1970's. The oldest FRA’s were external instruments
to connect to a potentiostat, while the modern ones are directly integrated in the potentiostats.
The working principle of the FRA is normally the Fourier analysis of a periodic signal.
Electrochemical systems are typically not linear systems with respect to the potential. For this
reason, if a sinusoidal voltage perturbation is applied to the cell, the current response will be
periodic, with the same period of the perturbing signal, but not sinusoidal. By reducing the
amplitude of the voltage perturbation, it is possible to reduce the non- linearity of the system.
If the signal is reduced too much, the current response will be too noisy to be detected. Under
the conditions of a standard electrochemical experiment, a good compromise between the two
conditions is the AC voltage amplitude of 10 mV. The Fourier series decomposes a periodic
function S in a series of sinusoidal functions (see reference [86], chapter 3):
( ) ( )
( ) ( )
( ) ( ) ( )[ ]∑
∫
∫
∞
=
ω+ω=
ω=
ω=
0nnn
T
0n
T
0n
tnsinbtncosatS
dttnsintST2
b
dttncostST2
a
(2.13)
where T is the period of the function S, ω the angular frequency of the function S, and n is the
order of the harmonic. The FRA performs the Fourier analysis on the applied voltage
perturbation and on the measured current response, and it calculates the first (and/or higher)
harmonic for both signals by integrating for one or more periods. The value of the impedance
at angular frequency ω, Z(iω) is equal to:
( ) ( ) ( )
( )
( )
=ωθ
+
+=ω
ω=ω
ϕϕ
ωθ−
I,1
I,1
I,1I,1
,1,1
j
ba
tana
ba
baZ
eZjZ
(2.14)
where the index ϕ refers to the voltage perturbation, and I to the current response. The FRA
can calculate also the harmonics of higher order. Under standard conditions they are
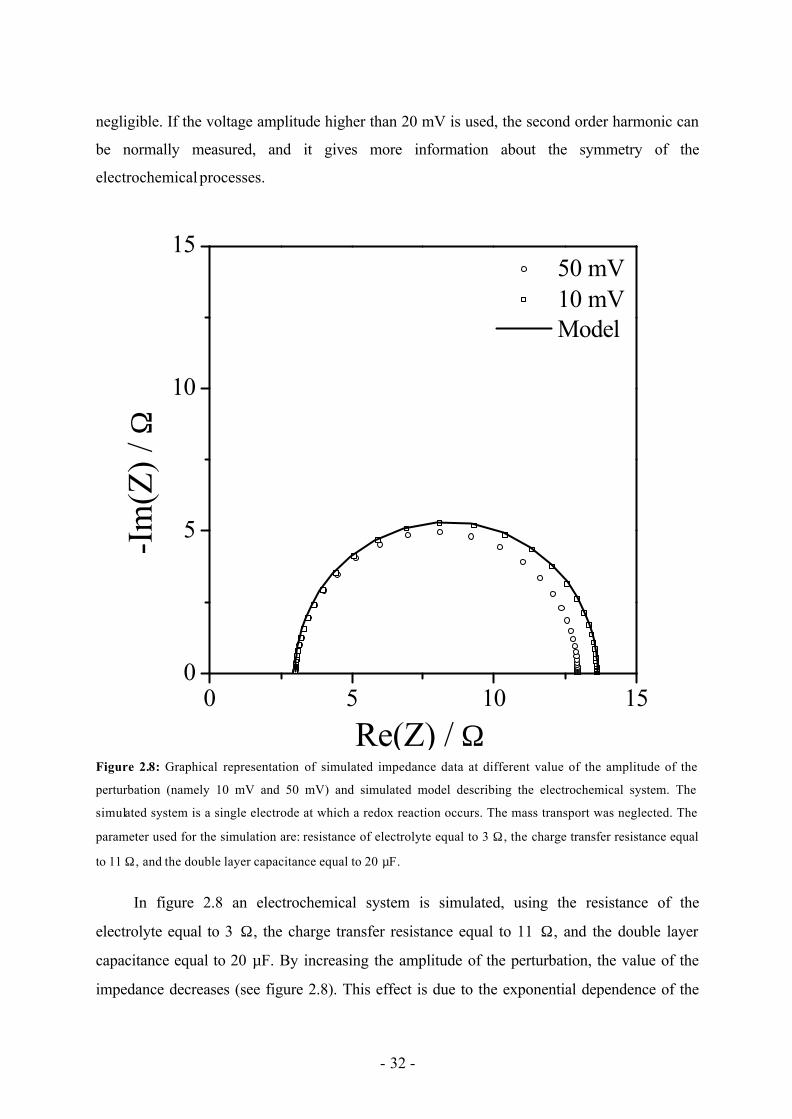
- 32 -
negligible. If the voltage amplitude higher than 20 mV is used, the second order harmonic can
be normally measured, and it gives more information about the symmetry of the
electrochemical processes.
0 5 10 150
5
10
15
-Im
(Z) /
Ω
Re(Z) / Ω
50 mV 10 mV Model
Figure 2.8: Graphical representation of simulated impedance data at different value of the amplitude of the
perturbation (namely 10 mV and 50 mV) and simulated model describing the electrochemical system. The
simulated system is a single electrode at which a redox reaction occurs. The mass transport was neglected. The
parameter used for the simulation are: resistance of electrolyte equal to 3 Ω , the charge transfer resistance equal
to 11 Ω , and the double layer capacitance equal to 20 µF.
In figure 2.8 an electrochemical system is simulated, using the resistance of the
electrolyte equal to 3 Ω, the charge transfer resistance equal to 11 Ω, and the double layer
capacitance equal to 20 µF. By increasing the amplitude of the perturbation, the value of the
impedance decreases (see figure 2.8). This effect is due to the exponential dependence of the

- 33 -
current on the potential drop and it influences only the absolute values of the impedance data;
the shape of the impedance data (phase shift) is independent from the amplitude of the
perturbation. In the first oscillation of the sinusoidal perturbation, the system is not stabilized
and the current response shows a not periodic behavior for some oscillations (generally the
first three). This is another non- linear effect, which can be eliminated by waiting some
oscillations of the voltage perturbation (delay time) before the integration of the current
response.
The value of the impedance is registered for numerous frequencies. At each frequency,
the FRA has to perform one or more oscillations of the voltage perturbation (generally at least
three plus the delay time). At high frequencies (above 1 Hz) the procedure is very fast. When
the frequency is below 10 mHz, each frequency requires more than 5 minutes, and the time
scale can shift to hours for frequencies below 1 mHz. The fast Fourier transform (FFT) was
implemented in most of the modern FRA's to shorten the time needed for the measurements at
low frequencies. The periodic voltage perturbation applied to the electrochemical system is a
sum of several sinusoidal voltage perturbations at different frequencies. The input and output
signals are then decomposed and the first harmonic of each signal is calculated. The
disadvantage of the FFT method consists in the interferences that can rise from the interaction
of a higher harmonic of a low frequency perturbation with the first harmonic of a high
frequency perturbation.
In a standard EIS experiment, the impedance of the system is registered in the frequency
range 100 kHz – 100 mHz. Above this frequency range there are normally serious distortion
problems due to the geometry of the cell and the interaction of the cables of the instrument
with the measurement (inductivity of the cables and antenna effect). To avoid distortions of
the measured impedance due to the antenna effect of the cell, it is useful to put the cell and the
cables in a Faraday cage. At very high frequencies the two electrodes behave as the plates of a
capacitor, and the electrolyte is the dielectric medium. Also the electrolyte contributes to the
distortions, because of high frequency effects (Debye-Falkenhagen effect) (see reference [83],
chapter 2). The standard frequency range explores the main features of the electrochemical
system, which have a time constant between 10-5 and 10 s. The lower is the investigated
frequency, the slower are the phenomena observed. Below the standard frequency range
secondary reactions are sometimes observed. In this frequency domain, it is very important to

- 34 -
ensure a constant temperature and pressure of the cell, and very stable conditions of the
current lines. Solid-state diffusion can require very long time to be observed, depending on
the dimension of the particles, and experiments are performed over a period of several days at
frequencies down to 10 µHz.
Using the complex representation of Euler for a sinusoidal function, the measured
impedance, Zm, can be written as:
( )( )ωϕ∆
=ωjI
jZm
mm (2.15)
where ∆ϕm is the amplitude of the perturbation and Im the complex number representing the
amplitude and shift in phase of the current response. If a two electrode configuration is used
(see figure 2.9 a), Zm is the impedance of the whole cell. Preferably a single electrode is
studied, the so called working electrode. In this case a three electrode configuration has to be
used (see figure 2.9 b). The introduction of the third electrode changes the position at which
the voltage perturbation is applied, and therefore also the meaning of the measured impedance.
The three electrode cell can be divided in five basic parts: the working electrode; the
electrolyte between the working and the reference electrode; the reference electrode; the
electrolyte between the reference and the counter electrode; the counter electrode. If the
reference electrode has an ideal behavior, the current flowing from the working electrode to
the reference electrode is 0 (see figure 2.9 b). In this case the obtained impedance value is
referred only to the impedance of the working electrode. In general, some current can flow
through the reference electrode. In this case the impedance measured will be equal to:
( )WC
WRREWEWEm I
IZZZZ ++= (2.16)
The current flowing through the reference electrode depends on the input impedance of the
potentiostat, ZPS, which measures the potential difference ∆ϕm = ∆ϕWE - ∆ϕRE. The presence
of a reference electrode introduces a distortion due to the current flowing through it and to its
polarizability. If the potentiostat has very high input impedance, the distortion is negligible.

- 35 -
Electrolyte∆ϕWE
∆ϕRE
Working Electrode
Reference Electrode
IWR
Electrolyte∆ϕWE
∆ϕCE
Working Electrode
Counter Electrode
IWC
Electrolyte∆ϕWE
∆ϕRE
Working Electrode
Reference Electrode
IWR
Electrolyte∆ϕWE
∆ϕRE
Working Electrode
Reference ElectrodeElectrolyte
∆ϕWE
∆ϕRE
Working Electrode
Reference Electrode
IWR
Electrolyte∆ϕWE
∆ϕCE
Working Electrode
Counter Electrode
IWC
Electrolyte∆ϕWE
∆ϕCE
Working Electrode
Counter Electrode
IWC
Figure 2.9: Distribution of the potential drops in an electrochemical system with three electrodes. In an ideal
case, the current IWR is 0. The observed current is IWC, and the observed potential is ∆ϕm = ∆ϕWE - ∆ϕRE. The
total voltage of the electrochemical cell is ∆ϕT = ∆ϕWE - ∆ϕCE. (Based on reference [86], chapter 3)
The current flowing through the potentiostat, IWR, and the total voltage of the cell, ∆ϕT ,
are expressed as:
( ) WRWEWCCEWETPS
mWR IZIZZ;
ZI ++=ϕ∆
ϕ∆= (2.17)
Substitution of eq. (2.17) in eq. (2.16) gives:
( ) ( )WEmPST
CEWEmREWEWEm ZZ
ZZZZZZ
ϕ∆−ϕ∆+ϕ∆
++= (2.18)
To avoid distortions due to the presence of the reference electrode, it is necessary to use some
precautions: a potentiostat with input impedance significantly higher than the impedance of
the working electrode has to be used; the impedance of the counter electrode has to be low,
and the impedance of the reference electrode has to be low. When a two electrode
configuration cell is used, eq. (2.18) is transformed in:
( )( )CEWEPS
CEWEPSm ZZZ
ZZZZ
+−+
= (2.19)
In this case, a potentiostat with input impedance significantly higher than the impedance of
the electrochemical cell is necessary to avoid distortions of the impedance data. The
prediction of the distortions was performed considering the cell one-dimensional. In a real
three-dimensional cell there are also distortions generated by the position of the reference

- 36 -
electrode. In particular, it is compulsory that the reference electrode is located externally to
the main current path, between the working and the counter electrode. Also the relative
position of working and counter electrode and the geometry of the cell can influence the
behavior of the system at high frequencies [87].
The value of the impedance is a complex number, which is dependent on the frequency
of the voltage perturbation. There are different graphical representations of a set of impedance
data. The most common representation is the Nyquist plot. The Nyquist plot shows in the x-
axis the real part of the impedance and in the y-axis the opposite of the imaginary part of the
impedance. It is important that the x-axis and y-axis have the same scale length. The shape of
the Nyquist plot is representative of the electrochemical processes at the surface of the
electrodes and in the bulk of the electrolyte. It is possible to recognize immediately the
resistance of the electrolyte, the resistance of the charge transfer, and other properties of the
system. Moreover, the kinetic parameters can be obtained from the plot in the case of simple
redox systems. The disadvantages of the Nyquist plot are related with the values of the
impedance data. Generally, the real and imaginary part of impedance can change of some
orders of magnitude in the frequency range 100 kHz – 100 mHz. An enlargement of the high
frequency region is necessary to recognize the electrochemical processes. The Bode plot
reports separately the decimal logarithm of the absolute value of the impedance and the phase
shift as function of the frequency. With this plot the values of the impedance are evident in
the whole range of frequency; the phase shift is related to the electrochemical and transport
processes, but the connection between phase shift and processes is not as obvious as in a
Nyquist plot. The Cole-Cole plot reports the complex capacitance of the system. The complex
capacitance is obtained from the impedance by the following transformation:
( ) ( )[ ] 1* jZjjC −ωω=ω (2.20)
The Cole-Cole plot is the equivalent of the Nyquist plot for the complex capacitance. It
reports the real part of the complex capacitance versus the negative imaginary part of the
complex capacitance. In this plot the adsorption/desorption processes are evidenced, while the
faradaic processes are darkened (see reference [86], chapter 1). The three plots are represented
in figure 2.10 for the electrochemical system simulated in figure 2.8.

- 37 -
0 5 10 150
5
10
15
-Im
(Z) /
Ω
Re(Z) / Ω
a) b)
c)
0.0000 0.0001 0.00020.0000
0.0001
0.0002
-Im
(C) /
Ω
Re(C) / Ω
0.1 1 10 100 1000 10000 1000001
10
100
0
20
40
60
Modulus
|Z| /
Ω
f / Hz
Phase
θ /
°
0 5 10 150
5
10
15
-Im
(Z) /
Ω
Re(Z) / Ω
a) b)
c)
0.0000 0.0001 0.00020.0000
0.0001
0.0002
-Im
(C) /
Ω
Re(C) / Ω
0.1 1 10 100 1000 10000 1000001
10
100
0
20
40
60
Modulus
|Z| /
Ω
f / Hz
Phase
θ /
°
Figure 2.10: Graphical representations of simulated impedance spectra. The parameter used for the simulation
are: resistance of electrolyte equal to 3 Ω , the charge transfer resistance equal to 11 Ω , and the double layer
capacitance equal to 20 µF. a) Nyquist plot. b) Cole -Cole plot. c) Bode plot.
The analysis of impedance data is the most challenging part of the EIS technique. The
Kramers-Kronig transformations (KK transformations) relate the imaginary part of the
impedance, ZIm, at a single frequency with the complete set of real values of impedance, ZRe,
and vice versa:
( ) ( ) ( )
( ) ( ) ( )∫
∫∞
∞
∞
ω−ωω−
π+=ω
ω−ω−
πω
=ω
022
ImImRe
022ReRe
Im
dxx
ZxxZ2RZ
dxx
ZxZ2Z
(2.21)

- 38 -
where R8 is the resistance at infinite frequency. Eqs. (2.21) are valid if the system fulfills the
conditions of stability, linearity and causality. The Kramer-Kronig analysis (KK analysis) is
based on eqs. (2.21); it individuates and eliminates the non-linear, instable and stochastic
effects from the set of measured impedance data. After this analysis, the quality of the fitting
increase notably. To perform the KK analysis, the whole set of impedance data, from 0 to
infinite frequency, should be available. To overcome the problem, a general model to describe
the impedance spectrum is used. This model describes the impedance spectra as an infinite
series of a resistance and a capacitance in parallel (see figure 2.11). Each element can be
described by a time constant, τ, and a weighting factor Gs(τ) [88]:
( ) ( )∫∞
ωτ+ττ
=ω0
s0A j1
dGRjZ (2.22)
where R0 is the resistance at 0 frequency. Gs is the spectrum of the time constant of the system.
The model described by eq. (2.22) respects the KK transformations. The data obtained by the
fitting of the measured data with eq. (2.22), ZA, are used in a fitting routine with the model
describing the electrochemical processes. The goal of deriving eq. (2.22) is to transform the
measured data in another format. Eq. (2.22) requires an infinite distribution of time constant.
From its expression, it is clear that the weighting factors of the time constant much lower or
much higher than 1/ω do not influence the final value of the impedance. It is sufficient to
create a set of time constants which range from 10/ωmin to 0.1/ωmax. For electrochemical
systems with non-faradaic processes (the time constant of the electrochemical process is very
high) the model described by eq. (2.22) needs a broader range of the time constants.
Alternatively, an infinite parallel of a resistance in series with a capacitor can be used (see
figure 2.11). This general model can be described by:
( )( )∫
∞∞
ττωτ+
ωτ=ω
0p
A
dGj1
jR
jZ (2.23)
The weighting factor Gp is the spectrum of time constant of the system. Eq. (2.23) can be used
in the same way of eq. (2.22) to obtain data free from the effect of non- linearity, instability,
and non-causality.

- 39 -
a)
b)
a)
b)
Figure 2.11: Equivalent circuits of the general models represented by eq. (2.22) (a) and by eq. (2.23) (b) [88].
The kinetic parameters of the investiga ted systems can be obtained by fitting the
impedance data, measured or after the KKT analysis, with a model. Sometimes the model can
be described by a connection in parallel and series of simple elemental circuits, such as
capacitances and resistances (equivalent circuit). This point of view helps in understanding
the physico-chemical phenomena occurring during the overall reaction. The equivalent circuit
is useful only as a visualization of the mathematical description of the model. Several models
were developed during this PhD work and they are presented in the following chapter 3. To fit
a model to a set of impedance data, it is necessary to define an object function, which has to
be minimized. A general object function, fO, for complex data can be defined as:
( )[ ] ( )[ ] ∑=
−ω+−ω=N
1i
2iIm,,miImiIm,
2iRe,,miReiRe,O ZZwZZwf (2.24)
where wRe,i and wIm,i are the weighting factors of the i-th point for the real and imaginary part
of the impedance respectively. In this PhD work two object functions were defined. The first
is in common use; it is indicated as χ2 and is equal to:
( )[ ] ( )[ ]
∑=
+
−ω+−ω
−=χ
N
1i2
iIm,,m2
iRe,,m
2iIm,,miIm
2iRe,,miRe
p
2
ZZ
ZZZZ
NN1
(2.25)

- 40 -
where N is the number of points of the set of impedance data, Np the number of parameters in
the model (see reference [86], chapter 3). The second object function was indicated as χ2mod
and defined as:
EMBED Equation.3 ( )( )[ ] ( )[ ]
∑=
−ω
+−ω
−=χ
N
1i2
iIm,,m
2iIm,,miIm
2iRe,,m
2iRe,,miRe
p
2mod Z
ZZ
Z
ZZ
NN21
(2.26)
The fitting routine was always performed with the object function χ2mod, and χ2 was used to
verify the goodness of the fitting. In general it seems that χ2 is always smaller than χ2mod. The
better is the fitting, the nearer are the two numbers.

- 41 -
3 Development of the Mathematical Models
EIS technique is a powerful tool for the study of the kinetics of electrochemical systems.
It has a high time resolution (up to 10-5 s), and it can be used for the study of the
electrochemical processes and the spatial distribution of current densities. The high time
resolution is contemporary the weak point of the EIS technique; the analysis of impedance
data requires the development of sufficiently precise mathematical models. Even if a model
can be visualized trough an equivalent circuit, it is not true that every equivalent circuit
corresponds to a physical model. The model describing the electrochemical system has to
satisfy the physico-chemical equations for the reaction rate, for the accumulation of species
(charged and neutral), and for the geometry of the system. In the following chapter the models
developed during this PhD work are presented. The models are expressed in the time domain.
The EIS experiment is simulated by starting from an equilibrium condition of the system. A
sinusoidal voltage perturbation is applied to the equilibrium condition. The impedance of the
model is obtained considering all the time-dependent physical variables to change
sinusoidally with the same frequency of the voltage perturbation. The alternate part of a
physical variable is indicated with the symbol ~, and it is treated as a differential of the
variable itself. At the end of the thesis a list of the used symbols is given.
3.1 Model of the Intercalation Process
In this paragraph the intercalation process is treated as a two step mechanism. The first
step is the adsorption of the intercalating ion; the second step is the accommodation of the
species in the structure of the electrode. The valence state of the intercalating ion in the
solution and in the structure of the electrode can be different. The real valence state of the
intercalated ion in the structure of the electrode depends on the nature of the electrode. During
the adsorption the ion can also change its valence state, depend ing if an electrochemical
adsorption or an ion sorption occurs; it could be also possible to have a distribution of
electrochemical adsorption and ion sorption. Because both adsorbing processes are inner-
sphere reactions, the average charge of the lithium in the inner Helmholtz plane depends on

- 42 -
the properties of the surface of the electrode. This detail strongly influences the polarizability
of the electrode.
The first step is assumed to be a distribution of electrochemical adsorption and ion
sorption. In the second step a distribution of the charge of the intercalated species in the solid
phase is considered. The kinetic parameters describing the system are average values. The
intercalation of lithium is explicitly considered; the model can readily be extended to other
cases. The adsorption of the lithium and the accommodation of the lithium in the structure of
the electrode are described by the following electrochemical reactions:
( ) ( ) ( ) ( )+δ−
σ+ε ←
→δ−+ 1
O,1
R,1
ik
k
1 Lie1Li (3.1)
( ) ( ) ( ) ( )+δ
σ−σ
+δ ←→δ−δ+ 2
O,2
R,21 LieLi
k
k
21i (3.2)
where ε represents the electrolyte phase, i the inner Helmholtz plane, σ the solid phase, δ1 the
average valence state of the lithium in the inner Helmholtz plane, δ2 the average valence state
of the lithium inside the solid phase (δ2 = δ1). Both ion sorption and electrochemical
adsorption are described by the reaction (3.1) (δ1 = 1, ion sorption; δ1 = 0, electrochemical
adsorption).
The rates of reaction of the two steps, r1 and r2, are treated with the kinetic theory of
standard chemical reactions; the effect of the potential drop is included in the kinetic
coefficients. It is considered that the lithium cannot move in an occupied adsorbing or
intercalating site:
( )
( ) ( ) O,20R,20i2
O,1iR,11
k1Nk1Nr
kNk1Cr
θ−β−β−θ=
θ−θ−=
σ
ε (3.3)
where Cε is the concentration of lithium ions in the solution, Ni the number of absorbing sites
available, θ the occupancy of the absorbing sites, Nσ the number of intercalation sites
available, β0 the occupancy of the intercalating sites at the interface solid/electrolyte. The
current density flow, i, at the interface solid/electrolyte is expressed by (see figure 3.1):
( ) ( )dt
dCrF1rF
dtd
CrFi iT21121
i11
ϕ∆−ϕ∆+λδ−−λδ−=
ϕ∆+λ−= (3.4)
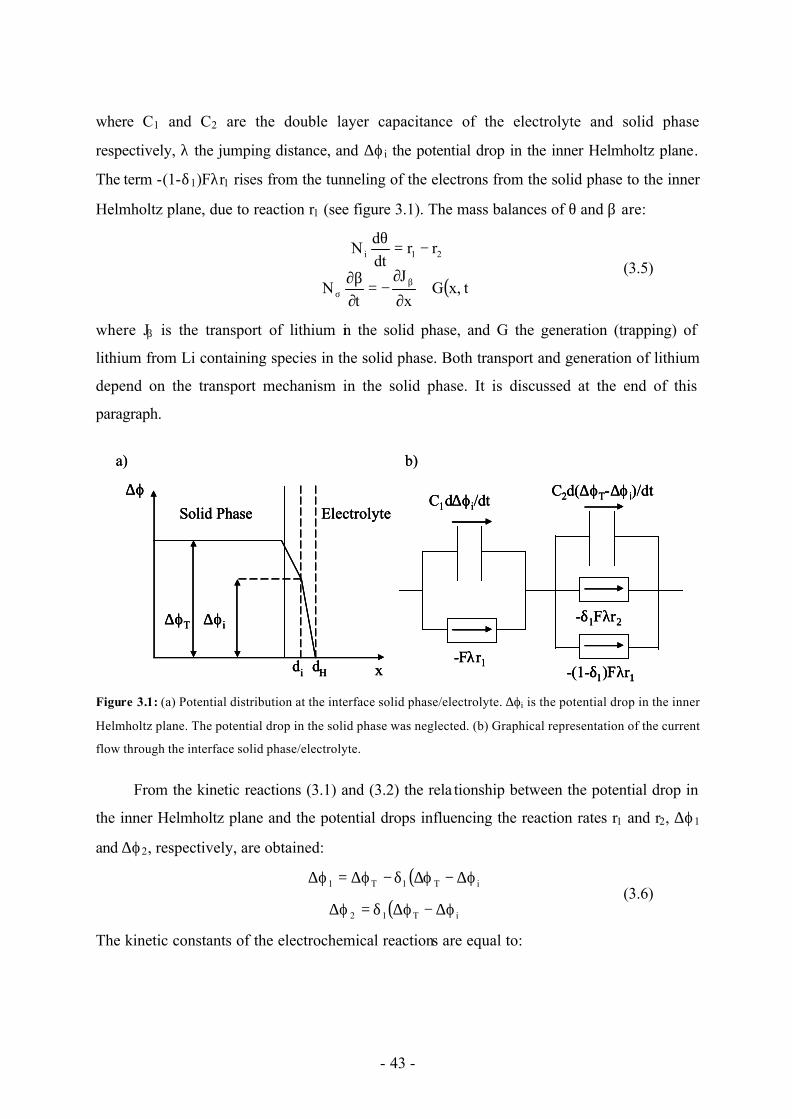
- 43 -
where C1 and C2 are the double layer capacitance of the electrolyte and solid phase
respectively, λ the jumping distance, and ∆ϕi the potential drop in the inner Helmholtz plane.
The term -(1-δ1)Fλr1 rises from the tunneling of the electrons from the solid phase to the inner
Helmholtz plane, due to reaction r1 (see figure 3.1). The mass balances of θ and β are:
( )t,xG
x
J
tN
rrdtd
N 21i
+∂
∂−=
∂β∂
−=θ
βσ
(3.5)
where Jβ is the transport of lithium in the solid phase, and G the generation (trapping) of
lithium from Li containing species in the solid phase. Both transport and generation of lithium
depend on the transport mechanism in the solid phase. It is discussed at the end of this
paragraph.
ElectrolyteSolid Phase
xdHdi
∆ϕ
∆ϕi∆ϕT
a) b)
-Fλr1-(1-δ1)Fλr1
C1d∆ϕi/dtC2d(∆ϕT-∆ϕi)/dt
-δ1Fλr2
ElectrolyteSolid Phase
xdHdi
∆ϕ
∆ϕi∆ϕT
ElectrolyteSolid Phase
xdHdi
∆ϕ
∆ϕi∆ϕT
a) b)
-Fλr1-(1-δ1)Fλr1
C1d∆ϕi/dtC2d(∆ϕT-∆ϕi)/dt
-δ1Fλr2
-Fλr1-(1-δ1)Fλr1
C1d∆ϕi/dtC2d(∆ϕT-∆ϕi)/dt
-δ1Fλr2
Figure 3.1: (a) Potential distribution at the interface solid phase/electrolyte. ∆ϕi is the potential drop in the inner
Helmholtz plane. The potential drop in the solid phase was neglected. (b) Graphical representation of the current
flow through the interface solid phase/electrolyte.
From the kinetic reactions (3.1) and (3.2) the rela tionship between the potential drop in
the inner Helmholtz plane and the potential drops influencing the reaction rates r1 and r2, ∆ϕ1
and ∆ϕ2, respectively, are obtained:
( )
( )iT12
iT1T1
ϕ∆−ϕ∆δ=ϕ∆
ϕ∆−ϕ∆δ−ϕ∆=ϕ∆ (3.6)
The kinetic constants of the electrochemical reactions are equal to:

- 44 -
ϕ∆
=
ϕ∆−=
ϕ∆
=
ϕ∆−=
RT2F
expkkRT2
Fexpkk
RT2F
expkkRT2
Fexpkk
20,O,2O,2
20,R,2R,2
10,O,1O,1
10,R,1R,1
(3.7)
The expressions for the kinetic constants (3.7) derive from the adiabatic electron transfer
theory, assuming the transfer coefficients equal to 0.5 (see reference [83], chapter 5). The last
assumption is not necessary, but simplifies the mathematical development of the model.
The influence of the occupancy of the adsorbing sites on the distribution of potential
drops at the interface solid phase/electrolyte is obtained by eqs. (3.4-3.6):
θγδ+ϕ∆γ=ϕ∆ dF
RTdd i1Ti (3.8)
with the parameters γ, and γi equal to:
21
ii
21
2
CCNF
RTF
;CC
C+λ
=γ+
=γ (3.9)
Eq. (3.8) means: if the ions adsorbed are neutral (electrochemical adsorption), the potential in
the inner Helmholtz plane is always proportional to the total potential drop; if the ions
adsorbed are charged (ion sorption), the potential in the inner Helmholtz plane depends also
on the occupancy of the adsorbing sites. In the latter case, the effect causes always the
decrease of the reaction rate. At θ = 0, ∆ϕi is proportional to ∆ϕT . The integral form of eq.
(3.8) is:
θγδ+ϕ∆γ=ϕ∆F
RTi1Ti (3.10)
Eq. (3.10) can be substituted in eq. (3.6) and the whole intercalation mechanism at the
interface solid phase/electrolyte be described by three equations (excluding the transport of
lithium in the electrolyte and in the solid phase).
In equilibrium conditions the time derivatives are equal to 0 and the current flowing
through the system is 0. The value β0 is equal to:
ϕ∆
+=β
ε
σ
RTF
expkkCkkN
1
1
T
0,R,20,R,1
0,O,20,O,10 (3.11)
Eq. (3.11) regards only the surface of the intercalating electrode; the bulk concentration and
the total amount of intercalated lithium depend on the expression of the mass balance

- 45 -
(transport and trapping term). The occupancy of the adsorbing sites depends on the potential
applied and on the mechanism of adsorption. The differential of θ with respect to the total
potential drop at the interface solid phase/electrolyte is equal to:
( ) ( )
( ) i21
11
T 1111
dd
FRT
γδθ−θ+θ−θγδ+δ−−
=ϕ∆θ
(3.12)
Eq. (3.12) is valid in equilibrium conditions. The charge accumulated in the surface of the
electrode is negligible with respect to the total one; therefore the shape of the equilibrium
curves (3.11) and (3.12) cannot be observed in intercalating compounds.
If a voltage perturbation is applied to the system, the alternate part of the reaction rates
can be expressed by their differentials. It results:
β−θ+ϕ∆
Γ−
λ=
+θ−ϕ∆
Γ−−
λ=
βθ
εεθ
0,2T2
2
,1T1
1
~k
~k~
RF1
r~
C~
k~
k~R
1F1
r~
(3.13)
where Γ is equal to δ1(1-γ). The coefficients in eqs. (3.13) are obtained by the partial
derivative of the reaction rates with respect to the considered alternate variable:
( ) ( )
( ) ( )[ ]( )
( )[ ] ( )
( )[ ] ( )[ ]( )[ ] λθ−+θ−=
λγδθ−θ+β+β−=
λθ−θβ+β−=
λθ−=
λγδθ−θ++=
λθ−θ+=
σβ
σθ
σ
ε
εθ
ε
Fk1NkNk
F11kNk1Nk
FRTF
1kNk1NR1
Fk1k
F11kNkCk
FRTF
1kNkCR1
O,2R,2i
i21O,20R,20i,2
O,20R,20i2
R,1
i21O,1iR,1,1
O,1iR,11
(3.14)
The value of θ?is obtained substituting eqs. (3.13) in the mass balance of the absorbing sites:
( )[ ] θθθθ
εεβ
+λ
=τ+ωτ+
+β+ϕ∆
Γ−−
Γ
=θ,2,1
i
,2,1
0T12
kkFN
;1jkk
C~
k~
k~R
1R~
(3.15)
The alternate current density flowing through the interface solid phase/electrolyte, ?, can be
expressed by:
( ) ( ) ( ) ( ) ( ) 0TIad
dl
~jKC
~jK~
jZ1
jZ1
Cjji~
βω+ω−ϕ∆
ω
+ω
+ω=ω βεε (3.16)

- 46 -
where Cdl is the capacity of the double layer of the interface, Zad is the impedance of the
adsorbing sites, ZI the impedance of the total intercalation process, Kε the proportion
coefficient for the transport of the lithium in the solution, and Kβ the proportion coefficient
for the transport of the lithium in the solid phase. The terms of the total current density of the
system are equal to:
( ) ( )
( ) ( )[ ]( )
ββ
εε
−
+ωτ+
+ωτΓ=
+ωτ+
+ωτΓ−=
+ωτ+=ω
ωτ
+
Γ+
Γ−=ω
+=
k1j
RRR
jK
k1j
RRR
j1K
1jRRjZj1
1RR
1jZ
CCCC
C
21
2
21
1
21I
1
2
2
1
2
ad
21
21dl
(3.17)
Neglecting the transport of the lithium in both electrolyte and solid phase, eq. (3.16) can be
visualized by an equivalent cir cuit (see figure 3.2). The equivalent circuit is composed by
three parallel branches. The first branch contains two capacitances in series (double layer
branch). The second branch contains a capacitance and a resistance in series (adsorption
branch). The third branch contains an inductance and a resistance in series (intercalation
branch). Substituting eq. (3.15) in eqs. (3.13) one obtains:
+ωτ+
+β+ωτ
++ωτ
−ϕ∆+ωτ
ωτΓ
++
−λ
=
+ωτ+
+ωτ+β
+ωτ+
−ϕ∆+ωτ
ωτΓ−
++
−λ
=
εεβ
εεβ
C~
k1j
RRR
~k
1jRR
Rj
~1j
jRRR
1
F1
r~
C~
k1j
RRR
j~
k1j
RRR
~1j
jR
1RR
1
F1
r~
21
1
021
2
T221
2
21
1
021
2
T121
1
(3.18)
The mass balance equation in the host material is very important for the expression of
the equilibrium potential as function of the oxidation state of the electrode. This influences the
shape of the charge/discharge curve of the electrode. The classical point of view of transport

- 47 -
considers only diffusion occurring in the solid phase [89-91]. The diffusion transport
mechanism can simulate a sloppy charge/discharge curve of the electrode; it describes the
transport of lithium in single-phase systems. The moving boundary model considers the
transport of lithium as a front that moves inside the host material [92,93]. It can be visualized
as a host material where only migration occurs. The host material is divided in two zones, one
rich in lithium, the other without lithium. This model can describe the two-phase systems.
a) b)
Cdl
Cad
LI
Rad
RI
( )
( )
( )( )τ+=
+=
τ
Γ+
Γ−=
Γ+
Γ−=
+=
−
21I
21I
2
2
1
2
ad
1
2
2
1
2
ad
21
21dl
RRL
RRRRR
1C
RR1
R
CCCC
C
a) b)
Cdl
Cad
LI
Rad
RI
Cdl
Cad
LI
Rad
RI
( )
( )
( )( )τ+=
+=
τ
Γ+
Γ−=
Γ+
Γ−=
+=
−
21I
21I
2
2
1
2
ad
1
2
2
1
2
ad
21
21dl
RRL
RRRRR
1C
RR1
R
CCCC
C
Figure 3.2: (a) The equivalent circuit of the intercalation model. The limitations due to the transport of the
lithium in the electrolyte and solid phase were neglected. (b) The correlation between the electric elements in the
equivalent circuit and the parameters of the kinetic model.
In both diffusion and moving boundary models the term G(x,t) in eq. (3.5) is neglected.
G(x,t) could eventually represent the trapping of the lithium in the structure of the host
material. When trapped, the lithium is not available for the diffusion or for the migration.
G(x,t) influences the charge/discharge curve of the electrode. In this PhD work, the classical
point of view on the transport of lithium in the structure of the solid phase was used; only the
diffusion of the lithium through the host material was considered (3.5).
Some comments on C1 and C2 are necessary. C1 represents the process of
charge/discharge of the double layer on the side of the electrolyte. C1 is equal to the series of
the capacitance of the compact double layer (before the inner Helmholtz plane) and the
capacitance of the diffuse double layer in the outer Helmholtz layer. C2 represents the process
of charge/discharge of the double layer on the side of the solid electrode. It is equal to the

- 48 -
series of the capacitance of the compact double layer (after the inner Helmholtz plane) and the
capacitance of the solid phase.
3.2 Models of the Porous Electrode
The model describing the intercalation process, presented in the previous paragraph, can
be applied as it is only for a flat surface of a solid electrode. The electrodes used in lithium-
ion batteries are composed by many particles, bounded with a polymeric binder. The electrode
is porous, the current is generated in different positions along the pores and a model
correlating the current density and the position in the porous electrode is needed. In the
literature two classes of models are present: two-phase models and single-phase models.
In 1948 the first model for porous electrode appears. It was developed in 1948 by V. S.
Daniel-Bekh [94]. This is a two-phase model; the liquid electrolyte and the solid electrode are
treated as separated phases. The pores have a well defined geometrical shape: cylindrical or
conical. Daniel-Bekh neglected the effect of the transport of reactants and products. In 1960 J.
Euler and W. Nonnenmacher [95] described the porous electrode as a single phase. The
single-phase model considers the current to be generated in the volume of the porous
electrode. The electrode is treated as being a homogeneous phase of the liquid electrolyte and
solid electrode. Euler and Nonnenmacher simulated the current density distribution along the
porous electrode, by neglecting diffusion of the reactants and products and assuming the
current density along the pore to be directly proportional to the overpotential (small
overpotential).
In 1962 J. Newman and C. W. Tobias [96], starting from the model described by Euler
and Nonnenmacher [95], introduced the effect of diffusion and the dependence of the
polarization resistance on the current density distribution. The transmission line model (TLM),
developed by de Levie [97-99] in 1963-1965, is based on the two-phase model of Daniel-
Bekh. Diffusion of reactants and products was considered to occur only along the radius of
the pore. It is a good approximation when the consumption (generation) rate of reactants
(products) is small with respect to the concentration of them in solution.
Starting from the TLM, many works were developed considering different pore shape
and pore size distribution [100-103]. De Levie argued that crosslinked pores can be described

- 49 -
with a single characteristic dimension [99]. It appears that pore size distribution is not an
important parameter in porous electrodes composed by bounded particles. Meyers et al. [91]
used the single-phase model to describe a porous electrode composed by intercalating
particles. The diffusion paths in the solid phase were considered spherical.
In this chapter a simplified generalized model of porous electrodes based on the TLM of
de Levie [97] is presented. The porous electrode is considered immersed in an electrolyte
solution containing a single monovalent binary salt, which cations participate in an
electrochemical reaction. In figure 3.3 a schematic drawing of the porous electrode is shown.
The zero of the x-axis is put in the boundary between the porous electrode and the current
collector. The porous electrode has a thickness L and the current collector is assumed to be
inert in the electrolyte solution. The pores of the electrode can have different size and shape,
both changing along the x-axis. It is postulated that the centers of mass of each section of the
pore are aligned along the x-axis. Focusing attention to a single current tube (a bundle of
electronic and ionic current lines) passing through the electrode, everywhere the current tube
is near the solid phase/electrolyte interface, a part of the electronic current is converted into
ionic current through the electrochemical process (see figure 3.3).
a) b)
Current Collector
Current Tube
ElectrolytePorous Electrode
x0 L
0 L x
Current Tube
a) b)
Current Collector
Current Tube
ElectrolytePorous Electrode
x0 L
Current Collector
Current Tube
ElectrolytePorous Electrode
x0 L
0 L x
Current Tube
0 L x
Current Tube
Figure 3.3: (a) Schematic drawing of a porous electrode. (b) Schematic drawing of a current tube.
At x = 0 the ionic current is zero and at x = L the electronic current is zero (i.e., all the
electronic current lines are converted into ionic current lines). There is a free path ak between
k-th and (k+1)-th reaction site (see figure 3.4). It is a statistical parameter and represents the
free path that an electron (solid phase) and an ion (electrolyte) can move before coming
sufficiently close to the solid phase/electrolyte interface where they could be involved in the
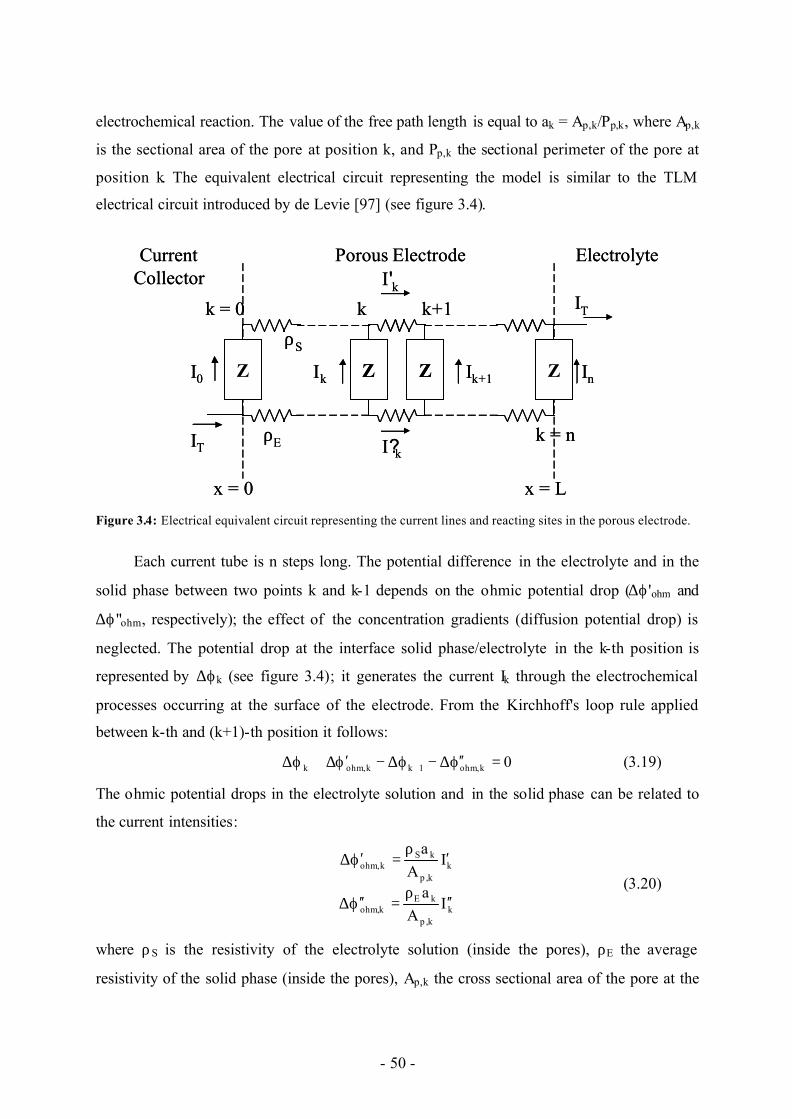
- 50 -
electrochemical reaction. The value of the free path length is equal to ak = Ap,k/Pp,k, where Ap,k
is the sectional area of the pore at position k, and Pp,k the sectional perimeter of the pore at
position k. The equivalent electrical circuit representing the model is similar to the TLM
electrical circuit introduced by de Levie [97] (see figure 3.4).
ρS
ρE k = n
kk = 0 k+1
InIkI0
I'k
I?kIT
IT
ElectrolytePorous ElectrodeCurrent Collector
Z ZZ
x = 0 x = L
Ik+1 Z
ρS
ρE k = n
kk = 0 k+1
InIkI0
I'k
I?kIT
IT
ElectrolytePorous ElectrodeCurrent Collector
Z ZZ
x = 0 x = L
Ik+1 Z
Figure 3.4: Electrical equivalent circuit representing the current lines and reacting sites in the porous electrode.
Each current tube is n steps long. The potential difference in the electrolyte and in the
solid phase between two points k and k-1 depends on the ohmic potential drop (∆ϕ'ohm and
∆ϕ"ohm, respectively); the effect of the concentration gradients (diffusion potential drop) is
neglected. The potential drop at the interface solid phase/electrolyte in the k-th position is
represented by ∆ϕk (see figure 3.4); it generates the current Ik through the electrochemical
processes occurring at the surface of the electrode. From the Kirchhoff's loop rule applied
between k-th and (k+1)-th position it follows:
0k,ohm1kk,ohmk =ϕ′′∆−ϕ∆−ϕ′∆+ϕ∆ + (3.19)
The ohmic potential drops in the electrolyte solution and in the solid phase can be related to
the current intensities:
k
k,p
kEk,ohm
kk,p
kSk,ohm
IA
a
IA
a
′′ρ
=ϕ ′′∆
′ρ
=ϕ′∆ (3.20)
where ρS is the resistivity of the electrolyte solution (inside the pores), ρE the average
resistivity of the solid phase (inside the pores), Ap,k the cross sectional area of the pore at the

- 51 -
position k, and I'k and I"k the ionic and electronic current intensities, respectively, at the k-th
position (see figure 3.4). The ionic current intensity at position k is equal to the sum of the Ik's
from 0 to k. The electronic current intensity at position k is equal to the sum of the Ik's from k
to L. Passing from the finite elements to the infinitesimal ones, i.e., for n→∞, and using the
expressions (3.20), the Kirchhoff's loop rule (3.19) becomes:
( )( )( ) ( ) T
p
Ex
0p
ES IxA
xdxaxI
xAxρ
−′′′ρ+ρ
=∂
ϕ∆∂∫ (3.21)
where IT is the total current intensity flowing through the porous electrode. Eq. (3.21) can be
differentiated again. Assuming ρS and ρE are independent of x, the result is:
( )
Iax
Ax
ESp
ρ+ρ=
∂ϕ∆∂
∂∂ (3.22)
For a numerical solution of eq. (3.22), it is better to use dimensionless coordinate. Calling X
the normalized position along the pore axes, x/L, eq. (3.22) can be rewritten as:
( )
ILaX
AX
2ESp
ρ+ρ=
∂ϕ∆∂
∂∂ (3.23)
Eq. (3.22) describes porous systems and is independent of the type of experiment and
reactions occurring at the surface of the electrode.
Eq. (3.23) needs two boundary conditions. The first one comes from eq. (3.21)
calculated at x = 0 and x = L. The second one is obtained from the total potential drop in the
porous electrode, ∆ϕP, which is sum of the potential drop in the solid phase, in the interface
solid phase/electrolyte, and in the electrolyte:
( )∫ ′′
ρ+ρρρ
+=
+ϕ∆ρ+ρ
ρ+ϕ∆
ρ+ρρ
=ϕ∆
∂ϕ∆∂
ρ−=∂
ϕ∆∂ρ
1
0 pES
ESSU
TU1ES
S0
ES
EP
11,pE
00,pS
XAXd
RR
IR
XA
XA
(3.24)
where RS is the bulk electrolyte resistance, outside the pores. It is possible to add another
relationship between the potential and the total current intensity:
( )
∂
ϕ∆∂−
∂ϕ∆∂
ρ+ρ=
00,p
11,p
EST X
AX
AL
1I (3.25)

- 52 -
The response of the porous electrochemical system depends strictly on the values of the
resistivities of solution and material. If the resistivities in the electrolyte and in the solid phase
are both very small, or the current is always very small, than at each point ∆ϕ is constant and
equal to ∆ϕP. In this case the current density distribution is constant.
The description of the porous electrode given by eq. (3.23) reproduces the behaviour of
the porous electrode only if the electrolyte inside one current tube is phys ically separated by
the electrolyte inside another current tube. In a more realistic picture of the porous electrode,
the pore structure can be assumed as composed by main pores, perpendicular to the current
collector, with lateral branches (closed pores) and networks (interconnections between main
pores), where the electrochemical processes occur as in the main pores (see figure 3.5).
Current Collector Porous Electrode Electrolyte
0
Z Z Z
ZZ
Z
Z Z ZI
I'
I?
Im
I'mI?m
IT
X = 0 X = 1
Z Z Z
ZZ
Z
Z Z Z
Z Z Z Z Z Z
IK
I'K
I?K
I'mI?m
a)
b)
Symmetry Plane
BTLM
NTLM
Current Collector Porous Electrode Electrolyte
0
Z Z Z
ZZ
Z
Z Z ZI
I'
I?
Im
I'mI?m
IT
X = 0 X = 1
Z Z Z
ZZ
Z
Z Z Z
Z Z Z Z Z Z
IK
I'K
I?K
I'mI?m
a)
b)
Symmetry Plane
Current Collector Porous Electrode Electrolyte
0
ZZ ZZ ZZ
ZZZZ
ZZ
ZZ ZZ ZZI
I'
I?
Im
I'mI?m
IT
X = 0 X = 1
ZZ ZZ ZZ
ZZZZ
ZZ
ZZ ZZ ZZ
ZZ ZZ ZZ ZZ ZZ ZZ
IK
I'K
I?K
I'mI?m
a)
b)
Symmetry Plane
BTLM
NTLM
Figure 3.5: Electrical equivalent circuit representing the current lines and reacting sites in the porous electrode
described by the BTLM (a) and NTLM (b).
These advanced models describing the structure of the pores were called branched
transmission line model (BTLM) and network transmission line model (NTLM).The presence
of the lateral pores (branches and interconnections) generates a lateral current density
distribution, which influences the main current density distribution (in the main pores). The
effect of the lateral current density distribution on the main current density distribution

- 53 -
depends on the ratio between the reacting area located inside the lateral pore and the reacting
area located in the main pores, and on the resistance of the solution inside the lateral pores
(see figure 3.5).
The values of the physico-chemical quantities in the lateral pores (branches and
interconnections) are indicated with the index m. The BTLM and NTLM are presented
together; they have many common features. The distance between two lateral pores is equal to
b. If the current flowing from/to the lateral pores can be treated using infinitesimal elements
(the number of the lateral pores is high), eq. (3.23) for the K-th main pore has to be replaced
by:
( ) ( )∑ ′′ρ+′ρ+
ρ+ρ=
∂ϕ∆∂
∂∂
mK,m,TEK,m,TS
m
2K
2
K
ESKK,p II
b1
LILaX
AX
(3.26)
where the ionic and electronic currents flowing from/to the lateral pores, Ι'T,m,K and Ι"T,m,K
respectively, have same values if the lateral pore is a branch, and different values if the lateral
pore is an interconnection. The BTLM and NTLM give a three-dimensional description of the
porous electrode.
The lateral pores are described by a differential equation similar to eq. (3.23). The 0 of
the y-axis is chosen in the point where the lateral pore and the main pore meet. The
normalized axis of the branch will be called Y-axis. Lm was assumed to be the length of the
branch or half of the length of an interconnection. The following differential equation
describes the lateral pore:
( )
mm
2mESm
m,p Ia
LY
AY
ρ+ρ=
∂ϕ∆∂
∂∂
(3.27)
The boundary conditions of eq. (3.27) depend on the model used:
( )
( ) ( )x;x)NTLM(
x;0Y
)BTLM(
K0YmK2Ym
K0Ym1Y
m
ϕ∆=ϕ∆ϕ∆=ϕ∆
ϕ∆=ϕ∆=∂
ϕ∆∂
=′=
==
(3.28)
where the index K' refers to the other main pore meeting the interconnection. Applying the
Kirchhoff's loop rule to the whole lateral pore, the following relationship is obtained:
( )K,m,TEK,m,TS0Y
m
m
0Ym,pII
YL
A′′ρ+′ρ−=
∂ϕ∆∂
=
= (3.29)
Substituting in eq. (3.26) one obtains:

- 54 -
( )( )
∂ϕ∆∂
ρ+ρ−ρ+ρ=
∂ϕ∆∂
∂∂ ∑
=
=
m 0Y
m
mmES
0Ym,p
K
K2ES
KK,p YLb
A
aI
LX
AX
(3.30)
The solution of eq. (3.30) depends on the nature of the lateral pores. It is possible to mix
together also different types of pore structures, because this general form is independent from
the exact structure of the porous electrode. Each lateral pore has to be solved apart for the
calculation of the total response of the porous electrode.
An easy solution of eq. (3.30), which was considered by de Levie [99], is obtained when
there is no generation of current inside interconnections and the electric and ionic resistances
inside the lateral pores are negligible (small reacting surface area in the lateral pores). In this
case the porous structure can be defined by a single equation:
( ) ia
AL
XA
X K
K,p2ESK,p ρ+ρ=
∂ϕ∆∂
∂∂
(3.31)
Summing for all the pores and dividing for their number N, the final result is
( ) ia
A
N1
LX
AN1
X
N
1K K
K,p2ES
N
1KK,p
ρ+ρ=
∂
ϕ∆∂
∂∂ ∑∑
==
(3.32)
which can be transformed into eq. (3.23). Random electrodes (as the electrodes composed by
different particles connected by a binder), for which a distribution of pore dimension is
expected, can be generally described by a single aK. The effect of the pore size distribution
[103] is not reasonable in electrodes where the reacting area in the lateral pores is small
compared to the reacting area in the main pores.
If the surface of the lateral pores is high with respect to the surface of the main pores, eq.
(3.32) cannot describe the porous electrode accurately. It is necessary to use another
simplification. In a random electrode, it can be assumed reasonably that aK(x), am(x,y) and
bm(x) are independent from K, m, and y. Under these conditions, eq. (3.30) is simplified:
( ) ( )
∂
ϕ∆∂ρ+ρ
−ρ+ρ=
∂ϕ∆∂
∂∂ ∑
=m 0Y
m
mES
m,p2ESp YbL
A
aI
LX
AX
(3.33)
Eq. (3.33) is independent from the nature of the lateral pore. Moreover, to solve the
differential equation describing the lateral pores, eq. (3.27), the boundary conditions (3.28)
given by the BTLM can be used. This is due to the symmetry plane passing through the

- 55 -
middle of the lateral pore (see figure 3.5). The boundary conditions (3.24) can be used to
solve eq. (3.33).
When the porous electrode is in equilibrium conditions, the potential drop at the
interface solid phase/electrolyte is constant along the X-axis of the main pores and Y-axis of
the lateral pores. Moreover, the concentration profile of the reactants and products is also
constant. Starting from this condition, if a sinusoidal voltage perturbation is applied to the
porous electrode, the total current response depends on the alternate current density
distribution. The differential equation (3.23) is written as:
( ) ( )ω
ρ+ρ=
∂ϕ∆∂
∂∂
jI~
LaX
~A
X2ES
p (3.34)
It was considered here that the porous electrode could be approximated by the TLM model
(see figure 3.4). Neglecting the limitations due to the transport of reactants and products, eq.
(3.16) can be substituted in eq. (3.34):
( )( )
( ) ( ) ( )ω+
ω+ω=
ω
ϕ∆ωρ+ρ
=
∂ϕ∆∂
∂∂
jZ1
jZ1
CjjZ1
~LAjaZX
~A
X
Iaddl
2p
ESp
(3.35)
Z is the impedance of the single reacting site. Z is independent from the position X, because
the porous electrode is in equilibrium conditions. In a random electrode, Ap and a are
averagely independent from the position x; eq. (3.35) can be written as:
( )
( ) ϕ∆ωρ+ρ
=∂
ϕ∆∂ ~LjaZX
~2ES
2
2
(3.36)
The impedance of the porous electrode, ZP = ∆ϕP/IT , results equal to:
( ) ( )
( )( )
aZL
;2
;
Rsinh
coshNA
LjZ
2ES2
2E
2S
ES
ES
2E
2S
Up
P
ρ+ρ=κ
ρ+ρρρ
=αρ+ρρ+ρ
=ρ
+
κκα+κρ
=ω (3.37)
The dependence of the impedance of the porous electrode on the impedance of the single
reacting site is included in the expression of κ. When the value of κ is high (high current
flow), the impedance of the porous electrode is proportional to the square root of the
impedance of the single reacting site. When the value of κ is small (low current flow), the

- 56 -
impedance of the porous electrode is directly proportional to the impedance of the single
reacting site.
If the NTLM is used instead of the TLM, a very similar result is obtained. Eq. (3.37)
can be used as it is if the expression of κ is replaced by:
( ) ( )
( ) 2m
ES2
mm2ES2
LaZ
tanhabLa
1LaZ
ρ+ρ=κ′
κ′κ′
+ρ+ρ
=κ (3.38)
In the intercalation porous electrode, the limitations rising from the transport of the reactants
and products through the pore and through the solid phase are not negligible, eqs. (3.37, 3.38)
cannot be used as they are. The differential equation (3.34) has to be implemented with two
mass balances, one for the lithium ions in the electrolyte, the other one for the lithium in the
solid phase.
3.3 Models of the Transport in Pores
The transport of species along the pores of a porous electrode was firstly treated by J.
Newman and C. W. Tobias [96] in 1962. By using a one-phase model based on the model of
Euler and Nonnenmacher [95], the authors introduced the effect of diffusion by assuming the
reactants (products) to be consumed (produced) as in a bulk reaction. An average
concentration of the reactants and products was used to describe the reaction at the interface
solid phase/electrolyte. This assumption is intrinsic to the single-phase model. The model is
described by a system of two coupled differential equations. In 1966 G. Darby [104,105]
treated the diffusion of oxygen in a porous electrode, used as cathode for fuel cell. Again, the
porous electrode model was based on the one-phase model. In his calculation of DC current
and impedance spectra response, Darby neglected the effects due to the resistance of the
electrolyte and of the solid phase. The TLM, formulated by de Levie [97-99] in 1963, and
based on the two-phase model of Daniel-Bekh [94], considered diffusion of reactants and
products occurring only along the radius of the pore. By using this assumption the mass
balance equation is solved separately; the electrode is described by a one-dimensional
differential equation.

- 57 -
The solution to the transport problem given by de Levie [97-99] is a good
approximation at short time (high frequency range), when the pores are not yet completely
depleted from reactants (filled with products) and transport along the x-axes of the pore gives
a negligible contribution to the total transport. On the other hand, for longer time this
assumption has no more sense and the Newman-Tobias [96] assumption can be used to
simulate the data. During this PhD work a model for the transport in pores was developed to
unify the advantages of the models of de Levie and Newman-Tobias. The model presented in
this paragraph, called the average concentration model (ACM), proposes a recursive
integration of the approximated solution of the mass balance equation.
When the two-phase model for the description of the porous electrode is used, the real
mass balance equation in the pores has to be three-dimensional. Normalized cylindrical
coordinates are used to describe the transport in the pores: the normalized x coordinate, X, is
equal to x/L; the normalized rp coordinate, R, is equal to rp/2a. The time constant of the
diffusion process is defined as τD,i = L2/Di, where Di is the diffusion coefficient of the species
i. It is assumed that the pores have a cylindrical shape, the mass balance equation can be
written in normalized cylindrical coordinates as:
∂∂
∂∂
+
∂∂
=∂
∂τ
RC
RRR
1a2
LXC
tC i
2
2i
2i
i,D (3.39)
where Ci is the concentration of species i. The boundary conditions of equation (3.39) are:
( )
X,t0R0RC
X,t1Rt,XraL
a221
RC
R,t1XCC
R,t0X0XC
R,X0tCC
i
i,D2
i
i,Si
i
i,Si
∀==∂∂
∀=τ
±=
∂∂
∀δ+==
∀==∂∂
∀==
(3.40)
where r is the rate of reaction of the electrochemical process occurring at the surface of the
pore and involving species i, δ is the thickness of the Nernst layer normalized by the length of
the pore, and CS,i the concentration of species i in the bulk of the electrolyte. In the fourth
boundary condition (3.40), + has to be used if species i is a reactant, - if it is a product. The
average value of Ci in the cross section, Cav,i, is defined as:

- 58 -
( ) ( )∫=1
0ii,av dRt,X,RRC2t,XC (3.41)
Averaging the mass balance equation (3.39) along the radius, and using the definition of Cav,i
and boundary conditions (3.40), one obtains:
raX
C
t
C i,D2
i,av2
i,avi,D
τ
∂
∂=
∂
∂τ m (3.42)
Eq. (3.42) has the same form of the differential equation developed by Newman and Tobias in
1962 [96]. The simplification used by Newman and Tobias, which is implicit in single-phase
model, considers the reaction rate dependent on the average concentration in the cross section
instead of dependent on the concentration at the wall of the pore. This happens because in the
single-phase model, the solid and liquid phases are considered not separated, as the radius of
the pores were 0. The more realistic two-phase model should be solved by using eq. (3.39),
which is possible only by numerical approximation. To avoid numerical integration along two
coordinates, eq. (3.42) is used, by defining a coefficient Ξi(X,t):
( ) i,wii,av Ct,XC Ξ= (3.43)
where Cw,i is the concentration of species i at the wall of the pore. r(X,t) can be written as a
function of Cav,i instead of Cw,i. The mass balance equation is reduced to a one-dimensional
differential equation.
The coefficient Ξi(X,t) has to be calculated. The real solution of equation (3.39) is
defined as:
( ) w,iii Ct,X,RC ξ= (3.44)
where ξ i is a coefficient depending on position and time. Substituting the solution (3.44) in
the definition of the average concentration in the cross section, one obtains
( ) ( )∫ ξ=Ξ1
0ii dRt,X,RR2t,X (3.45)
The real coefficient Ξi is equal to the average of the coefficient ξ i in the cross section. The
calculation of Ξi needs the evaluation of the coefficient ξ i; the mass balance equation has to be
solved. In the following part, two approximations of the mass balance equation to calculate ξ i
are presented with the name ACM-I and ACM-II, respectively.

- 59 -
(ACM-I) In pores with L >> rp (it is the most common situation in porous electrodes), it
can be argued that the radial transport and the axial transport occur in two different times, in
particular the former is faster. Because the ξ i coefficient represents the changing of the
concentration along the radius, in its calculation, the axial transport is neglected. Using the
definition (3.44) for ξ i, eq. (3.40) is simplified as
∂ξ′∂
∂∂
=
∂∂
ξ′τ+
Ξ′ξ′
∂∂
Ξ′τR
RRR
1a2
LtCln
ti
2i,av
ii,Di
iii,D (3.46)
where ξ 'i and Ξ'i are the approximated values of ξ i and ΞI, respectively. Assuming the first
term in the left hand side negligible with respect to the second one, eq. (3.46) is solved
analytically:
( ) ( )( )
( )
( )2
i,Dav,i2
i
0
1i
La2
t
Clnt,Xk
1,X
kIkI
k2
t,X
τ
∂
∂=
=∞Ξ′
=Ξ′
(3.47)
where In indicates the modified Bessel function of order n. The axial transport did not
disappear; it is included in equation (3.42). The error implicit in Ξ'i depends on the
correctness of the approximations made. In particular, in the time domain where the radial
transport is important, the axial transport has to be negligible, that means, in the time domain
where ξ i is strongly dependent on the time, the second term in the right hand side of eq. (3.42)
has to be larger than the first one. As explained before, this happens if L >> rp.
(ACM-II) Eq. (3.47) implicitly imposes that, when t ? 8, ξ 'i ? 1; in steady state conditions
the ACM-I model predicts a constant concentration of the species i along R. The real mass
balance equation in steady state conditions predicts changes of the concentration of the
species i along R if the reaction involving the species i occurs. To obtain a better
approximation with respect to the solution of ACM-I, the average transport in the axial
direction is added to eq. (3.46). Using the same simplifications as in the ACM-I, one obtains:
( ) ( ) ( )[ ]( )
( )i,w
i,D2
i
12
10
i,w
i,D2
i
Cr
aLa2
81
1,X
kIk2kI2kkI
Cr
aLa2
1t,X
τ
=∞Ξ′
−τ
=Ξ′
m
m
(3.48)

- 60 -
The solutions (3.47, 3.48) have not to be treated as mass balances. The meaning of solutions
(3.47, 3.48) is to approximate the concentration profile shape along the R axis and the X axis
of the pore (see figure 3.6).
R10
Ci/Cw,i
1NTM
ACM-IIACM-I
a)
b) Cav,i/Cw,i
0 X1
NTM
ACM-IIACM-I
R10
Ci/Cw,i
1NTM
ACM-IIACM-I
R10
Ci/Cw,i
1NTM
ACM-IIACM-INTMNTM
ACM-IIACM-I
a)
b) Cav,i/Cw,i
0 X1
NTM
ACM-IIACM-I
Cav,i/Cw,i
0 X1
NTM
ACM-IIACM-INTMNTM
ACM-IIACM-I
Figure 3.6: Concentration profile along the R axis (a) and X axis (b) as predicted by the Newman-Tobias model
(NTM), ACM-I, and ACM -II models (the species i is a reactant).
Under alternate voltage perturbation, ξ 'i results to be a constant in time, depending on jω.
The value of Ξ'i in the two previously introduced ACM models can be obtained by
substituting the value of k2 in solutions (3.47, 3.48) with:
2
i,D2
La2
jk
ωτ= (3.49)
When ω ? 0, Ξ'i of the ACM-I tends to 1. The ACM-I gives the same result of the Newman-
Tobias model in the low frequency domain. It can also be demonstrated that, at high
frequency, by neglecting the axial transport in eq. (3.42), the same result as de Levie is
obtained. These observations imply that the ACM-I can unify the advantages of the previous
cited models. In the high frequency domain, it follows only the radial transport, but when the
frequency becomes sufficiently small, the axial transport is also introduced.
The transport of lithium in the solid phase is generally treated as a spherical diffusion
[90,91]. This can be used only if the particle is spherical, and the potential drop at the

- 61 -
interface solid phase/electrode is the same in the whole surface of the intercalation particle.
This is sufficiently true if the particles are small compared to the thickness of the porous
electrode. If it is not the case, the mass balance of the lithium in the solid phase can be
calculated by using eq. (3.42) with modified boundary conditions along the X-axis. If the
transport through the X-axis can be neglected, eq. (3.42) gives the same result of a circular
diffusion transport. In this PhD work the circular diffusion transport was considered a better
approximation of the real transport in the solid phase and used instead of the spherical
diffusion transport.
3.4 Mathematical Simulations
The impedance of the intercalation porous electrode in a lithium-ion battery can be
calculated solving the following system of differential equations:
( ) ( )
2,D
av,D
1,D
,av,D2,av
2
2ES2
2
r~a
~jN
r~a
C~
jX
C~
ji~
LaX
~
βσβ
εεε
ε
τ=βωτ
τ+ωτ=
∂
∂
ωρ+ρ
=∂
ϕ∆∂
(3.50)
The expression of ?, U?1 and U?2 are obtained by eqs. (3.16, 3.18, 3.43). The system is written
considering the following models: the intercalation is a two-step process, described by the
electrochemical reactions (3.1, 3.2); the porous electrode is described by one parameter, a; the
mass balance of the lithium ions in the electrolyte considers only diffusion transport of Li+;
the mass balance of the lithium in the solid phase considers only circular diffusion transport.
The system (3.50) can be rewritten in the following form:
εε
ε
+ϕ∆=∂
∂
+ϕ∆=∂
ϕ∆∂
,av2,av
2
,av2
2
C~
D~CX
C~
C~
B~AX
~
(3.51)
where A, B, C, D are constant along X and depend on the angular frequency, ω. The system
(3.51) can be transformed in a fourth order linear differential equation with respect to ∆ϕ?:
( ) ( ) 0~BCADX
~DA
X
~2
2
4
4
=ϕ∆−+∂
ϕ∆∂+−
∂ϕ∆∂
(3.52)
The general solution of the differential equation (3.52) is equal to:

- 62 -
( ) ( ) ( ) ( )( ) ( ) ( )BCAD
4DA
2DA
K
XKcoshIXKsinhIXKcoshIXKsinhI~
2
2,1
24231211
−−+
±+
=
+++=ϕ∆
(3.53)
The integration constants I1, I2, I3, and I4 are obtained from the boundary conditions.
Assuming that ρS >> ρE, the impedance of the intercalation porous electrode can be written
as:
( ) U
S
pP R
XL
AjZ +
∂∆∂
∆=
1
1,
1~
~
ϕρ
ϕω (3.54)
An analytical solution of the intercalation electrode is obtained and can be used for the
mathematical simulations and for a fitting routine (see paragraph 2.4).
The mathematical simulations of the impedance spectra of an intercalation porous
electrode are used to explain some effects observed in real systems. The values of the
parameters are chosen in agreement to a realistic system: Dε = 2·10-6 cm2 s-1; Dβ = 2·10-9
cm2 s-1; L = 2·10-2 cm; a = 1·10-4 cm; τ = 10-3; RP = 2.5 Ω; RU = 1 Ω; Cdl = 1·10-6 F cm-2; R1 =
10 Ω cm2; Γ = 0.5.
In figure 3.7 the Nyquist plots of the simulated impedance spectra are reported, for
different values of the resistance of the intercalation process, R2. The simulations are
performed in the frequency range 100 kHz – 0.1 Hz. When the resistance of the intercalation
process tends to infinite, the only reaction occurring at the interface solid state/ electrolyte is
the adsorption of the ion. A distorted semicircle is observed, followed by a pure capacitative
behavior of the system. The distortion of the semicircle is due to the resistance of the pores; it
is the transport of charge in the pores, both electronic and ionic. The impedance spectra
simulated for R2 ? 8 has a second semicircle in the intermediate frequency range; this
second process is not an electrochemical reaction, but it is due to the transport of the adsorbed
species along the pores. When the intercalation process becomes possible (R2 has a finite
value), the shape and the modulus of the impedance spectra change. The impedance spectra
can change considerably, depending on the value of the parameters. For R2 > R1 the high
frequency semicircle remains quite the same in intensity and shape. The low frequency part of
the impedance spectra changes, because of the intercalation process. By decreasing the value

- 63 -
of R2, the semicircle in the high frequency region becomes smaller. When R2 < R1 a second
semicircle is observed, due to the intercalation process itself.
0 50 100 150 2000
50
100
150
200
1.0 1.5 2.00.0
0.5
1.0
R2 infinite
R2 = 10R
1
R2 = R
1
R2 = 0.1R
1
-Im
(Z) /
Ω
Re(Z) / Ω Figure 3.7: Nyquist plot of the simulated impedance spectra in the frequency domain 100 kHz - 0.1 Hz for an
intercalation porous electrode. The parameters used for the mathematical simulation are: Dε = 2·10-6 cm2 s -1;
Dβ = 2·10-9 cm2 s -1; L = 2·10-2 cm; a = 1·10-4 cm; τ = 10-3; RP = 2.5 Ω; RU = 1 Ω; Cdl = 1·10-6 F cm-2;
R1 = 10 Ω cm2; Γ = 0.5.
In figure 3.8 the Nyquist plots of the simulated impedance spectra are reported, for
different values of the parameter Γ. The value of the other parameters and the frequency
domain is the same value used in the simulations of figure 3.7. R2 was considered equal to
0.1R1. When Γ = 0 (the adsorbed species is neutral), only one semicircle in the high frequency

- 64 -
range is observed. By increasing Γ, the semicircle in the high frequency region decreases in
absolute value and it splits in two semicircles. The two semicircles represent the two steps of
the total intercalation reaction. If the adsorbed species is uncharged, the step 3.2 is
independent from the potential; it cannot be directly observed. The simulated impedance data
in the low frequency region, representing the diffusion in the host material, are independent
from the state of charge of the adsorbed species.
1.0 1.5 2.00.0
0.5
1.0
Γ = 0Γ = 0.25Γ = 0.5
-Im
(Z) /
Ω
Re(Z) / Ω
Figure 3.8: Nyquist plot of the simulated impedance spectra in the frequency domain 100 kHz - 0.1 Hz for an
intercalation porous electrode. The parameters used for the mathematical simulation are: Dε = 2·10-6 cm2 s -1;
Dβ = 2·10-9 cm2 s -1; L = 2·10-2 cm; a = 1·10-4 cm; τ = 10-3; RP = 2.5 Ω; RU = 1 Ω; Cdl = 1·10-6 F cm-2;
R1 = 10 Ω cm2; R2 = 1 Ω cm2.
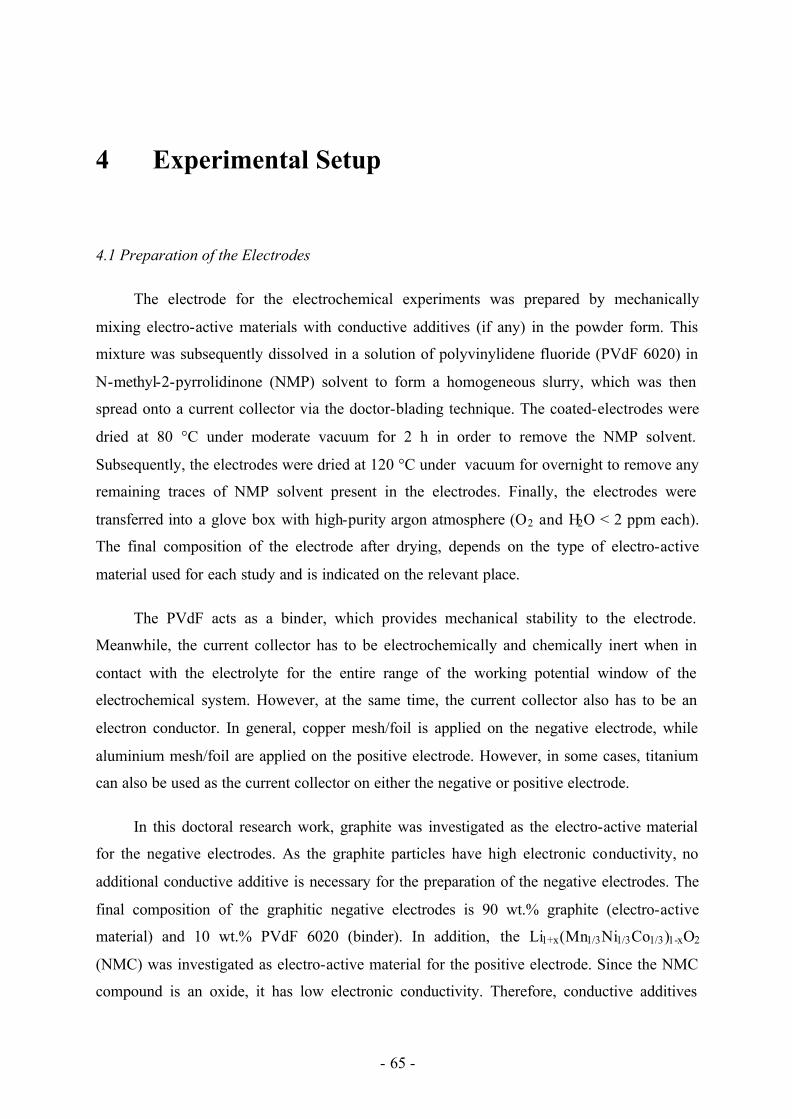
- 65 -
4 Experimental Setup
4.1 Preparation of the Electrodes
The electrode for the electrochemical experiments was prepared by mechanically
mixing electro-active materials with conductive additives (if any) in the powder form. This
mixture was subsequently dissolved in a solution of polyvinylidene fluoride (PVdF 6020) in
N-methyl-2-pyrrolidinone (NMP) solvent to form a homogeneous slurry, which was then
spread onto a current collector via the doctor-blading technique. The coated-electrodes were
dried at 80 °C under moderate vacuum for 2 h in order to remove the NMP solvent.
Subsequently, the electrodes were dried at 120 °C under vacuum for overnight to remove any
remaining traces of NMP solvent present in the electrodes. Finally, the electrodes were
transferred into a glove box with high-purity argon atmosphere (O2 and H2O < 2 ppm each).
The final composition of the electrode after drying, depends on the type of electro-active
material used for each study and is indicated on the relevant place.
The PVdF acts as a binder, which provides mechanical stability to the electrode.
Meanwhile, the current collector has to be electrochemically and chemically inert when in
contact with the electrolyte for the entire range of the working potential window of the
electrochemical system. However, at the same time, the current collector also has to be an
electron conductor. In general, copper mesh/foil is applied on the negative electrode, while
aluminium mesh/foil are applied on the positive electrode. However, in some cases, titanium
can also be used as the current collector on either the negative or positive electrode.
In this doctoral research work, graphite was investigated as the electro-active material
for the negative electrodes. As the graphite particles have high electronic conductivity, no
additional conductive additive is necessary for the preparation of the negative electrodes. The
final composition of the graphitic negative electrodes is 90 wt.% graphite (electro-active
material) and 10 wt.% PVdF 6020 (binder). In addition, the Li1+x(Mn1/3Ni1/3Co1/3)1-xO2
(NMC) was investigated as electro-active material for the positive electrode. Since the NMC
compound is an oxide, it has low electronic conductivity. Therefore, conductive additives

- 66 -
such as carbon black and graphite were added in order to enhance the overall electronic
conductivity of the electrode. The final composition of the NMC positive electrodes is 82
wt.% Li1+x(Mn1/3Ni1/3Co1/3)1-xO2 (electro-active material), 7 wt.% carbon black (Super P,
TIMCAL) (additive), 4 wt.% graphite (KS6, TIMCAL) (additive), and 7 wt.% PVdF 6020
(binder).
4.2 Synthesis of the Electro-Active Materials
Li1+x(Mn1/3Ni1/3Co1/3)1-xO2 (NMC) compounds were synthesized via the co-precipitation
of the hydroxides of the transition metals. An aqueous solution consisting of 1 M LiOH and 3
M NH4OH and a solution of 1 M Me(NO3)2 in ethanol (Me are the transition metals) were
prepared in the first instance. The solution containing the transition metals was prepared in
ethanol in order to speed up the drying process. Stoichiometric amount of the as-prepared
solutions were mixed by slowly dropping the transition metals-based solution into the lithium-
based solution under magnetic stirring. Due to the high pH of the resulting mixture,
hydroxides of the transition metals precipitated. The resulting suspension was left overnight
under agitation. The suspension was later dried in rotavapor until all solvents were removed.
The dried precipitate was kept overnight in moderate vacuum at 80 °C for the complete
removal of water traces.
The dried precipitate, in powder form, was collected by scraping and grinding in an
agate mortar. The ground powder was placed in an alumina crucible and calcinated in air. The
calcination process is divided into three steps: the powder is heated up to the calcination
temperature in 6 hours; followed by maintaining the calcination temperature for the next 6
hours; and finally cooled down to 25 °C in 6 hours. Three calcination temperatures were
chosen for this doctoral work, namely at 700, 850, and 1000 °C. The calcinated powder was
subsequently ground in an agate mortar. A total of 9 samples were prepared by varying 3
different stoichiometries (x = 0, x = 0.1, and x = 0.2) with the three calcination temperatures.
4.3 Standard Electrochemical Experiments
Standard electrochemical experiments were performed on all the negative and positive
electrodes. The standard electrochemical tests were galvanostatic cycling and cyclic
voltammetry (CV). The electrochemical cell used for the standard electrochemical

- 67 -
experiments is a coin-type cell, with a two-electrode configuration; where the working
electrode consists of the investigated electro-active material and the counter electrode is
metallic lithium (a half-cell configuration). The counter electrode serves as reference
electrode as well. Throughout the entire thesis, all potentials are given in respect to the
metallic lithium electrode (Li/Li+). A separator is used to avoid the electric contact between
the working and counter electrode. The separator used in this study is made of glass fibers and
soaked in the electrolyte. The electrolyte used in the standard experiments is a solution of 1 M
LiPF6 in a mixture of ethylene carbonate (EC) and di-methyl carbonate (DMC). The solvents
were mixed in the proportion of 1:1 by weight (EC:DMC). The cell was then assembled
inside a glove box, under a high-purity argon atmosphere (O2 and H2O < 2 ppm each). After
completing the cell assembly, the cell was left inside the glove box for approximately half an
hour in order to make sure the electrodes were completely soaked with electrolyte.
Both the galvanostatic cycling and cyclic voltammetry (CV) measurements were
performed by means of a computer-controlled cell capture (CCCC) system (Astrol Electronics
AG, Oberrohrdorf, Switzerland). The electrochemical cell was put inside a temperature-
controlled chamber, where the operating temperature is maintained at 25 ± 0.1 °C. The
galvanostatic cycling experiments for the negative electrodes were performed at a specific
current of 10 mA g-1 (based on the graphite weight). The cell was cycled between 1.500 and
0.005 V. As for the positive electrodes, the galvanostatic cycling experiments were performed
at a specific current of 25 mA g-1 (based on the oxide weight). In the “low voltage”
experiments, the cell was cycled between 3.0 and 4.3 V; while in the “high voltage”
experiments, the cell was cycled between 3.0 and 5.0 V. The CV measurements for the
positive electrodes were performed between 3.0 and 5.0 V at two different scan rates, namely
at 0.02 and 0.05 mV s-1.
4.4 Differential Electrochemical Mass Spectrometry (DEMS)
The differential electrochemical mass spectrometry (DEMS) experiments were
performed in a special electrochemical cell (also known as the DEMS cell) [106,107]. The
current collectors used for the working and the counter electrodes are also applied as the body
of the cell (see Figure 4.1). The current collectors used are titanium plates. One of the
titanium plate contains a quartz window in the upper part of the body, for monitoring the level

- 68 -
of the electrolyte in the cell. Another titanium plate provides the inlet of the electrolyte
(bottom of the cell) and also the inlet and outlet for the argon carrier gas (top of the cell). The
latter titanium plate also has other two additional holes on the top for optional use (if
necessary). The argon flux continuously removes the gases accumulated on the top of the
DEMS cell and carries these accumulated gases to the mass spectrometer. The DEMS cell
normally works without the separator. The separator could retain partially gas bubbles
released from the working electrode. The distance between the electrodes is maintained by a
polyethylene ring to avoid short-circuit of the DEMS cell. The DEMS cell has normally a
two-electrode configuration and is assembled in a glove box with high-purity argon
atmosphere (O2 and H2O < 2 ppm each). The DEMS cell was always assembled in a half-cell
configuration, unless otherwise specified. The electrolyte used in the DEMS cell is specified
in the Experimental Chapters 5 and 6.
Quartz Window
ElectrodesElectrolyte Inlet
Gas Inlet/Outlet
Additional Holes
Quartz Window
ElectrodesElectrolyte Inlet
Gas Inlet/Outlet
Additional Holes
Figure 4.1: Schematic representation of the DEMS cell.
A new cell for the DEMS experiment was built during this doctoral work. In the new
DEMS cell, a reference electrode could be placed on the bottom of the titanium body (see
Figure 4.2). The reference electrode is electrically insulated from the remaining part of the
titanium body via insulation with epoxy resin. A hole at the back of the reference electrode
holder provides the electrical connection with the potentiostat/galvanostat. The new DEMS
cell has the advantage of a three-electrode configuration thus providing a reference potential
for the working electrode. In general, the reference electrode applied was metallic lithium.
However, the holder of the reference electrode can also support other electro-active materials
as the reference electrode.

- 69 -
Quartz Window
Working Electrode
Epoxy Insulator
Reference Electrode
Electric Connection
Quartz Window
Working Electrode
Epoxy Insulator
Reference Electrode
Electric Connection
Figure 4.2: Schematic representation of the new DEMS cell. The electric connection provides the necessary
electrical contact for the reference electrode.
The electrochemical part of the DEMS experiment is a cyclic voltammetry, where it is
performed at room temperature with a potentiostat (MODEL 2049, AMEL Instruments). The
CV measurement has to be performed relatively fast compared to the other standard
experiments. The scan rate applied is 0.2 mV s-1. The choice of the scan rate is related to the
resolution needed for the mass spectrometry results, as explained below. Before starting the
electrochemical experiment, the gas pipe line and the DEMS cell are purged with Ar carrier
gas for 5 h to remove traces of air (possibly remaining after assembly in the interconnections
of the DEMS cell with the mass spectrometer unit). The DEMS experiments of the graphitic
negative electrodes were performed between 3.00 and 0.09 V (vs. Li/Li+) in the first reductive
half-cycle, followed by the reductive cycling between 1.50 and 0.09 V (vs. Li/Li+) in all
subsequent cycles. The DEMS experiments for the oxide positive electrodes were performed
between 3.40 and 5.30 V (vs. Li/Li+) in the first oxidative half-cycle, followed by the
oxidative cycling between 5.30 and 2.50 V (vs. Li/Li+) in all subsequent cycles.
The gases developed in the DEMS cell are removed by a flux of argon carrier gas. The
argon flux carries the gas phase on the top of the DEMS cell to the mass spectrometer (see
Figure 4.3). The argon flux is controlled by a mass flow controller (GSC-A9SA-DD21,
Voegtlin Instruments AG). The GSC can control the mass flow of the gas between 0.05 and
5.00 mL min-1, with an estimated error of 0.05 mL min-1. The mass flow controller is located
before the DEMS cell, in order to prevent any vapors from the solvents from entering the
mass flow controller and, subsequently, to condensate inside.

- 70 -
The background line in the DEMS measurement is due to the argon (carrier gas) flux
and also the vapors from the solvents. In particular, the dimethyl carbonate (DMC) is a low
boiling-point compound (Tb = 91 °C). The mass spectrum of the argon flux has no mass
number in common with the mass spectrum of the typically developed gases; its influence on
the background line is therefore small. The spectrum of DMC has many mass numbers in
common with the typical developed gases; the background line generated by the DMC is
therefore very important.
In order to increase the sensitivity of the DEMS data, it is necessary to either decrease
the concentration of DMC in the gas flow or increase the concentration of the developed gases.
The amount of gases developed in the time unit is dependent on the scan rate of the cyclic
voltammetry; the higher the scan rate, the higher the concentration of the developed gases.
The amount of DMC in the gas flow is independent of the scan rate. If the flux of argon in the
DEMS cell is increased, the concentration of DMC in the gas flow decreased slightly, while
the concentration of developed gas decreased linearly. Therefore, in order to increase the
sensitivity of the DEMS data, it is necessary to increase the scan rate and to decrease the flux
of the argon carrier gas. The applicable scan rate is limited by the kinetics of the system,
where the optimum scan rate was found to be approximately 0.2 mV s-1. On the other hand,
the flux of the argon carrier gas is limited by the sensibility of the mass flow controller and
retro-diffusion of oxygen from the air to the mass flow controller. If the flux of the argon
carrier gas is lower than 1 mL min-1, the retro-diffusion of air from the outlet of the gas pipe
line will generates a background signal.
Due to the above-mentioned technical issues, a new gas pipe line was built to increase
the ratio between the concentration of the developed gases over the concentration of those
developed by the DMC (see Figure 4.3) solvent in the cell. The new gas pipe line is connected
to two mass flow controllers; the first one is a GSC-type, while the second one is a F-200CV-
type (Bronkhorst AG). The F-200CV can control the gas flow between 0.02 and
1.00 mL min-1, with an estimated error of 0.01 mL min-1. In this case, the F-200CV controls
the flow of argon into the DEMS cell at approximately 0.05 mL min-1. The gas outlet of the
DEMS cell goes into a T-connection, where it is mixed with a stream of pure argon (0.95 mL
min-1) controlled by the GSC. The new gas pipe line permits a higher ratio (ca. 15 times
higher with respect to the old gas pipe line) between the concentrations of the gas developed

- 71 -
over the concentration of those developed by the DMC solvent in the cell. The total gas flow
to the DEMS cell is approximately 1 mL min-1 in order to avoid the retro-diffusion of air.
Mass SpectrometerAr
DEMS CellGSCa)
Gas Outlet
Mass Spectrometer
F-200CV
GSCDEMS Cell
Ar
b)
Gas Outlet
Mass SpectrometerAr
DEMS CellGSCa)
Gas Outlet
Mass SpectrometerMass SpectrometerAr
DEMS CellGSCa)
Gas Outlet
Mass Spectrometer
F-200CV
GSCDEMS Cell
Ar
b)
Gas Outlet
Mass Spectrometer
F-200CV
GSCDEMS Cell
ArMass SpectrometerMass Spectrometer
F-200CV
GSCDEMS Cell
Ar
b)
Gas Outlet
Figure 4.3: a) DEMS experimental setup with a single mass flow controller. b) New DEMS experimental setup
with two mass flow controllers in parallel. Ar indicates the bottle of argon.
The mass spectrometer applied in our DEMS system is a quadrupole-type mass
spectrometer (Prisma QME 200, Pfeiffer Vacuum). The ion source is built- in in the mass
spectrometer. The ion source is an electron beam source, where the filament used is tungsten.
For this DEMS experimental setup, the gas inlet into the mass spectrometer was modified.
The gas inlet now consists of a sheet (thickness 20 µm) of stainless steel with a laser-punched
hole of approximately 2 µm in diameter. The pressure inside the mass spectrometer reached
up to 4·10-6 mbar. As the pressure decreases with time, the stainless steel sheet would have to
be replaced when the pressure is lower than 1.5·10-6 mbar. In general, a large portion of the
gas flow exits the gas pipe line from the gas outlet (see Figure 4.3). Only a small portion of
the gas flow reaches the mass spectrometer and is analyzed. The time delay between the
release of the gas on the top of the DEMS cell and the detection of the gas in the mass
spectrometer is approximately 16 s. It was measured experimentally by injecting air into the
DEMS cell, which was filled with electrolyte. Thus, at a scan rate of 0.2 mV s-1 the
uncertainty in the potential associated to the gas development is about 3 mV.

- 72 -
4.5 Electrochemical Impedance Spectroscopy (EIS)
The electrochemical impedance spectroscopy (EIS) experiments were performed in a
special electrochemical cell (also known as the EIS cell) [108] (see Figure 4.4). The cell is
divided into three parts: the main central part and the remaining two electrode-holders. The
body of the cell is made of polyetheretherketone (PEEK), while the current collectors are
titanium plates of approximately 1.33 cm2 in geometrical surface area. The cell can also
function without the use of a glass fiber/Celgard separator. The distance between the
electrodes is maintained by the central part of the cell. The central part of the cell has four
holes. The holes can be used to fill the cell with the electrolyte and also to place a reference
electrode. The reference electrode normally consists of a small piece of lithium fixed at the tip
of a titanium wire (Ø = 225 µm) insulated in a tube. The reference electrode remains external
to the current lines flowing from the working electrode to the counter electrode. The cell was
assembled in a glove box with high-purity argon atmosphere (O2 and H2O < 2 ppm each).
Cell body
Current collector
Middle part
Piston
Base
Reference electrodeElectrolyte inlet
Cell body
Current collector
Middle part
Piston
Base
Reference electrodeElectrolyte inlet
Figure 4.4: Drawing of the EIS cell.
The EIS experiments were performed under strict temperature control at approximately
25(±0.1) °C using a potentiostat/galvanostat (Model 273A, EG&G Princeton Applied

- 73 -
Research) coupled with a Frequency Response Analyzer (SI 1255, Solartron). The impedance
data were acquired with a Power Suite software (Princeton Applied Research). Only the
graphite negative electrodes were investigated with this EIS technique. The EIS cell was
assembled in a half-cell configuration. Conditioned metallic lithium with high surface area
was used as the counter electrode, due to the low impedance. The impedance data of the
graphite negative electrodes were acquired before cycling and also after a desired number of
cycles, respectively, at a constant DC potential of approximately 1.5 V (vs. Li/Li+) in the
frequency range from 100 kHz to 10 mHz by imposing an alternate current with a small
amplitude of 2 mV on the electrode in the steady state. Before starting the frequency sweep,
the graphite negative electrode was stabilized at 1.5 V (vs. Li/Li+) for 2 h. Meanwhile, for the
cycling of the graphite negative electrode, cyclic voltammetry was performed between 1.50
and 0.09 V (vs. Li/Li+) at a scan rate of approximately 0.2 mV s-1. This experimental setup
was used to investigate the changes in the graphite electrodes due to high scan rate cycling.
4.6 Multiple-Working-Electrode Cell (MWE)
The multiple-working-electrode cell (MWE) is a special home-made cell, which was
developed during this doctoral work. The MWE cell is based on the coffee bag cell design
[109,110]. One or more electrodes can be used in the cell as working electrodes (see Figure
4.5). The working electrodes are placed in series and are electrically insulated by means of a
separator, and, at the same time, ionically connected through the electrolyte. Each working
electrode consists of a self-standing electrode pressed onto a metallic mesh that acts as a
current collector. The electrode was prepared in the similar way as described earlier in
Paragraph 4.1. The current collectors used in this study are expanded metal meshes of
approximately 30 µm in thickness. The use of metal mesh guarantees the ionic contact
between the working electrodes. The type of material for the current collector is chosen
according to the electrode, as described earlier in Paragraph 4.1. Meanwhile, the counter
electrode is a strip of metallic lithium foil fixed to a copper mesh. In general, only one lithium
electrode is needed for the whole MWE cell. The separators used are normally made of
polypropylene and are 25 µm thick (Celgard 2500). Between the working electrodes and the
counter electrode, a glass fiber separator is placed in order to adsorb more electrolyte to create
a buffer layer of electrolyte solution. Finally, the separators are soaked in the electrolyte
solution before sealing of the coffee bag cell.
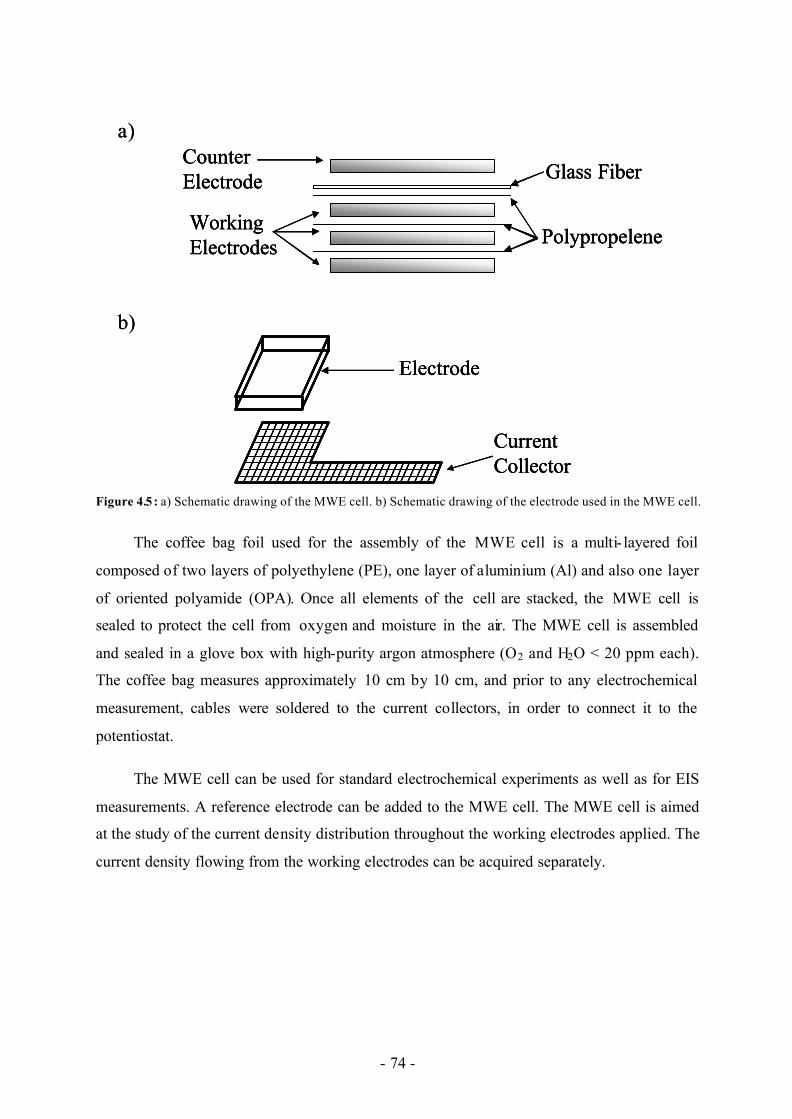
- 74 -
Working Electrodes
Counter Electrode
Polypropelene
Glass Fiber
Electrode
Current Collector
b)
a)
Working Electrodes
Counter Electrode
Polypropelene
Glass Fiber
Working Electrodes
Counter Electrode
Polypropelene
Glass Fiber
Electrode
Current Collector
Electrode
Current Collector
b)
a)
Figure 4.5 : a) Schematic drawing of the MWE cell. b) Schematic drawing of the electrode used in the MWE cell.
The coffee bag foil used for the assembly of the MWE cell is a multi- layered foil
composed of two layers of polyethylene (PE), one layer of aluminium (Al) and also one layer
of oriented polyamide (OPA). Once all elements of the cell are stacked, the MWE cell is
sealed to protect the cell from oxygen and moisture in the air. The MWE cell is assembled
and sealed in a glove box with high-purity argon atmosphere (O2 and H2O < 20 ppm each).
The coffee bag measures approximately 10 cm by 10 cm, and prior to any electrochemical
measurement, cables were soldered to the current collectors, in order to connect it to the
potentiostat.
The MWE cell can be used for standard electrochemical experiments as well as for EIS
measurements. A reference electrode can be added to the MWE cell. The MWE cell is aimed
at the study of the current density distribution throughout the working electrodes applied. The
current density flowing from the working electrodes can be acquired separately.

- 75 -
5 Study of the Negative Electrodes
5.1 Introduction
Graphite is the most used active material for the negative electrode of commercially
available lithium-ion batteries. The term graphite indicates an ordered compound formed by
graphene sheets stacked along the c-axis (see figure 5.1). The graphene sheets are kept
together by Van der Waals forces; the structure can expand along the c-axis and accommodate
lithium-ions. By intercalation of Li+ in the structure of graphite, LixC6 is formed, with
0 = x = 1 [27]. Graphite particles are formed by many graphite crystals, differently oriented,
called crystallites.
a-axisb-axisc-axis
a-axisb-axisc-axis
Figure 5.1: Schematic representation of the crystalline structure of graphite.
Graphite has many advantages: the practical and theoretical reversible specific charge
are similar and around 372 mAh g-1; the equilibrium potential of the lithium-graphite
compounds is near the equilibrium potential of metallic lithium [28], therefore can be used in
high energy lithium-ion batteries; it can be charged and discharged many times without lose
of the electrochemical performances; it is cheap and environmentally friendly. The
disadvantages of graphite based electrodes are related to the advantages. Because of the
strongly reductive equilibrium potential of the LixC6 compounds, the components of the
common organic electrolyte are not thermodynamically stable. The reduction of the
electrolyte is an irreversible process; the irreversible charge used in the reduction of the

- 76 -
electrolyte is “lost” (loss of the performance of the battery). The products of the reduction of
the electrolyte are mainly gaseous, the pressure inside the lithium-ion battery increases (safety
problem). Moreover, when the lithium ions intercalate in the graphite structure, the solvation
shell of Li+ is not blocked by the surface of graphite; the solvation shell co-intercalates into
the graphite structure, where it is reduced. The gaseous products of the reduction of the
solvation shell expand the layers between graphene sheets, destroying the crystal structure of
graphite near the surface (exfoliation). The exfoliation process generates fresh surface in
contact with the electrolyte, and the new surface speeds up the process of exfoliation. The
exfoliation process irreversibly consumes a huge amount of charge; under exfoliating
conditions the graphite based electrodes cannot be used as negative electrodes for commercial
lithium-ion batteries.
The reduction of the electrolyte is kinetically blocked by the formation of a passivation
film at the surface of graphite particles. The passivation film is called solid electrolyte
interphase (SEI) and prevents also the reductive co- intercalation of solvent molecules. The
SEI layer is a very complex, rather random composite of organic and inorganic electrolyte
decomposition products of the (organic) solvents and (inorganic) lithium salt(s) [111]. An
effective SEI layer permits lithium ions to pass through but is insulating for electrons and,
ideally, impermeable for solvent molecules. A good quality SEI is critical for the proper
functioning of electrodes based on highly crystalline graphite. Ethylene carbonate (EC)
containing electrolytes are able to form a good quality SEI. Propylene carbonate (PC)
containing electrolytes are not able to form an SEI which blocks the co-intercalation of
solvent molecules. If a mixture of EC and PC is used as solvent for the electrolyte, the final
behavior of the graphite is strongly dependent on the surface chemistry of the graphite
particles [26]. The formation of the SEI irreversibly consumes a part of the charge used for
charging the graphite electrode. For a better performance of the graphite electrode, it is
desired that a good quality SEI formed with the smallest amount of charge.
For safety reason, the potential of the graphite electrode has to be always higher than
about 50 mV (Li/Li+), to avoid the electroplating of the lithium at the surface of the graphite
particles. The under abuse conditions deposited lithium could have a needle- like shape and
break locally the separator, causing a short circuit. The equilibrium potential of the LiC 6
phase is around 100 mV (Li/Li+); only 50 mV of overpotential can be used to charge the

- 77 -
graphite particles. Depending on the kinetic and mass transport limitations, there is a
maximum specific current, which can be used to charge the graphite particles.
The DEMS measurements are particularly suitable for the study of the SEI formation.
The gaseous molecules generated by the reduction of the electrolyte can be detected by the
mass spectrometer, and their nature can be correlated with the reduced solvent molecules. The
correlation between the intensity of several mass numbers and the potential of the graphite
electrode could give an indication of the mechanism of SEI formation. It is also possible to
investigate the eventual reductive co- intercalation of solvent molecules.
The EIS measurements are suited for the study of the kinetic limitations of the graphite
electrode. The effect of the pore structure on the total response of the graphite electrode can
be separated and analyzed. The pore structure is also the cause of a non-homogeneous usage
of the graphite electrode; its study is believed to be the key for the engineering of a fast
graphite electrode for high power lithium-ion batteries. Moreover, it is possible to observe the
effect of aging on the kinetic parameters of the graphite electrodes, and correlate it with the
morphology and orientation of the crystallites.
The surface chemistry of the graphite is very important for the formation of the SEI and
the intercalation of the lithium ions in the structure of graphite. Different orientation of the
crystallites and different manufacturing processes of the graphite particles have different
effects on the surface chemistry of graphite (surface groups). Four samples of synthetic (KS
and SFG) and natural (GN) graphites (TIMREX®, TIMCAL SA, Bodio, Switzerland) were
selected to examine the influence of the particle morphology, and orientation of the
crystallites. Also different particle sizes were selected to examine the influence of the particle
size on the SEI formation and pore structure. Table 5.1 summarizes the main characteristics of
the graphite particles investigated during this PhD work.
BET / m2 g-1 d50 / µm d90 / µm Purity / % KS44 9.0 18.6 45.4 98.2% SFG44 5.0 23.8 48.8 98.0% GN44 4.9 22.9 49.5 98.0% KS6 20 3.4 6.5 98.1%
Table 5.1: Basic characteristics of the investigated graphites. d50 and d90 represent the average dimension of the
particles at which the cumulative distribution is equal to 50 % and 90 %, respectively.

- 78 -
5.2 Standard Electrochemical Measurements
The electrochemistry of graphite particles is well known. In a standard electrochemical
measurement, only graphite KS6 was investigated by using galvanostatic cycling, to gain
information on the irreversible loss during the SEI formation. The laboratory coin-type cell,
containing the KS6 electrode, was cycled between 1.5 and 0.005 V. The electrolyte was
1 M LiPF6 in EC:DMC (1:1 by wt.). The galvanostatic cycling was performed at 10 mAh g-1,
to complete the formation of the SEI layer in the first cycle. The curve potential E vs. charge
Q in the first cycle shows the common main features of the graphite electrodes (see figure 5.2).
The open circuit potential of the KS6 electrode is around 3.1 V (Li/Li+); when the (negative)
current intensity is imposed, the potential decreases rapidly up to 1.0 V (Li/Li+). In the
potential window 3.0 – 1.0 V (Li/Li+) the electrochemical processes at the interface
graphite/electrolyte involve reduction of surface groups and reduction of trace of water in the
electrolyte; both processes are irreversible.
0 100 200 300 400 5000.0
0.5
1.0
1.5
2.0
2.5
3.0
3.5
E vs
. Li/L
i+ / V
Q / mAh g -1
SEI
Surface groups
0 100 200 300 400 5000.0
0.5
1.0
1.5
2.0
2.5
3.0
3.5
E vs
. Li/L
i+ / V
Q / mAh g -1
SEI
Surface groups
0 100 200 300 400 5000.0
0.5
1.0
1.5
2.0
2.5
3.0
3.5
E vs
. Li/L
i+ / V
Q / mAh g -1
SEI
Surface groups
Figure 5.2: Galvanostatic cycling measurements at 10 mAh g-1 in 1 M LiPF6, EC:DMC (1:1 by wt.) electrolyte
for KS6 based electrodes (1st cycle).

- 79 -
In the potential window 1.0 – 0.3 V (Li/Li+) the electrochemical process is the
formation of the SEI. The charge consumed in the formation of the SEI is higher than the
charge consumed in reducing the surface groups. If a good quality SEI is formed, in this
potential window the charge consumption in the following cycles is drastically reduced and is
almost reversible; the so called dilute phase is formed (see figure 5.3).
In the potential window 0.3 – 0.005 V (Li/Li+) the main electrochemical process is the
intercalation of lithium in the graphite structure. Three plateaus are observed, which
correspond to three different lithium-graphite compounds, namely Li1/3C6, Li1/2C6, and LiC6.
The charge consumed in the lithium intercalation is reversible; the charge is recovered during
the anodic oxidation of the lithium-graphite compounds. During the electrochemical
intercalation of lithium, the co- intercalation of the solvent molecules is also possible, if the
SEI is not sufficiently protective. The co- intercalation of the solvent is followed by the
reduction of the solvent (exfoliation), which is an irreversible process.
0 100 200 300 4000.0
0.5
1.0
1.5
E vs
. Li/L
i+ / V
Q / mAh g -1
0 100 200 300 4000.0
0.5
1.0
1.5
E vs
. Li/L
i+ / V
Q / mAh g -1
Figure 5.3: Galvanostatic cycling measurements at 10 mAh g-1 in 1 M LiPF6, EC:DMC (1:1 by wt.) electrolyte
for KS6 based electrodes (5th cycle).

- 80 -
In the following cycles, the curves E vs. Q during reduction and oxidation of the KS6
electrodes have the same shape, but are shifted in potential (see figure 5.3). The shift of the
potential is due to the overpotential; it represents the kinetic limitations of the graphite sample.
After the first cycle, the irreversible specific charge decreases, while the reversible specific
charge remains stable or increases slightly in the second cycle and then stabilizes. The
decrease of the irreversible specific charge indicates the formation of a good quality SEI. The
rate of charge and discharge in the galvanostatic cycling experiment was very low (namely 10
mA g-1), allowing the complete charge of the graphite particles.
To study the effect of fast charging and ageing on the graphite performance during the
first few cycles, cyclic voltammetry experiments were performed on all graphite samples (cf.
table 5.1). The cyclic voltammetry experiments were performed at a scan rate of 0.2 mV s-1,
using as the electrolyte 1 M LiPF6 in EC:DMC (1:1 by wt.). The EIS cell with a three
electrode configuration was used for the experiment. The potential window investigated was
1.50 – 0.09 V (Li/Li+). The limit of 0.09 V (Li/Li+) was chosen because the graphite
electrodes come off the current collector at lower potentials if the electrode is not pressed by
the separator. Metallic lithium was used as counter and reference electrode. The metallic
lithium counter electrode was preconditioned by imposing a current of 1.5 mA for 2 hours in
another cell and then mounted into the EIS cell.
In figure 5.4 the first electrochemical cycles of all examined samples are compared. It is
observed that, during the first reduction, all three types of graphite exhibit an irreversible
reduction peak around 600 mV vs. Li/Li+. This reduction peak is attributed to the formation of
the SEI surface layer. The charge consumed during the SEI formation correlates with the BET
specific surface area of the graphite which translates into the dependence of the magnitude of
this particular peak on the BET value (see table 5.2 and table 5.1) [112]. But the KS44
electrode shows an additional reduction current maximum around 350 mV vs. Li/Li+. This
second current maximum looks a lot like a plateau and, with respect to the first maximum at
ca. 600 mV; the specific current is higher in this potential region. This second reduction peak
was also attributed to the SEI formation coupled with the exfoliation of some graphite
particles [113]. The intercalation peak is located around 0.15 V (Li/Li+); the current peak
corresponds to the formation of the compound Li1/3C6. At lower potential the reductive
current intensity increases again; it indicates the formation of a new lithium-graphite phase,

- 81 -
Li1/2C6. Because the scan rate is switched at 0.09 V (Li/Li+), the intercalation process is not
complete, the second reductive current maximum is not observed. The oxidation of the
lithium-graphite compounds shows a double peak, which correspond to the de- intercalation of
the lithium from the partially formed Li1/2C6 and Li1/3C6, respectively.
0.0 0.5 1.0 1.5-0.6
-0.4
-0.2
0.0
0.2
0.4
0.6
i m /
A g
-1
E vs. Li/Li+ / V
KS44 SFG44 GN44 KS6
Figure 5.4: Cyclic voltammograms at 0.2 mVs -1 in EC:DMC, 1 M LiPF6 for the investigated graphite samples
(1st cycle).
In figure 5.5 the different electrochemical cycles of the KS44 sample are compared. The
sample KS44 is representative of the behavior of the other graphite samples. After the first
cycle, the potential window 1.50 – 0.25 V (Li/Li+) is electrochemically inactive. The
reductive current peak at low potential decreases in intensity and is shifted to more cathodic
potential. The oxidative current peaks at low potential also decrease in intensity and are
shifted to more anodic potential. The shift of the peaks in the opposite direction of the
potential scale indicates an increase of the resistance of the system. Also the decreasing of the
intensity in the current peaks is an indication of the increased resistance of the system. The

- 82 -
difference between the potential of the second anodic current peak and the potential of the
cathodic current peak is equal to two times the average overpotential.
0.0 0.5 1.0 1.5-0.6
-0.4
-0.2
0.0
0.2
0.4
0.6
i m /
mA
g-1
E vs. Li/Li+ / V
1st
2nd
5th
10th
Figure 5.5: Cyclic voltammograms at 0.2 mVs -1 in EC:DMC, 1 M LiPF6 for graphite KS44.
QIRR / mAh g-1 QREV / mAh g-1 1st 2nd 5th 10th 1st 2nd 5th 10th
QP / mAh g-1
KS44 93.6 13.0 3.7 2.1 59.6 65.5 62.2 59.7 12.2 SFG44 21.7 4.2 1.7 1.0 69.9 69.2 64.3 53.1 6.7 GN44 19.8 3.2 1.3 0.9 65.6 58.1 52.3 51.1 8.3 KS6 61.5 10.2 2.9 1.3 80.5 80.0 74.6 69.4 28.7
Table 5.2: Basic electrochemical data from cyclic voltammetric experiments of the investigated graphites. QIRR
is the irreversible charge, QREV is the reversible charge, and Qp is the irreversible charge measured between 1.50
and 0.50 V vs. Li/Li+ in the first cycle.
In table 5.2 the irreversible and reversible charge for the entire cycle and the Qp (the
charge in the potential window ≥500 mV vs. Li/Li+ under the reductive peak in the first cycle,
related to the SEI formation) is compared for the different graphite samples and given cycles.
The cycling was performed by cyclic voltammetry at a fairly fast potential sweep rate of

- 83 -
0.2 mVs-1 with immediately reversing the current at the lower potential limit. In such an
experiment the (faster) surface reactions can be considered as completed but this is not true
for the (slower) lithium intercalation into the bulk graphite. The KS44 sample has the highest
irreversible charge consumption, but the sample KS6 has the higher value of Qp, which is
related to the irreversible charge consumed in the formation of the SEI. The values of the
irreversible charge consumption listed in table 5.2 are for the SEI formation on the original
surface of the respective samples but also include the charge consumption for the exfoliation
and passivation of so created new surface. In the case of the KS44 graphite, most of the
irreversible charge consumption is related with the exfoliation process, as evidenced by
figure 5.4 and table 5.2.
5.3 EIS measurements
To have a better insight on the effect of ageing on the graphite performance during the
first few cycles, the cyclic voltammetry experiments described in paragraph 5.2 were coupled
with electrochemical impedance spectroscopy (EIS) measurements. EIS experiments were
performed at 1.5 V vs. Li/Li+ after a given number of cycles, in particular before the
formation of the SEI layer (“0th cycle”) and after the 1st, 2nd, 5th, and 10th cycle, respectively.
EIS was performed in the frequency range 100 kHz - 10 mHz, imposing an alternate current
of a small amplitude of 2 mV on the electrode in a steady state. Before starting the frequency
sweep, the graphite electrode was stabilized at 1.5 V vs. Li/Li+ for 2 hours.
To extract useful information from the acquired EIS data, all the impedance spectra
were analyzed using Kramers-Kronig transformations, as explained in paragraph 2.4. Using
the model described by equation (2.23), it was possible to eliminate an eventual instability
and non- linearity of the system. Equation 2.23 fits the impedance data with a general model,
which describes an infinite parallel of a resistance in series with a capacitor; this model can fit
every set of EIS data responding to the principles of linearity, stability and causality. Every
parallel branch corresponds to a time constant. For the real analysis of the experimental EIS
data, 5 time constants per decade of the investigated frequency range were used. The so
analyzed data and the experimentally acquired ones showed discrepancies at very low and
very high frequencies, respectively, but the relative errors were always less than 3% (see
figure 5.6). The model used in Kramers-Kronig analysis doesn’t describe the real
electrochemical process occurring in the system.

- 84 -
10-2 10-1 100 101 102 103 104 105-3
-2
-1
0
1
2
3
Er
r |Z|
/ %
f / Hz Figure 5.6: Relative error between experimental data and Kramers-Kronig transformations for impedance data
acquired on the pristine KS44 sample at 1.5 V (Li/Li+) in 1 M LiPF6, EC:DMC (1:1 by wt) electrolyte.
The influence of the SEI layer on the electrochemical response of graphite electrodes is
obvious from the difference between the impedance spectra acquired at 1.5 V vs. Li/Li+ on
fresh (“0th cycle”) and cycled electrodes (“1st cycle”), respectively. At 1.5 V the surface of
fresh electrodes is not yet covered by a noteworthy SEI film and the cycled electrodes do not
show first-order transitions due to intercalation of Li+. In figure 5.7 representative impedance
spectra of a GN44 electrode in a standard EC:DMC battery electrolyte are compared in a
Bode plot. It is clear from the figure that the electrochemical processes changed significantly;
the evidence is given by the different slope of the modulus of a cycled electrode with respect
to a fresh one. Moreover, the value of the modulus of the impedance in the high and medium
frequency range (above 1 Hz) is higher for the cycled electrode. In the low frequency range
(below 1 Hz) the value of the modulus of the impedance is lower for the cycled electrode.

- 85 -
10-2 10-1 100 101 102 103 104 1050.01
0.1
1
10
100 0th cycle 1st cycle
|Z
| / Ω
g-1
f / Hz Figure 5.7: Modulus of the specific electrochemical impedance of a GN44 electrode in 1 M LiPF6, EC:DMC
(1:1 by wt.) electrolyte at 1.5 V (Li/Li+) before and after the SEI formation.
In figure 5.8 the modulus of the specific electrochemical impedance measured on fresh
KS44, SFG44, GN44, and KS6 electrodes is shown for the “0th cycle”. Undoubtedly, for the
KS samples the impedance value at low frequencies is about 3 times less than for the SFG44
and GN44 graphites. Clearly, there is an influence of the BET specific surface area (see table
5.1) but one can certainly conclude that the impedance value correlates with the irreversible
charge consumption.
In figure 5.9 the modulus of the specific electrochemical impedance measured on cycled
KS44 electrodes is shown for different cycles. In the high frequency region (above 1 Hz) the
value of the specific impedance increases with the cycle number. In the low frequency region
(below 1 Hz) the value of the specific impedance decreases slightly; the relative difference
between the value of the impedance acquired at 10 mHz at the 1st cycle and at the 10th cycle is
about 14%. The behavior of the KS44 sample is representative of the other graphite samples.
It seems that by increasing the cycle number the resistance in the high frequency region,
corresponding to the resistance of polarization of the electrode, increases.

- 86 -
10-2 10-1 100 101 102 103 104 10510-3
10-2
10-1
100
101
102
KS44SFG44GN44KS6
|Z| /
Ω g
-1
f / Hz Figure 5.8: Modulus of the specific electrochemical impedance acquired for the different graphite samples in 1
M LiPF6, EC:DMC (1:1 by wt.) electrolyte at 1.5 V vs. Li/Li+ before the SEI formation.
10-2 10-1 100 101 102 103 104 10510-2
10-1
100
101
1st cycle2nd cycle5th cycle10th cycle
|Z| /
Ω g
-1
f / Hz Figure 5.9: Modulus of the specific electrochemical impedance acquired for the KS44 samples in 1 M LiPF6,
EC:DMC (1:1 by wt.) electrolyte at 1.5 V vs. Li/Li+ after the SEI formation at different cycles.

- 87 -
Essential information about the processes at/in the graphite electrodes can be extracted
from the electrochemical impedance spectra. The electrodes have inherent energetic
limitations (due to the charge transfer resistance at the interface, lithium diffusion inside the
host material, lithium adsorption at the interface, etc.) and geometric limitations (due to the
resistance of both the electrode and the electrolyte in the pores, diffusion gradients in the
pores, etc.). Deep understanding of these limitations allows engineering of the electrode in
order to obtain maximum performance of the electro-active material and to utilize the
electrode homogeneously. For this purpose the electrochemical impedance spectroscopy is a
very useful tool because it permits a rather easy quantification of a number of different
processes.
In figure 5.10 a Nyquist plot of the experimental electrochemical impedance spectrum
of a fresh GN44 electrode is shown as an example. At high frequencies a depressed capacitive
semicircle is observed, due to the influence of the porosity on the electrode’s AC response, as
explained in paragraph 3.4. For this reason, independently from the physical model to apply
to simulate the electrochemical processes at the graphite electrode interface, a model to
include the spatial effects cannot be disregarded. The solution developed in paragraph 3.4 was
used to fit the impedance spectra. It was necessary to find an expression for κ2, which
depends on the physical model of the interfacial electrochemical processes through Z. The
examination of the Nyquist plots for fresh graphite electrodes (all graphite samples) has
suggested that the electrochemical process before the SEI formation can be described as an
adsorption process. The expression of Z can be calculated from eq. (3.16), imposing R2 ? 8 .
Correlations between the fitted parameters from an equivalent circuit model with the
microscopic properties of the electrode (such as reaction rate, wetted surface area, and number
of adsorbing sites) depend on the value of Γ, but this parameter cannot be obtained directly
from the EIS data. It was observed that, at low frequencies the experimental impedance
spectra deviated from the spectra calculated using the classical adsorption model. This
deviation from the model can be attributed to a current leakage at the interface. From the point
of view of physical chemistry, a current leakage represents a current passing trough the
electrode because of side reactions and/or because the experiments were performed under
quasi-steady-state conditions (which means that the adsorbing sites were not fully
equilibrated). Considering an equivalent circuit, a leakage current can be simply represented
by a conductance, Glc, in parallel with the capacitance of double layer.

- 88 -
0 20 40 600
20
40
60
0.000 0.025 0.050 0.0750.000
0.025
0.050
0.075
-I
m(Z
) / Ω
g-1
Re(Z) / Ω g-1
Figure 5.10: Nyquist plot of the electrochemical impedance of a GN44 electrode in the 1 M LiPF6, EC:DMC
(1:1 by wt.) electrolyte at 1.5 V vs. Li/Li+ before the SEI formation.
Fitting the impedance spectra with the adsorption model gives realistic results for the
samples SFG44 and GN44, respectively, but not for the KS samples (KS44 and KS6). In the
latter case a second time constant is observed. This time constant can be attributed to several
secondary effects, or to an additional parallel process or to a process in series with the
adsorption process. Several alternatives were analyzed: the NTLM model was used instead of
the TLM model; a secondary parallel process of adsorption at a second type of surface sites
was added; a two-step adsorption process trough surface states was substituted to the standard
adsorption process. Note that a reaction trough surface states is a typical phenomenon for
junctions semiconductor/electrolyte, investigated and discussed for many systems [114].

- 89 -
For our electrochemical system, the two-step adsorption trough the surface states was
chosen as the most plausible process. This choice is based on comparing the fitting parameters
obtained from the models, especially considering the influence of porosity and comparing the
data for the KS samples with those obtained for SFG44 and GN44, respectively. It should be
stressed that the models were obtained by solving the physico-chemical equations describing
the system and that all non-idealities were attributed to the leakage current. The equations
used for fitting the impedance spectra are more than an assembly of plausible parameters, and
the fitted values can be correlated directly with the physicochemical properties of the
electrochemical system.
The geometrical properties of the system are contained in the model for porous
materials. Because graphite has a comparatively high electrical conductivity (order of
magnitude of 104 S·cm-1 in the bulk material) with respect to the ionic conductivity of the
electrolyte solution (order of magnitude of 10-2 S·cm-1), the parameter α in eq. (3.37) was
assumed to be close to 0. The impedance spectra were therefore fitted using as object function
χ2mod (see eq. (2.26)). In Tables 5.3 and 5.4 the parameters obtained from fitting the
impedance spectra measured before the SEI formation are reported for the standard adsorption
process and for the adsorption process through surface states, respectively. The standard
deviation of the fits was always very low (χ2 less than 10-3). The resistance of the pores Rp is
equal to
MNA
lR
pp
ρ= (5.1)
where M is the mass of the sample. The resistance Rp of the pores depends on the geometry of
the system (in particular on the geometric area of the current collector) and is normalized to
the mass, thus, when the mass is higher, the electrode is considered to be thicker and the
resistance of the pores higher.
It has to be stressed that the order of magnitude of Rp is always the same, regardless
which of the two models is used for the fitting, and nearly independent of the graphite type.
The minor differences originate most probably from the different shape and dimension of the
particles of each graphite type. In particular, KS6 sample has an Rp value double with respect
to the other graphite types, which means smaller dimensions of the pores. For this reason we
argue that the investigated pores are generated by the connection between the particles, not

- 90 -
intrinsically present in the material. Note that in a porous system the apparent value of the
electrolyte resistivity in pores is higher with respect to the resistivity of the bulk electrolyte
solution. The ratio between the two values is the so-called tortuosity which depends on the
geometry of the pores and, thus, on the shape of the particles in the electrode. The tortuosity
can be considered also as the ratio between the true length of the current lines and the
thickness of the electrode.
SFG44 GN44 Rp / Ω g-1 1.33·103 1.42·103 Cdl / F g-1 5.95·10-3 3.48·10-3 Rad / Ω g 2.21·10-3 1.65·10-2
τad / s 7.71·10-4 4.92·10-3 χ2 4.51·10-4 2.28·10-4
Table 5.3: Parameters obtained by fitting the impedance spectra of GN44 and SFG44 electrodes measured in
EC:DMC, 1M LiPF6 at 1.5 V vs. Li/Li+ before the SEI formation with the model describing standard adsorption
process.
KS44 SFG44 GN44 KS6 Rp / Ω g-1 1.32·103 1.13·103 1.40·103 3.15·103 Cdl / F g-1 1.23·10-2 4.60·10-3 2.22·10-3 1.47·10-2 Rad / Ω g 1.42·10-5 3.95·10-3 1.30·10-2 3.00·10-3 Cad / F g-1 8.28·10-1 3.33·10-1 2.97·10-1 1.43 RSS / Ω g 9.74·10-4 3.46·10-3 5.37·10-3 6.65·10-4 CSS / F g-1 3.19·10-1 1.77·10-2 1.86·10-3 1.39·10-1
τSS / s 3.11·10-4 6.13·10-5 8.32·10-6 9.27·10-5 τad / s 1.13·10-3 2.49·10-3 5.49·10-3 5.76·10-3
χ2 2.15·10-4 4.20·10-4 2.27·10-4 3.41·10-4
Table 5.4: Parameters obtained by fitting the impedance spectra of all investigated electrodes measured in
EC:DMC, 1M LiPF6 at 1.5 V vs. Li/Li+ before the SEI formation with the model describing an adsorption
process through surface states.
It follows a discussion on the results summarized in Tables 5.3 and 5.4. Because the
adsorption process and charging of surface states are processes in series, the time constants
for the surface state charge τSS and the adsorption τad, respectively, are defined as:
( )( )adSSadSSad
SSSSSS
CCRR
CR
++=τ
=τ (5.2)

- 91 -
For both, the SFG44 and GN44 electrodes the impedance data were fitted using both models:
standard adsorption and adsorption through surface states. From the latter model the time
constant τSS is very low. Therefore, nothing is observed in the experimental impedance
spectrum but a tiny distortion of the high frequency semicircle. Generally, the order of
magnitude of τSS changes with the graphite type. It was hypothesized that this could be related
to the variation of the graphite surface’s properties known to be dependent on the
manufacturing process and, thus, on the graphite type. (There is also a dependence on the
particle size of the same graphite type because of the influence of the milling process on the
surface quality.) Another interesting observation is that the value of τad is in the same order of
magnitude for all types of graphite. The τad values are related with the surface energetic of a
particular interface, not with the surface area exposed to the electrolyte. Therefore, the
lithium-ion adsorption process has obviously comparable surface energetic for all three types
of graphite.
The next interesting point to discuss is the value of Cad. Independent of the theory used
to correlate the macroscopic properties of the electrode with the microscopic surface
phenomena, Cad is proportional to the number of adsorbing (“active”) surface sites. One
observes that the values of Cad are comparable when normalized with respect to the BET
specific surface area of the respective sample. It is observed that the Cad values correlate well
with the irreversible charge Qp consumed for the SEI formation. It is therefore possible to
offer an interpretation of the nature of the adsorption sites, assuming them as
electrochemically active surface sites reacting with the electrolyte solution at higher
overpotentials. The active adsorption sites are occupied by species from the electrolyte and
are the basis for the SEI nucleation and growth. Actually, the active adsorption sites could be
considered as the very first layer of the SEI. Care must be taken when interpreting data when
significant graphite exfoliation is involved (here the case of the KS44 sample) because the Cad
values determined at 1.5 V vs. Li/Li+ do not reflect the additional surface created by
exfoliation.
The impedance spectra acquired for cycled electrodes (after the SEI layer was formed)
were examined qualitatively. Clearly, there is a difference to the case without the SEI (see
figure 5.7). Obviously, the model used for fitting the impedance spectra acquired for the
different graphite types before the formation of the SEI cannot be used for fitting and

- 92 -
analyzing the impedance spectra acquired in the following cycles. A more sophisticated
model including the influence of the SEI layer needs to be developed which could be the
subject of future work.
5.4 DEMS Measurements
The understanding of the mechanism of formation of the SEI at the surface of negative
electrodes based on graphite is very important for enhancing the performances of lithium-ion
batteries. As explained in the previous paragraphs of this chapter, the SEI is composed of
organic and inorganic lithium compounds, formed by the reduction of the electrolyte
components. The specific charge consumed for the formation of the SEI is not recovered
during the discharge of the lithium-ion battery. The SEI is necessary for the protection of the
surface of the particles of graphite from the process of exfoliation, but the irreversible specific
charge consumed for the SEI formation has to be as low as possible. The reduction of the
electrolyte components produces volatile compounds, which can be detected with a mass
spectrometer. The DEMS technique is an easy and powerful tool for the study of the
mechanism of the SEI formation and the effectiveness of the SEI. If the SEI is not effective in
protecting the surface of the particles of graphite from the exfoliation process, volatile
compounds produced by the exfoliation process can be detected during the intercalation of Li+.
All the DEMS experiments were performed at room temperature in the DEMS cell with
the reference electrode. The reference and counter electrodes were made of metallic lithium.
The working electrodes were based on the graphites KS44 and KS6 (see table 5.1). Before
starting the voltammetric DEMS experiment, a 5 hours delay was allowed to purge
completely the entire gas system from traces of air, possibly remaining in the interconnections
of the DEMS cell with the mass spectrometer unit. During the purging period, the potential of
the graphite electrode was hold constant at 3.00 V (Li/Li+). The first reductive half-cycle was
then performed between 3.00 and 0.09 V (Li/Li+) and all subsequent cycles between 1.50 and
0.09 V (Li/Li+) at a potential sweep rate of 0.2 mVs-1. During the DEMS experiments
multiple mass signals (m/z) were recorded. The particular choice of the monitored mass signal
channels was based on previous experiments. The signals of hydrogen and ethylene (known
side products of the SEI formation [115]) were always recorded. The mass signals were
analyzed using the technique explained in paragraph 2.3. The background signal composed of
the mass spectrum of the argon carrier gas, and the low-boiling electrolyte component(s) in

- 93 -
the vapor phase were subtracted. The mass signal m/z = 59 was identified as being influenced
only from the vapors of the electrolyte components and was used to subtract the base line in
the procedure of analysis of the DEMS data. The time delay between gas evolution in the cell
and detection in the mass spectrometer is circa 16 s (corresponding to a potential shift of circa
3 mV) and was estimated by injection of air into the electrolyte after the measurement.
In paragraphs 5.2 and 5.3, it was shown that the different graphite types in the 1 M
LiPF6, EC:DMC (1:1 by wt.) electrolyte behave in the same way. It was also observed that the
charge consumed during the SEI formation is proportional to the BET surface area. The KS
type graphite was chosen as a reference material for this study because of its higher surface
area, which permits an easier detection of the volatile compounds coming from the SEI
formation. In figure 5.11 the comparative plot of the normalized mass signal intensities I2 and
I27 as measured for the KS6 and KS44 samples in the 1 M LiPF6, EC:DMC (1:1 by wt.)
electrolyte is reported. The mass signals I2 and I27 were typically observed during the SEI
formation. It turned out that, in respect of both the onset of the gas development and the
relative amounts of the volatile products, the results are comparable. Although the main
features of the mass signals are independent from the type of graphite particles, the intensity
of the mass signals, Im, change strongly; in particular the intensity of Im for the sample KS6 is
circa doubled with respect to Im for the sample KS44. Therefore, only representative results
for KS6 electrodes are shown.
In figure 5.12 a comparative plot of the analyzed mass signal intensities, Jm, for the KS6
sample in the 1 M LiPF6, EC:DMC (1:1 by wt.) electrolyte is reported. The second cycle is
also representative for the following cycles. The following observations were made: the signal
intensities of mass number channels m/z = 26, 27, 28, and 44, respectively, reveal distinct
peaks during the first reduction of the graphite electrode, there are no major peaks during the
subsequent cycles; the signal intensities of mass number channels m/z = 2 and 41,
respectively, show peaks re-appearing in each cycle, their magnitude decreases after the first
cycle but then remains quite constant in the subsequent cycles; all relevant channels show
peaks during the reduction of the electrode (which means during the SEI formation and/or
lithium intercalation), but there are no significant mass signals during the lithium de-
intercalation from the graphite.

- 94 -
0 5 10
KS6
KS6
KS44
t / h
I 2
0.07
5 KS44
I 27
0.00
5
I 2
0.1
I 27
0.01
0.0
1.5
3.0U
E
Figure 5.11: Comparative plot of the mass signal intensities Im (µA g-1) as measured for the KS6 and KS44
samples in 1 M LiPF6, EC:DMC (1:1 by wt.) electrolyte.

- 95 -
0 5 10t / h
J 2
50.0
J 26 8.0
J 27 8.0
J 28
20.0
J 41 0.5
J 44 1.5
0
3U
E
Figure 5.12: Comparative plot of the analyzed mass signal intensities Jm (nA g-1) (see paragraph 2.3) for the
KS6 samples in 1 M LiPF6, EC:DMC (1:1 by wt.) electrolyte.

- 96 -
From the analysis of mass spectra of various reference gases and their mixtures it is
most likely that the peaks of the mass signals J26 and J27 are due to the fragments of ethylene.
The peak of the mass signal J44 was undoubtedly assigned to CO2. The peak of the J28 signal
could arise due to fragments from CO2 and/or ethylene but it could be also from the reductive
formation of CO. Because the shape of mass signal J28 is equal to the shape of the mass
signals J27 and J26, it is believed that no CO is produced. The intensity changes in the mass
signal m/z = 2 are believed to be due to the generation of hydrogen. The changes in the mass
signal J41 could not yet be attributed to a particular compound. It can be excluded that the
signal J41 comes from propylene because then J42 (not shown) should also change at the same
potential which was not the case. It is noteworthy that J2 and J41 have exactly the same shape.
The signals J2 and J41 could therefore indicate two different volatile products of the same
reaction or the two mass numbers are two different fragments generated by the ionization of
the same molecule.
0.0 0.5 1.0 1.5-1.0
-0.5
0.0
0.5
1.0
im
UE vs. Li/Li+ / V
i m /
A g
-1
0.0
5.0x101
J2
J2 / nA
-1 g-1
Figure 5.13: First cycle CV and MSCV of mass signal J2 at 0.2 mV s -1 of the KS6 sample in 1 M LiPF6,
EC:DMC (1:1 by wt.) electrolyte.

- 97 -
0.0 0.5 1.0 1.5-1.0
-0.5
0.0
0.5
1.0
im
UE vs. Li/Li+ / V
i m /
A g
-1
0.0
8.0x100
J27
J27 / nA
-1 g-1
Figure 5.14: First cycle CV and MSCV of mass signal J27 at 0.2 mV s -1 of the KS6 sample in 1 M LiPF6,
EC:DMC (1:1 by wt.) electrolyte.
The first cycle cyclic voltammograms (CV) and the corresponding mass signal cyclic
voltammograms (MSCV) for mass numbers 2 and 27 are reported respectively in figure 5.13
and 5.14. In the reductive half-cycle the signals I2 (hydrogen) and I27 (ethylene) rise both at
about 0.75 V vs. Li/Li+, i.e., in the SEI formation region. Two peaks are observed for J27 and
one peak for J2. The peak of the signal of mass number 2 is located in the low potential region,
where the intercalation of the Li+ occurs. It is believed to be due to a probable exfoliation of
some graphite particles. The J27 signal has a first peak located at 0.5 V (Li/Li+) (due to the SEI
formation) and second ones at about 0.1 V vs. Li/Li+, the latter in a region where the Li+
intercalation occurs. The second peaks can be therefore assigned to the SEI formation on the
extra surface created by graphite exfoliation.
The first cycle cyclic voltammograms (CV) and the corresponding mass signal cyclic
voltammograms (MSCV) for mass numbers 2 and 27 are reported respectively in figures 5.13
and 5.14. In the reductive half-cycle the signals J2 (hydrogen) and J27 (ethylene) rise both at
about 0.75 V vs. Li/Li+, i.e., in the SEI formation region. For the mass signal J2 only one peak

- 98 -
is observed, at the more cathodic potential. The mass signal J27 shows two maxima: the first
maximum is located at about 0.5 V vs. Li/Li+ (due to the SEI formation); the second
maximum is at the more cathodic potential. The second peak of J27 and the peak of J2 can be
therefore assigned to the SEI formation on the extra surface created by graphite exfoliation or
co-intercalation of solvent molecules. It could be also possible that the volume increase of the
graphite due to the lithium intercalation increases the contact area of the electrolyte with the
electrode and creates thus a new surface where SEI is formed.
0.0 0.5 1.0 1.5-1.0
-0.5
0.0
0.5
1.0
im
UE vs. Li/Li+ / V
i m /
A g
-1
0.00
1.20x100
J44
J44 / nA
-1 g-1
Figure 5.15: First cycle CV and MSCV of mass signal J44 at 0.2 mV s -1 of the KS6 sample in 1 M LiPF6,
EC:DMC (1:1 by wt.) electrolyte.
Figure 5.15 shows the CV and MSCV for the mass signal m/z = 44 corresponding to
CO2. It can be observed that, in contrast to both H2 and ethylene signals rising around 0.75 V
(Li/Li+), the CO2 development starts at more anodic potentials, namely circa at 1 V (Li/Li+).
The CO2 development in this potential region could be an indicator of a first coverage of the
graphite surface with some electrolyte reduction products and/or related to the reduction of
graphite’s surface groups [115,116]. The very low intensity of the CO2 signal stresses that it is
a side reaction product. It is known that, the reduction of ethylene carbonate generates a
radical ion, by splitting the C-O bond in the ethylene position. This radical ion can be further

- 99 -
reduced and gives Li2CO3 and ethylene [117,118]. From spectral studies of the SEI
compounds on metallic lithium, Aurbach et al. have deduced that the radical anions can
disproportionate and generate ROCO2Li [78]. Subsequent reaction of this compound with
traces of water will generate Li2CO3, R-OH, and CO2. It could be also that the reduced
ethylene carbonate is split in one C-O bond near the carbonyl bond, which may subsequently
develop CO2 and other products, such as Li2O and ethylene or polymeric compounds of the
SEI.
5.5 Multiple-Working-Electrode Measurements
As evidenced in the previous paragraphs of this chapter, the irreversible specific charge
of the negative electrode based on graphite particles is very important for the performance of
the lithium-ion battery. The irreversible specific charge in the first cycle is related to the SEI
formation at the surface of the particles of graphite, exfoliation of the surface of the particles
of graphite, and the reduction of the electrolyte. It could be expected that, for a given graphite
and electrolyte, the irreversible specific charge (normalized to the weight of the graphite) in
the first cycle is independent from the mass of the graphite sample. In the real experiments,
however, it was observed that there is a decrease of the relative irreversible specific charge in
the first cycle by increasing the thickness of the electrode. In figure 5.16 the relative
irreversible specific charge in the first cycle is reported as a function of the areal density for
graphite SFG44 electrodes. The galvanostatic cycling measurements were performed in a
standard laboratory coin-type cell. The cell was cycled between 1.0 and 0.005 V (Li/Li+),
imposing a specific current equal to 10 mAh g-1. At 1.0 and 0.005 V (Li/Li+) a potentiostatic
step was added. The potentiostatic step lasted until the specific current dropped to 5 mAh g-1.
The relative irreversible specific charge in the first cycle, QIRR, clearly decrease from circa
20% to circa 7% when the areal density of the graphite electrode changes from circa 1.5 mg
cm-2 to circa 11 mg cm-2. The decrease of QIRR with the areal density of the sample was
believed to depend on the increasing thickness of the sample. From galvanostatic cycling
measurements made on compressed graphite electrodes, however, it turned out that the
decrease of QIRR is not dependent on the thickness but on the real areal density of the
electrode.

- 100 -
0 4 8 120
5
10
15
20
Q
IRR /
%
m / mg cm-2
Figure 5.16: Relative irreversible specific charge in the first cycle vs. areal density of the electrode for SFG44
samples in 1 M LiPF6, EC:DMC (1:1 by wt.) electrolyte.
To understand the reason of the decreasing of QIRR by increasing the areal density, a
new cell was designed: the multiple-working-electrode cell (MWE cell), described in
paragraph 4.6. With the MWE cell it is possible to divide the working electrode (in this case
made of graphite) in several layers (cf. scheme in figure 4.5). The layers are in series, and
they simulate the thickness of the electrode. The current intensity flowing through each layer
can be measured separately; in this way it is possible to study QIRR at several positions along
the thickness of the working electrode. Moreover, the design of the cell ensures that the
differences between the three layers are connected with the limitations due to the transport of
ions in the electrolyte solution, while the limitations generated by the transport of electrons
and ions in the solid phase are the same in the three layers. Both galvanostatic cycling and
cyclic voltammetry experiments can be performed with the MWE cell. The measurement with
the MWE cell needs 4 potentiostats.
In figure 5.17 it is shown how the 4 potentiostats are connected to the cell in the case of
three layers of the working electrode. The working electrodes of the three potentiostats pi are
connected to the three respective layers of the graphite electrode, while the counter electrodes
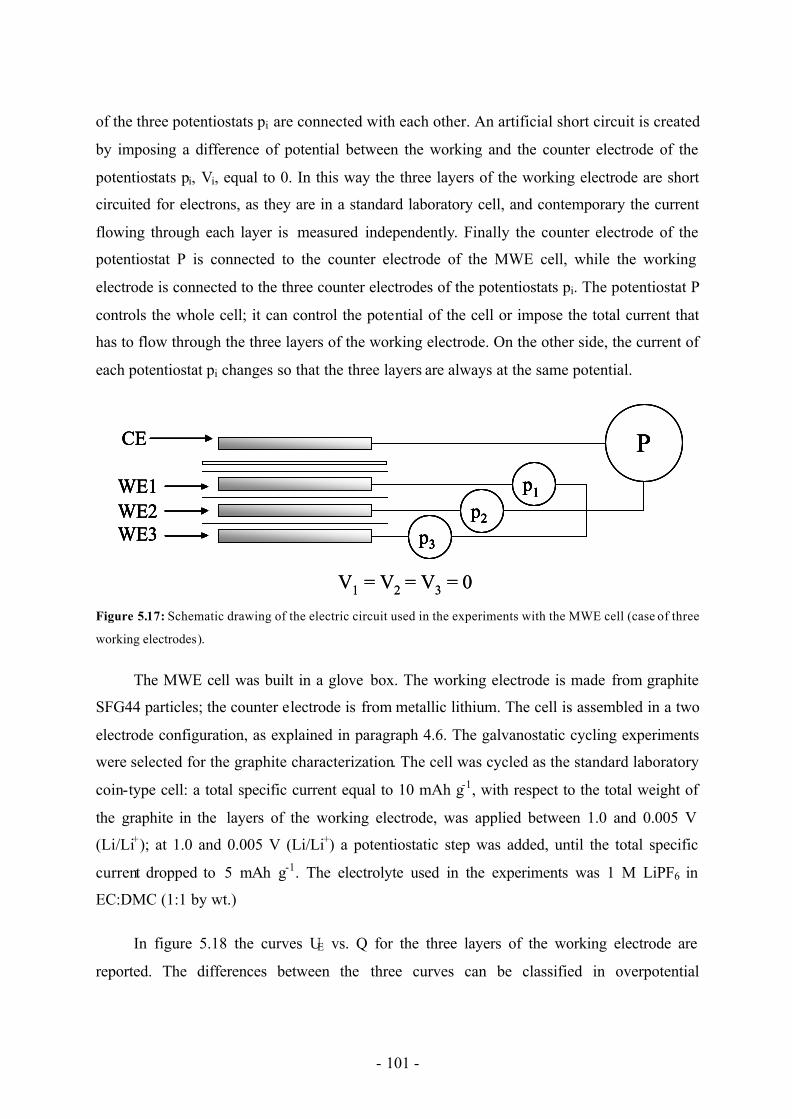
- 101 -
of the three potentiostats pi are connected with each other. An artificial short circuit is created
by imposing a difference of potential between the working and the counter electrode of the
potentiostats pi, Vi, equal to 0. In this way the three layers of the working electrode are short
circuited for electrons, as they are in a standard laboratory cell, and contemporary the current
flowing through each layer is measured independently. Finally the counter electrode of the
potentiostat P is connected to the counter electrode of the MWE cell, while the working
electrode is connected to the three counter electrodes of the potentiostats pi. The potentiostat P
controls the whole cell; it can control the potential of the cell or impose the total current that
has to flow through the three layers of the working electrode. On the other side, the current of
each potentiostat pi changes so that the three layers are always at the same potential.
WE1
CE
WE2WE3
p2
p3
p1
P
V1 = V2 = V3 = 0
WE1
CE
WE2WE3
p2
p3
p1
P
WE1
CE
WE2WE3
p2
p3
p1WE1
CE
WE2WE3
p2p2
p3p3
p1p1
PP
V1 = V2 = V3 = 0
Figure 5.17: Schematic drawing of the electric circuit used in the experiments with the MWE cell (case of three
working electrodes).
The MWE cell was built in a glove box. The working electrode is made from graphite
SFG44 particles; the counter electrode is from metallic lithium. The cell is assembled in a two
electrode configuration, as explained in paragraph 4.6. The galvanostatic cycling experiments
were selected for the graphite characterization. The cell was cycled as the standard laboratory
coin-type cell: a total specific current equal to 10 mAh g-1, with respect to the total weight of
the graphite in the layers of the working electrode, was applied between 1.0 and 0.005 V
(Li/Li+); at 1.0 and 0.005 V (Li/Li+) a potentiostatic step was added, until the total specific
current dropped to 5 mAh g-1. The electrolyte used in the experiments was 1 M LiPF6 in
EC:DMC (1:1 by wt.)
In figure 5.18 the curves UE vs. Q for the three layers of the working electrode are
reported. The differences between the three curves can be classified in overpotential

- 102 -
differences and charge differences. The shape of the charge / discharge curve is strongly
dependent on the position of the layer: the nearer is the layer to the counter electrode, the
smaller are the overpotentials due to the transport (both migration and diffusion) of the
lithium ions in the electrolyte solution. In the UE vs. Q curve of the first layer the three
plateaus indicating the formation of the lithium-graphite compounds are clearly observed; in
the UE vs. Q curve of the second and third layer the plateaus due to the formation of LiC 6 and
Li1/2C6 compounds are not differentiated anymore (overpotential differences).
0.0
0.5
1.0
0 150 300 4500.0
0.5
1.0
Layer 1
Layer 2
UE /
V
Q / mAh g-1
Layer 3
0.0
0.5
1.0
UE /
VU
E /
V
Figure 5.18: Galvanostatic cycling measuremnets for the graphite SFG44 sample in 1 M LiPF6, EC:DMC (1:1
by wt.) electrolyte with the MWE cell. The curves UE vs. Q were separated for the three layers (cf. figure 5.17).
The potential UE is relative to Li/Li+.
Both the reversible and irreversible specific charges in the three different layers are
different. While in the first reductive half cycle the first layer consumes 447 mAh g-1, the
second layer consumes only 395 mAh g-1, and the third layer around 391 mAh g-1. The
reversible and irreversible specific charge for the three layers is reported in table 5.5. The

- 103 -
irreversible specific charge was divided in two parts: QSEI is the irreversible charge obtained
between 1.0 and 0.4 V (Li/Li+); QRED is the irreversible charge obtained between 0.4 and
0.005 V (Li/Li+). From table 5.5 it is deduced that the biggest part of the irreversible charge
observed in the three layers is consumed in the low voltage region, below 0.4 V (Li/Li+).
QT QREV QIRR QSEI QRED
Layer 1 446.7 339.3 107.4 14.6 89.2 Layer 2 394.7 337.7 57.0 13.0 41.1 Layer 3 390.5 324.6 65.9 12.2 51
Table 5.5: Total, reversible and irreversible specific charge (mAh g -1) in the three layers of a working electrode
based on graphite SFG44 particles in 1 M LiPF6, EC:DMC (1:1 by wt.) electrolyte. QSEI is the irreversible
specific charge between 1.0 and 0.4 V (Li/Li+). QRED is the irreversible specific charge between 0.4 and 0.005 V
(Li/Li+).
The reason of the described behavior is not yet clarified. Here we offer a hypothesis
based on the observed phenomena and on the theoretical principles of electrochemistry. At the
beginning of the first reductive half cycles, all the layers of the working electrodes are in
equilibrium conditions, no current intensity is flowing. When the total specific current is
applied, it is distributed in the three layers following the model described by equation (3.23)
and figure 3.4. Most of the highest amount of current intensity flows through the first layer,
smaller in the following layers. The solid electrolyte interphase is formed in the three layers
quite contemporary and consuming the same amount of charge because the overpotentials,
mainly due to migration of the ions in the electrolyte, are small.
When the intercalation of lithium ions starts: because the high amount of lithium ions
consumed in the intercalation process, the overpotentials due to diffusion of lithium ions in
the electrolyte solution are high and it is possible to observe the differences between the three
layers in the curves UE vs. Q. The reduction of the electrolyte is stopped by the SEI, which
lets the lithium ions pass through, but is an insulator for the electrons. When low potentials
are reached, the first layer is fully charged, while the others are not yet. When the first layer is
fully charged, the distribution of overpotential in it changes. The lithium ions in the first layer
cannot pass from the structure of the SEI to the structure of the graphite; Li+ is accumulated at
the interface SEI/graphite, the SEI is strongly polarized and the potential drop in the SEI
increases. Due to the higher potential drop in the SEI, the electrons can be transported through

- 104 -
the SEI and reduce the electrolyte. This hypothesis could possibly explain why the first layer
has a higher irreversible specific charge with respect to the other two layers.
Of course this is only a hypothesis; it has to be confirmed through other experimental
results. The curve UE vs. Q for the first layer shows clearly the three plateaus for the
formation of the three lithium-graphite compounds. It is possible to calculate the amount of
the irreversible charge in the formation of the compound LiC6, which is the compound with
the higher concentration of lithium. If the hypothesis suggested above is correct, it would be
expected the irreversible charge in this stage to be very high. From the experimental data it
results that the irreversible specific charge in the first layer for the formation of the compound
LiC6 is equal to circa 52 mAh g-1, which corresponds to more than 50% of QRED.

- 105 -
6 Study of the Positive Electrodes
6.1 Introduction
The most common active material for the positive electrode of lithium-ion batteries is
LiCoO2. LiCoO2 has a layered structure; layers containing cobalt ions (slab) and layers
containing lithium ions (interslab) alternate in the structure (see figure 6.1). During charging
of the positive electrode, the lithium ions de- intercalate from the structure and the cobalt ions
are oxidized from the Co3+ to Co4+. While negative electrodes based on graphite can achieve
very good performances (high cycling stability and reversible specific charge of up to
370 mAhg-1), LiCoO2 possesses low practical specific charge with respect to the theoretical
specific charge (circa 50%) [56], is carcinogenic, and exhibits an exothermic peak at ca.
150 °C when heated in the de-intercalated state (safety problem).
Figure 6.1: Crystallographic structure of the LiCoO2 compound and similar layered compounds.
The oxide family with the general formula Li1+x(NiyMnzCo1-y-z)1-xO2, called NMC, is
believed to be one of the most promising substitute of the current industrial standard [1-3].

- 106 -
The NMC compounds are layered oxides, with the same crystallographic structure of the
LiCoO2 (see figure 6.1). The most studied NMC compounds are the ones with z = y. x is
called the overlithiation degree. It indicates the excess of lithium in the structure of the NMC
compounds. The lithium ion excess is located in the layers of the transition metals (slab).
As general rule, manganese and cobalt are present in the structure as Mn+4 and Co+3
respectively, while nickel is observed as a mixing of Ni+2 and Ni+3 [67]. The performances of
the NMC compounds depend from the values of x, y, and z. The presence of cobalt ions
decreases the disorder in the interslab. If the nickel ions are in divalent state, the NMC
compound shows a higher thermal stability [68-70]. The NMC compounds can reach high
specific charge density with respect to LiCoO2 [1] (circa 170 mAh g-1 for the NMC compound
with x = 0 when cycling in the potential window from 2.5 to 4.4 V vs. Li/Li+), and a good
cycling stability.
During this PhD work, the effect of overlithiation degree on the performances of the
NMC compounds was investigated. The NMC compounds with general formula
Li1+x(Ni1/3Mn1/3Co1/3)1-xO2 were synthesized and studied. The synthesis was performed by
coprecipitation of hydroxides of the transition metals, as explained in Chapter 4. 9 samples
were prepared and analyzed in total, by crossing 3 stechiometries (x = 0, x = 0.1, and x = 0.2)
with three calcination temperatures (T = 700°C, T = 850°C, and T = 1000°C). The chemical
and structural analysis and the standard electrochemical measurements were performed for
each sample. Two of the 9 samples were selected as the most promising ones and further
analyzed by differential electrochemical mass spectrometry (DEMS).
6.2 Structural, Morphological and Chemical Analysis
For each synthesized sample the structural, morphological, and chemical analysis was
performed, to verify the nature and composition of the final compound. These analyses were
done in collaboration with Mr. Rosciano from PSI electrochemistry laboratory. X-ray
diffraction was performed to verify the crystallographic structure of the synthesized active
materials. All the NMC samples synthesized at 850°C have shown the layered structure of the
NMC compounds (see figure 6.2). The NMC compounds synthesized at 1000°C have also a
layered structure. The NMC compounds synthesized at 700°C have broader peaks, and the
doublet located at 65° becomes a single peak (see figure 6.3). The passage from a doublet to a

- 107 -
single peak with the decrease of the temperature of calcination could be connected to the
broadening of the peaks or to the formation of a different crystallographic structure, the spinel
structure.
The morphological analysis of the NMC samples was carried out with the scanning
electron microscopy technique (SEM). The morphological structure of the synthesized NMC
samples depends on the temperature of calcination and seems independent from the
overlithiation degree. By increasing the temperature of calcination, the dimension of the
crystallites increases. The dimension of the crystallites is around 120 nm for the samples
calcined at 700°C, while increases to 800 nm for the samples calcinated at 1000°C (see
figures 6.4 and 6.5).
10 30 50 70 900
100
200
300
x = 0.2
x = 0.1
A.U
.
2θ
x = 0
Figure 6.2: X-ray pattern for the three pristine NMC compounds synthesized at 850°C with different
overlithiation degrees.

- 108 -
10 30 50 70 900
100
200
300
T = 1000°C
T = 850°C
A.U
.
2θ
T = 700°C
Figure 6.3: X-ray pattern for the three pristine NMC compounds with overlithiation degree equal to 0.1 and
synthesized at different calcination temperatures T.
Figure 6.4: SEM image of the NMC sample calcined at 700°C and with overlithiation degree eqaul to 0.1.

- 109 -
Figure 6.5: SEM image of the NMC sample calcined at 1000°C and with overlithiation degree eqaul to 0.1.
The iodometric titration method was used for the chemical analysis of the NMC
samples; it permits to find experimentally the value of the overlithiation degree. The solution
for the iodometric tritation was prepared mixing 5 ml of an aqueous solution of HCl
(37% by wt), 5 ml of an aqueous solution of KI (10% by wt), 10 ml of water, circa 30 mg of
the investigated NMC sample. The resulting solution was left to react at 60°C overnight. The
titrating solution is an aqueous solution of 0.01 M Na2S2O3; it was slowly dripped in the
solution containing the transition metals. The volume of the titrating solution used during the
iodometric tritation, Vtit , and the average oxidation degree of the transition metals, d, are
related by the formula:
[ ]
mS
tit322
qMm
VOSNa2d
⋅+= (6.1)
where ms is the mass of the sample, M the molar weight of the sample, and qm the
stoichiometric coefficients for the transition metal in the sample. The average oxidation
degree of the transition metals and the overlithiation degree of the NMC sample are related by
the formula:
d1d3
xsp −−
= (6.2)

- 110 -
The results of the iodometric titration are reported in table 6.1. The iodometric titration
has evidenced that the nominal and experimental overlithiation degree coincide for xnom equal
to 0 and 0.1. For xnom equal to 0.2, the experimental overlithiation degree is lower. XPS
experiments have shown that in the NMC compounds Mn and Co have always an oxidation
degree equal to 4 and 3, respectively; nickel is observed as a mixing of Ni+2 and Ni+3 [67].
There is a maximum value of d and consequently there is a maximum value of xsp. The
sample with xsp equal to 0.2 cannot be synthesized for thermodynamic limitations.
xnom mS / mg M / g mol-1 qm Vtit / ml xsp 0 35.0 96.46 1 36 0
0.1 30.9 91.39 0.9 36.9 0.095 0.2 36.5 86.34 0.8 47.5 0.167
Table 6.1: Results of the iodometric titration for the NMC samples calcined at 850°C. xnom is the nominal
overlithiation degree of the NMC sample, mS is the mass of the sample, M is the molar weight of the sample, qm
is the stoichiometry of the transition metal of the sample, Vtit is the volume of the titrating solution used, xsp the
overlithiation degree obtained from the titration.
6.3 Standard Electrochemical Measurements
The standard electrochemical measurements were performed on a coin-type laboratory
cell in a half-cell configuration (counter electrode of metallic lithium). 1 M LiPF6 in
EC:DMC (1:1 by wt.) was used as electrolyte. Two galvanostatic cycling experiments were
performed: the low voltage galvanostatic cycling and the high voltage galvanostatic cycling.
In the low voltage galvanostatic cycling the cell is cycled between 3.0 and 4.3 V (Li/Li+). In
the high voltage galvanostatic cycling the cell is cycled between 3.0 and 5.0 V (Li/Li+). The
imposed specific current was 25 mA g-1 in both cases. The galvanostatic cycling experiments
of the different NMC samples were used to study the fading of the reversible specific charge
with the number of cycles. The galvanostastatic cycling experiments are strongly dependent
on the synthesis conditions of the investigated NMC sample and on the investigated potential
window.

- 111 -
0 5 10 15 20 250
50
100
150
Q
REV
/ m
Ah
g-1
Cycle
x = 0 ; T = 850°C x = 0.1 ; T = 850°C x = 0.2 ; T = 850°C x = 0.1 ; T = 700°C
Figure 6.6: Reversible specific charge vs. cycle from low voltage galvanostatic cycling measurements at
25 mAh g -1 in 1M LiPF6, EC:DMC (1:1 by wt.) electrolyte for different NMC samples.
Figure 6.6 plots the reversible specific charge from the low voltage galvanostatic
cycling experiments, QREV, as function of the cycle number for different NMC samples. The
NMC compound synthesized at 850°C with x = 0 shows the higher value of QREV at each
cycle. The fading of the performance is low; the difference between the first cycle and the 20th
cycle is equal to 3.7%. The NMC compound synthesized at 850°C with x = 0.1 shows a
smaller value of QREV with respect to the NMC compound calcined at the same temperature
and with x = 0. The difference between the first cycle and the 20th cycle is equal to 1.4%; the
fading of the performance slightly decreases with increasing overlithiation degree. The NMC
compound synthesized at 850°C with x = 0.2 has a very low reversible specific charge. The
performance increases with the cycle number. The NMC compound synthesized at 700°C
with x = 0.1 has a smaller QREV and a higher fading of the performance with respect to the
NMC compound calcined at 850°C with the same overlithiation degree. The difference

- 112 -
between the first cycle and the 20th cycle is equal to 6.0%. The NMC compounds synthesized
at 1000°C show performances slightly lower than the analogous calcined at 850°C.
0 5 10 15 200
50
100
150
200
250
QR
EV /
mA
h g-1
Cycle
x = 0 ; T = 850°C x = 0.1 ; T = 850°C x = 0.2 ; T = 850°C x = 0.1 ; T = 700°C
Figure 6.7: Reversible specific charge vs. cycle from high voltage galvanostatic cycling measurements at
25 mAh g -1 in 1M LiPF6, EC:DMC (1:1 by wt.) electrolyte for different NMC samples.
Figure 6.7 plots the reversible specific charge from the low voltage galvanostatic
cycling experiments, QREV, as function of the cycle number for different NMC samples. The
NMC compound synthesized at 850°C with x = 0 shows the higher value of QREV in the very
first cycles, but the fading of the performance is very strong and the reversible specific charge
decreases rapidly with the cycle number. The difference between the first cycle and the 15th
cycle is equal to 24.7%. The NMC compound synthesized at 850°C with x = 0.1 shows a
smaller value of QREV in the very first cycles with respect to the NMC compound calcined at
the same temperature and with x = 0. After the 10th cycle, the compound with x = 0.1 has a
higher QREV with respect to the NMC compound with x = 0. The difference between the first
cycle and the 15th cycle is equal to 15.7%; also in the high voltage experiments the fading of
the performance decreases with increasing the overlithiation degree. The NMC compound

- 113 -
synthesized at 850°C with x = 0.2 has a very small reversible specific charge and it fails after
very few cycles. The NMC compound synthesized at 700°C with x = 0.1 has the smallest
reversible specific charge and a higher fading of the performance with respect to the NMC
compound calcinated at 850°C with the same overlithiation degree. The difference between
the first cycle and the 15th is equal to 23.5%. Also in the high voltage experiments the NMC
compounds synthesized at 1000°C show performance slightly lower than the analogous
calcined at 850°C.
A comparison between the high voltage galvanostatic cycling experiments performed on
the synthesized NMC compounds and the commercially available LiCoO2 was not possible,
because the LiCoO2 failed after a few cycles. Based on the structural, morphological, and
chemical analysis and on the standard electrochemical experiments, the NMC compounds
synthesized at 850°C with overlithiation degree equal to 0 and 0.1 were selected as candidates
for further analysis. The NMC compounds synthesized at 1000°C were discarded because
they have lower performance with respect to the nominally same compounds synthesized at
850°C. The NMC compounds synthesized at 700°C have also lower performance with respect
to the same nominally compounds synthesized at 850°C; moreover the structural analysis
made by X-ray diffraction has not given a clear result as in the other cases (see figure 6.3).
The NMC compounds with nominal overlithiation degree equal to 0.2 have also lower
performance with respect to the compounds with lower overlithiation degree; moreover the
chemical analysis made by iodometric titration has evidenced that the experimental
overlithiation degree is equal to 0.167 (see table 6.1).
In the following text the NMC compound calcined at 850°C with x = 0 will be called
stoichiometric compound, the NMC compound calcined at 850°C with x = 0.1 will be called
overlithiated compound. The stoichiometric and overlithiated compounds were further
analyzed by using the differential plot and performing cyclic voltammetry on the compounds.
The differential plot is obtained from the deriva tive of the specific charge with respect to the
potential of polarization; it plots dQ/dUE vs. UE. The differential plot is very similar to the
cyclic voltammogramm. The differential plot of an intercalating compound consists of
oxidative and reductive peaks, which represent the reversible and irreversible electrochemical
processes occurring in the system. The differential plot was done for both high voltage and
low voltage galvanostatic cycling experiments in the first cycle. The cyclic voltammetry was

- 114 -
performed on both stoichiometric and overlithiated compounds in the coin-type laboratory
cell with scan rate equal to 0.05 and 0.02 mV s-1, respectively between 2.5 and 5.0 V (Li/Li+).
1 M LiPF6 in EC:DMC (1:1 by wt.) was used as the electrolyte.
3.0 3.5 4.0 4.5 5.0-600
-400
-200
0
200
400
600
dQ/d
UE /
mA
h g-1
V-1
UE vs. Li/Li+ / V
High Voltage Low Voltage
Figure 6.8: Differential plot from the galvanostatic cycling experiments for the stoichiometric compound in the
high voltage and low voltage experiment, respectively, during the first cycle at 25 mA g-1 in 1M LiPF6, EC:DMC
(1:1 by wt.) electrolyte.
In figure 6.8 the differential plot of the high voltage (HV) and low voltage (LV)
galvanostatic cycling experiments during the first cycle for the stoichiometric compound is
represented. In the low voltage region the HV and LV differential curves coincide; the two
electrodes based on the stoichiometric NMC are pristine and behave in the same way. A
reversible oxidative peak is located at 3.8 V (Li/Li+); this peak represents the de-intercalation
process. After 4.3 V (Li/Li+) the stoichiometric compound has a second oxidative peak, which
is mostly irreversible. It is small and it is believed to be due to electrolyte oxidation [106].
The reductive peak located near 3.75 V (Li/Li+) is due to the intercalation of the lithium ions
back to the NMC compound. This peak has the same shape in both HV and LV experiments,
thus indicating that the intercalation process is not changed. The intensity of the reductive

- 115 -
peak in the HV experiment is slightly smaller with respect to the intensity of the same peak in
the LV experiment; also the potential of the reductive peak in the HV experiment is shifted to
more cathodic values with respect to the same peak in the LV experiment. Both phenomena
indicate an increase of the inner resistances of the system in the HV experiment.
3.0 3.5 4.0 4.5 5.0-1000
-500
0
500
1000
dQ/d
UE /
mA
h g-1
V-1
UE vs. Li/Li+ / V
High Voltage Low Voltage
Figure 6.9: Differential plot from the galvanostatic cycling experiments for the overlithiated compound in the
high voltage and low voltage experiment, respectively, during the first cycle at 25 mA g-1 in 1M LiPF6, EC:DMC
(1:1 by wt.) electrolyte.
In figure 6.9 the differential plot of the HV and LV galvanostatic cycling experiments
during the first cycle for the overlithiated compound is represented. In the low voltage region
a reversible oxidative peak located at 3.7 V (Li/Li+) is observed; this peak represents the de-
intercalation process. At potentials positive to 4.5 V (Li/Li+), a very intense irreversible
oxidative peak is observed. Structural changes were anticipated for the overlithiated NMC
compound in this voltage region where CO2 and O2 development is likely. This question is
investigated in details in the thesis of Fabio Rosciano (ETH Nr. 17847). The reductive peak
located near 3.7 V (Li/Li+) is due to the intercalation of the lithium ions. The shape and the
location of this peak depend strongly on the type of the experiment. The lithium intercalation

- 116 -
peak shifts to the cathodic direction in the HV experiments. The differential plot of the second
cycle (not shown) suggests this to be a thermodynamic effect; if the shift would be due to the
kinetics, the related oxidative (de- intercalation) peak would have to shift to more anodic
values.
3.0 3.5 4.0 4.5 5.0-1000
-500
0
500
1000
dQ/d
UE /
mA
h g-1
V-1
UE vs. Li/Li+ / V
x = 0 x = 0.1
Figure 6.10: Differential plot from the galvanostatic cycling experiments for the overlithiated and stoichiometric
compound in the high voltage experiment, respectively, during the first cycle at 25 mA g-1 in 1M LiPF6,
EC:DMC (1:1 by wt.) electrolyte.
In figure 6.10 the differential plot of the HV galvanostatic cycling experiments during
the first cycle for the stoichiometric and overlithiated compound are compared. The peak
representing the de-intercalation process is smaller and located more cathodically for the
overlithiated NMC compound; it indicates that the reversible specific charge in the LV
experiments for the overlithiated NMC has to be smaller with respect to the stoichiometric
compound. This is confirmed by the LV galvanostatic cycling experiments (see figure 6.7). At
potentials positive to 4.5 V (Li/Li+), the overlithiated phase has an intense irreversible
oxidative peak. Dahn’s group suggested to explain the oxidative peak located at 4.5 V (Li/Li+)

- 117 -
with structural changes associated with oxygen loss from the oxide and a simultaneous Li+
extraction [68]. In the same potential window, the stoichiometric NMC compound has a small
peak located at 4.7 V (Li/Li+). The relative position of the reversible peaks indicates that the
overpotential in the system containing the overlithiated NMC is higher with respect to
overpotential in the system containing the stoichiometric phase.
2.5 3.0 3.5 4.0 4.5 5.0-2000
-1000
0
1000
2000
i mν−1
/ F
g-1
UE vs. Li/Li+ / V
ν = 0.02 mV s -1
ν = 0.05 mV s -1
Figure 6.11: Cyclic voltammograms at 0.02 and 0.05 mVs -1 in 1M LiPF6, EC:DMC (1:1 by wt.) electrolyte for
the stoichiometric NMC compound (1st cycle).
In figure 6.11 and 6.12 the cyclic voltammetries at scan rate of 0.02 and 0.05 mV s-1 for
the stoichiometric and overlithiated NMC compound are respectively reported. Because the
current is dependent on the scan rate, the ratio between the specific current, im, and the scan
rate, ν, is reported. The value imν-1 is independent from the scan rate if the overpotential at the
given scan rate and potential of polarization is negligible. As a general rule, by increasing the
scan rate, a shift of the current peak to more anodic potentials should be observed for the
oxidative half-cycle, and a shift of the current peak to more cathodic potentials should be
observed for the reductive half cycle. For the stoichiometric compound the shift of the

- 118 -
potential is observed only in the oxidative half cycle and only in the potential window where
de-intercalation is the main electrochemical process; it is also the potential range with the
higher specific current. For the overlithiated compound the shift of the potential is observed in
the oxidative half cycle, in both low and high voltage regions. In the reductive half cycle a
reduction of the current peak is observed at higher scan rate.
2.5 3.0 3.5 4.0 4.5 5.0-2000
-1000
0
1000
2000
i mν−1
/ F
g-1
UE vs. Li/Li+ / V
ν = 0.02 mV s -1
ν = 0.05 mV s -1
Figure 6.12: Cyclic voltammograms at 0.02 and 0.05 mVs -1 in 1M LiPF6, EC:DMC (1:1 by wt.) electrolyte for
the overlithiated NMC compound (1st cycle).
To summarize the results of the standard electrochemical measurements: all the
synthesized NMC compounds were tested with galvanostatic cycling experiments, between
them two samples were selected because they have shown good performances in the low
voltage region (stoichiometric NMC compound) and in the high voltage region (overlithiated
NMC compound); the overlithiated phase has shown a smaller fading of the performance with
respect to the HV galvanostatic cycling experiments; the differential plot of the galvanostatic
cycling experiments was used to study the differences in the electrochemical behavior
between the two selected samples; the difference between the stoichiometric and overlithiated

- 119 -
phases was observed in the high voltage region, above 4.5 V (Li/Li+); the stoichiometric
NMC compound has shown a lower overpotential (kinetic limitation) with respect to the
overlithiated phase. The electrochemical process represented by the irreversible peak located
in the high voltage region, at 4.7 V (Li/Li+) for the stoichiometric NMC compound and at 4.5
V (Li/Li+) for the overlithiated NMC compound, respectively seems to be the key for the
stabilization of the overlithiated NMC phase in the HV galvanostatic cycling experiments (see
figure 6.7).
6.4 DEMS Measurements
The DEMS technique analyzes on-line the electrochemically generated gases, giving the
intensity of the mass signals (m/z) as a function of the electrode potential. The DEMS
technique was used to verify the hypothesis of Dahn et al. [68], who explain the oxidative
peak located at 4.5 V (Li/Li+) in the overlithiated phases with structural changes associated
with oxygen loss from the oxide. The DEMS experiments were performed in the DEMS cell.
A cyclic voltammetry was performed on the active materials to investigate the gas
development in the potential range 2.5 – 5.3 V (Li/Li+). The scan rate of the cyclic
voltammetry was 0.2 mV s-1; the scan rate was selected based on the resolution of the mass
spectrometer and the kinetic limitations of the system.
In figure 6.13 the comparative plot of the mass signal intensities, Im, as measured
reports the electrochemical development of O2 and CO2 for the stoichiometric and
overlithiated NMC compounds. The value of the mass signal intensities is normalized for the
mass of the sample. On the top the applied potential UE (Li/Li+) is also given. The m/z = 32
signal was assigned to oxygen and m/z = 44 to CO2, respectively.

- 120 -
0 5 10 15
x = 0.1 ; CO2
x = 0 ; CO2
x = 0.1 ; O2
t / h
I 32
0.01
x = 0 ; O2
I 32
0.08
I 44
0.04
I 44
0.15
2.5
4.0
5.5U
E
Figure 6.13: Comparative plot of the mass signal intensities Im (µA g-1) as measured for the stoichiometric
(x = 0) and overlithiated (x = 0.1) NMC compounds in 1M LiPF6, EC:DMC (1:1 by wt.) electrolyte.

- 121 -
Clearly, for the stoichiometric sample no oxygen evolution is detected while CO2 is
evolved during the first and further cycles in the high voltage region (only two cycles are
shown in figure 6.13). The CO2 evolution is due to the electrolyte oxidation, as evidenced for
a number of electro-active oxides [106,119]. In contrast, for the overlithiated NMC oxide,
both CO2 and O2 evolution is observed in the high voltage region but only during the first
cycle. This result strongly supports the following hypothesis: during the first delithiation the
overlithiated NMC compounds irreversibly lose oxygen at high potentials, as proposed by the
Dahn’s group [120]; in the case of the overlithiated NMC materials, the oxidation of the
electrolyte (evidenced by the CO2 evolution) is somehow inhibited, in contrast to the
stoichiometric material. A surface film composed of electrolyte oxidation products and/or
changed surface properties of the NMC oxide due to the oxygen loss is believed to be the
reason for the non-detection of the CO2 development in the second cycle.
In figure 6.14 the comparative plot of the analyzed mass signal intensities, Jm, reports
the electrochemical development of O2 and CO2 for the stoichiometric and overlithiated NMC
compounds. The analyzed mass signal intensities Jm are obtained with the analytical
procedure described in paragraph 2.3. The intensity of the background line generated by the
carrier gas and the vapors of DMC was subtracted from the measured data. The shape of the
curves and the information obtained from figure 6.14 are the same of figure 6.13. The
potential of polarization for the development of O2 and CO2 is better evidenced using the
analyzed mass signal intensities.
Further comments rise from the detailed study of the analyzed mass signal intensities
for the overlithiated NMC compound: the development of O2 starts at potentials above the
development of CO2; the intensity of m/z = 32 shows a single peak located at 5 V (Li/Li+); the
intensity of m/z = 44 shows a doublet, the first peak is located at 5.3 V (Li/Li+), the second
one is located in the reductive half-cycle at 4.6 V (Li//Li+). It has to be stressed that the
amount of moles of gases developed by the overlithiated NMC compound is higher with
respect to the amount of moles of gases developed by stoichiometric NMC phase (see figure
6.14). This implies a safety problem for the cycle life of a lithium-ion battery containing the
overlithiated NMC phase as positive electrode. The safety problem is related to the increase of
the pressure inside the battery, and a possible damage of the case of the battery.

- 122 -
0 5 10 15
x = 0.1 ; CO2
x = 0 ; CO2
x = 0.1 ; O2
t / h
J 32 1.0
x = 0 ; O2
J 32
35.0
J 44
15.0
J 44
50.0
2.5
4.0
5.5U
E
Figure 6.14: Comparative plot of the analyzed mass signal intensities Jm (nA g-1) (see paragraph 2.3) for the
stoichiometric and overlithiated NMC compounds in 1M LiPF6, EC:DMC (1:1 by wt.) electrolyte.

- 123 -
In figure 6.15 the mass signal cyclic voltammogramm (MSCV) and the cyclic
voltammogram (CV) for the stoichiometric NMC compound in the first cycle is shown. The
specific current, im, is reported for the CV and the amount of moles of gas i generated in the
unit time, n(i), is reported for the MSCV. The amount of moles of gas i generated in the unit
time is obtained by multiplying the total amount of moles in the gaseous phase flowing
through the system and the molar fraction of the gas i in the flux. The molar fraction of the
gas i in the flux is obtained by the ratio between the analyzed mass signal intensity Jm and the
sensibility factor of the gas i for the mass number m, Si,m (see paragraph 2.3). The value of Jm
was obtained with the procedure of calibration explained in paragraph 2.3.
2.5 4.0 5.5-0.3
-0.2
-0.1
0.0
0.1
0.2
0.3 i
m
UE vs. Li/Li+ / V
i m /
A g
-1
0.00
2.50x10⁻⁵
n(O2)
n(CO2) n / m
mol s
-1 g-1
Figure 6.15: First cycle CV and MSCV of O2 and CO2 at 0.2 mV s -1 of the stoichiometric NMC compound in
1M LiPF6, EC:DMC (1:1 by wt.) electrolyte.
From the MSCV it is observed that the onset of the CO2 evolution in the stoichiometric
NMC compound is located at 4.35 V (Li/Li+). The CO2 evolution signal has two peaks: the
first is located at 4.85 V (Li/Li+) in the oxidative half cycle; the second peak is located at
4.85 V (Li/Li+) in the reductive half cycle. The time delay between the generation of the gas
in the cell and the detection in the mass spectrometer is equal to 16 seconds, which
corresponds to a potential shift of circa 3 mV. A third peak is observed in the low potential

- 124 -
region of the reductive half cycle; the peak is located at 2.6 V (Li/Li+). The origin was not yet
identified but it is believed to be due to release of CO2 trapped in the pores of the electrode.
The total amount of CO2 produced in the first cycle is equal to 0.185 mmol per gram of active
material. No oxygen is detected for the stoichiometric NMC compound.
2.5 4.0 5.5-0.3
-0.2
-0.1
0.0
0.1
0.2
0.3
im
UE vs. Li/Li+ / V
i m /
A g
-1
0.00
1.50x10⁻⁴
n(O2)
n(CO2)
n / mm
ol s-1 g
-1
Figure 6.16: First cycle CV and MSCV of O2 and CO2 at 0.2 mV s -1 of the overlithiated NMC compound in 1M
LiPF6, EC:DMC (1:1 by wt.) electrolyte.
In figure 6.16 MSCV and CV for the overlithiated NMC compound in the first cycle is
shown. From the MSCV it is observed that the onset of the CO2 evolution in the overlithiated
NMC compound is located at 4.35 V (Li/Li+); it corresponds to the onset of the CO2 evolution
in the stoichiometric NMC compound. The CO2 evolution signal has two peaks: the first is
located at 5.3 V (Li/Li+) in the oxidative half cycle; the second peak is located at 4.6 V
(Li/Li+) in the reductive half cycle. Again, a third peak is observed in the low potential region
of the reductive half cycle at 2.6 V (Li/Li+). The total amount of CO2 produced in the first
cycle is equal to 1.01 mmol per gram of overlithiated NMC compound.
The onset of the O2 evolution in the overlithiated NMC phase is located at 4.7 V
(Li/Li+); the generation of O2 starts after the generation of CO2. The O2 evolution signal has a

- 125 -
single peak, than the signal drops to 0; the peak is located at 5.1 V (Li/Li+) in the oxidative
half cycle. The total amount of O2 produced in the first cycle is equal to 0.259 mmol per gram
of active material.
6.5 On the Oxygen Evolution in NMC Compounds
The development of oxygen at high potential in the overlithiated NMC compound was
expected. It was indirectly observed from Dahn et al. on an overlithiated mixed manganese /
nickel oxide by post-mortem X-ray diffraction [68]. The release of oxygen from the structure
of an overlithiated layered oxide is predicted by the balance of charge. The transition metal
ions can be oxidized up to the oxidation state 4. The average oxidation state of the transition
metals in the pristine overlithiated NMC compound is equal to 3.21; after the removal of 0.71
moles of Li+ per mole of overlithiated NMC compound, the transition metals cannot be
oxidized further. The removal of the remaining 0.39 moles of Li+ can be done only by
oxidation of the oxygen ions in the structure of the overlithiated NMC compound; 0.2 moles
of O2- have to be oxidized to compensate the charge flow due to 0.39 moles of Li+ removed
from the structure of the active material. The oxygen radical formed at the interface active
material / electrolyte can react with the electrolyte and generate CO2 or can react with another
O radical and generate directly O2.
Kim et al. [121] have found that the nickel ions are oxidized in the low potential region,
while the cobalt ions oxidation occurs in the potential window 3.9 – 4.7 V (Li/Li+). The
manganese ions in the structure are found in the oxidation state Mn4+. The cobalt ions are in
oxidation state Co3+. In the overlithiated NMC compound synthesized during this PhD work,
63% of the nickel ions are in the oxidation state Ni3+, while 37% in the oxidation state Ni2+.
The removal of 0.41 moles of Li+ is sufficient to oxidize all the nickel ions. The removal of
remaining 0.69 moles of Li+ can be compensated by the oxidation of the cobalt ions or the
oxygen ions. The number of moles of oxygen ions oxidized per mole of active material has to
be included between 0.2 and 0.35.
The total amount of oxygen atoms contained in the gases detected during the DEMS
experiments performed on the overlithiated NMC compound in the electrolyte 1 M LiPF6,
EC:DMC (1:1 by wt.) was equal to 0.23 moles per mole of the active material. The real
amount of oxygen ions oxidized in the structure of the overlithiated NMC and the amount of

- 126 -
oxygen atoms detected by the DEMS are not equal. The electrolyte contains oxygen atoms; a
part of the oxygen contained in CO2 could come from the electrolyte. The DEMS experiment
on the overlithiated NMC compound was therefore repeated using 1 M LiPF6 in acetonitrile
(AcN) as electrolyte. Acetonitrile does not contain oxygen atoms; it is expected that the
development of CO2 is less than in EC:DMC (1:1 by wt.) electrolyte. The cyclic voltammetry
was performed in the potential range 2.0 – 5.3 V (Li/Li+). The scan rate of the cyclic
voltammetry was 0.2 mV s-1. Metallic lithium cannot be used in AcN, the counter and
reference electrode were therefore made of de- intercalated LiFePO4 (Ueq = 3.4 V vs. Li/Li+).
The LiFePO4 was fully de- intercalated in 1 M LiPF6, EC:DMC (1:1 by wt.) electrolyte.
0 5 10 15 20t / h
n(O
2)
125
n(C
O2)
60
2
4
6
UE
Figure 6.17: Comparative plot of the generation of O2 and CO2, n(O2) and n(CO2) respectively (nmol s -1 g-1), for
the overlithiated NMC compounds in 1 M LiPF6, AcN electrolyte.

- 127 -
In figure 6.17 the comparative plot of O2 and CO2 is reported for the overlithiated NMC
compound in 1 M LiPF6, AcN. The development of CO2 and O2 appears only in the first cycle.
The O2 signal shows a single peak located at 5.2 V (LI/Li+). The development of CO2 shows a
doublet; first peak is in the oxidative half cycle at 5.25 V (LI/Li+), the second peak is in the
reductive half cycle at 4.7 V (Li/Li+). A third peak in the CO2 signal is observed in the
oxidative half cycle at 4.0 V (Li/Li+); in this potential window the electrolyte is normally
considered stable. The third peak was never detected in the EC:DMC (1:1 by wt.) electrolyte.
2 4 6-0.3
-0.2
-0.1
0.0
0.1
0.2
0.3 i
m
UE vs. Li/Li+ / V
i m /
A g
-1
0.00
1.50x10⁻⁴
n(O2)
n(CO2) n / m
mol s
-1 g-1
Figure 6.18: First cycle CV and MSCV of O2 and CO2 at 0.2 mV s -1 of the overlithiated NMC compound in
1 M LiPF6, AcN electrolyte.
In figure 6.18 the first cycle of the MSCV and the CV for the overlithiated NMC
compound in 1 M LiPF6, AcN is shown. From the MSCV it is observed that the onset of the
CO2 evolution in the overlithiated NMC compound is located at 4.3 V (Li/Li+); before this
potential a peak is observed, it is very small and located at 4.0 V (Li/Li+). The CO2 evolution
signal has two peaks: the first is located at 5.25 V (Li/Li+) in the oxidative half cycle; the
second peak is located at 4.7 V (Li/Li+) in the reductive half cycle. The total amount of CO2
produced in the first cycle is equal to 0.51 mmol per gram of overlithiated NMC compound; it
is smaller than the total amount of CO2 produced in EC:DMC (1:1 by wt.), as predicted.

- 128 -
The onset of the O2 evolution in the overlithiated NMC phase is located at
4.7 V (Li/Li+); the generation of O2 starts after the generation of CO2. The O2 evolution signal
has a single peak, than the signal drops to 0; the peak is located at 5.2 V (Li/Li+) in the
oxidative half cycle. The total amount of O2 produced in the first cycle is equal to 0.282 mmol
per gram of active material; it is very similar to the total amount of O2 generated in
EC:DMC (1:1 by wt.). The total amount of oxygen detected by the DEMS experiment in AcN
is equal to 0.14 moles per mole of the active material.
The formation of CO2 from acetonitrile is probably obtained by burning completely the
molecule, with formation of CO2, H2O and NOx. A part of the oxygen released from the
structure of the NMC compound could be not detected, and total amount of oxygen detected
by the DEMS experiment is a conservative number; none the less 0.14 moles of O per mole of
the active material is in the order of magnitude of the possible number of moles of oxygen
ions oxidized. NO has mass number 30, and the development of other molecules with the
same mass number from the system are not probable. The intensity of the mass signal 30 was
monitored during the DEMS experiment of the overlithiated NMC compound in 1 M LiPF6,
AcN electrolyte and two peaks in J30 were observed in the same potential window where CO2
is formed; the complete burning of acetonitrile is confirmed by the experiment.
If the formation of 1.5 moles of H2O and 1 mole of NO for each 2 moles of CO2
detected is considered, the total amount of oxygen released by the structure of the
overlithiated NMC compound is equal to 0.20 moles per mole of active material. The
oxidation of 0.20 moles of oxygen ions per mole of active material corresponds to an
irreversible specific charge of circa 117 mAh g-1. The irreversible specific charge in the first
cycle of the HV galvanostatic cycling experiments for the overlithiated NMC compound is
equal to 114 mAh g-1. The irreversible specific charge in the overlithiated NMC compound is
due to the oxidation of the oxygen ions in the structure and reaction of the oxygen radicals
with the electrolyte.
The overlithiated NMC compound seems to release oxygen and to react with the
electrolyte only in the first cycle; the oxidation of the electrolyte (evidenced by the CO2
evolution) is somehow inhibited, in contrast to the stoichiometric material. A surface film
composed of electrolyte oxidation products and/or changed surface properties of the NMC
oxide due to the oxygen loss is believed to be the reason for the non-detection of the CO2

- 129 -
development in the second cycle. The inhibition of the oxidation of the electrolyte after the
first cycle seems to be independent from the electrolyte used; both AcN and EC:DMC have
shown this characteristic. It is believed that a surface film based on nickel, manganese and
cobalt oxide, formed during the release of oxygen radicals, is the reason for the inhibition of
the oxidation of the electrolyte at high voltage in the following cycles.


- 131 -
Conclusions and Outlook
The main goal of this PhD thesis work was to develop the differential electrochemical
mass spectrometry (DEMS) technique and the electrochemical impedance spectroscopy (EIS)
technique further, for the study of the electro-catalytic properties of the active materials used
in both positive and negative electrodes of lithium-ion batteries; in particular graphite and
Li1+x(Mn1/3Ni1/3Co1/3)1-xO2 compounds were deeply investigated as active materials for
negative and positive electrodes, respectively.
During the PhD work, the sensitivity of the DEMS technique to gas evolution was
enhanced thanks to the development of a new experimental setup, able to decrease the
influence of the vapors of the electrolyte in the measurements, and of a mathematical tool for
the subtraction of the background from the measured mass signals. A new cell was developed,
with the implementation of a third electrode, which was used as reference electrode during the
measurements. Several theoretical models were developed for describing the electrochemical
processes occurring in the lithium-ion battery; in particular models describing porous
electrodes, transport in pores, and the intercalation mechanisms were developed for
understanding and fitting the EIS data. A new three-electrode symmetric cell was developed
for the EIS measurements, to make the experimental setup nearer to the mathematical models.
An analytical tool was developed for the Kramers-Kronig analysis of the EIS data.
Despite of the many advantages of graphite as active material for negative electrodes in
lithium-ion batteries (high reversible specific charge, low cost, environmentally friendly), the
graphite particles need the formation of a solid electrolyte interphase (SEI) to protect the
graphite surface from exfoliation, a process which destroys the surface of graphite, lowering
the cycle life and the performances of the lithium-ion battery. Moreover, the kinetic
limitations of the electrodes based on graphite particles were investigated for different types
of graphite, aiming to increase the specific power of the lithium-ion battery.
The DEMS technique was used to investigate the formation of the SEI on the graphite
particles in a standard electrolyte, composed by 1 M LiPF6, EC:DMC (1:1 by wt.). During the

- 132 -
formation of the SEI, the development of several gasses was observed. In particular, ethylene,
hydrogen and CO2 were observed. It was the first time CO2 to be observable in DMC
containing electrolyte, during the reductive SEI formation, even if its development was
theoretically predicted before. The small amount of CO2 developed was completely covered
by the background noise, and it was observed thanks to both the increased resolution of the
mass spectrometer and the subtraction of the background intensity in the mass signals.
The EIS technique was used to study the kinetic limitations of the electrodes based on
graphite, with particular emphasis on the effects of porosity and electrolyte resistance. It was
observed that the electrochemical process occurring at the surface of the graphite particles
before the formation of the SEI is an adsorption process. Moreover, it looks like the standard
adsorption model could not explain the EIS data for all the types of graphite. Other models
were used to fit the impedance data. It was found out that the only plausible electrochemical
process describing the EIS data for all types of graphite particles is an adsorption through
surface states. It was also observed that the limitations due to the pore structure in electrodes
based on graphite are dependent on the size of the particles; in particular, the smaller the
graphite particle, the higher is the resistance of the pores.
During the PhD work, it was observed that the irreversible specific charge of the
electrodes based on graphite particles is dependent on the areal density of the electrode. In
particular, the higher the areal density, the smaller the irreversible specific charge. A new cell,
called multiple-working-electrode (MWE) cell, was designed, for the study of the current
density distribution along the thickness of the graphite electrode. Using the MWE cell, it was
observed that the layer of graphite nearer to the counter electrode has the higher value of
irreversible specific charge, and the value decreases in the farer layers. A hypothesis for
explaining this behavior of the graphite electrodes was formulated. The hypothesis is based on
the polarizability of the SEI layer when the graphite particle is fully charged with Li+. When
the SEI layer is polarized, the electrons can pass through it and reduce the electrolyte. The
reduction of the electrolyte, being an irreversible process, causes the increase of the
irreversible specific charge.
Among the active materials for positive electrodes in lithium-ion battery studied as
possible substitutes of the LiCoO2, the family of Li1+x(Mn1/3Ni1/3Co1/3)1-xO2 compounds,
called NMC compounds, seems to be one of the most promising. From the standard
- 133 -
electrochemical experiments, which include galvanostatic cycling and cyclic voltammetry, an
irreversible oxidative process in the high voltage region, near 4.5 V (Li/Li+) was observed.
This irreversible process consumes more specific charge the higher the value of x in the NMC
compound is. DEMS measurements in 1 M LiPF6, EC:DMC (1:1 by wt.) electrolyte have
shown that for x = 0, CO2 is developed in the high voltage region in the first and subsequent
cycles; for x = 0.1 CO2 and O2 were observed in the high voltage region, both produced only
during the first cycle. Further DEMS experiments in 1 M LiPF6, AcN electrolyte for the x =
0.1 NMC compound have shown again the development of CO2 and O2 only in the first cycle.
The experiments confirmed that the oxygen can come only from the structure of the NMC
compound. Quantification of the amount of gas developed result in the loss of 0.2 moles of
oxygen ions per mole of NMC compound, which can be also predicted theoretically from the
NMC formula. The irreversible specific charge due to the oxygen loss and the irreversible
specific charge observed in galvanostatic cycling experiments in the first cycle coincide
within the 5% difference.
Suggestions for future work include the development of enhanced intercalation models
which can consider the presence of the SEI and the energetical distribution of adsorption
states and intercalation states in the active materials used in the electrodes of lithium-ion
batteries. The development of a more sophisticated model for the transport of lithium in the
active material is also suggested, for a better explanation of the low frequency behavior of the
EIS data of intercalating electrodes. A better insight in the DEMS data acquired for graphite
samples could help in the understanding of the SEI formation process. DEMS could also be
used to prove the thickening of the SEI in the low potential region, which causes the increase
of the irreversible specific charge in graphite electrodes. Even if the release of oxygen from
the structure of NMC compounds was proven and quantified during this PhD work, for
increasing the performances of the lithium-ion battery it could be interesting to verify if the
oxygen ions are coming from the bulk structure or the surface of the NMC particles and if the
oxygen release is related to the formation of another compound SEI-like at the surface of the
NMC particle.


- 135 -
Bibliography
[1] T. Ohzuku, Y. Makimura, Chemistry Letters (2001) 642-643.
[2] M. Yoshio, H. Noguchi, J. Itoh, M. Okada, T. Mouri, J. Power Sources 90 (2000) 176-
181.
[3] Z. Liu, A. Yu, J.Y. Lee, J Power Sources 81-82 (1999) 416-419.
[4] A.K. Padhi, K.S. Nanjundaswamy, J.B. Goodenough, J. Electrochem. Soc. 144 (1997)
1188-1194.
[5] R. Nesper, Prog. Solid State Chem. 20 (1990) 1-45.
[6] H. Buqa, R.I.R. Blyth, P. Golob, B. Evers, I. Schneider, M.V.S. Alvarez, F. Hofer, F.P.
Netzer, M.G. Ramsey, M. Winter, J.O. Besenhard, Ionics 6 (2000) 172-179.
[7] H. Buqa, P. Golob, M. Winter, J.O. Besenhard, J. Power Sources 97-98 (2001) 122-
125.
[8] H. Buqa, C. Grogger, M.V.S. Alvarez, J.O. Besenhard, M. Winter, J. Power Sources
97-98 (2001) 126-128.
[9] D. Goers, H. Buqa, L. Hardwick, A. Wuersig, P. Novák, Ionics 9 (2003) 258-265.
[10] M.E. Spahr, H. Wilhelm, T. Palladino, N. Dupont-Pavlovsky, D. Goers, F. Joho, P.
Novák, J. Power Sources 119-121 (2003) 543-549.
[11] R. Fong, U. Vonsacken, J.R. Dahn, J. Electrochem. Soc. 137 (1990) 2009-2013.
[12] R. Kanno, Y. Kawamoto, Y. Takeda, S. Ohashi, N. Imanishi, O. Yamamoto, J.
Electrochem. Soc. 139 (1992) 3397-3404.
[13] M. Winter, P. Novák, A. Monnier, J. Electrochem. Soc. 145 (1998) 428-436.
[14] M. Schmidt, U. Heider, A. Kuehner, R. Oesten, M. Jungnitz, N. Ignat' ev, P. Sartori, J.
Power Sources 97-98 (2001) 557-560.
[15] M. Winter, R.J. Brodd, Chem. Rev. 104 (2004) 4245-4269.
- 136 -
[16] K. Brandt, J. Power Sources 18 (1986) 117-125.
[17] K. Brandt, J. Power Sources 17 (1986) 153-159.
[18] M.S. Whittingham, Science 192 (1976) 1126-1127.
[19] M.S. Whittingham, Chem. Rev. 104 (2004) 4271-4301.
[20] K. Brandt, Solid State Ionics 69 (1994) 173-183.
[21] K. Xu, Chem. Rev. 104 (2004) 4303-4417.
[22] R. Selim, P. Bro, J. Electrochem. Soc. (1974) 1457-1459.
[23] R.D. Rauh, S.B. Brummer, Electrochim. Acta 22 (1977) 75-83.
[24] V.R. Koch, J.H. Young, J. Electrochem. Soc. 125 (1978) 1371-1377.
[25] I. Yoshimatsu, T. Hirai, J. Yamaki, J. Electrochem. Soc. 135 (1988) 2422-2427.
[26] M. Winter, J.O. Besenhard, M.E. Spahr, P. Novák, Adv. Mater. 10 (1998) 725-763.
[27] J.O. Besenhard, H.P. Fritz, Angew. Chem.-Int. Edit. Engl. 22 (1983) 950-975.
[28] J.R. Dahn, Phys. Rev. B 44 (1991) 9170-9177.
[29] J.O. Besenhard, J. Yang, M. Winter, J. Power Sources 68 (1997) 87-90.
[30] R.A. Huggins, J. Power Sources 22 (1988) 341-350.
[31] R.A. Huggins, J. Power Sources 26 (1989) 109-120.
[32] J. Yang, M. Winter, J.O. Besenhard, Solid State Ionics 90 (1996) 281-287.
[33] R. Nesper, Angew. Chem.-Int. Edit. Engl. 30 (1991) 789-817.
[34] A.N. Mansour, J. McBreen, C.A. Melendres, J. Electrochem. Soc. 146 (1999) 2799-
2809.
[35] B.A. Boukamp, G.C. Lesh, R.A. Huggins, J. Electrochem. Soc. 128 (1981) 725-729.
[36] A.A. Anani, S. Crouchbaker, R.A. Huggins, J. Electrochem. Soc. 135 (1988) 2103-
2105.
[37] Y. Idota, Y. Mineo, A. Matsufuji, T. Miyasaka, Denki Kagaku 65 (1997) 717-722.
[38] Y. Idota, T. Kubota, A. Matsufuji, Y. Maekawa, T. Miyasaka, Science (Washington,
D.C.) 276 (1997) 1395-1397.

- 137 -
[39] O. Mao, R.A. Dunlap, J.R. Dahn, J. Electrochem. Soc. 146 (1999) 405-413.
[40] O. Mao, J.R. Dahn, J. Electrochem. Soc. 146 (1999) 414-422.
[41] O. Mao, J.R. Dahn, J. Electrochem. Soc. 146 (1999) 423-427.
[42] M.M. Thackeray, Journal of the American Ceramic Society 82 (1999) 3347-3354.
[43] T. Ohzuku, A. Ueda, N. Yamamoto, J. Electrochem. Soc. 142 (1995) 1431-1435.
[44] L.J. Hardwick, M. Holzapfel, P. Novak, L. Dupont, E. Baudrin, Electrochim. Acta 52
(2007) 5357-5367.
[45] M. Winter, J.O. Besenhard, J.H. Albering, J. Yang, M. Wachtler, Prog Batteries
Battery Mater 17 (1998) 208-213.
[46] M.S. Whittingham, F.R. Gamble, Materials Research Bulletin 10 (1975) 363-371.
[47] G.L. Holleck, J.R. Driscoll, Electrochim. Acta 22 (1977) 647-655.
[48] M.S. Whittingham, J. Electrochem. Soc. 123 (1976) 315-320.
[49] C.R. Walk, J.S. Gore, J. Electrochem. Soc. 122 (1975) C68-C68.
[50] P.G. Dickens, S.J. French, A.T. Hight, M.F. Pye, Materials Research Bulletin 14
(1979) 1295-1299.
[51] C. Delmas, H. Cognacauradou, J.M. Cocciantelli, M. Menetrier, J.P. Doumerc, Solid
State Ionics 69 (1994) 257-264.
[52] D.W. Murphy, P.A. Christian, F.J. Disalvo, J.N. Carides, J. Electrochem. Soc. 126
(1979) 497-499.
[53] J.O. Besenhard, R. Schöllhorn, J. Power Sources 1 (1976) 267.
[54] R. Schollhorn, F. Kleinreesink, R. Re imold, J. Chem. Soc.-Chem. Commun. (1979)
398-399.
[55] K. Ozawa, Solid State Ionics 69 (1994) 212-221.
[56] G.G. Amatucci, J.M. Tarascon, L.C. Klein, J. Electrochem. Soc. 143 (1996) 1114-
1123.
[57] I. Saadoune, C. Delmas, J. Solid State Chem. 136 (1998) 8-15.
[58] I. Saadoune, M. Menetrier, C. Delmas, J. Mater. Chem. 7 (1997) 2505-2511.

- 138 -
[59] I. Nakai, T. Nakagome, Electrochem. Solid State Lett. 1 (1998) 259-261.
[60] M.M. Thackeray, Prog Solid State Chem 25 (1997) 1-71.
[61] J.M. Tarascon, W.R. McKinnon, F. Coowar, T.N. Bowmer, G. Amatucci, D.
Guyomard, J. Electrochem. Soc. 141 (1994) 1421-1431.
[62] J.M. Tarascon, E. Wang, F.K. Shokoohi, W.R. McKinnon, S. Colson, J. Electrochem.
Soc. 138 (1991) 2859-2864.
[63] A.R. Armstrong, P.G. Bruce, Nature 381 (1996) 499-500.
[64] F. Capitaine, P. Gravereau, C. Delmas, Solid State Ionics 89 (1996) 197-202.
[65] R. Stoyanova, E. Zhecheva, L. Zarkova, Solid State Ionics 73 (1994) 233-240.
[66] K.M. Shaju, G.V.S. Rao, B.V.R. Chowdari, Electrochim. Acta 48 (2003) 2691-2703.
[67] K.M. Shaju, G.V.S. Rao, B.V.R. Chowdari, Electrochim. Acta 48 (2002) 145-151.
[68] Z.H. Lu, D.D. MacNeil, J.R. Dahn, Electrochem. Solid State Lett. 4 (2001) A191-
A194.
[69] C.W. Lee, Y.K. Sun, J. Prakash, Electrochim. Acta 49 (2004) 4425-4432.
[70] N. Tran, L. Croguennec, C. Labrugere, C. Jordy, P. Biensan, C. Delmas, J.
Electrochem. Soc. 153 (2006) A261-A269.
[71] A. Yamada, S.C. Chung, K. Hinokuma, J. Electrochem. Soc. 148 (2001) A224-A229.
[72] S.Y. Chung, J.T. Bloking, Y.M. Chiang, Nat. Mater. 1 (2002) 123-128.
[73] H. Huang, S.C. Yin, L.F. Nazar, Electrochem. Solid State Lett. 4 (2001) A170-A172.
[74] E. Peled, J. Electrochem. Soc. 126 (1979) 2047-2051.
[75] M. Ue, S. Mori, J. Electrochem. Soc. 142 (1995) 2577-2581.
[76] R.J. Blint, J. Electrochem. Soc. 142 (1995) 696-702.
[77] D. Aurbach, Y. Ein-Eli, B. Markovsky, A. Zaban, S. Luski, Y. Carmeli, H. Yamin, J.
Electrochem. Soc. 142 (1995) 2882-2890.
[78] D. Aurbach, Y. Einely, A. Zaban, J. Electrochem. Soc. 141 (1994) L1-L3.
[79] R. Jasinski, S. Carroll, J. Electrochem. Soc. 117 (1970) 218-219.

- 139 -
[80] V.R. Koch, J.L. Goldman, C.J. Mattos, M. Mulvaney, J. Electrochem. Soc. 129 (1982)
1-4.
[81] J.Y. Song, Y.Y. Wang, C.C. Wan, J. Power Sources 77 (1999) 183-197.
[82] H.T. Huang, S.L. Wunder, J. Electrochem. Soc. 148 (2001) A279-A283.
[83] J. Koryta, J. Dvorák, Principles of Electrochemistry, John Wiley & Sons, 1987.
[84] J. Newman, K.E. Thomas-Alyea, Electrochemical Systems, Wiley-Interscience, 2004.
[85] C.A. Mc Dowell, Mass Spectrometry, McGraw-Hill, 1963.
[86] E. Barsoukov, J.R. Macdonald, Impedance Spectroscopy: Theory, Experiment, and
Applications, Wiley-Interscience, 2005.
[87] M. Cimenti, A.C. Co, V.I. Birss, J.M. Hill, Fuel Cells 7 (2007) 364-376.
[88] B.A. Boukamp, Tech. Mess. 71 (2004) 454-459.
[89] M.D. Levi, D. Aurbach, J. Phys. Chem. B 101 (1997) 4630-4640.
[90] R. Huang, F. Chung, E.M. Kelder, J. Electrochem. Soc. 153 (2006) A1459-A1465.
[91] J.P. Meyers, M. Doyle, R.M. Darling, J. Newman, J. Electrochem. Soc. 147 (2000)
2930-2940.
[92] H.C. Shin, S.I. Pyun, Electrochim. Acta 45 (1999) 489-501.
[93] H.C. Shin, S.I. Pyun, Electrochim. Acta 44 (1999) 2235-2244.
[94] V.S. Dabniel-Bekh, Zhurnal fizicheskoi Khimii SSSR 22 (1948) 697-710.
[95] J. Euler, W. Nonnenmacher, Electrochim. Acta 2 (1960) 268-286.
[96] J.S. Newman, C.W. Tobias, J. Electrochem. Soc. 109 (1962) 1183-1191.
[97] R. de Levie, Electrochim. Acta 8 (1963) 751-780.
[98] R. de Levie, Electrochim. Acta 9 (1964) 1231-1245.
[99] R. de Levie, Electrochim. Acta 10 (1965) 113-130.
[100] K. Eloot, F. Debuyck, M. Moors, A.P. Vanpeteghem, J. Appl. Electrochem. 25 (1995)
326-333.

- 140 -
[101] K. Eloot, F. Debuyck, M. Moors, A.P. Vanpeteghem, J. Appl. Electrochem. 25 (1995)
334-339.
[102] L.M. Gassa, J.R. Vilche, M. Ebert, K. Juttner, W.J. Lorenz, J. Appl. Electrochem. 20
(1990) 677-685.
[103] H.K. Song, Y.H. Jung, K.H. Lee, L.H. Dao, Electrochim. Acta 44 (1999) 3513-3519.
[104] R. Darby, J. Electrochem. Soc. 113 (1966) 392-396.
[105] R. Darby, J. Electrochem. Soc. 113 (1966) 496-500.
[106] A. Wuersig, W. Scheifele, P. Novák, J. Electrochem. Soc. 154 (2007) A449-A454.
[107] P. Novák, D. Goers, L. Hardwick, M. Holzapfel, W. Scheifele, J. Ufheil, A. Würsig, J.
Power Sources 146 (2005) 15-20.
[108] F. La Mantia, J. Vetter, P. Novák, Electrochim. Acta 53 (2008) 4109-4121.
[109] T. Gustafsson, J.O. Thomas, R. Koksbang, G.C. Farrington, Electrochim. Acta 37
(1992) 1639-1643.
[110] F. Rosciano, M. Holzapfel, H. Kaiser, W. Scheifele, P. Ruch, M. Hahn, R. Kotz, P.
Novak, Journal of Synchrotron Radiation 14 (2007) 487-491.
[111] E. Peled, D. Bar Tow, A. Merson, A. Gladkich, L. Burstein, D. Golodnitsky, J. Power
Sources 97-98 (2001) 52-57.
[112] F. Joho, B. Rykart, A. Blome, P. Novák, H. Wilhelm, M.E. Spahr, J. Power Sources
97-98 (2001) 78-82.
[113] H. Buqa, A. Würsig, A. Goers, L.J. Hardwick, M. Holzapfel, P. Novák, F. Krumeich,
M.E. Spahr, J. Power Sources 146 (2005) 134-141.
[114] Z. Hens, W.P. Gomes, J. Phys. Chem. B 103 (1999) 130-138.
[115] P. Novák, F. Joho, M. Lanz, B. Rykart, J.C. Panitz, D. Alliata, R. Kötz, O. Haas, J.
Power Sources 97-98 (2001) 39-46.
[116] F. Joho, P. Novák, O. Haas, A. Monnier, F. Fischer, Mol Cryst Liq Cryst Sci Technol,
Sect A 310 (1998) 383-388.
[117] J.M. Vollmer, L.A. Curtiss, D.R. Vissers, K. Amine, J. Electrochem. Soc. 151 (2004)
A178-A183.

- 141 -
[118] M. Winter, R. Imhof, F. Joho, P. Novák, J. Power Sources 81-82 (1999) 818-823.
[119] J. Vetter, M. Holzapfel, A. Würsig, W. Scheifele, J. Ufheil, P. Novák, J. Power
Sources 159 (2006) 277-281.
[120] Z.H. Lu, J.R. Dahn, J. Electrochem. Soc. 149 (2002) A815-A822.
[121] J.M. Kim, H.T. Chung, Electrochim. Acta 49 (2004) 937-944.


- 143 -
List of Symbols
Ap cross sectional area of the pore [cm2]
Ap,m cross sectional area of the m-th lateral pore [cm2]
a characteristic length of the pore [cm]
am characteristic length of the m-th lateral pore [cm]
bm distance between two lateral pores [cm]
C1 capacitance of the double layer in the outer Helmholtz plane [F cm-2]
C2 capacitance of the double layer in the inner Helmholtz plane [F cm-2]
Cdl capacitance of the double layer at the interface [F cm-2]
Cav,i average concentration of species i in the cross section of the pore [mol cm-3]
Ci concentration of species i in the electrolyte inside pores [mol cm-3]
CS,i concentration of species i in the bulk electrolyte [mol cm-3]
Cw,i concentration of species i in at the wall of the pore [mol cm-3]
Cε concentration of Li+ at the reacting interface [mol cm-3]
Di diffusion coefficient of species i [cm2 s-1]
F Faraday constant [C mol-1]
G generation term of lithium in the solid phase [mol cm-3 s-1]
I current intensity of the electrochemical processes [A]
Im current intensity of the electrochemical processes [A]
inside the m-th lateral pore
I' current intensity in the electrolyte inside pores [A]
I'T,m total current intensity in the electrolyte inside the m-th lateral pore [A]
I" current intensity in the solid phase [A]
I"T,m total current intensity in the solid phase inside the m-th lateral pore [A]
IT total current intensity of the electrochemical processes [A]
i current density due to electrochemical processes [A cm-2]
Jβ transport of lithium in the solid phase [mol cm-2 s-1]
j imaginary unit, 1− [-]

- 144 -
k coefficient defined by eq. (3.47) [-]
k1,O kinetic constant of the oxidation of the adsorption step (3.1) [s-1]
k1,O,0 kinetic constant of the oxidation of the adsorption step at ∆ϕ1 = 0 [s-1]
k1,R kinetic constant of the reduction of the adsorption step (3.1) [s-1]
k1,R,0 kinetic constant of the reduction of the adsorption step at ∆ϕ1 = 0 [s-1]
k1,θ parameter defined by eq. (3.14) [A cm-2]
k2,O kinetic constant of the oxidation of the intercala tion step (3.2) [s-1]
k2,O,0 kinetic constant of the oxidation of the intercalation step at ∆ϕ2 = 0 [s-1]
k2,R kinetic constant of the reduction of the intercalation step (3.2) [s-1]
k2,R,0 kinetic constant of the reduction of the intercalation step at ∆ϕ2 = 0 [s-1]
k2,θ parameter defined by eq. (3.14) [A cm-2]
Kβ parameter defined by eq. (3.17) [A cm-2]
kβ parameter defined by eq. (3.14) [A cm-2]
Kε parameter defined by eq. (3.17) [A cm mol-1]
kε parameter defined by eq. (3.14) [A cm mol-1]
L length of the pore [cm]
Lm length of the m-th lateral pore [cm]
N number of pores [-]
Ni number of adsorbing sites [mol cm-3]
Nσ number of intercalating sites [mol cm-3]
Pp perimiter of the cross section of the pore [cm]
R universal gas constant [J mol-1 K-1]
R1 resistance of the adsorbing step (3.1), defined by eq. (3.14) [Ω cm2]
R2 resistance of the intercalating step (3.2), defined by eq. (3.14) [Ω cm2]
RS electrolyte resistance outside the pores [Ω]
RU uncompensated resistance, defined by eq. (3.24) [Ω]
r1 rate of reaction of the adsorption step (3.1) [mol cm-3 s-1]
r2 rate of reaction of the intercalation step (3.2) [mol cm-3 s-1]
T absolute temperature [K]
t time [s]
Z impedance of the reacting site [Ω cm2]
- 145 -
Zad impedance of the adsorption reaction [Ω cm2]
ZI impedance of the intercalation reaction [Ω cm2]
ZP impedance of the porous electrode [Ω]
α parameter defined by eq. (3.37) [-]
β occupancy of the intercalating sites [-]
β0 occupancy of the intercalating sites at the interface [-]
βav average occupancy of the intercalating [-]
Γ parameter defined as δ1(1-γ) [-]
γ parameter defined by eq. (3.9) [-]
γi parameter defined by eq. (3.9) [-]
∆ϕ potential drop at the interface electrode/electrolyte [V]
∆ϕ'ohm ohmic potential drop in the electrolyte [V]
∆ϕ"ohm ohmic potential drop in the solid phase [V]
∆ϕm potential drop at the interface electrode/electrolyte [V]
inside the m-th lateral pore
∆ϕ1 potential drop influencing the adsorption step (3.1) [V]
∆ϕ2 potential drop influencing the intercalation step (3.2) [V]
∆ϕi potential drop in the inner Helmholtz plane [V]
∆ϕP total potential drop in the porous electrode [V]
∆ϕT total potential drop at the interface [V]
δ1 average state of charge of the lithium in the inner Helmholtz layer [-]
δ2 average state of charge of the lithium in the solid phase [-]
θ occupancy of the adsorbing sites [-]
κ function defined by eq. (3.37) [-]
κ' function defined by eq. (3.38) [-]
λ jumping distance [cm]
Ξi coefficient defined by eq. (3.43) [-]
Ξ'i approximated value of Ξi [-]
ξ i coefficient defined by eq. (3.44) [-]
ξ 'i approximated value of Ξi [-]

- 146 -
ρ resistivity defined by eq. (3.37) [Ω cm]
ρE average resistivity of the solid phase [Ω cm]
ρS resistivity of the electrolyte inside pores [Ω cm]
τ time constant of the adsorption, defined by eq. (3.15) [s]
τD,i time constant of diffusion of species i [s]
ω angular frequency [s-1]

Fabio La Mantia
Personal Information
Citizenship: Italian Birthdate: August 25, 1980 – Brunico, Bolzano, Italy Marital Status: Single Languages: Italian (mother language), English (fluent), German (fluent) Residence: Landstrasse 54, CH-5412 Gebenstorf, Switzerland Contact: mobile phone: +41 79 630 6326 email: [email protected]
Education
Jun 2005 – Present Paul Scherrer Institut and Villigen, Switzerland
Swiss Federal Institute of Technology Zürich, Switzerland Doctoral work in electrochemistry laboratory. Doctoral Thesis: Characterization of Electrodes for Lithium-Ion Batteries through Electrochemical Impedance Spectroscopy and Mass Spectrometry (Prof. Dr. R. Nesper and PD Dr. P. Novák).
Sep 1999 – Nov 2004 Università degli Studi di Palermo Palermo, Italy
Degree in Chemical Engineeering (Majors in Materials Science) with marks 110/110 cum laude and award for thesis work and career, released from Chemical Engineering Department Diploma Thesis: Characterization of Thin Amorphous Semiconducting Films by EIS and Differential Admittance (Prof. Dr. F. Di Quarto and Dr. M. Santamaria ).
Work Experience
Nov 2004 – May 2005 Chemical Engeenering Department, UNIPA Palermo, Italy
Laboratory Assistant • Study of the effect of thickness on the electronic properties of anodic valve metal
oxides

Teaching Experience
Jun 2005 – Present Chemistry Department, ETHZ Zürich, Switzerland
Teaching Assistan t • Teaching assistant for course in Technical Electrochemistry, 5th semester. • Teaching assistant for laboratory training (water electrolysis).
Awards
15 Sep 2005 Division of Electrochemistry, SCI Spoleto , Italy
Award dedicated to the memory of prof. Bruno Mazza for diploma thesis : Characterization of Thin Amorphous Semiconducting Films by EIS and Differential Admittance
Extracurricular Activities
Sep 2002 – May 2005 Hayashi ha Shitoryu Karate-do, Mitsuya-Kai Palermo, Italy
Teaching Assistant • Teaching assistant for Karate-do children course
Hobbies include : modern literature, jogging, karate-do, and modeling.
References
Professor Reinhard Nesper (Advisor of PhD work) ETH Zürich, Inorganic Chemistry Laboratory ph.: +41 44 632 3069 email: [email protected] PD Dr. Petr Novák (Supervisor of PhD work) Paul Scherrer Institut, Electrochemistry Laboratory ph.: +41 56 310 2457 email: [email protected] Professor Francesco Di Quarto (Advisor of diploma work) Università degli Studi di Palermo, Electrochemistry Laboratory ph.: +39 091 656 7228 email: [email protected]

25 June 2008
List of publications
Fabio La Mantia
Peer-reviewed publications
1. F. La Mantia, P. Novák, “On-Line detection of reductive CO2 development at graphite electrodes
in the 1 M LiPF6, EC:DMC battery electrolyte”, Electrochemical and Solid-State Letters 11,
A84-A87 (2008).
2. A. R. Armstrong, D. W. Tee, F. La Mantia, P. Novák, P. G. Bruce, “Synthesis of tetrahedral
LiFeO2 and its behavior as a cathode in rechargeable lithium batteries”, Journal of the American
Chemical Society 130, 3554-3559 (2008).
3. F. La Mantia, F. Rosciano, N. Tran, P. Novák, “Direct evidence of oxygen evolution from
Li1+x(Ni1/3Mn1/3Co1/3)1-xO2 at high potentials”, Journal of Applied Electrochemistry 38, 893-896
(2008).
4. F. La Mantia, J. Vetter, P. Novák, “Impedance spectroscopy on porous materials: A general model
and application to graphite electrodes of lithium-ion batteries”, Electrochimica Acta 53, 4109-
4121 (2008).
5. F. Di Quarto, F. La Mantia, M. Santamaria, “Recent advances on physico-chemical characterization
of passive films by EIS and differential admittance techniques”, Corrosion Science 49, 186-194
(2007).
6. F. Di Quarto, F. La Mantia, M. Santamaria, “Physicochemical characterization of passive films on
niobium by admittance and electrochemical impedance spectroscopy studies”, Electrochimica Acta
50, 5090-5102 (2005).
Contributions to books
1. F. Di Quarto, F. La Mantia, M. Santamaria, “Amorphous semiconducting passive film-electrolyte
junctions revisited. The influence of a non homogeneous density of state on the differential admittance
behaviour of anodic a-Nb2O5”, Passivation of Metals and Semiconductors, and Properties of Thin
Oxide Layers, P. Marcus and V. Maurice (Editors), Elsevier, 343-348 (May 2006).

Conference talks
1. F. La Mantia, F. Rosciano, N. Tran, P. Novák, “Oxygen evolution from Li1+x(Ni1/3Mn1/3Co1/3)1-
xO2 at high potentials”, 213th ECS Meeting - Phoenix (Arizona) (2008).
2. F. La Mantia, F. Rosciano, N. Tran, P. Novák, “Direct evidence of oxygen evolution from
Li1+x(Ni1/3Mn1/3Co1/3)1-xO2 at high potentials”, GEI ERA 2007 - Cagliari (Italy) (2007).
Posters
1. S. H. Ng, F. La Mantia, W. Maerkle, M. E. Spahr, C. Vix-Guterl, P. Novák, “The influence of
electrode density on the electrochemical performance of highly crystalline graphites in Li-ion
batteries”, CARBON’08, Nagano (Japan) (2008).
2. F. Rosciano, F. La Mantia, N. Tran, P. Novák, “An in situ study of the origin of the irreversible
plateau observed at high potentials for the Li1+x(Ni1/3Mn1/3Co1/3)1-xO2 system”, 11th
EuroConference on Science and Technology of Ionics, Batz sur Mer (France) (2007).
3. F. La Mantia, P. Novák, “Simulation of adsorption states on porous electrodes: The effect of
spatial current distribution”, Tagessymposium Elektrochemie 2007, Villigen PSI (Switzerland)
(2007).
4. F. La Mantia, J. Vetter, P. Novák, “Characterization of materials for lithium-ion batteries with EIS,
studied through a coupled partial ion-transfer model”, 1st Symposium Impedanzspektroskopie,
Essen (Germany) (2006).
5. L. Hardwick, F. La Mantia, F. Rosciano, A. Wokaun, P. Novák, “Analytical methods for lithium-
ion battery characterisation”, 1st EMPA PhD Symposium, Dübendorf (Switzerland) (2005).