characterization of drought with climate indices in … · - during period 1982-1983, 93% of...
TRANSCRIPT
CHARACTERIZATION OF DROUGHT WITH CHARACTERIZATION OF DROUGHT WITH CLIMATE INDICES IN AFRICA: CLIMATE INDICES IN AFRICA: Case of Case of
IvoryIvory CoastCoastM. COULIBALY K. M. COULIBALY K. AlamaAlama && DJE K. BernardDJE K. Bernard
SODEXAM / National Meteorological ServiceSODEXAM / National Meteorological ServiceAbidjan Abidjan –– IvoryIvory CoastCoast
PresentedPresented byby::COULIBALY K. AlamaCOULIBALY K. Alama
EE--mailmail: kcoulibaly2@: [email protected]
National Meteorological ServiceClimatology and Agrometeorology
Department
World Meteorological OrganizationCommission for Agricultural
Meteorology
Workshop on drought; Beijing (CHINA), 16-17 February 2009

INTRODUCTION
I. DATA AND METHODS
II. RESULTS AND ANALISYS
III. IMPACTS OF DROUGHT IN IVORY COAST
CONCLUSION AND RECOMMENDATIONS
OUTLINEOUTLINE

INTRODUCTIONINTRODUCTION• Socio-economic development gives rise to
water demand in the world.
• In Africa, since several years, rainfall becamean important element in human activities.
• Scientific studies in Africa (IRD, 1996, 2003; UNEP, 2008; Sultan and Janicot, 2004) show a variation of rainfall in different regions of West Africa. These variations characterizesignificant deficits of rainfall.

• This situation causes regularly droughtslinked to irregular rains in some parts ofAfrica and around the world.
• Face to this threat, scientists agree to studythe evolution and the impacts of drought on activities including agriculture and its relatedfields.
• This is why this work was conducted. Theobjective of the work is to characterizedrought in Ivory Coast using the Standardized Precipitation Index (SPI) and itsimpact on socio-economic activities.

WhatWhat isis thethe problemproblem??• Ivory Coast is a country of forest in the South and
savannah in the North. • The country suffers from rainfall variation observed
several years ago, such as in West and Central Africa.
• This variation is characterized by a decrease ofannual rainfall and a change of onset seasons.
• The high frequency of deficits water affects the ecosystem balance.
• This situation is worsened by the increase ofpopulations who destroy vegetation to createplantations or to grow annual crops; then, wenoticed the appearance of drought in Ivory Coastcaused by the deficit or lack of rainfall, deforestation, extensive agriculture…
• Drought problems have become therefore a national concern.

• Studies conducted by IRD (1996, 2003) show that:– the decrease of rainfall began in the late 1960s, in line
with what has been observed in the Sahel, and intensified during 1980s;
– This drop reached about 20% compared to the rainfall recorded earlier (before 1960) and sometimes values above 25%, especially on the Atlantic coast, confirmingthat wet Africa suffers also an important deficit ofrainfall;
– the analysis of rainfall data from 1896 to 2000 on 21 stations in West Africa indicates:
– drought conditions from 1910 to 1916;conditions from 1910 to 1916;–– wetwet conditions from 1950 to 1967;conditions from 1950 to 1967;– drought conditions from 1970 to 1974 and from
1976 to 1993..
EffectsEffects ofof droughtdrought in West in West AfricaAfrica
I. DATA AND METHODSI. DATA AND METHODS
Abidjan
Yamoussoukro
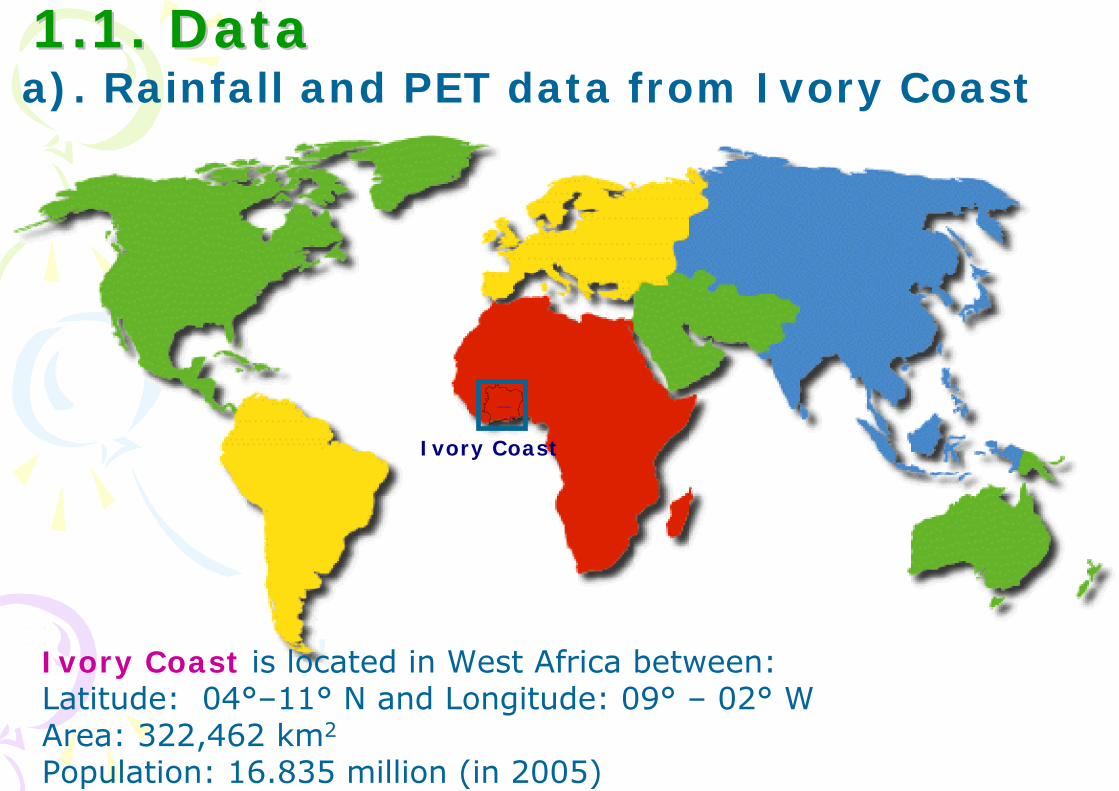
Ivory Coast is located in West Africa between:Latitude: 04°–11° N and Longitude: 09° – 02° WArea: 322,462 km2
Population: 16.835 million (in 2005)
1.1. Data1.1. Dataa). Rainfall and PET data from Ivory Coast
Ivory Coast

- Rainfall and PET data from 14 synoptic stations of IvoryCoast held by meteorologists; Data have no gaps. Howeverthey have been controlled(homogeneous & reliability) with statistic method beforeusing them;
-SST data from Niño 3.4 regionbetween latitude 5°N-5°S et longitude 120°-170°W (Source: NOAA/CPC)
- NMS also have 186 rainfall posts in his meteorological network, where data are collected by non specialists. They were trained to collect and to record data in the meteorological special forms.
-8 -7 -6 -5 -4 -3
5
6
7
8
9
10
KorhogoOdienné
Bondoukou
Bouaké
Daloa
Man
Dimbokro
Yamoussoukro
Gagnoa
AdiakéAbidjan
SassandraSan-Pédro
Tabou
Zone Nord
Zone Centre
Zone Sud-intérieur
Zone Littoral
b). Rainfall, PET and SST data
1.2. 1.2. MethodsMethods
MnPiSPI
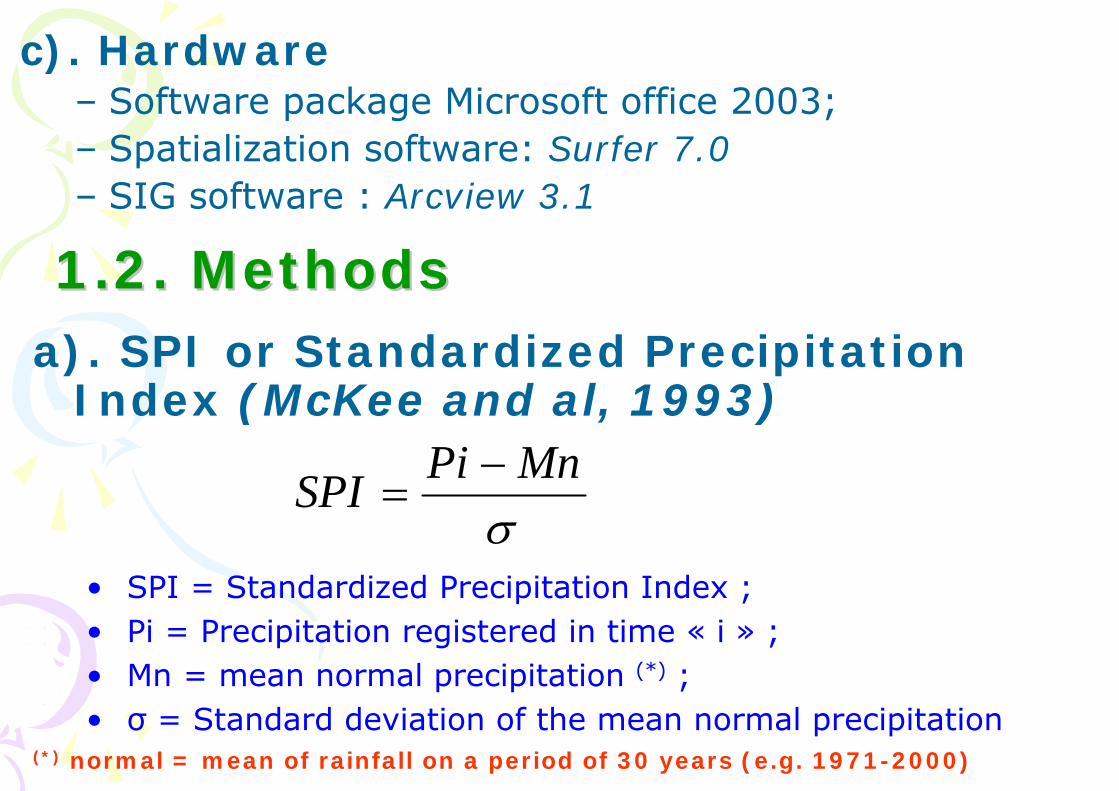
a). SPI or Standardized PrecipitationIndex (McKee and al, 1993)
• SPI = Standardized Precipitation Index ;• Pi = Precipitation registered in time « i » ;• Mn = mean normal precipitation (*) ;• σ = Standard deviation of the mean normal precipitation
(*) normal = mean of rainfall on a period of 30 years (e.g. 1971-2000)
c). Hardware– Software package Microsoft office 2003;– Spatialization software: Surfer 7.0– SIG software : Arcview 3.1
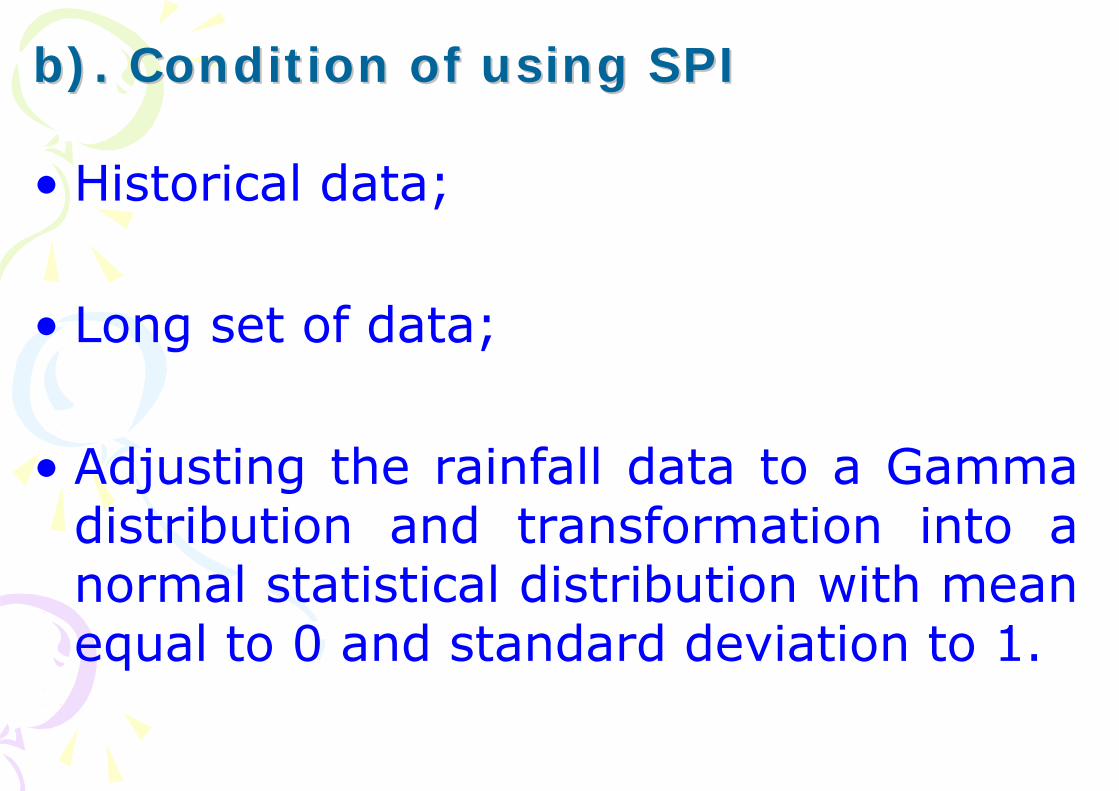
b). Condition of using SPIb). Condition of using SPI
• Historical data;
• Long set of data;
• Adjusting the rainfall data to a Gamma distribution and transformation into a normal statistical distribution with meanequal to 0 and standard deviation to 1.
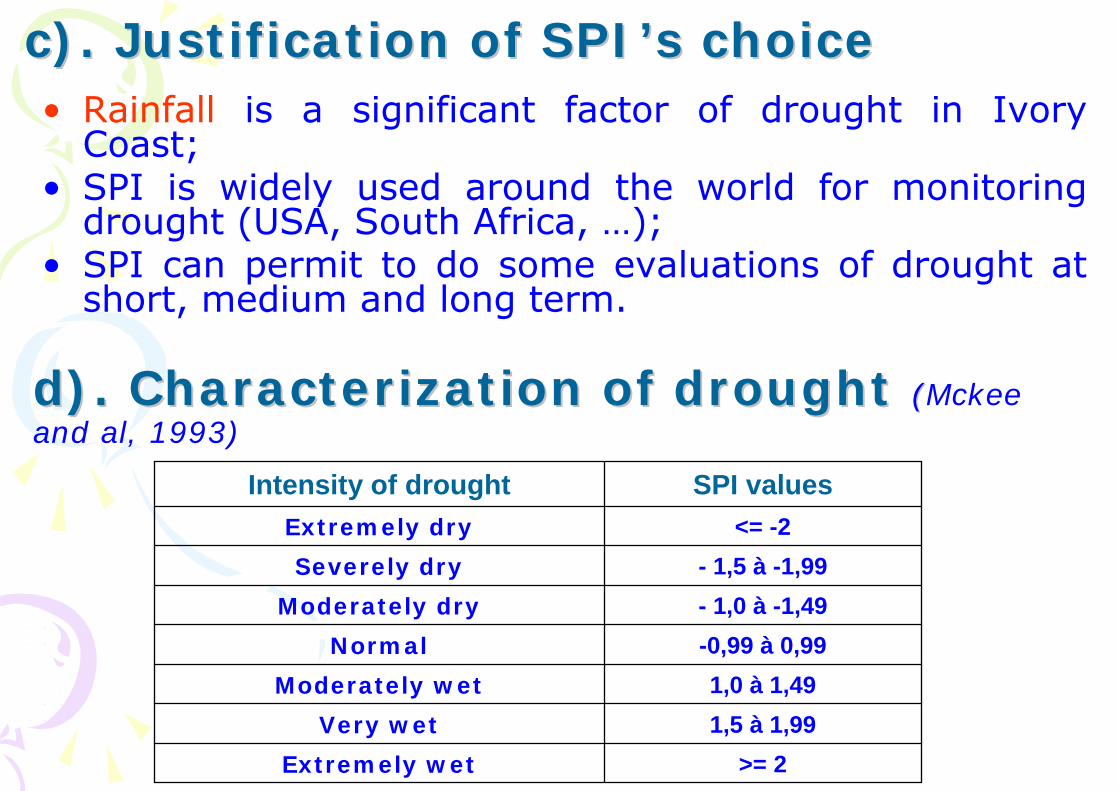
c). Justification of c). Justification of SPI’sSPI’s choicechoice• Rainfall is a significant factor of drought in Ivory
Coast;• SPI is widely used around the world for monitoring
drought (USA, South Africa, …);• SPI can permit to do some evaluations of drought at
short, medium and long term.
d). Characterization of d). Characterization of droughtdrought ((Mckeeand al, 1993)
>= 2Extremely wet
1,5 à 1,99Very wet
1,0 à 1,49Moderately wet
-0,99 à 0,99Normal
- 1,0 à -1,49Moderately dry
- 1,5 à -1,99Severely dry
<= -2Extremely dry
SPI valuesIntensity of drought
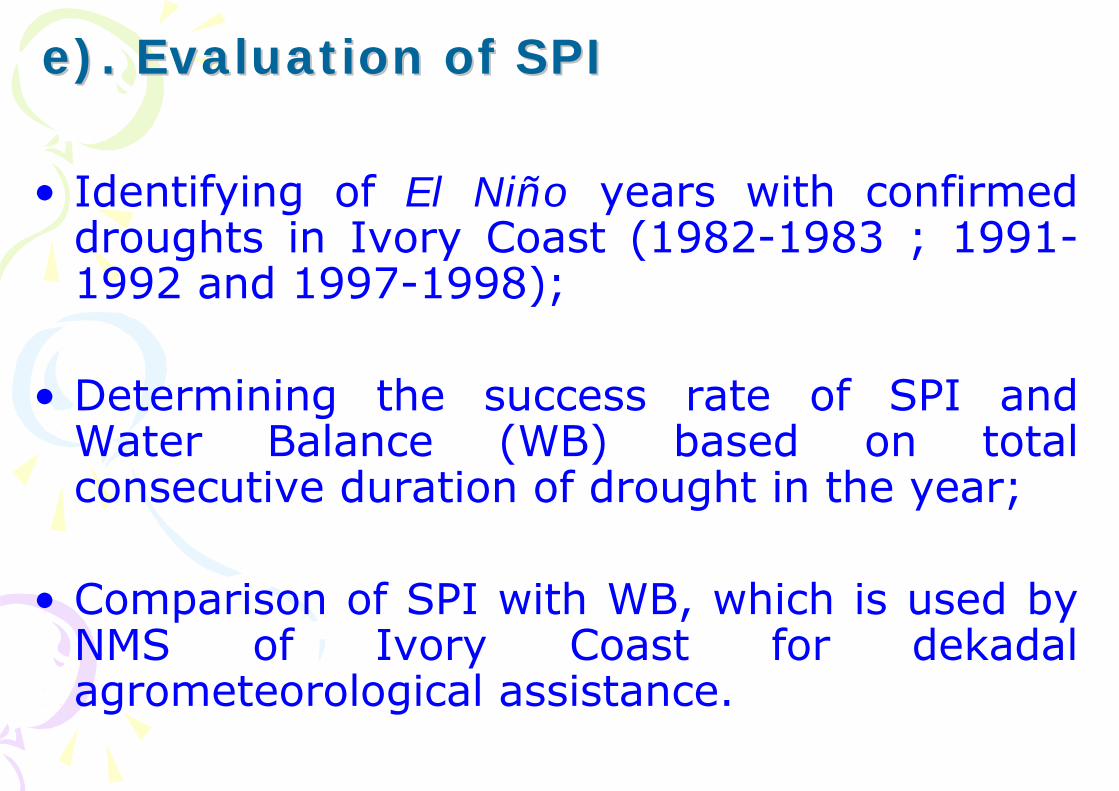
e). e). EvaluationEvaluation ofof SPISPI
• Identifying of El Niño years with confirmeddroughts in Ivory Coast (1982-1983 ; 1991-1992 and 1997-1998);
• Determining the success rate of SPI and Water Balance (WB) based on total consecutive duration of drought in the year;
• Comparison of SPI with WB, which is used by NMS of Ivory Coast for dekadalagrometeorological assistance.

II. RESULTS AND ANALISYSII. RESULTS AND ANALISYS
201983
431982
100201992
43291991
100
43
SPI (success
rate in %)
WB (success
rate in %)El Niño years
861997
1001998
Station: Bouake
401983
141982
40201992
5701991
33
14
SPI (success
rate in %)
WB (successrate in %)El Niño years
711997
671998
Station: Abidjan
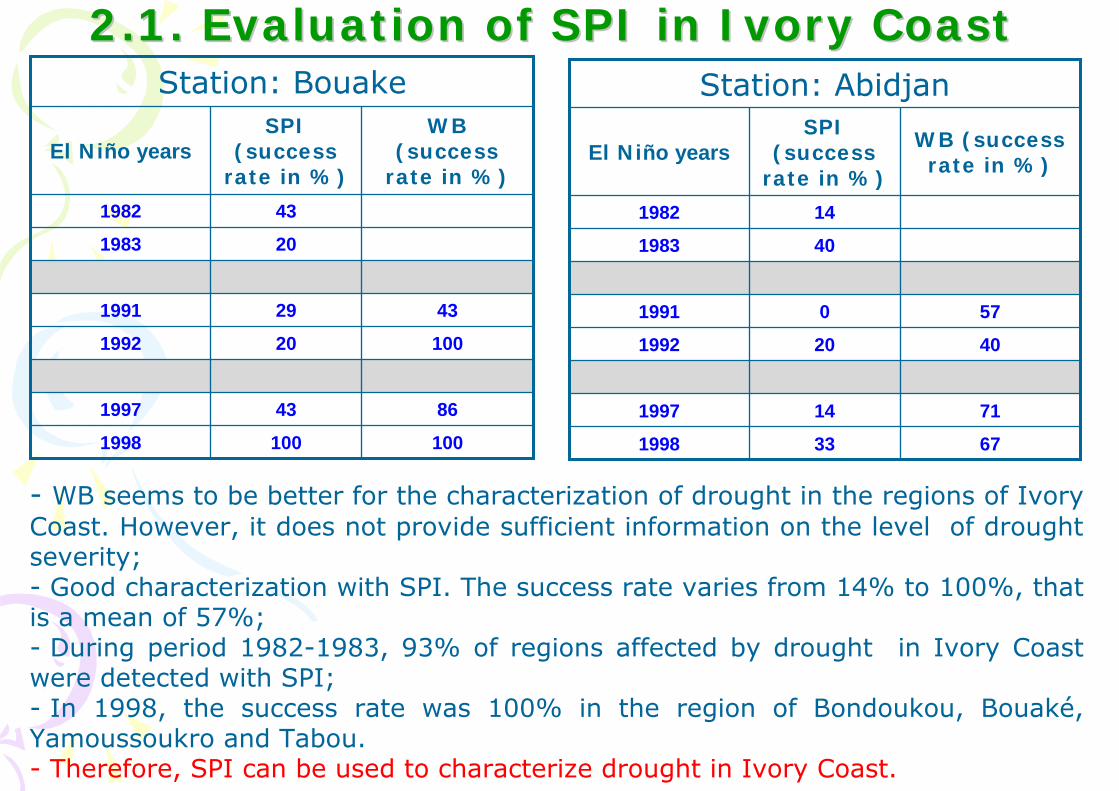
2.1. 2.1. EvaluationEvaluation of SPI in of SPI in IvoryIvory CoastCoast
- WB seems to be better for the characterization of drought in the regions of IvoryCoast. However, it does not provide sufficient information on the level of droughtseverity;- Good characterization with SPI. The success rate varies from 14% to 100%, that is a mean of 57%;- During period 1982-1983, 93% of regions affected by drought in Ivory Coastwere detected with SPI;- In 1998, the success rate was 100% in the region of Bondoukou, Bouaké, Yamoussoukro and Tabou.- Therefore, SPI can be used to characterize drought in Ivory Coast.
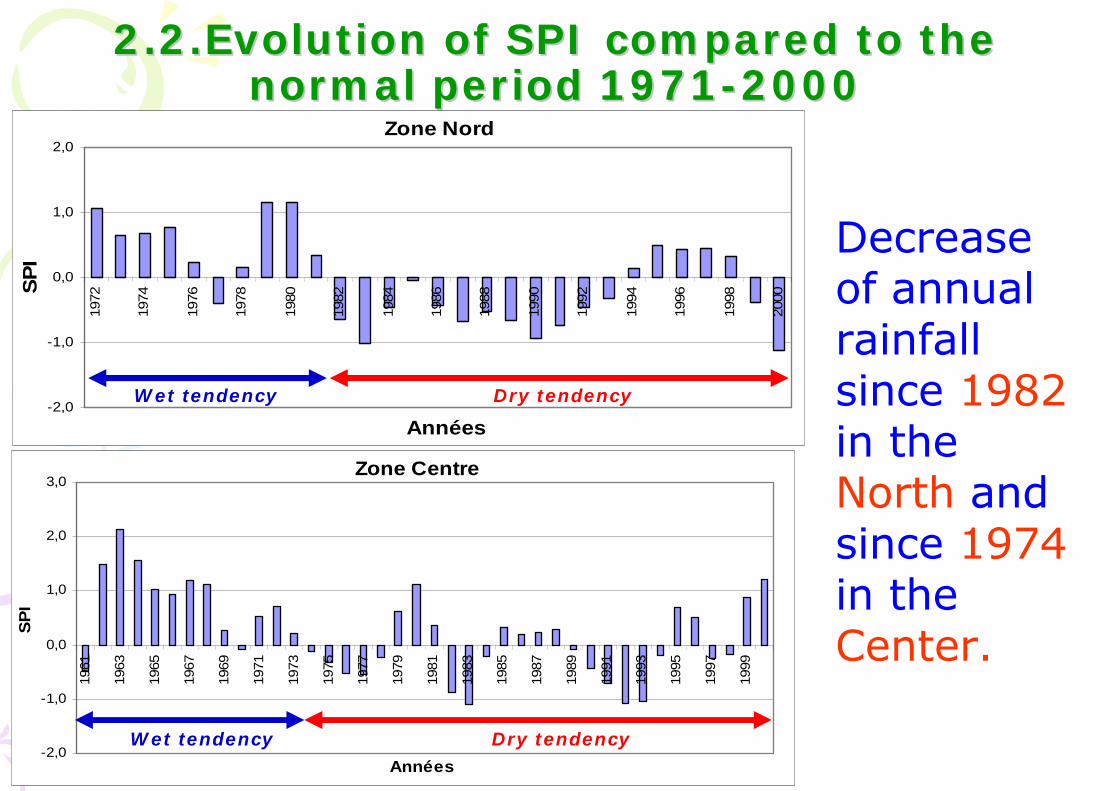
2.2.Evolution of SPI 2.2.Evolution of SPI comparedcompared to to thethenormal normal periodperiod 19711971--2000 2000
Decrease of annual rainfall since 1982 in theNorth and since 1974 in theCenter.
Zone Nord
-2,0
-1,0
0,0
1,0
2,0
1972
1974
1976
1978
1980
1982
1984
1986
1988
1990
1992
1994
1996
1998
2000
Années
SPI
Dry tendencyWet tendency
Zone Centre
-2,0
-1,0
0,0
1,0
2,0
3,0
1961
1963
1965
1967
1969
1971
1973
1975
1977
1979
1981
1983
1985
1987
1989
1991
1993
1995
1997
1999
Années
SPI
Dry tendencyWet tendency

Decreaseof annualrainfall since1975 in theSouth-interiorand since1984 in theLittoral.
Zone Sud-intérieur
-2,0
-1,0
0,0
1,0
2,0
3,0
4,0
5,0
6,0
7,0
1961
1963
1965
1967
1969
1971
1973
1975
1977
1979
1981
1983
1985
1987
1989
1991
1993
1995
1997
1999
Années
SPI
Dry tendencyWet tendency
Zone Littoral
-2,0
-1,0
0,0
1,0
2,0
3,0
1961
1963
1965
1967
1969
1971
1973
1975
1977
1979
1981
1983
1985
1987
1989
1991
1993
1995
1997
1999
Années
SPI
Dry tendencyWet tendency
-9 -8 -7 -6 -5 -4 -3 -24
5
6
7
8
9
10
11
KorhogoOdienné
Bondoukou
Bouaké
Daloa
Man
DimbokroYamoussoukro
Gagnoa
AdiakéAbidjan
SassandraSan Pédro
Tabou
-9 -8 -7 -6 -5 -4 -3 -24
5
6
7
8
9
10
11
KorhogoOdienné
Bondoukou
Bouaké
Daloa
Man
DimbokroYamoussoukro
Gagnoa
AdiakéAbidjan
SassandraSan Pédro
Tabou
-9 -8 -7 -6 -5 -4 -3 -24
5
6
7
8
9
10
11
KorhogoOdienné
Bondoukou
Bouaké
Daloa
Man
DimbokroYamoussoukro
Gagnoa
AdiakéAbidjan
SassandraSan Pédro
Tabou
-9 -8 -7 -6 -5 -4 -3 -24
5
6
7
8
9
10
11
KorhogoOdienné
Bondoukou
Bouaké
Daloa
Man
DimbokroYamoussoukro
Gagnoa
AdiakéAbidjan
SassandraSan Pédro
Tabou
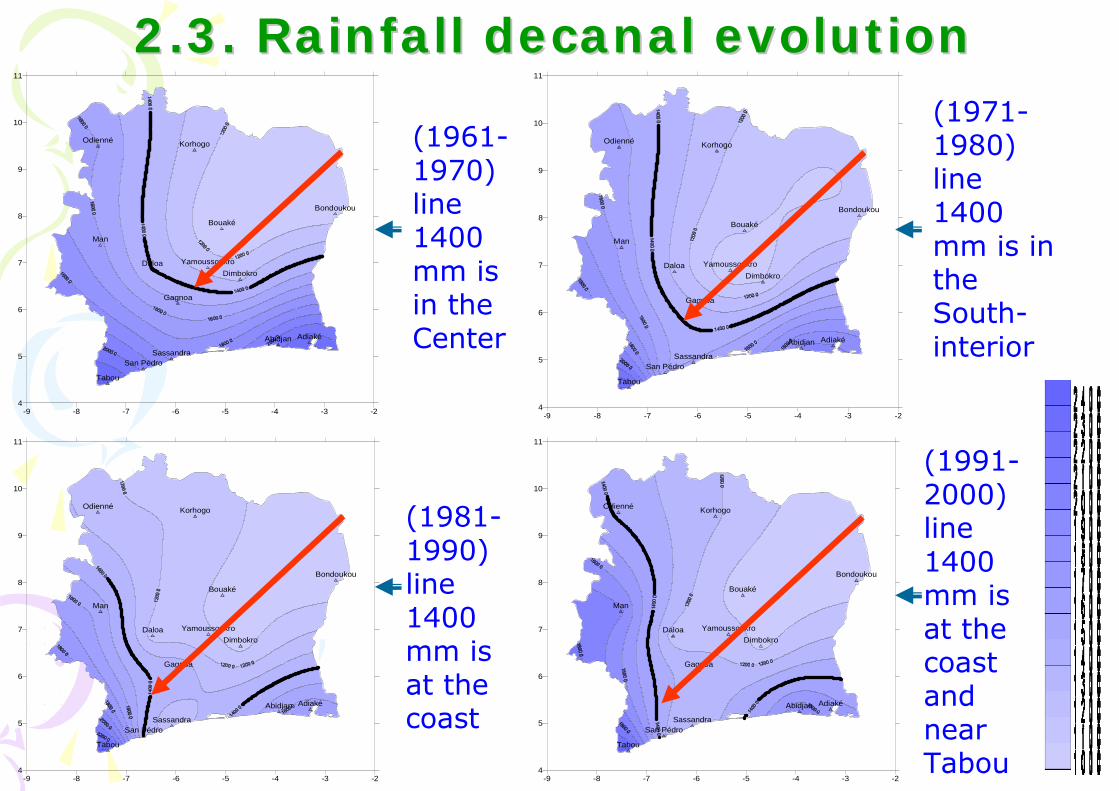
2.3. 2.3. RainfallRainfall decanaldecanal evolutionevolution
(1961-1970) line 1400 mm isin the Center
(1971-1980) line 1400 mm is in the South-interior
(1981-1990) line 1400 mm isat the coast
(1991-2000) line 1400 mm isat the coastand nearTabou
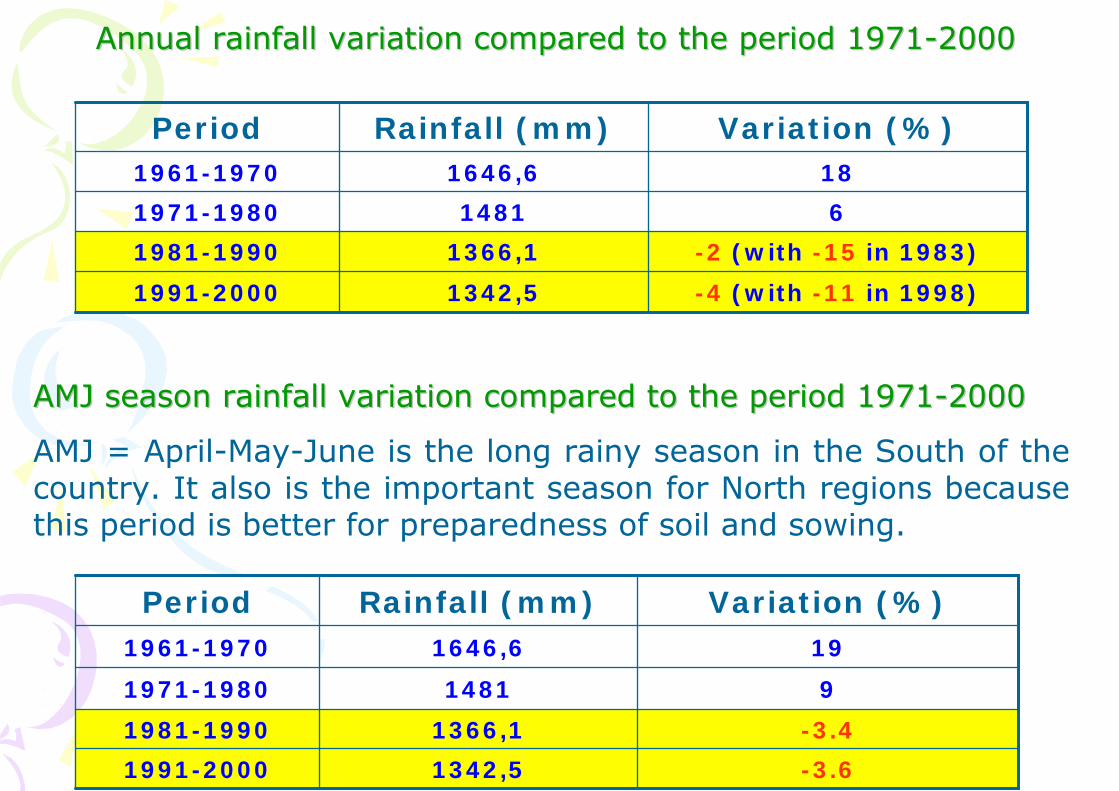
AnnualAnnual rainfall variation rainfall variation comparedcompared to the to the periodperiod 19711971--20002000
1991-2000
1981-1990
1971-1980
1961-1970
Period
-4 (with -11 in 1998)1342,5
181646,6
61481
-2 (with -15 in 1983)1366,1
Variation (%)Rainfall (mm)
1991-2000
1981-1990
1971-1980
1961-1970
Period
-3.61342,5
191646,6
91481
-3.41366,1
Variation (%)Rainfall (mm)
AMJ AMJ seasonseason rainfall variation rainfall variation comparedcompared to the to the periodperiod 19711971--20002000
AMJ = April-May-June is the long rainy season in the South of thecountry. It also is the important season for North regions because this period is better for preparedness of soil and sowing.
0
5
10
15
20
25
30
35
40
1961
1963
1965
1967
1969
1971
1973
1975
1977
1979
1981
1983
1985
1987
1989
1991
1993
1995
1997
1999
Années
Pour
cent
age
des
stat
ions
%Moderement sec
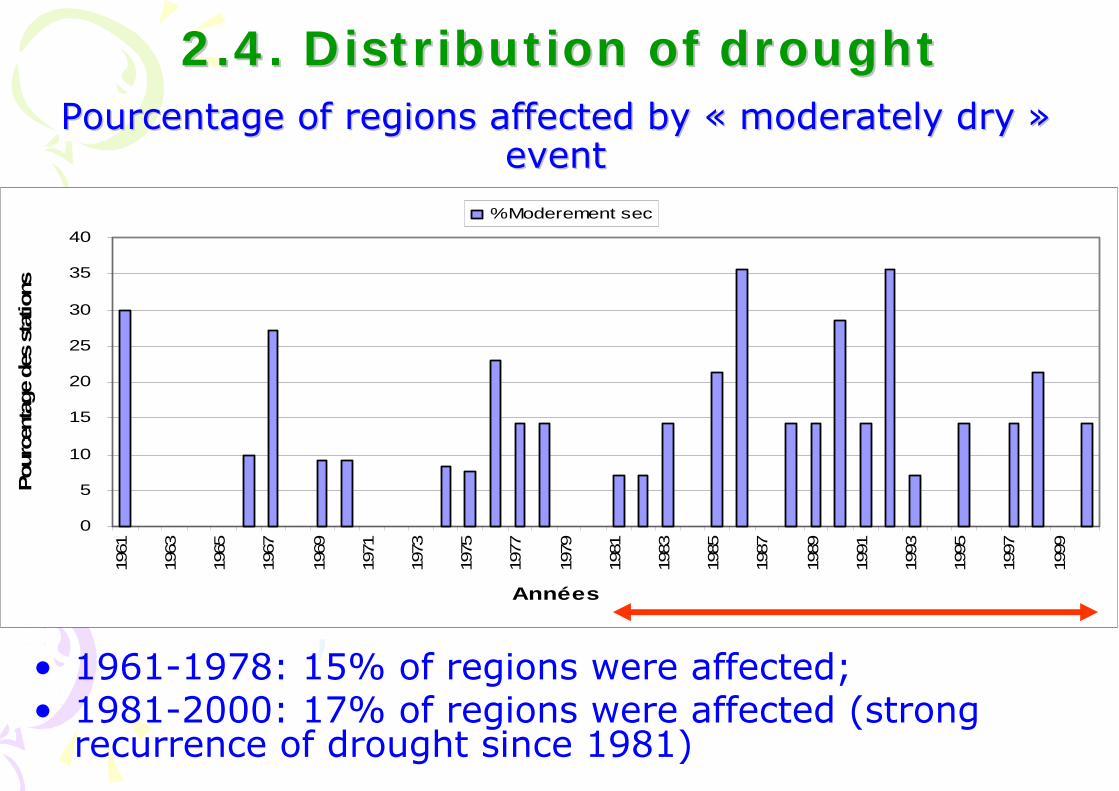
2.4. Distribution of 2.4. Distribution of droughtdroughtPourcentage of regions Pourcentage of regions affectedaffected by «by « moderatelymoderately drydry » »
eventevent
• 1961-1978: 15% of regions were affected;• 1981-2000: 17% of regions were affected (strong
recurrence of drought since 1981)
0
5
10
15
20
25
30
1961
1963
1965
1967
1969
1971
1973
1975
1977
1979
1981
1983
1985
1987
1989
1991
1993
1995
1997
1999
Années
Pou
rcen
tage
des
sta
tions
%Sec
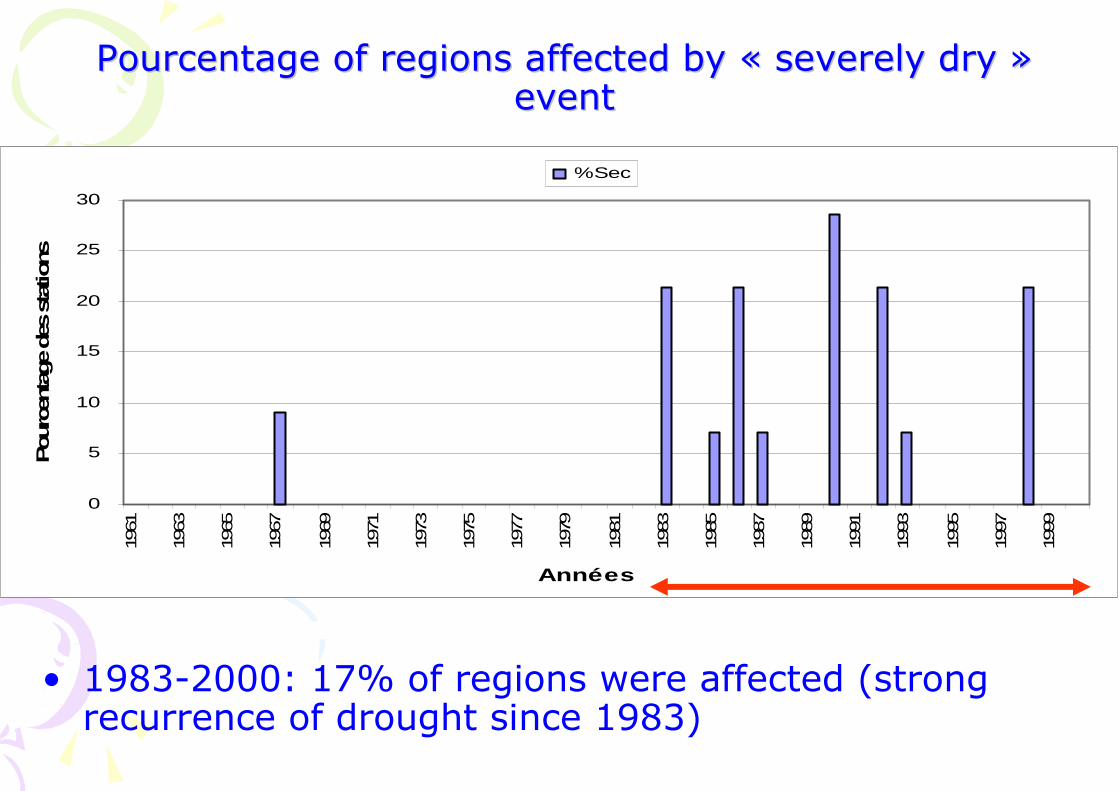
Pourcentage of regions Pourcentage of regions affectedaffected by «by « severelyseverely drydry » » eventevent
• 1983-2000: 17% of regions were affected (strongrecurrence of drought since 1983)

0
5
10
15
20
1961
1963
1965
1967
1969
1971
1973
1975
1977
1979
1981
1983
1985
1987
1989
1991
1993
1995
1997
1999
Années
Pour
cent
age
des
stat
ions
%Très sec
Pourcentage of regions Pourcentage of regions affectedaffected by «by « extremelyextremely drydry » » eventevent
• 1970-2000: 11% of regions were affected (Man in 1970, Korhogo & Dimbokro in 1977, Korhogo &Bouake in 1983, Tabou in 1997)
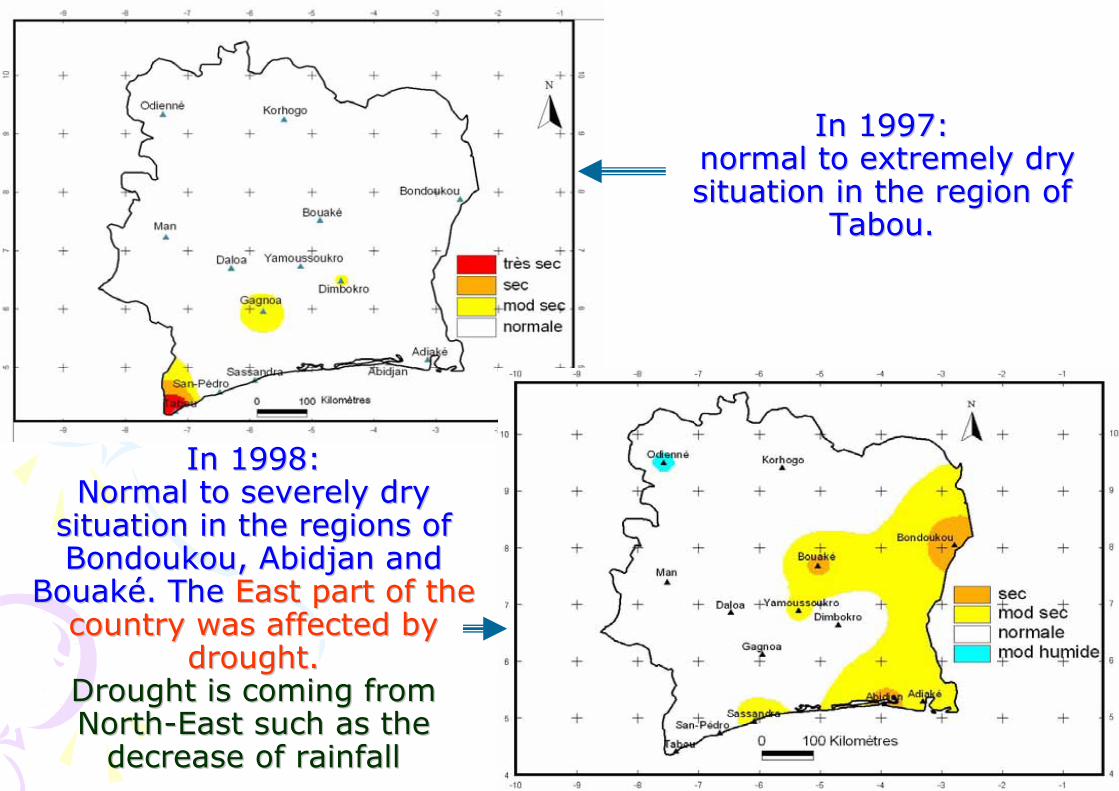
In 1997: In 1997: normal to normal to extremelyextremely dry dry situation in the situation in the regionregion of of
Tabou.Tabou.
In 1998:In 1998:Normal to Normal to severelyseverely dry dry
situation in the regions of situation in the regions of Bondoukou, Abidjan and Bondoukou, Abidjan and
Bouaké. Bouaké. TheThe EastEast part of the part of the country country waswas affectedaffected by by
droughtdrought..DroughtDrought isis comingcoming fromfromNorthNorth--EastEast suchsuch as as thethe
decreasedecrease ofof rainfallrainfall
-1,96 (juin 1992) à Yamoussoukro
1,0
1
-1,96 (juin 1992) à Yamoussoukro
1,3
5
Zone Sud-intérieur
-1,99 (mai 1988) à Odienné
1,0
3
-1,99 (mai 1988) à Odienné
1,1
7
Zone Nord
Extreme value of SPI, occuerrence date and place
Duration (month)
Mean frequency ( %)
Extreme value of SPI, occuerrence date and place
Duration (month)
Mean frequency ( %)
Paramètres
0,91,0
25Saisonal AMJ compared to
period 1971-2000
-1,86 (avril 1974) à
Sassandra
-1,98 en sept 1982 à
Bondoukou et en mars 1990 à
Daloa
1,11,1
33
Annual comparedto period 1971-
2000
-1,86 (avril 1974) à
Sassandra
-1,83 (avril 1999) à Daloa
Zone Centre Zone LittoralÉchellede temps
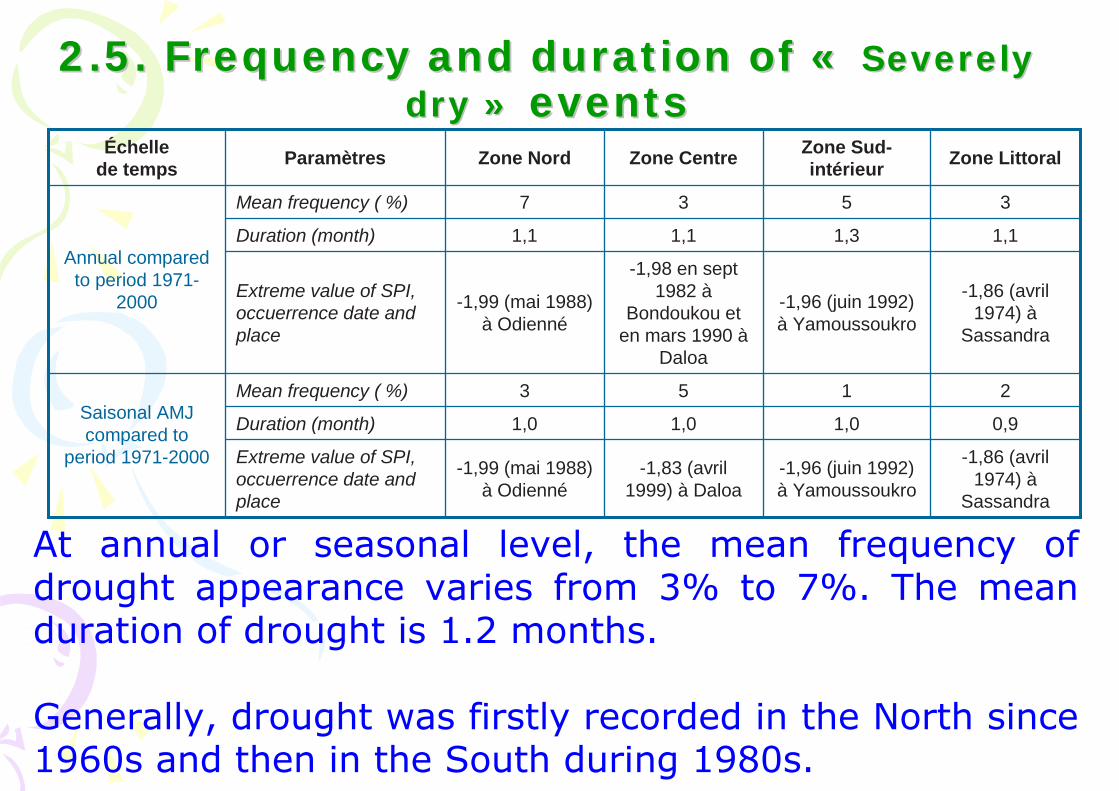
2.5. 2.5. FrequencyFrequency and and durationduration of «of « SeverelySeverelydrydry »» eventsevents
At annual or seasonal level, the mean frequency ofdrought appearance varies from 3% to 7%. The meanduration of drought is 1.2 months.
Generally, drought was firstly recorded in the North since1960s and then in the South during 1980s.
III. IMPACT OF DROUGHT IN III. IMPACT OF DROUGHT IN IVORY COASTIVORY COAST

-50,0
-40,0
-30,0
-20,0
-10,0
0,0
10,0
20,0
30,0
40,0
50,0
1950
-195
1
1952
-195
3
1954
-195
5
1956
-195
7
1958
-195
9
1960
-196
1
1962
-196
3
1964
-196
5 (N
ina)
1966
-196
7
1968
-196
9 (N
ino)
1970
-197
1
1972
-197
3 (N
ino)
1974
-197
5 (N
ina)
1976
-197
7
1978
-197
9
1980
-198
1
1982
-198
3 (N
ino)
1984
-198
5
1986
-198
7
1988
-198
9
1990
-199
1
1992
-199
3 (N
ino)
1994
-199
5
1996
-199
7 (N
ino)
1998
-199
9
Varia
tion
du re
ndem
ent d
e ca
cao
(%)
Variation (en %) par rapport à la campagne précédente
Drop of cocoa yield about 21% and 27% during respectively1972-1973 and 1982-1983, compared to the previous yield. With 1.2 million tonnes/year nowadays, Ivory Coast is the firstproducer in the world. The lost is now evaluated at about $US 500,000,000.
Rice: drop of yield about 26% compared to the mean 1978-2000. The lost is about $US 273 per ha.
3.1. Agricultural impacts3.1. Agricultural impacts
• Fishing is not developed in Ivory Coast. Itrepresented 0.2% of GDP (Gross DomesticProduct) in 2005.
• Decrease of rainfall, high temperatures since1990 give rise to the shrinking of lakessurface, the death of fishes and eggs, hencethe decrease of national production.
• From 2000 to 2005, fish production decreasedfrom 81,523 tonnes to 43,532 tonnes, that is47% of reduction.
• Therefore, Ivory Coast imports for hisconsumption, about 250,000 tonnes of fishper year.
3.2. Impacts on 3.2. Impacts on fisheriesfisheries
3.3. Impacts on 3.3. Impacts on forestryforestry• Forest and crop fires;• Dearth of firewood in Northern regions.
Women must travel long distances to look for wood or use alternative sources of energysuch as butane gas available to a high cost($US 10);
• During the period 1982-1983, marked by a long dry season, there were forest and bush fires in Ivory Coast that have destroyed more than 67,000 ha of forest;
• Since 1982, recurrent forest fires in most ofregions;
• Forests have decreased from 15 million ha in 1956 to less than 2 million hectares nowadays, that is 87% of reduction.
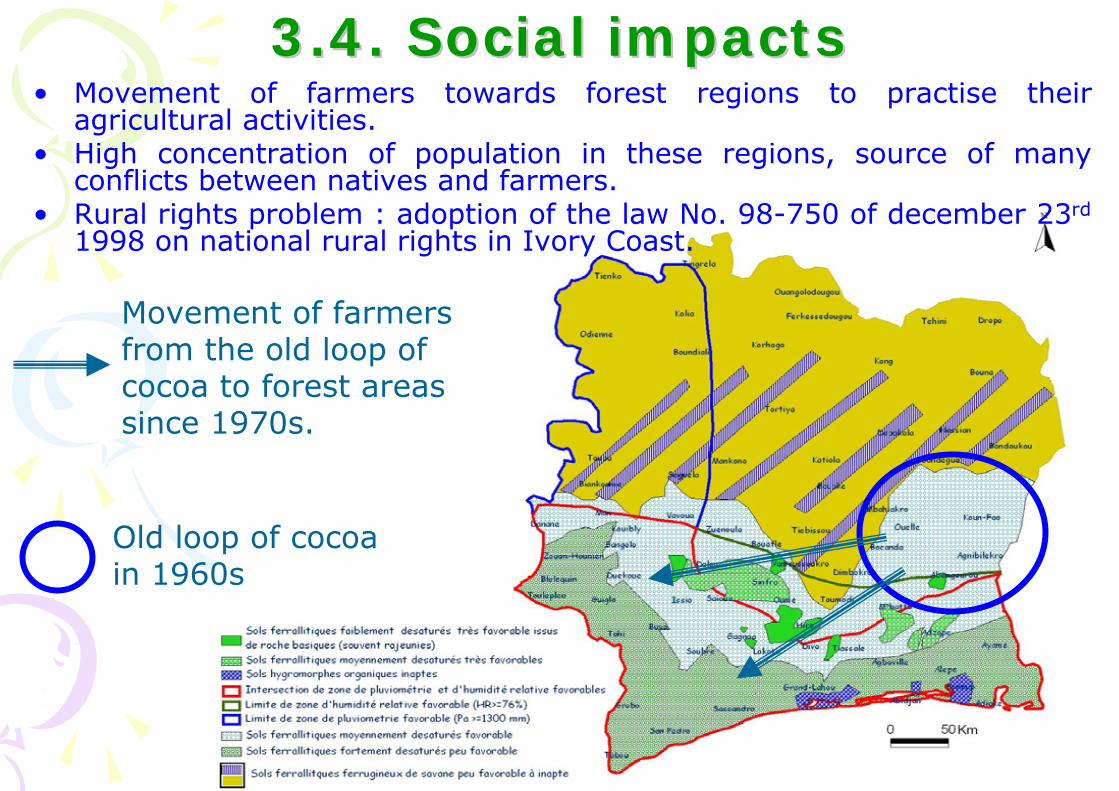
3.4. Social impacts3.4. Social impacts• Movement of farmers towards forest regions to practise their
agricultural activities.• High concentration of population in these regions, source of many
conflicts between natives and farmers.• Rural rights problem : adoption of the law No. 98-750 of december 23rd
1998 on national rural rights in Ivory Coast.
Movement of farmers from the old loop of cocoa to forest areas since 1970s.
Old loop of cocoain 1960s

- Movement of cattle farmers towards the South (forest region) to look for green foddercrops;
- destruction of crops by livestock in their path. For instance, during 1980s, upon40 farmers of Katiali (North ofcountry) we had recorded 84damages caused by cattle(bovine). 83% of damages were generally caused by Peulh’s livestock;
- conflicts between pastoralists and farmers;
- decree No. 96-431 of june 3rd
1996, to regulate pasture land and movement of livestock.
• This study showed that, whatever scale time and climate zones, moderate droughts occurfrequently than other types of drought since1980s.
• Since 1961, the most outstanding droughts by their intensity, duration or extent appear duringthe two (2) last decades of the twentieth century.
• The effects of drought have weakened the Ivorianeconomy, especially droughts of 1983 and 1998.
CONCLUSION AND RECOMMENDATIONS

• From the results of this study, we can make thefollowing recommendations for the authorities:
1- to strengthen national capacities for collecting and processing data on naturaldisasters such as drought;
2- to develop integrated indices in the future for monitoring drought by considering thefollowing parameters:•temperature, humidity;•soil moisture;•level of rivers;•development stage of vegetation;
3- to disseminate new technicals culture throught thesensibiliization of farmers to practice mixed culture (association of leguminous plants with cereal) and to use organic fertilizers (e.g. compost), which can regeneratesoils, enrich soil by Nitrogen (N) and standardize farmerson their land for several years;
4- to carry on the creation and the dissemination of new varieties of main consumption crops (e.g. rice, maize, groundnut) and cash crops (e.g. cocoa, cotton, coffee) resistant on drought and water stress, with short cycle and by giving sufficient means to Agricultural ReseachCenters to conduct their activities;
5- to protect forest by sensibilizing farmers to do reforestion, by protecting food trees (e.g. shea) and by developing agroforestry through the promotion ofperennial crops (e.g. rubber production, cajouculture, citrus, etc.);

6- to develop and disseminate appropriatecropping calendars according to climatevariation, for the execution of differentsagricultural operations;
7- to improve water resources management through creation of many agricultural dams for practicing irrigation during droughtperiods and crops critical water needs.
