characterization of dissolved organic matter using high...
TRANSCRIPT

Chemosphere 87 (2012) 879–885
Contents lists available at SciVerse ScienceDirect
Chemosphere
journal homepage: www.elsevier .com/locate /chemosphere
Characterization of dissolved organic matter using high-performance liquidchromatography (HPLC)–size exclusion chromatography (SEC) with a multiplewavelength absorbance detector
Mingquan Yan a,b,⇑, Gregory Korshin b, Dongsheng Wang c, Zhenxiao Cai b
a Department of Environmental Engineering, Peking University, The Key Laboratory of Water and Sediment Sciences, Ministry of Education, Beijing 100871, Chinab Department of Civil and Environmental Engineering, University of Washington, Box 352700, Seattle, WA 98195-2700, United Statesc State Key Laboratory of Environmental Aquatic Chemistry, Research Center for Eco-Environmental Sciences, CAS, POB 2871, Beijing 100085, China
a r t i c l e i n f o
Article history:Received 21 October 2011Received in revised form 18 January 2012Accepted 18 January 2012Available online 25 February 2012
Keywords:HPLC–SECMultiple wavelength absorbance detectorMolecular weightDOM
0045-6535/$ - see front matter � 2012 Elsevier Ltd. Adoi:10.1016/j.chemosphere.2012.01.029
⇑ Corresponding author at: Department of EnviroUniversity, The Key Laboratory of Water and SedEducation, Beijing 100871, China. Tel.: +86 10 627559
E-mail address: [email protected] (M. Yan).
a b s t r a c t
High-performance liquid chromatography–size exclusion chromatography (HPLC–SEC) coupled with amultiple wavelength absorbance detector (200–445 nm) was used in this study to investigate the appar-ent molecular weight (AMW) distributions of dissolved organic matter (DOM). Standard DOM, namelyhumic acid, fulvic acid and hydrophilic acid, from the Suwannee River were tested to ascertain the per-formance and sensitivity of the method. In addition to four compounds groups: humic substances (Peak1, AMW 16 kD), fulvic acids (Peak 2, AMW 11 kD), low AMW acids (Peak 3, AMW 5 kD), and low AMWneutral and amphiphilic molecules, proteins and their amino acid building blocks (Peak 4, AMW 3 kD),an new group that appears to include low AMW, 6–10 kD, humic substances was found based on inves-tigating the spectra at various elution times. The spectroscopic parameter S>365 (slope at wavelengths>365 nm) was determined to be a good predictor of the AMW of the DOM. The detector wavelengthplayed an important role in evaluating the AMW distribution. For some fractions, such as the humicand low AMW non-aromatic substances, the error in measurement was ±30% as determined by two-dimensional chromatograms detected at an artificially selected wavelength. HPLC–SEC with multiplewavelength absorbance detection was found to be a useful technique for DOM characterization. It char-acterized the AMW distributions of DOM more accurately and provided additional, potentially importantinformation concerning the properties of DOM with varying AMWs.
� 2012 Elsevier Ltd. All rights reserved.
1. Introduction
Dissolved organic matter (DOM) is ubiquitous in natural watersand is derived from plant or terrestrial (allochtonous) and algal(autochthonous) sources. It is composed of relatively high apparentmolecular weight (AMW) humic and fulvic acids, as well as lowAMW proteins, organic acids, carbohydrates and other compounds(Leenheer and Croue, 2003). The molecular properties of DOM,notably its molecular weight, strongly affect its reactivity in bothnatural and engineered aquatic systems (Amy et al., 1987; Heret al., 2002a; Leenheer and Croue, 2003; Yan et al., 2006, 2007;Korshin et al., 2009). High-performance liquid chromatography–size exclusion chromatography (HPLC–SEC) is one of the mostwidely used techniques to characterize DOM due to its importantadvantages, such as little need for DOM pre-concentration, small
ll rights reserved.
nmental Engineering, Pekingiment Sciences, Ministry of14-81; fax: +86 10 62756526.
injection volume, and ease and speed of analysis (Chin et al.,1994; Her, 2003; Korshin et al., 2009). In principle, the separationof molecules in a SEC column is based on size, and compounds withlower AMW are eluted later than those with higher AMW. How-ever, the interpretation of HPLC–SEC data is greatly affected bythe type of post-column detection used (Her, 2003; Korshinet al., 2009), typically UV absorbance, fluorescence, or multi-anglelight scattering (MALS) (Baker, 2001; Wong et al., 2002; Her, 2003;Allpike et al., 2005; Akagi et al., 2007; Liu et al., 2010a). Post-col-umn absorbance detection is most common due to its sensitivityand relatively low cost (O’Loughlin and Chin, 2001; Her et al.,2002b, 2008; Hur and Kim, 2009). DOM chromophores produceoverlapping bands, so their absorbance spectra are largely feature-less and cannot be deconvoluted to determine the contributions ofdiscrete functional groups (Korshin et al., 1997, 2009; Her et al.,2008). In most cases, such measurements have been limited tousing a single wavelength (e.g., 254 nm).
However, a number of phenomenological parameters (e.g.,SUVA254, ratios of DOM absorbances at fixed wavelengths, andslopes of DOM absorbance vs. wavelength) have been correlated

880 M. Yan et al. / Chemosphere 87 (2012) 879–885
with important DOM properties (e.g., aromaticity and apparentmolecular weight) that have been estimated using structure-sensi-tive methods (e.g., 13C NMR).
These phenomenological parameters have rarely been used tointerpret HPLC–SEC data. For instance, Her et al. (2008) used theratio of absorbance of varying-MW fractions measured at 210 nmand 254 nm to estimate the relative contributions of fulvic acidsand microbial biopolymers. Korshin et al. (2009) used the ratio ofthe absorbance slopes of wavelengths 254–272 nm vs. 220–230 nm (ISA) to evaluate the DOM removal and DBP formationpotential.
In this paper, we examined the performance of alternativeabsorbance-based indexes (e.g., absorption ratios and slopes).Our conclusions were based on the analysis of absorbance spectra,from 200 nm to 445 nm, of HPLC–SEC fractions with varyingAMWs. This approach was applied to the Suwannee River humicacid, fulvic acid and hydrophilic acid standards to determine theperformance and sensitivity of the method.
2. Methods and materials
2.1. Samples
Suwannee River humic acid (SRHA) (1R101H) and SuwanneeRiver fulvic acid (SRFA) (1S101F) standards were obtained fromthe International Humic Substances Society (IHSS). Suwannee Riv-er hydrophilic acid (SRHPiA) was isolated and provided for thisstudy by Dr. J.A. Leenheer. SRHPiA was obtained by passing anacidified (pH 2) sample of Suwannee River organic matter, elutedfrom column containing Amberlite XAD-8 resin, through a columncontaining Amberlite XAD-4 resin. This sample was then elutedfrom the XAD-4 resin with sodium hydroxide. SRHA, SRFA andSRHPiA solutions were prepared at a 5.0 mg L�1 final TOC concen-tration in Milli-Q water. Dissolved organic carbon (DOC) was ana-lyzed using a Shimadzu TOC-Vcsh carbon analyzer. The ionicstrength of each was maintained at 0.04 M by adding the requisiteamount of NaClO4.
2.2. HPLC–SEC analyses
The HPLC–SEC analysis used a DIONEX Ultimate 3000 HPLC sys-tem. Isocratic flow of 0.01 M NH4HCO3 was delivered through anAgilent PL aquagel-OH 30 column (300 � 7.5, 8 lm) at0.5 mL min�1. Elution profiles were monitored with an Ultimate3000 diode array detector, which acquired absorbance spectrafrom 200 nm to 445 nm at a resolution of 1.0 nm.
A highly linear calibration curve for the apparent molecularweight (AMW) was generated using polyethylene glycol (PEG)standards (Agilent EasiVial PEG) (see Fig. 1S in Supplementaryinformation (SI)), but it suggested that the AMW of the DOM wasmuch larger than that reported by other researchers (Chin et al.,1994). Therefore, although the HPLC–SEC profiles are useful forcomparisons among samples in a particular experiment, theabsolute AMW values should not be interpreted literally (Cai andBenjamin, 2011).
The absorbance spectra of DOM samples were recorded in a5 cm quartz cell on a Perkin-Elmer Lambda 18 UV/vis spectropho-tometer using wavelengths from 200 nm to 600 nm.
2.3. AMW evaluation
AMW distributions can be represented by number-averagedAMW (Mn), weight-averaged MW (Mw), and polydispersity (p,Mw/Mn). Mn and Mw values were determined using the followingEqs. (1) and (2):
Mw ¼Pn
i¼1ðbiMWiÞPn
i¼1bið1Þ
Mn ¼Pn
i¼1biPn
i¼1ðbi=MWiÞð2Þ
p ¼ Mw
Mnð3Þ
where bi and MWi are the height of the chromatogram and the MWof an organic matter sample corresponding to retention time i,respectively (Chin et al., 1994).
3. Theoretical aspects of the interpretation of absorbancespectra
The energies of various types of molecular orbits differ signifi-cantly. It was reported that most detectable UV absorbance by or-ganic compounds is based on transitions of n or p electrons to thep⁄ excited state. The energies required for these processes bringthe absorption peaks into an experimentally convenient spectralregion (200–700 nm) (Her et al., 2002b). The absorbance spectraof pure, model aromatic compounds can often be represented bythree bands in the UV region from p ? p⁄ transitions: the elec-tron-transfer (ET) band centered at 254 nm, the benzenoid (Bz)band centered at 203 nm, and the local excitation (LE) band cen-tered at 180 nm. The ratio of the intensities of the electron transferand benzenoid bands (AET/ABz, or A254/A203) is quite sensitive tosubstitutions on the rings, increasing dramatically when the ringsare substituted with activating functional groups (e.g., hydroxyl,ester, and carboxyl) (Korshin et al., 1997; Li et al., 2006). The mainDOM functional groups associated with non-aromatic groups dis-play absorption maxima only at shorter wavelengths, and, in thecase of the non-conjugated form, the absorption maxima wave-lengths were 206 nm (for carboxylic acid and esters) and 210 nm(for amides) in water for the n ? p⁄ transition. When carboxylicacid or esters are conjugated, the peak maxima absorption occursby p ? p⁄ transitions at an experimentally detectable spectral re-gion (longer than 200 nm), and due to a substituent effects, thepeak maxima absorption shifts to longer wavelengths from thebase absorption of 187 nm in water. The absorption band increaseis dependent upon the substituent type and its position on theunsaturated carbonyl chromospheres (Her et al., 2008). The overallspectrum of a DOM sample represents a superposition of thesebands. However, by refining spectral parameters, some usefulinformation could be obtained from the overall spectrum of aDOM sample. A review and relevant values of SRHA, SRFA and SRH-PiA are provided in Table 1.
The conventional absorbance spectra of SRHA, SRFA and SRHPiAare shown in Fig. 1a. Except for a shoulder located in the 250–270 nm range of wavelengths, these spectra did not exhibit anyprominent peaks. In all cases, the absorbance gradually decreasedat increased wavelengths. While the TOC concentrations of thesethree samples were equal, the absorbance intensities were differ-ent. Due to its higher aromaticity, SRHA absorbance values weretwice as high as those of SRFA and SRHPiA. When the spectra werenormalized by their absorbance measured at an a priori selectedreference wavelength (e.g., 220 nm), additional properties of thesespectra became more evident, as shown in Fig. 1b. At wave-lengths > 250 nm, the absorbance of SRHA was higher than thatof SRFA and SRHPiA. At the same time, the normalized spectrumof SRHPiA was slightly higher than that of SRFA, and close to thatof SRHA, in the 250–270 nm range.
Several indexes were derived based on the ratios of the absor-bance of SRHA, SRFA and SRHPiA at varying wavelengths and arepresented in Table 1. It was also recognized that the

Table 1Review of spectroscopic parameters measured for SRHA, SRFA and SRHPiA.
Spectral parameter SRHA SRFA SRHPiA References
S200–205 0.0014 0.0018 0.0038 Helm et al., 2008; Twardowski et al., 2004; Carder et al., 1989a
S206–240 0.0061 0.0062 0.0061S241–272 0.0031 0.0044 0.0032S273–350 0.0046 0.0060 0.0067S>365 0.0062 0.0081 0.0081S200–205/S206–240 0.2342 0.2824 0.6123S240–272/S206–240 0.5100 0.7109 0.5162 Korshin et al., 2009b
S273–350/S206–240 0.7483 0.9567 1.0935 Helm et al., 2008; Twardowski et al., 2004S>365/S206–240 1.0084 1.2928 1.3129A203/A254 1.8331 1.9036 1.8548 Korshin et al., 1997; Li et al., 2006c
A210/A254 1.7289 1.8254 1.7454 Her et al., 2008d
A280/A350 2.1294 2.6578 2.9891 Korshin et al., 1997, 2009e
A250/A365 3.2768 4.7869 5.1549 Helm et al., 2008; De Haan and De Boer, 1987; Peuravouri and Pihlaja, 1997f
a S ((A1 � A2)/(k1 � k2)), was used to semi-quantitatively describe the property of a DOM sample. S275–295 (slope of 275–295 nm) and S275–295/S350–450 (ratio of slopes of 275–295 nm and 350–450 nm) were inversely related to the AMW fractionated by ultrafiltration or gel filtrationfraction.
b ASI and S220–230/S254–272 (ratio of slopes of 220–230 nm and 254–272 nm) were used to evaluate DOM removal and DBP formation potential.c A254/A203 was used to determine AET/ABz (absorption spectral ratios for electron-transfer (ET) and benzenoid (Bz) bands) to evaluate the
degree of activation of the PHA moiety in DOM.d A210/A254 was used to estimate relative contributions of fulvic acids and microbial biopolymers.e A280/A350, like A203/A253, was used to evaluate the degree of activation of the PHA moiety in DOM.f A250/A365 (called E2:E3) or A465/A665 (called E4:E6) were used to track changes in the relative size of DOM molecules.
M. Yan et al. / Chemosphere 87 (2012) 879–885 881
characterization of these spectra can be done by calculation oftheir spectral slopes. For instance, it was demonstrated that theabsorbance of DOM changes near exponentially relative to theobservation wavelength (Twardowski et al., 2004):
agðkÞ ¼ agðkrÞe�seðk�krÞ ð4Þ
where ag is the Napierian absorption coefficient (m�1), k and kr areselected and the reference wavelength, respectively, and se (nm�1)is the spectral slope parameter that describes the relative steepnessof the spectrum. Like the absorption ratios, the se parameter is inde-pendent of the DOM concentration and is often used as a proxy forchanges in the composition of DOM (Twardowski et al., 2004). Mea-surements of spectral slopes provided further insight into the se-lected characteristics of the DOM over the absorption values alone.
Log-transformed absorption spectra of SRHA, SRFA and SRHPiAare shown in Fig. 1c. All three log-transformed spectra show thepresence of five ranges of wavelengths with different slopes. Theseranges corresponded to 200–205 nm, 206–240 nm, 240–272 nm,273–350 nm and > 350 nm. The slopes of SRHA in all these inter-vals were the lowest relative to the three examined samples exceptin the 206–240 nm wavelength range, where the slopes were al-most equal for the three samples.
The absorbance spectrum of SRHPiA had the highest slope val-ues except in the 241–272 nm (S241–272) wavelength range. The ra-tio of slopes was calculated and S206–240 was used as a reference.The slopes and slope ratios are provided in Table 1.
4. Results and discussion
4.1. HPLC–SEC chromatograms
AMW distribution profiles of SRHA, SRFA and SRHPiA character-ized by HPLC–SEC with multiple wavelength detection are dis-played in Fig. 2. The chromatograms for these samples weremeasured at several representative wavelengths and are shownin Fig. 2S in Supplemental information (SI).
Compared with the two-dimensional chromatograms plottedagainst absorbance at a single or pair of wavelengths, the AMWdata were plotted against the entire response range (200–445 nm) of the UV detector and gave a comprehensive perspective
on the relative absorbance intensity of the various AMWcompounds.
The chromatograms of SRHA and SRFA exhibit four peaks withmaxima located at AMW 16 kD, 11 kD, 5 kD, and 3 kD and denotedP1, P2, P3, and P4, respectively. The HPLC–SEC profiles for SRHPiAshowed only three peaks that corresponded to P1, P2, and P4.
The relative intensities of each peak in the three samples dif-fered significantly, consistent with the well-known characteristicsof these materials. SRHA and SRFA were derived primarily viabiogeochemical reactions associated with the decomposition ofwoody plant materials that have a high lignin content. As a result,SRHA and SRFA had structures with larger AMW values and higheroverall aromatic content (37% and 24% for SRHA and SRHA, respec-tively) (Her et al., 2002b). Accordingly, SRHA and SRFA had rela-tively higher intensities at P1 and P2, with SRHA having a higherrelative intensity at P1. In contrast, SRHPiA was mostly composedof a low AMW hydrophilic fraction, and the contribution of the lowAMW P4 was high.
The absorbance intensities at various elution times decreasedwhen the wavelength increased, and the spectral slopes wereinconsistent. The results of the AMW distribution evaluation weresignificantly influenced by the wavelength utilized in Eqs. (1) and(2), as discussed later.
4.2. Characterizing spectra in three-dimensional HPLC–SECchromatograms
To gain more insight into the nature of the DOM molecules withvarying AMW values, the behavior of several spectral parametersas a function of elution time were examined. The selected resultsof these analyses are presented in Figs. 3 and 4 for absorption ra-tios and slopes, respectively.
The trends in the behavior of A203/A254 and A210/A254 vs. AMW(elution time) were similar, therefore, only the results for A210/A254 are shown in Fig. 3a. In general, the value of A210/A254 in-creased when AMW decreased. This was consistent with theexpectation that DOM with lower AMWs were likely to have lowerconcentrations of activated aromatic rings but were enriched withnon-aromatic groups (Korshin et al., 1997; Li et al., 2006; Her et al.,2008). There are three obvious peaks observed for SRHA in Fig. 3a.These peaks corresponded to elution times P2, P3 and P4 in Fig. 2.There were only two peaks found for SRFA at P3 and P4; the peak

Fig. 1. Absorbance spectra of SRHA, SRFA and SRHPiA scanned by UV spectropho-tometer. (a) Absorbance spectra; (b) absorbance spectra normalized to thereference absorbance at 220 nm and (c) natural log-transformed absorption spectra.
Fig. 2. HPLC–SEC chromatograms for (a) SRHA, (b) SRFA and (c) SRHPiA.
882 M. Yan et al. / Chemosphere 87 (2012) 879–885
corresponding to P2 was not obvious because SRFA had a higherA210/A254 value. There were only two peaks found for SRHPiA atP2 and P4. The values of A210/A254 showed similar values at twoAMW ranges, 14–20 kD and 6–10 kD.
The A280/A350 values for the three samples exhibited similartrends when AMW decreased. These ratios decreased gradually atAMWs larger than 6 kD, except for a peak at the AMWs of 11–14 kD. This may indicate that DOM with an AMW of 11–14 kDhad specific groups with non-aromatic functional character. TheA280/A350 values increased at an AMW of 6 kD and decreased grad-ually as the AMW decreased.
The behavior of the spectral slopes calculated for wavelengthranges 206–240 nm and 273–350 nm is shown in Fig. 4. These datashowed similar trends to those observed for the A210/A254 and A280/A350 values.
The results shown in Figs. 2–4 and data of prior research (Huberand Frimmel, 1994; O’Loughlin and Chin, 2001; Her et al., 2002a,b;
Korshin et al., 2009; Liu et al., 2010b; Huber et al., 2011) revealedthat DOM can be divided into five distinct component fractionsbased on AMW. The first fraction (F1) had an AMW larger than14 kD (observed at elution times from 14.2 min to 14.7 min), corre-sponded to P1 and was likely comprised of humic substances(Rosenberger et al., 2006) that had relatively high aromaticityand contributions from functional groups with conjugated bonds.This fraction had a relatively low A210/A254 and S206–240 valuesand relatively high A280/A350 and S273–350 values. The second frac-tion (F2) had an AMW of 10–14 kD (observed at elution times from14.7 min to 15.2 min). It corresponded to P2 and was comprised offulvic acids, characterized by highly aromatic components andhigh conjugated no-aromatic activating functional groups. It had
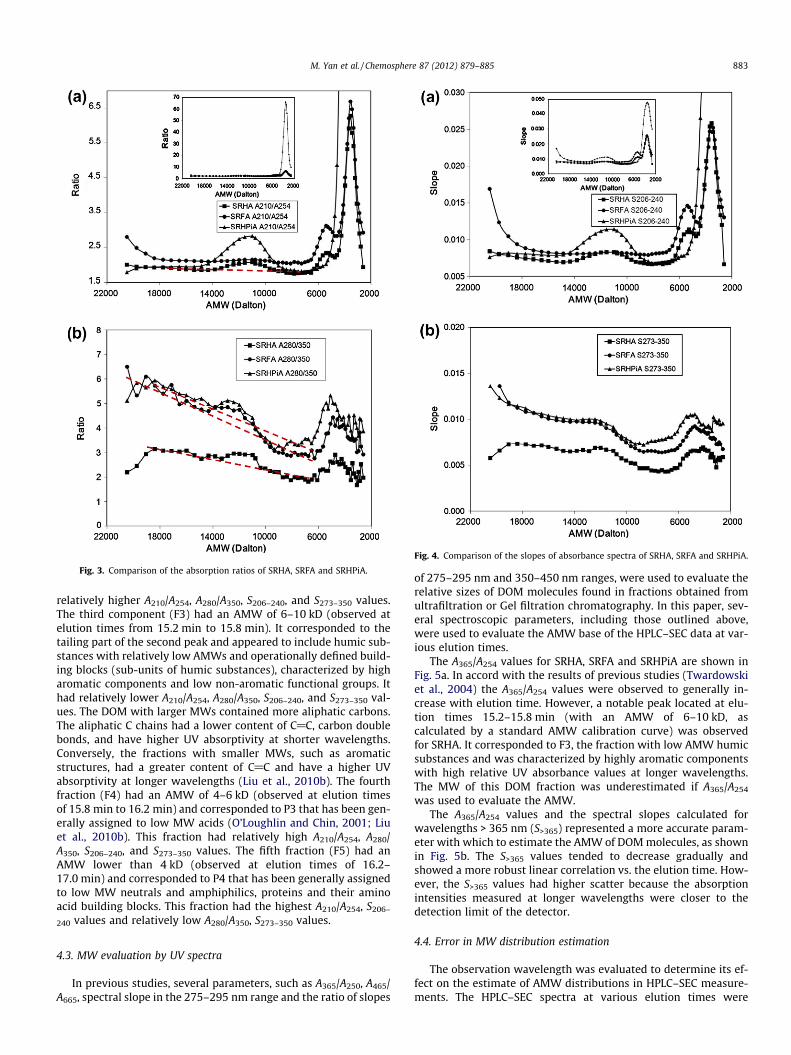
Fig. 3. Comparison of the absorption ratios of SRHA, SRFA and SRHPiA.
Fig. 4. Comparison of the slopes of absorbance spectra of SRHA, SRFA and SRHPiA.
M. Yan et al. / Chemosphere 87 (2012) 879–885 883
relatively higher A210/A254, A280/A350, S206–240, and S273–350 values.The third component (F3) had an AMW of 6–10 kD (observed atelution times from 15.2 min to 15.8 min). It corresponded to thetailing part of the second peak and appeared to include humic sub-stances with relatively low AMWs and operationally defined build-ing blocks (sub-units of humic substances), characterized by higharomatic components and low non-aromatic functional groups. Ithad relatively lower A210/A254, A280/A350, S206–240, and S273–350 val-ues. The DOM with larger MWs contained more aliphatic carbons.The aliphatic C chains had a lower content of C@C, carbon doublebonds, and have higher UV absorptivity at shorter wavelengths.Conversely, the fractions with smaller MWs, such as aromaticstructures, had a greater content of C@C and have a higher UVabsorptivity at longer wavelengths (Liu et al., 2010b). The fourthfraction (F4) had an AMW of 4–6 kD (observed at elution timesof 15.8 min to 16.2 min) and corresponded to P3 that has been gen-erally assigned to low MW acids (O’Loughlin and Chin, 2001; Liuet al., 2010b). This fraction had relatively high A210/A254, A280/A350, S206–240, and S273–350 values. The fifth fraction (F5) had anAMW lower than 4 kD (observed at elution times of 16.2–17.0 min) and corresponded to P4 that has been generally assignedto low MW neutrals and amphiphilics, proteins and their aminoacid building blocks. This fraction had the highest A210/A254, S206–
240 values and relatively low A280/A350, S273–350 values.
4.3. MW evaluation by UV spectra
In previous studies, several parameters, such as A365/A250, A465/A665, spectral slope in the 275–295 nm range and the ratio of slopes
of 275–295 nm and 350–450 nm ranges, were used to evaluate therelative sizes of DOM molecules found in fractions obtained fromultrafiltration or Gel filtration chromatography. In this paper, sev-eral spectroscopic parameters, including those outlined above,were used to evaluate the AMW base of the HPLC–SEC data at var-ious elution times.
The A365/A254 values for SRHA, SRFA and SRHPiA are shown inFig. 5a. In accord with the results of previous studies (Twardowskiet al., 2004) the A365/A254 values were observed to generally in-crease with elution time. However, a notable peak located at elu-tion times 15.2–15.8 min (with an AMW of 6–10 kD, ascalculated by a standard AMW calibration curve) was observedfor SRHA. It corresponded to F3, the fraction with low AMW humicsubstances and was characterized by highly aromatic componentswith high relative UV absorbance values at longer wavelengths.The MW of this DOM fraction was underestimated if A365/A254
was used to evaluate the AMW.The A365/A254 values and the spectral slopes calculated for
wavelengths > 365 nm (S>365) represented a more accurate param-eter with which to estimate the AMW of DOM molecules, as shownin Fig. 5b. The S>365 values tended to decrease gradually andshowed a more robust linear correlation vs. the elution time. How-ever, the S>365 values had higher scatter because the absorptionintensities measured at longer wavelengths were closer to thedetection limit of the detector.
4.4. Error in MW distribution estimation
The observation wavelength was evaluated to determine its ef-fect on the estimate of AMW distributions in HPLC–SEC measure-ments. The HPLC–SEC spectra at various elution times were

Fig. 5. MW estimation indexes of (a) A356/A254 and (b) S>365.
Fig. 6. Normalized HPLC–SEC chromatogram subtracted by the normalized absor-bance spectra of (a) SRHA, (b) SRFA and (c) SRHPiA.
884 M. Yan et al. / Chemosphere 87 (2012) 879–885
normalized by the absorbance at a priori selected reference wave-length (e.g., 220 nm). The data were processed further by subtract-ing the normalized absorbance spectrum of the DOM byabsorbance intensity at the same reference wavelength. This calcu-lation can be expressed in the following equation:
RIw;t ¼Iw;t
I220;t� tw
t220ð5Þ
where RIw,t is the error at wavelength w and elution time t (i = 200–445 nm; w = 14.2–17.0 min). Iw,t is the intensity measured byHPLC–SEC at wavelength w and elution time t (w = 200–445 nm;t = 14.2–17.0 min). I220,t is the intensity measured by HPLC–SEC atwavelength 220 nm and elution time t (t = 14.2–17.0 min). iw isthe intensity measured by UV/vis spectrophotometer at wavelengthw (w = 200–445 nm). i220 is the intensity measured by UV/vis spec-trophotometer at wavelength 220 nm.
The relative errors in MW distribution estimation for SRHA,SRFA and SRHPiA are shown in Fig. 6a–c, respectively. As shownin Fig. 6a for SRHA, there were two areas at wavelengths longerthan 220 nm that have negative values beyond 10%. These areascorresponded to DOM with an AMW larger than 10 kD and smallerthan 6 kD. Additionally, there were several peak areas found atwavelengths lower than 220 nm, but these areas were overlookedin this study due to interference from inorganic ions at low wave-lengths (e.g., NO�3 ; SO2�
4 , and PO3�4 ) (Her et al., 2008; Korshin et al.,
2009). SRFA and SRHPiA also showed the same phenomena asSRHA, though the areas and depths of the washes were different.The areas and depths of washes at AMWs larger than 10 kD weresmaller for SRFA and SRHPiA. Furthermore, the areas and depths
of the washes at AMWs smaller than 6 kD are bigger for SRFAand especially SRHPiA.
There was an error in evaluating Mn and Mw based on Eqs. (1)and (2). The error changed with the wavelength utilized and thecharacteristics of the DOM. In general, the error was within ±10%.For some special fractions, such as humic substance or low WMnon-aromatic matters, the error was greater than 30% at certainwavelengths.
The HPLC–SEC coupled with a multiple wavelength absorbancedetector was a useful technique to characterize DOM. It not onlycharacterized the MW distribution of the DOM more accurately,but it also provided some interesting information on DOM charac-teristics at various MWs. However, further work is needed tounderstand the UV spectra.
Acknowledgements
The authors are very grateful to Dr. Michael Dodd for their sup-port for this research. This research was also founded by CNSF

M. Yan et al. / Chemosphere 87 (2012) 879–885 885
50808001, the China Postdoctoral Science Foundation and ChinaScholarship Council.
Appendix A. Supplementary material
HPLC–SEC calibration curve and the chromatograms for thesesamples measured at several representative wavelengths and areshown in Figs. 1S and 2S in the Supplemental Information (SI),respectively. Supplementary data associated with this article canbe found, in the online version, at doi:10.1016/j.chemosphere.2012.01.029.
References
Akagi, J., Zsolnay, A., Bastida, F., 2007. Quantity and spectroscopic properties of soildissolved organic matter (DOM) as a function of soil sample treatments: air-drying and pre-incubation. Chemosphere 69, 1040–1046.
Allpike, B.P., Heitz, A., Joll, C.A., Kagi, R.I., Abbt-Braun, G., Frimmel, F.H., Brinkmann,T., Her, N., Amy, G., 2005. Size exclusion chromatography to characterize DOCremoval in drinking water treatment. Environ. Sci. Technol. 39, 2334–2342.
Amy, G.L., Collins, M.R., Kuo, C.J., King, P.H., 1987. Comparing gel-permeationchromatography and ultrafiltration for the molecular-weight characterizationof aquatic organic-matter. J. Am. Water Works Assoc. 79, 43–49.
Baker, A., 2001. Fluorescence excitation-emission matrix characterization of somesewage-impacted rivers. Environ. Sci. Technol. 35, 948–953.
Cai, Z., Benjamin, M.M., 2011. NOM fractionation and fouling of low-pressuremembranes in microgranular adsorptive filtration. Environ. Sci. Technol. 45,8935–8940.
Carder, K.L., Steward, R.G., Harvey, G.R., Ortner, P.B., 1989. Marine humic and fulvic-acids - their effects on remote-sensing of ocean chlorophyll. Limnol. Oceanogr.34, 68–81.
Chin, Y.P., Aiken, G., Oloughlin, E., 1994. Molecular-weight, polydispersity, andspectroscopic properties of aquatic humic substances. Environ. Sci. Technol. 28,1853–1858.
De Haan, H., De Boer, T., 1987. Applicability of light absorbance and fluorescence asmeasures of concentration and molecular size of dissolved organic carbon inhumic Laken Tjeukemeer. Water Res. 21, 731–734.
Helms, J.R., Stubbins, A., Ritchie, J.D., Minor, E.C., Kieber, D.J., Mopper, K., 2008.Absorption spectral slopes and slope ratios as indicators of molecular weight,source, and photobleaching of chromophoric dissolved organic matter. Limnol.Oceanogr. 53, 955–969.
Her, N., 2003. Characterization of DOM as a function of MW by fluorescence EEMand HPLC–SEC using UVA, DOC, and fluorescence detection. Water Res. 37,4295–4303.
Her, N., Amy, G., Foss, D., Cho, J., Yoon, Y., Kosenka, P., 2002a. Optimization ofmethod for detecting and characterizing NOM by HPLC–size exclusionchromatography with UV and on-line DOC detection. Environ. Sci. Technol.36, 1069–1076.
Her, N., Amy, G., Foss, D., Cho, J.W., 2002b. Variations of molecular weightestimation by HP–size exclusion chromatography with UVA versus online DOCdetection. Environ. Sci. Technol. 36, 3393–3399.
Her, N., Amy, G., Sohn, J., Gunten, U., 2008. UV absorbance ratio index with sizeexclusion chromatography (URI-SEC) as an NOM property indicator. J. WaterSupply Res. Technol. 57, 35–44.
Huber, S.A., Frimmel, F.H., 1994. Direct gel chromatographic characterization andquantification of marine dissolved organic-carbon using high-sensitivity docdetection. Environ. Sci. Technol. 28, 1194–1197.
Huber, S.A., Balz, A., Abert, M., Pronk, W., 2011. Characterisation of aquatic humicand non-humic matter with size-exclusion chromatography–organic carbondetection–organic nitrogen detection (LC–OCD–OND). Water Res. 45, 879–885.
Hur, J., Kim, G., 2009. Comparison of the heterogeneity within bulk sediment humicsubstances from a stream and reservoir via selected operational descriptors.Chemosphere 75, 483–490.
Korshin, G.V., Li, C.W., Benjamin, M.M., 1997. Monitoring the properties of naturalorganic matter through UV spectroscopy: a consistent theory. Water Res. 31,1787–1795.
Korshin, G., Chow, C.W.K., Fabris, R., Drikas, M., 2009. Absorbance spectroscopy-based examination of effects of coagulation on the reactivity of fractions ofnatural organic matter with varying apparent molecular weights. Water Res. 43,1541–1548.
Leenheer, J.A., Croue, J.P., 2003. Characterizing aquatic dissolved organic matter.Environ. Sci. Technol. 37, 18a–26a.
Li, C.W., Benjamin, M.M., Korshin, G.V., 2006. Characterization of NOM and itsadsorption by iron oxide coated sand (IOCS) using UV and fluorescencespectroscopy. J. Environ. Eng. Sci. 5, 467–472.
Liu, S., Lim, M., Fabris, R., Chow, C., Drikas, M., Amal, R., 2010a. Comparison ofphotocatalytic degradation of natural organic matter in two Australian surfacewaters using multiple analytical techniques. Org. Geochem. 41, 124–129.
Liu, S., Lim, M., Fabris, R., Chow, C.W.K., Drikas, M., Korshin, G., Amal, R., 2010b.Multi-wavelength spectroscopic and chromatography study on thephotocatalytic oxidation of natural organic matter. Water Res. 44, 2525–2532.
O’Loughlin, E., Chin, Y.P., 2001. Effect of detector wavelength on the determinationof the molecular weight of humic substances by high-pressure size exclusionchromatography. Water Res. 35, 333–338.
Peuravouri, J., Pihlaja, K., 1997. Molecular size distribution and spectroscopicproperties of aquatic humic substances. Anal. Chim. Acta 337, 133–149.
Rosenberger, S., Laabs, C., Lesjean, B., Gnirss, R., Amy, G., Jekel, M., Schrotter, J.C.,2006. Impact of colloidal and soluble organic material on membraneperformance in membrane bioreactors for municipal wastewater treatment.Water Res. 40, 710–720.
Twardowski, M.S., Boss, E., Sullivan, J.M., Donaghay, P.L., 2004. Modeling thespectral shape of absorption by chromophoric dissolved organic matter. Mar.Chem. 89, 69–88.
Wong, S., Hanna, J.V., King, S., Carroll, T.J., Eldridge, R.J., Dixon, D.R., Bolto, B.A.,Hesse, S., Abbt-Braun, G., Frimmel, F.H., 2002. Fractionation of natural organicmatter in drinking water and characterization by C-13 cross-polarizationmagic-angle spinning NMR spectroscopy and size exclusion chromatography.Environ. Sci. Technol. 36, 3497–3503.
Yan, M.Q., Wang, D.S., You, S.J., Qu, J.H., Tang, H.X., 2006. Enhanced coagulation in atypical North-China water treatment plant. Water Res. 40, 3621–3627.
Yan, M.Q., Wang, D.S., Shi, B.Y., Wei, Q.S., Qu, H.H., Tang, H.X., 2007. Transformationsof particles, metal elements and natural organic matter in different watertreatment processes. J. Environ. Sci. – China 19, 271–277.