characterization of composite materials
DESCRIPTION
Composite materials make their way into all aspects of modern technological society, but particularly so for applications requiring great strength and light weight such as in the aerospace industry. Because they are hybrid heterogeneous materials, they can be difficult to characterize with any one single methodology This volume in the Materials Characterization Series will guide engineers and technicians on which methods work best and what to look for when reading results, be they from X-Ray diffraction, or Nuclear Magnetic Imaging.TRANSCRIPT
v
Contents
Preface to the Reissue of the Materials Characterization Series x
Preface to Series xi
Preface to the Reissue of Characterization of Composite Materials xii
Preface xiii
Acronyms xiv
Contributors xv
X-RAY PHOTOELECTRON SPECTROSCOPY (XPS) AND ELECTRON SPECTROSCOPY FOR CHEMICAL ANALYSIS (ESCA)
1.1 Introduction 1
1.2 Fundamental Principles: XPS and ESCA 2
1.3 Applications of XPS/ESCA to Composites 9
Fibers 10, Polymer Matrix Materials 13, Composites 14, Failure Modes 19
1.4 Summary 23
RAMAN SPECTROSCOPY
2.1 Introduction 26
2.2 Normal Raman Scattering 27
2.3 Surface-Enhanced Raman Scattering 28
2.4 Polymer–Metal Composites 29
Adsorption of Polymer to Metal 29, Adhesive–Adherent Interactions 33
imo-ishida-00fm.indd vimo-ishida-00fm.indd v 3/1/10 2:06 PM3/1/10 2:06 PM
vi CONTENTS
2.5 Polymer–Polymer Composites 38
Polymer–Polymer Interdiffusion 38, Surface Segregation in Polymer Blends 39
2.6 Fiber–Polymer Composites 39
Stress Transfer at Interfaces 39, Surface Structure of Carbon Materials 41
2.7 Summary 41
NMR IMAGING OF COMPOSITES
3.1 Introduction 44
Basis of NMR Imaging 45, Relaxation Parameters in NMR Imaging 46, Pulse Sequences for Generating Contrast in Imaging 47, Resolution in NMR Imaging 48, Utility of NMRI 49, Image Processing 49
3.2 Advanced Imaging Techniques 50
Chemical Shift Imaging 50
3.3 NMRI of Solids 52
Design Limitations of High Performance Fiber-Reinforced Composites 52, Interfacial Bond Quality and Defect Characteristics of Composites 53, NMR Imaging as a Composite Inspection Technique: Detection of Internal Voids 54, Detection of Nonuniform Dispersion of Filler 55, Aging of Composites 56, MRI as an Environmental Monitoring Technique 58, Adsorption of Liquids in Polymers 58, 1H Imaging of Solids 58, 13C Imaging of Solids 60
3.4 Conclusions 61
NMR STUDIES OF ISOTOPE-ENRICHED SPECIES AT INTERFACES
4.1 Introduction 64
4.2 Practical NMR Considerations 65
4.3 Surface Modifi ers 67
4.4 Conclusions 77
INVERSE GAS CHROMATOGRAPHY
5.1 Introduction 80
5.2 Characterizing Solid Surfaces 81
imo-ishida-00fm.indd viimo-ishida-00fm.indd vi 3/1/10 2:06 PM3/1/10 2:06 PM
CONTENTS vii
5.3 Inverse Gas Chromatography 81
IGC Versus Traditional Adsorption Methods 82, The Gas Chromatographic Adsorption Process 83, Chromatographic Peaks and the Adsorption Isotherm 85, Experimental Equipment 87
5.4 Applications of IGC 89
Infi nite Dilution IGC on Studies on Cellulose Materials 89, Adsorption Isotherm Studies on Cellulose Materials 90, Acid–Base Surface Properties of Materials 93, Thermodynamic Interaction Parameters for Polymer–Polymer and Polymer–Solute Systems 95, Presence of Contaminants on Fiber Surfaces 97, Measurement of Glass Transition Temperatures using IGC 98
5.5 Future Applications 99
Site Energy Distributions on Heterogeneous Solid Surfaces 99, Characterizing Organic Adsorbates on Particulate Surfaces 100, In Situ Column Reaction Studies 101
DIELECTRIC SPECTROSCOPY
6.1 Dielectric Spectroscopy of Composite Media 105
Dielectric Relaxation in Solids 105, Dielectric Properties of Heterogeneous Media 111
6.2 Dielectric Spectra of Composites: Examples 115
Nonpolymeric Composites 115, Polymeric Composites 117
6.3 Conclusion 123
IMAGING AND CHARACTERIZATION OF MATERIALS BY THE NEW SCANNING PROBE TECHNIQUES (STM/AFM)
7.1 Introduction to Scanning Probe Microscopy (SPM) 129
7.2 Scanning Tunneling Microscopy 131
Introduction 131, Spectroscopy 134
7.3 Atomic Force Microscopy 136
Introduction 136, Dynamic Force Microscopy 138
7.4 Surface Modifi cations with STM/AFM 139
7.5 Related Scanning Techniques 140
Related Tunneling Techniques 140, Related Nontunneling Techniques 143
7.6 Applications to Polymer Composite Materials 143
7.7 The Future of SPM 144
imo-ishida-00fm.indd viiimo-ishida-00fm.indd vii 3/1/10 2:06 PM3/1/10 2:06 PM
viii CONTENTS
ELASTIC AND VISCOELASTIC BEHAVIOR OF COMPOSITES
8.1 Viscoelastic Properties 148
8.2 Isotropic Multiphase Materials 152
8.3 Nonisotropic Multiphase Materials 173
8.4 Summary 178
INFRARED SPECTROSCOPY FOR COMPOSITES
9.1 Introduction 184
Introduction to Spectroscopy 184, Spectrometers 186
9.2 Transmission Spectroscopy 193
Introduction 193, Lambert–Beer’s Law 193, Another Derivation of Lambert–Beer’s Law 195, Reference Spectrum 196, Spectral Subtraction 197, Application Example 197
9.3 Attenuated Total Refl ectance Spectroscopy (ATR) 201
Total Refl ection 201, Attenuated Total Refl ection 202, Penetration Depth 205, Depth Profi les 208, Geometry of IRE 214, Application Example 214
9.4 Refl ection Absorption Spectroscopy (RAS) 217
Introduction 217, TO Modes, LO Modes, and Surface Modes 217, Refl ection and Absorption at Two Interfaces 220, Polarization Modulation RAS 222, Application Example 224
9.5 Grazing Angle Metal Overlayer ATR Spectroscopy 227
Introduction 227, Application Example 229
9.6 Refl ection Spectroscopy 231
Introduction 231, External Refl ection 231, Normal Incidence Specular Refl ection 232
9.7 Diffuse Refl ectance Infrared Fourier Transform (DRIFT) 235
Introduction 235, Diffuse Refl ectance 236, DRIFT Attachment 236, Diffuse Refl ectance Spectrum 236, Kubelka–Munk Theory 237, Problems 239, Solutions to the Problems 239, General Flow to Perform DRIFT 239, Application Example 241
9.8 Emission Spectroscopy 242
Introduction 242, Blackbody 243, Data Analysis 243, Quantifi cation 244, Application Example 245
9.9 Photoacoustic Spectroscopy (PAS) 246
Introduction 246, Modulation Frequency 248, Heat Transfer 249, Optical Absorption Length and Thermal Diffusion
imo-ishida-00fm.indd viiiimo-ishida-00fm.indd viii 3/1/10 2:06 PM3/1/10 2:06 PM

CONTENTS ix
Length 249, Depth Profi les 250, Quantifi cation 251, Application Example 252
9.10 Infrared Microspectroscopy 254
Introduction 254, Spatial Resolution 255, Refl ection Mode 257, Mapping 258, Application Example 258
9.11 Appendix 258
Relationship between Optical Constants and Dielectric Constants 258, Spectral Simulation 261, Anisotropic Sample 261, About the Complex Representation 264, Symbols 265
Index 273
imo-ishida-00fm.indd iximo-ishida-00fm.indd ix 3/1/10 2:06 PM3/1/10 2:06 PM
x
Preface to the Reissue of the Materials Characterization Series
The 11 volumes in the Materials Characterization Series were originally published between 1993 and 1996. They were intended to be complemented by the Encyclope-dia of Materials Characterization, which provided a description of the analytical tech-niques most widely referred to in the individual volumes of the series. The individual materials characterization volumes are no longer in print, so we are reissuing them under this new imprint.
The idea of approaching materials characterization from the material user’s perspective rather than the analytical expert’s perspective still has great value, and though there have been advances in the materials discussed in each volume, the basic issues involved in their characterization have remained largely the same. The intent with this reissue is, fi rst, to make the original information available once more, and then to gradually update each volume, releasing the changes as they occur by on-line subscription.
C. R. Brundle and C. A. Evans, October 2009
imo-ishida-00fm.indd ximo-ishida-00fm.indd x 3/1/10 2:06 PM3/1/10 2:06 PM
xi
Preface to Series
This Materials Characterization Series attempts to address the needs of the practical materials user, with an emphasis on the newer areas of surface, interface, and thin fi lm microcharacterization. The Series is composed of the leading volume, Encyclope-dia of Materials Characterization, and a set of about 10 subsequent volumes concen-trating on characterization of individual materials classes.
In the Encyclopedia, 50 brief articles (each 10 to 18 pages in length) are presented in a standard format designed for ease of reader access, with straightforward tech-nique descriptions and examples of their practical use. In addition to the articles, there are one-page summaries for every technique, introductory summaries to group-ings of related techniques, a complete glossary of acronyms, and a tabular compari-son of the major features of all 50 techniques.
The 10 volumes in the Series on characterization of particular materials classes include volumes on silicon processing, metals and alloys, catalytic materials, inte-grated circuit packaging, etc. Characterization is approached from the materials user’s point of view. Thus, in general, the format is based on properties, processing steps, materials classifi cation, etc., rather than on a technique. The emphasis of all volumes is on surfaces, interfaces, and thin fi lms, but the emphasis varies depending on the relative importance of these areas for the materials class concerned. Appendixes in each volume reproduce the relevant one-page summaries from the Encyclopedia and provide longer summaries for any techniques referred to that are not covered in the Encyclopedia.
The concept for the Series came from discussion with Marjan Bace of Manning Publications Company. A gap exists between the way materials characterization is often presented and the needs of a large segment of the audience—the materials user, process engineer, manager, or student. In our experience, when, at the end of talks or courses on analytical techniques, a question is asked on how a particular material (or processing) characterization problem can be addressed the answer often is that the speaker is “an expert on the technique, not the materials aspects, and does not have experience with that particular situation.” This Series is an attempt to bridge this gap by approaching characterization problems from the side of the materials user rather than from that of the analytical techniques expert.
We would like to thank Marjan Bace for putting forward the original concept, Shaun Wilson of Charles Evans and Associates and Yale Strausser of Surface Science Laboratories for help in further defi ning the Series, and the Editors of all the indi-vidual volumes for their efforts to produce practical, materials user based volumes.
C.R. Brundle and C.A. Evans
imo-ishida-00fm.indd xiimo-ishida-00fm.indd xi 3/1/10 2:06 PM3/1/10 2:06 PM
xii
Preface to the Reissue of Characterization of Composite Materials
Composite materials, by defi nition, are heterogeneous on some dimensional scale. Classically this meant fi ber reinforced polymers, but now days it includes nanoscale mixtures and compounds, and sub-nanoscale molecular compounds. The histori-cal approach to understanding composites was based largely on direct evaluation of the mechanical properties. The modern approach requires an understanding at the nanoscale of the composition, structure, and bonding; this is the subject mat-ter of the present volume. Though there have been advances since it was originally published, the underlying principles have not changed. The basics of the techniques used for analysis and characterization of composites remain also valid, though there have obviously been many incremental technological improvements here. Following the reissue of the volume, in close to its original form, it is our intention to release updates and new chapters as on-line downloads, as they become available.
C. R. Brundle and C. A. Evans, December 2009
imo-ishida-00fm.indd xiiimo-ishida-00fm.indd xii 3/1/10 2:06 PM3/1/10 2:06 PM

xiii
Preface
Development of new materials is becoming increasingly diffi cult, both because of increased environmental concerns and because the number of useful materials made from simple components is limited. We are thus motivated to focus our attention on the improved use of existing materials. Composite materials are ideal candidates for this purpose. Composite materials can be narrowly defi ned to be fi ber-reinforced polymers, such as carbon fi ber-reinforced epoxy resin. However, as composite tech-nology has advanced, the defi nition of composite materials has become broader, to include materials such as molecular composites and nanocomposites which are also similar to immiscible blends. From a characterization perspective, these materials can be treated as heterogeneous materials. While all characterization techniques can be used for homogeneous materials, the subject discussed in this volume emphasizes the unique features of composite characterization.
There are many techniques that can be used to characterize composite materials, and reviewing all of them is beyond the scope of this volume. Characterization tech-niques are divided into three categories: those which are considered extremely easy and routine, those which require special knowledge or advanced techniques but are available without extreme diffi culties, and those which are quite unusual and of limited availability, to few laboratories. This volume focuses on the second category of charac-terization techniques, to provide maximum benefi ts for researchers in composite and heterogeneous materials. Each chapter contains a signifi cant amount of instructional material rather than just a review of the author’s or other researchers’ works. This fea-ture is helpful for the novice researchers in the fi eld. Each chapter also contains state-of-the-art knowledge. For the beginners, this can be regarded as the milestone or current limitation of the respective technique, and for the more experienced, a convenient reminder of what is being done in this rapidly developing fi eld.
The characterization techniques chosen are mostly atomic, molecular, and rheo-logical techniques. Mechanical techniques are excluded, as there are already many excellent introductory materials available. Historically, composite materials have been studied by evaluating mechanical properties, leading to a lack of molecular and chemical understanding. For this reason, we hope that this volume will be a guide to this poorly exploited, yet important fi eld of materials research.
We wish to thank the staff of Manning Publications for their role in helping this book to be published, and in particular Marjan Bace in the conceptual stages, Lee Fitzpatrick during the protracted writing of the manuscript, and Stephen Adams during book production.
Hatsuo Ishida
imo-ishida-00fm.indd xiiiimo-ishida-00fm.indd xiii 3/1/10 2:06 PM3/1/10 2:06 PM
xiv ACRONYMS
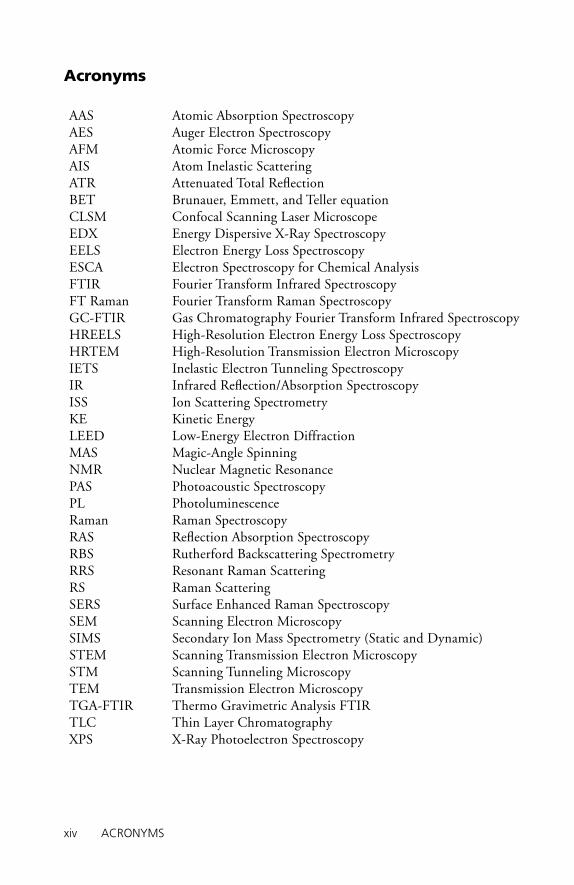
Acronyms
AAS Atomic Absorption SpectroscopyAES Auger Electron SpectroscopyAFM Atomic Force MicroscopyAIS Atom Inelastic ScatteringATR Attenuated Total Refl ectionBET Brunauer, Emmett, and Teller equationCLSM Confocal Scanning Laser MicroscopeEDX Energy Dispersive X-Ray SpectroscopyEELS Electron Energy Loss SpectroscopyESCA Electron Spectroscopy for Chemical AnalysisFTIR Fourier Transform Infrared SpectroscopyFT Raman Fourier Transform Raman SpectroscopyGC-FTIR Gas Chromatography Fourier Transform Infrared SpectroscopyHREELS High-Resolution Electron Energy Loss SpectroscopyHRTEM High-Resolution Transmission Electron MicroscopyIETS Inelastic Electron Tunneling SpectroscopyIR Infrared Refl ection/Absorption SpectroscopyISS Ion Scattering SpectrometryKE Kinetic EnergyLEED Low-Energy Electron DiffractionMAS Magic-Angle SpinningNMR Nuclear Magnetic ResonancePAS Photoacoustic SpectroscopyPL PhotoluminescenceRaman Raman SpectroscopyRAS Refl ection Absorption SpectroscopyRBS Rutherford Backscattering SpectrometryRRS Resonant Raman ScatteringRS Raman ScatteringSERS Surface Enhanced Raman SpectroscopySEM Scanning Electron MicroscopySIMS Secondary Ion Mass Spectrometry (Static and Dynamic)STEM Scanning Transmission Electron MicroscopySTM Scanning Tunneling MicroscopyTEM Transmission Electron MicroscopyTGA-FTIR Thermo Gravimetric Analysis FTIRTLC Thin Layer ChromatographyXPS X-Ray Photoelectron Spectroscopy
imo-ishida-00fm.indd xivimo-ishida-00fm.indd xiv 3/1/10 2:06 PM3/1/10 2:06 PM
CONTRIBUTORS xv
Contributors
György BánhegyiFurukawa Electric Institute ofTechnologyBudapest, Hungary
Dielectric Spectroscopy
Frank D. BlumDepartment of ChemistryUniversity of Missouri-RollaRolla, MO
NMR Studies of Isotope-Enriched Spe-cies at Interfaces
F. James BoerioDepartment of Materials Scienceand EngineeringUniversity of CincinnatiCincinnati, OH
Raman Spectroscopy
John G. DillardDepartment of ChemistryVirginia Polytechnic InstituteBlacksburg, VA
X-Ray Photoelectron Spectroscopy (XPS) and Electron Spectroscopy for Chemical Analysis (ESCA)
P.C.M. GrimDepartment of Polymer ChemistryUniversity of GroningenThe Netherlands
Imaging and Characterization of Materi-als by the New Scanning Probe Tech-niques (STM/AFM)
George HadziioannouDepartment of Polymer ChemistryUniversity of GroningenThe Netherlands
Imaging and Characterization of Materi-als by the New Scanning Probe Tech-niques (STM/AFM)
Hatsuo IshidaDepartment of Macromolecular ScienceCase Western Reserve UniversityCleveland, OH
Elastic Viscoelastic Behavior of Com-posites, Infrared Spectroscopy for Composites
Jack L. KoenigDepartment of Macromolecular ScienceCase Western Resevre UniversityCleveland, OH
NMR Imaging of Composites
Takeshi OwakiDepartment of Macromolecular ScienceCase Western Reserve UniversityCleveland, OH
Infrared Spectroscopy for Composites
imo-ishida-00fm.indd xvimo-ishida-00fm.indd xv 3/1/10 2:06 PM3/1/10 2:06 PM

xvi CONTRIBUTORS
Robert A. ShickDepartment of Macromolecular ScienceCase Western Reserve UniversityCleveland, OH
Elastic Viscoelastic Behavior of Composites
Wen-Hsien TsaiPolymer Science andTechnology DivisionUnion Chemical LaboratoriesTaiwan, ROC
Raman Spectroscopy
Daryl WilliamsDepartment of Chemical EngineeringImperial CollegeLondon, UK
Inverse Gas Chromotagraphy
imo-ishida-00fm.indd xviimo-ishida-00fm.indd xvi 3/1/10 2:06 PM3/1/10 2:06 PM
1
1
X-Ray Photoelectron Spectroscopy (XPS) and Electron Spectroscopy for Chemical Analysis (ESCA)
john g. dillard
Contents
1.1 Introdouction1.2 Fundamental Principles: XPS and ESCA1.3 Applications of XPS/ESCA to Composites1.4 Summary
1.1 Introduction
Composites are used in many areas of industry and transportation, including land, sea, and air transportation systems, commercial appliances, and electronics and computer systems.1 The manner in which a composite is used may require high strength or chemical stability at high temperatures, or high strength and durability under severe environmental conditions. In these applications, the chemical nature of the composite surface may play an important role in effective use and durabil-ity of the composite or of the structure. Knowledge of the elemental composition or chemical functionality of the composite surface or of the fi ber-matrix inter-face may be essential for designing composite materials that will be useful for a particular application. In many applications, such as structural adhesive bonding, information on the chemical nature of a composite surface is vital for selecting or designing an adhesive system for use in the construction of the structure. In other applications, the deposition of a protective surface fi lm requires knowledge of the substrate surface chemistry. Thus it is of interest to be able to obtain analytical chem-ical information on the nature of substrate surfaces. The objectives of this chapter are to introduce the fundamentals of surface analysis via X-ray photoelectron spectros-copy (XPS) or electron spectroscopy for chemical analysis (ESCA), and to illustrate
imo-ishida-01.indd 1imo-ishida-01.indd 1 3/1/10 2:11 PM3/1/10 2:11 PM
2 XPS AND ESCA Chapter 1
the applications of the technique in the investigation of the surface chemistry of polymer-based composites and composite components. These two names, XPS and ESCA, are commonly used to indicate this surface spectroscopic technique. The designation XPS arises from early studies of the photoelectric effect, where photons with energies in the X-ray region were used to promote ionization.2, 3 The term ESCA was introduced by Siegbahn and coworkers2 to emphasize the potential use of electron spectroscopy for elemental and chemical analysis.
1.2 Fundamental Principles: XPS and ESCA
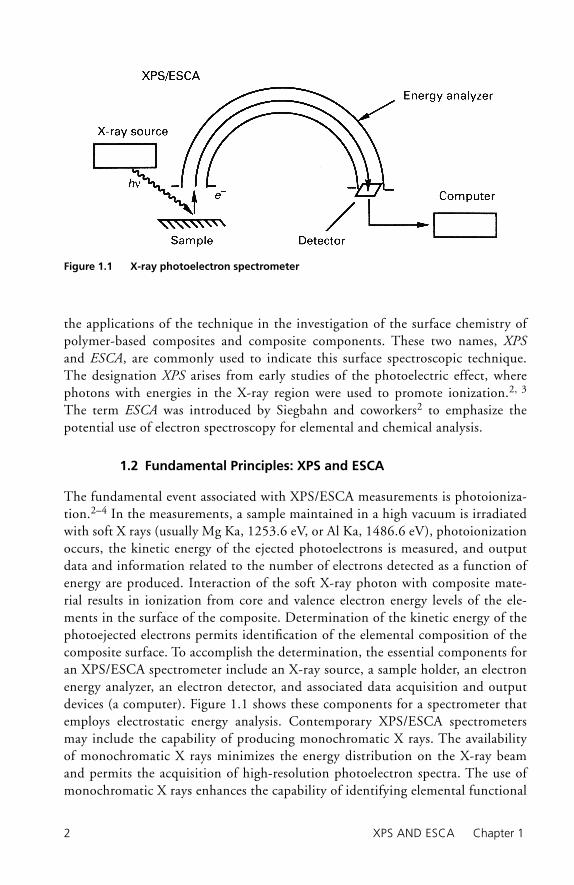
The fundamental event associated with XPS/ESCA measurements is photoioniza-tion.2–4 In the measurements, a sample maintained in a high vacuum is irradiated with soft X rays (usually Mg Ka, 1253.6 eV, or Al Ka, 1486.6 eV), photoionization occurs, the kinetic energy of the ejected photoelectrons is measured, and output data and information related to the number of electrons detected as a function of energy are produced. Interaction of the soft X-ray photon with composite mate-rial results in ionization from core and valence electron energy levels of the ele-ments in the surface of the composite. Determination of the kinetic energy of the photoejected electrons permits identifi cation of the elemental composition of the composite surface. To accomplish the determination, the essential components for an XPS/ESCA spectrometer include an X-ray source, a sample holder, an electron energy analyzer, an electron detector, and associated data acquisition and output devices (a computer). Figure 1.1 shows these components for a spectrometer that employs electrostatic energy analysis. Contemporary XPS/ESCA spectrometers may include the capability of producing monochromatic X rays. The availability of monochromatic X rays minimizes the energy distribution on the X-ray beam and permits the acquisition of high-resolution photoelectron spectra. The use of monochromatic X rays enhances the capability of identifying elemental functional
Figure 1.1 X-ray photoelectron spectrometer
imo-ishida-01.indd 2imo-ishida-01.indd 2 3/1/10 2:12 PM3/1/10 2:12 PM
1.2 FUNDAMENTAL PRINCIPLES 3
groups in XPS/ESCA measurements. The production and advantages of mono-chromatic X rays in photoelectron spectroscopy will be discussed but will not be emphasized in this presentation. More complete discussions can be found in the literature.5–7
The equation describing the energetics of the photoionization process is:
h ν = EB + EK (1.1)
where hν is the X-ray photon energy, EB is the binding (ionization) energy of the electron from a particular energy level, and EK is the kinetic energy of the ejected photoelectron. The kinetic energy of the electron can be measured using electro-static, time-of-fl ight, or magnetic analyzers. The most commonly used analyzer is the electrostatic system. The measurement of the kinetic energy of the electron permits a determination of the binding energy. In composites which are composed of sev-eral elements, ionization of electrons from the elements occurs, and the elemental composition can be determined. From the binding energy determination, elemental identifi cation and chemical information for the specimen are obtained.
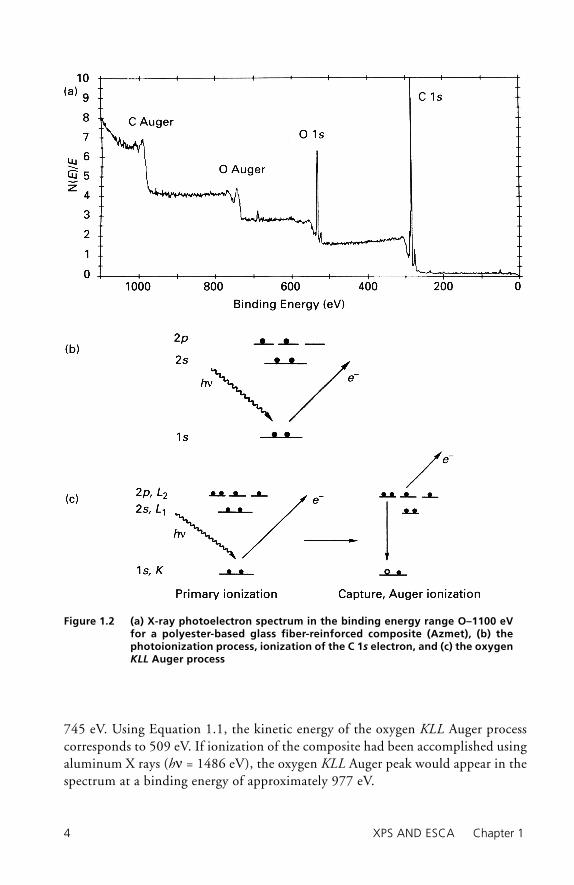
Typical output from XPS/ESCA measurements is in the form of a plot of elec-tron counts (intensity) as a function of electron binding energy or of electron kinetic energy. In Figure 1.2a an XPS/ESCA spectrum for a glass fi ber-reinforced composite (Azmet) is shown. In this spectrum, which is measured for binding energies in the range 0–1100 eV, a magnesium X ray was used to produce photo-electrons. In the spectrum, photopeaks indicative of carbon and oxygen are noted, and Auger peaks arising from carbon and oxygen are also recorded. The photopeaks in the fi gure arise from ionization of 1s core level electrons, as illustrated in Figure 1.2b for carbon. The magnesium X-ray photon energy is suffi cient to photoion-ize carbon 1s, 2s, and 2p electrons, although only ionization of the 1s electrons is shown. Similar processes occur for ionization of oxygen atoms in the composite. The fact that the binding energy (BE = 530 eV) for the oxygen 1s core level elec-tron is greater than that for carbon (BE = 285 eV) arises from the greater effective nuclear charge on oxygen.
The Auger process, as illustrated in Figure 1.2c for oxygen, is a secondary ion-ization event. The “hole” created by primary ionization captures an electron from an upper energy level. The energy available from this transition is suffi cient to ionize an electron from an upper energy level. The electron ionized from the upper energy level is the Auger electron. In the Auger process illustrated in Figure 1.2c, an electron from the oxygen K level is ionized, an electron from the oxygen L level falls into the hole, and the energy released is suffi cient to ionize an oxygen L level electron. This Auger process is identifi ed as a KLL process. Because Auger ioniza-tion is an internal ionization process, the kinetic energy for a particular Auger pro-cess is independent of the X-ray photon energy. The oxygen KLL Auger peak in the XPS/ESCA spectrum in Figure 1.2a appears at a binding energy of approximately
imo-ishida-01.indd 3imo-ishida-01.indd 3 3/1/10 2:12 PM3/1/10 2:12 PM
4 XPS AND ESCA Chapter 1
745 eV. Using Equation 1.1, the kinetic energy of the oxygen KLL Auger process corresponds to 509 eV. If ionization of the composite had been accomplished using aluminum X rays (hν = 1486 eV), the oxygen KLL Auger peak would appear in the spectrum at a binding energy of approximately 977 eV.
Figure 1.2 (a) X-ray photoelectron spectrum in the binding energy range O–1100 eV for a polyester-based glass fiber-reinforced composite (Azmet), (b) the photoionization process, ionization of the C 1s electron, and (c) the oxygen KLL Auger process
imo-ishida-01.indd 4imo-ishida-01.indd 4 3/1/10 2:12 PM3/1/10 2:12 PM
1.2 FUNDAMENTAL PRINCIPLES 5
The determination of the chemical functionality or of the oxidation state for a given element in a specimen can be accomplished by obtaining spectra at higher reso-lution and determining accurate binding energies for the electrons produced in the ionization process from core or valence levels. In usual practice, the binding energy of core-level electrons is determined. The binding energy for core-level electrons is infl uenced by the electron density on the particular atom in the molecule. The sulfur 2p binding energies for sulfur in different chemical oxidation states (electron densi-ties) are given in Table 1.1. The important information illustrated is that the binding energy is high for a given element in a high oxidation state or when it is attached to highly electronegative elements, but the binding energy is low when the same ele-ment is in a low oxidation state. The range of binding energies among the oxidation states for sulfur is typical of the range measured for inorganic nonmetal elements in different oxidation states (6–9 eV).
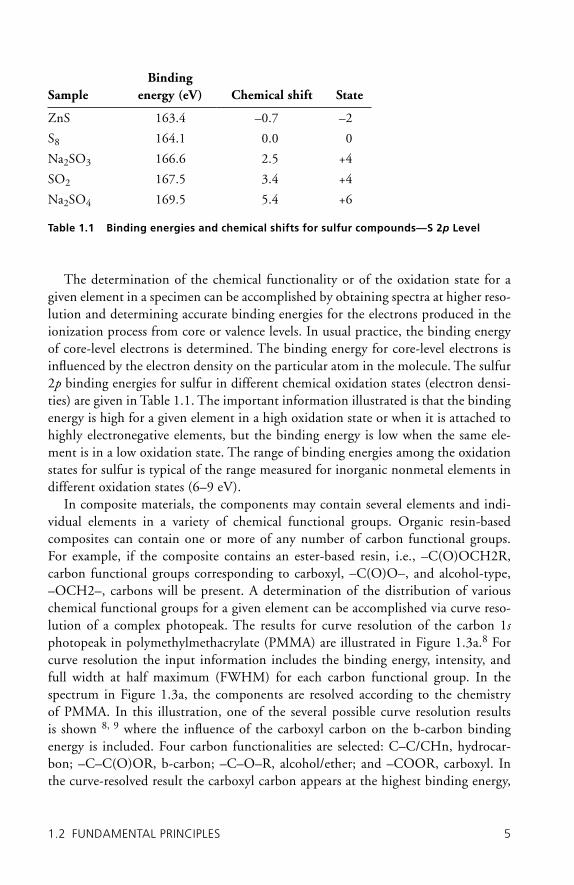
In composite materials, the components may contain several elements and indi-vidual elements in a variety of chemical functional groups. Organic resin-based composites can contain one or more of any number of carbon functional groups. For example, if the composite contains an ester-based resin, i.e., –C(O)OCH2R, carbon functional groups corresponding to carboxyl, –C(O)O–, and alcohol-type, –OCH2–, carbons will be present. A determination of the distribution of various chemical functional groups for a given element can be accomplished via curve reso-lution of a complex photopeak. The results for curve resolution of the carbon 1s photopeak in polymethylmethacrylate (PMMA) are illustrated in Figure 1.3a.8 For curve resolution the input information includes the binding energy, intensity, and full width at half maximum (FWHM) for each carbon functional group. In the spectrum in Figure 1.3a, the components are resolved according to the chemistry of PMMA. In this illustration, one of the several possible curve resolution results is shown 8, 9 where the infl uence of the carboxyl carbon on the b-carbon binding energy is included. Four carbon functionalities are selected: C–C/CHn, hydrocar-bon; –C–C(O)OR, b-carbon; –C–O–R, alcohol/ether; and –COOR, carboxyl. In the curve-resolved result the carboxyl carbon appears at the highest binding energy,
Table 1.1 Binding energies and chemical shifts for sulfur compounds—S 2p Level
SampleBinding
energy (eV) Chemical shift State
ZnS 163.4 –0.7 –2
S8 164.1 0.0 0
Na2SO3 166.6 2.5 +4
SO2 167.5 3.4 +4
Na2SO4 169.5 5.4 +6
imo-ishida-01.indd 5imo-ishida-01.indd 5 3/1/10 2:12 PM3/1/10 2:12 PM
6 XPS AND ESCA Chapter 1
and the hydrocarbon carbon peak occurs at the lowest binding energy among the carbon components. The relative binding energy positions are in agreement with the charge on carbon.8, 9
The oxygen chemistry in PMMA includes oxygen in two chemical environ-ments where oxygen is singly and doubly bonded to carbon. The curve-resolved components shown in Figure 1.3b8 correspond to the –C–O–, alcohol/ether-type group with oxygen singly bonded to carbon (high binding energy) and to the >C=O, carbonyl oxygen where oxygen is doubly bonded to carbon (low binding energy). The FWHM values used to resolve the oxygen 1s photopeak correspond to values that are appropriate for the respective functional groups in PMMA.8 If
Figure 1.3 High-resolution C 1s spectra (curve resolved) for PMMA:8 (a) PMMA structure with carbon functional groups numbered, (b) three-carbon functionality fit: high BE, Cl; middle BE, C2; low BE, C3,4,5, (c) four-carbon functionality fit: high BE, Cl; middle/high BE, C2; middle/low BE, C3; low BE, C4,5, (d) four-carbon functionality fit: high BE, Cl; middle/high BE, C2; middle/low BE, C3,4; low BE, C5; (e) High-resolution O 1s spectra (curve resolved) for PMMA,8 oxygen func-tionality fit: high BE, C–O; low BE, C=O
imo-ishida-01.indd 6imo-ishida-01.indd 6 3/1/10 2:12 PM3/1/10 2:12 PM
1.2 FUNDAMENTAL PRINCIPLES 7
appropriate account is taken of the infl uence of secondary electron and relaxation processes on photopeak intensity, the relative intensities of the respective carbon and oxygen curve-resolved peaks may be related to the stoichiometric composition of the individual functional groups in the compound. In addition, if the relative sensitivity factors for carbon and oxygen are taken into account, the elemental ratio corresponds to the value for stoichiometric PMMA. That such an equivalence is obtained is necessary if accurate and quantitative analyses of the surfaces of com-posites and other materials are to be obtained.
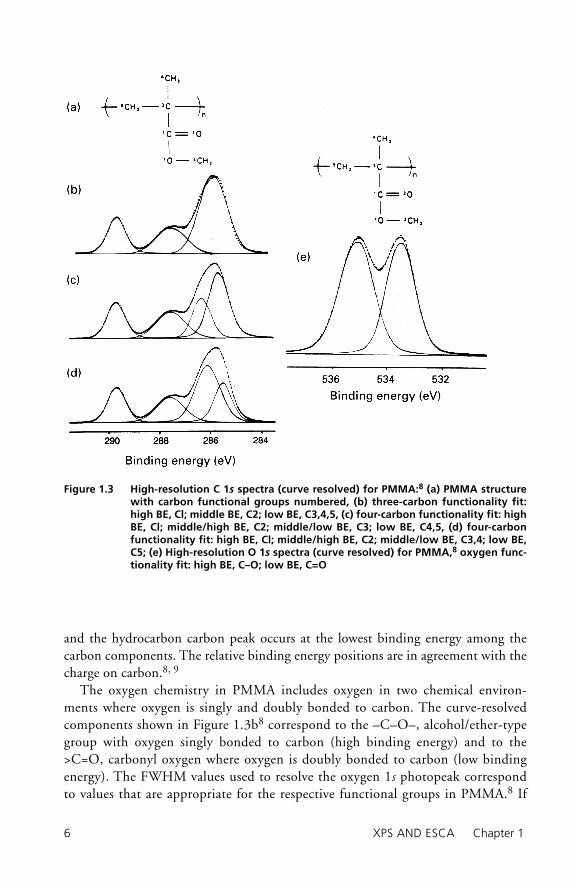
Composites, by their very nature, are heterogeneous materials. It is often of inter-est to obtain the distribution of elements or of chemical functional groups for a particular element across the composite surface. The availability of such information would provide realistic surface microanalysis. To acquire such information requires that the analysis of small areas on the sample be possible (≈ 200 microns or less) and that from such small spot measurements spatially resolved XPS/ESCA images be produced. The approaches for obtaining XPS/ESCA images have been presented in the literature,5–7 and the capabilities and limitations of the systems have been discussed. In the publication by Seah and Smith,5 XPS/ESCA images for gold and lead on selected regions of an integrated circuit package were obtained to demon-strate the capability of their method. As shown in Figure 1.4,5 a spatial resolution of approximately 250 µm is obtained in this image. Commercial instruments with such capabilities are available.6, 7 It does not appear that any imaging XPS/ESCA measurements for composites have been published in the literature, although such measurements and results would be of signifi cant interest and value.
Figure 1.4 XPS/ESCA Au 4f7/2 image map of a portion of an electronic chip package5
imo-ishida-01.indd 7imo-ishida-01.indd 7 3/1/10 2:12 PM3/1/10 2:12 PM
8 XPS AND ESCA Chapter 1
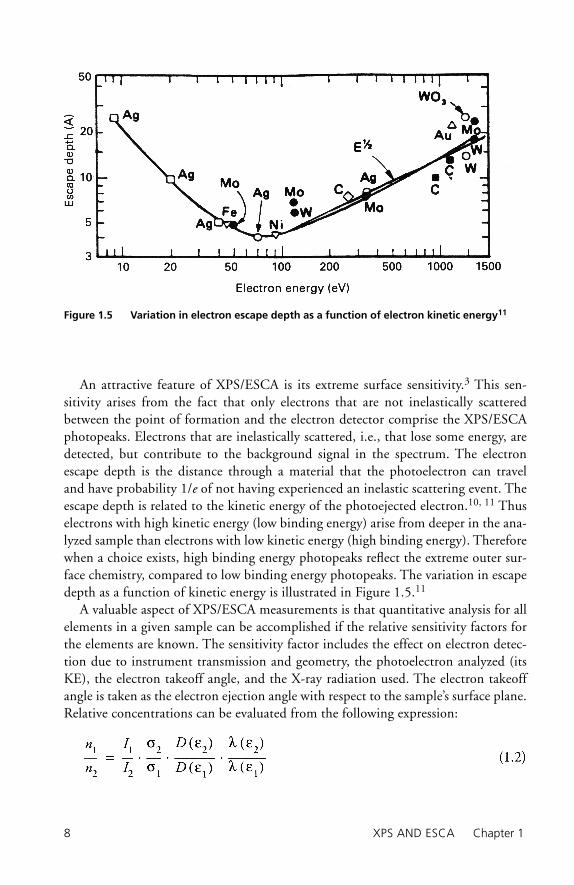
An attractive feature of XPS/ESCA is its extreme surface sensitivity.3 This sen-sitivity arises from the fact that only electrons that are not inelastically scattered between the point of formation and the electron detector comprise the XPS/ESCA photopeaks. Electrons that are inelastically scattered, i.e., that lose some energy, are detected, but contribute to the background signal in the spectrum. The electron escape depth is the distance through a material that the photoelectron can travel and have probability 1/e of not having experienced an inelastic scattering event. The escape depth is related to the kinetic energy of the photoejected electron.10, 11 Thus electrons with high kinetic energy (low binding energy) arise from deeper in the ana-lyzed sample than electrons with low kinetic energy (high binding energy). Therefore when a choice exists, high binding energy photopeaks refl ect the extreme outer sur-face chemistry, compared to low binding energy photopeaks. The variation in escape depth as a function of kinetic energy is illustrated in Figure 1.5.11
A valuable aspect of XPS/ESCA measurements is that quantitative analysis for all elements in a given sample can be accomplished if the relative sensitivity factors for the elements are known. The sensitivity factor includes the effect on electron detec-tion due to instrument transmission and geometry, the photoelectron analyzed (its KE), the electron takeoff angle, and the X-ray radiation used. The electron takeoff angle is taken as the electron ejection angle with respect to the sample’s surface plane. Relative concentrations can be evaluated from the following expression:
Figure 1.5 Variation in electron escape depth as a function of electron kinetic energy11
imo-ishida-01.indd 8imo-ishida-01.indd 8 3/1/10 2:12 PM3/1/10 2:12 PM
1.3 APPLICATIONS OF XPS/ESCA TO COMPOSITES 9
where n1 and n 2 are the densities of atoms 1 and 2; I1 and I2 are the photoelectron signal intensities for levels 1 and 2; σ1 and σ2 are the photoionization cross-sections for levels 1 and 2; D(ε1) and D(ε2) are the detector responses for electrons at energy ε1 and ε2; and λ (ε1) and λ(ε2) are the mean free paths for electron at energies ε1 and ε2.
The measurable quantities are Ij and D(εj), while the other parameters σj12 and
λ(εϕ)10 available in the literature. The value for Ij is taken as the integrated area under the photopeak for a specifi c element, or as the area for each component (functional group) in a single photopeak where curve resolution has been used to identify the functional components for that element. For most applications of XPS/ESCA it is common practice to measure instrument response for a series of compounds containing a common element and from such measurements to obtain an elemental sensitivity factor.13
The preparation of composite materials for XPS/ESCA surface analysis usually involves obtaining a representative portion of the sample. If analysis of the surface of a composite is of interest, then the sample may be introduced into the spectrometer directly using accepted sample preparation procedures. If the composite contains residual volatile components from the preparation of the material, outgassing of the specimen is advised. Alternatively, a specimen that contains volatiles may be intro-duced into the vacuum on a cold probe (liquid nitrogen temperature) to minimize degassing, and the XPS/ESCA data obtained for the cold sample. In some cases it is desirable to determine the bulk or subsurface composition of the composite. In such instances it is convenient to delaminate the composite, to obtain a surface which is representative of the subsurface material. Information on the chemical nature of the outer surface and the subsurface portions of the composite is valuable in establishing the mode of failure for adhesively bonded composites or in studying the distribution of different components in the composite.
1.3 Applications of XPS/ESCA to Composites
The discussion of surface properties of polymer-based composites and the applica-tion of XPS/ESCA surface analysis in the fi eld of composites must consider informa-tion on the fi ber, the matrix resin, and the composite itself. Surface analytical results for fi bers and for matrix resins are desired to better understand fi ber-matrix interac-tions. Analytical information on the chemical nature of fi nished composite surfaces is important for the development and preparation of surface coatings, for the prepara-tion of durable adhesive bonds, and for the detection and study of the migration or segregation of components at the composite surface.
An important consideration in the preparation of composites is the interaction between fi bers and the resin matrix. It is recognized that the fi ber-matrix interfacial region characteristics infl uence signifi cantly the mechanical performance of com-posites.14 Thus, much attention has been focused on the surface treatment of fi bers
imo-ishida-01.indd 9imo-ishida-01.indd 9 3/1/10 2:12 PM3/1/10 2:12 PM
10 XPS AND ESCA Chapter 1
in the attempt to enhance the interaction between fi bers and the matrix. To illustrate the use of XPS/ESCA in this aspect of composites, studies of the surface chemistry of carbon fi bers are considered.
Fibers
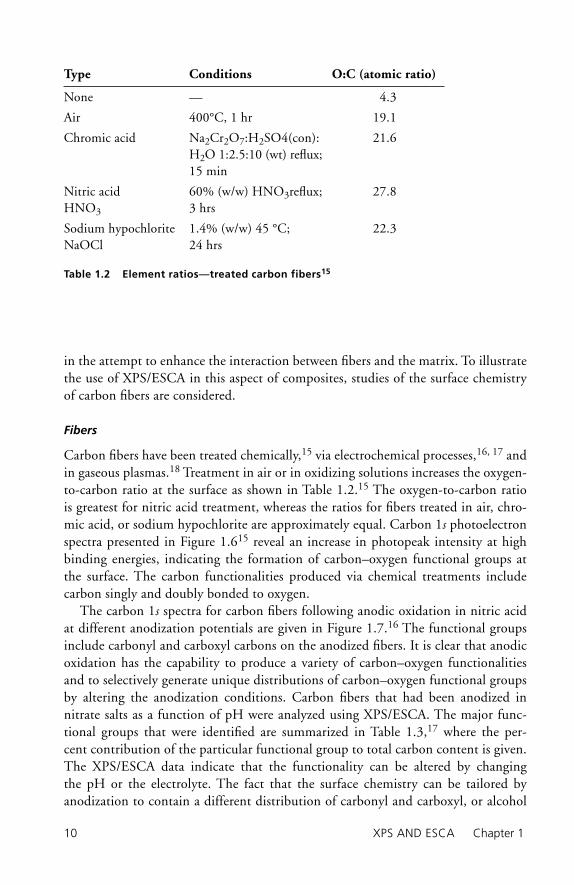
Carbon fi bers have been treated chemically,15 via electrochemical processes,16, 17 and in gaseous plasmas.18 Treatment in air or in oxidizing solutions increases the oxygen-to-carbon ratio at the surface as shown in Table 1.2.15 The oxygen-to-carbon ratio is greatest for nitric acid treatment, whereas the ratios for fi bers treated in air, chro-mic acid, or sodium hypochlorite are approximately equal. Carbon 1s photoelectron spectra presented in Figure 1.615 reveal an increase in photopeak intensity at high binding energies, indicating the formation of carbon–oxygen functional groups at the surface. The carbon functionalities produced via chemical treatments include carbon singly and doubly bonded to oxygen.
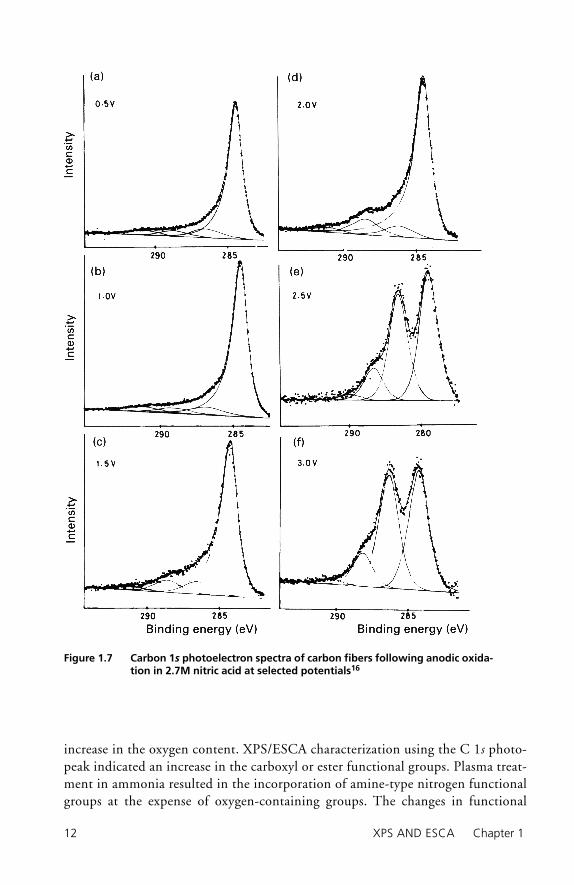
The carbon 1s spectra for carbon fi bers following anodic oxidation in nitric acid at different anodization potentials are given in Figure 1.7.16 The functional groups include carbonyl and carboxyl carbons on the anodized fi bers. It is clear that anodic oxidation has the capability to produce a variety of carbon–oxygen functionalities and to selectively generate unique distributions of carbon–oxygen functional groups by altering the anodization conditions. Carbon fi bers that had been anodized in nitrate salts as a function of pH were analyzed using XPS/ESCA. The major func-tional groups that were identifi ed are summarized in Table 1.3,17 where the per-cent contribution of the particular functional group to total carbon content is given. The XPS/ESCA data indicate that the functionality can be altered by changing the pH or the electrolyte. The fact that the surface chemistry can be tailored by anodization to contain a different distribution of carbonyl and carboxyl, or alcohol
Table 1.2 Element ratios—treated carbon fibers15
Type Conditions O:C (atomic ratio)
None — 4.3
Air 400°C, 1 hr 19.1
Chromic acid Na2Cr2O7:H2SO4(con): H2O 1:2.5:10 (wt) refl ux; 15 min
21.6
Nitric acid HNO3
60% (w/w) HNO3refl ux; 3 hrs
27.8
Sodium hypochlorite NaOCl
1.4% (w/w) 45 °C; 24 hrs
22.3
imo-ishida-01.indd 10imo-ishida-01.indd 10 3/1/10 2:12 PM3/1/10 2:12 PM

1.3 APPLICATIONS OF XPS/ESCA TO COMPOSITES 11
and carboxyl functional groups offers the possibility of obtaining enhanced fi ber-matrix interaction with matrix resins.
Plasma treatment of IM7 carbon fi bers in air, argon, or ammonia produced the results given in Table 1.4.18 Treatment of fi bers in argon or air plasmas caused an
Figure 1.6 Carbon 1s photoelectron spectra of carbon fibers follow-ing treatment in aqueous solutions:15 (a) air; (b) chromic acid; (c) nitric acid; (d) sodium hypochlorite
Table 1.3 Functionality—anodic oxidation carbon fibers17
Electrolyte Carbon functionality %
Nitric acidHNO3; O.2M
Carbonyl; >C=OCarboxyl; –COOR
65.119.1
NaNO3; pH 0.9 Carbonyl; >C=OCarboxyl; –COOR
67.322.0
NaNO3; pH 7.0 Carbonyl; >C=OCarboxyl; –COOR
66.025.3
NaNO3; pH 11.9 Alcohol; –COHCarboxyl; –COOR
54.329.2
Sodium hydroxideNaOH, 0.2M
Alcohol; –COHCarboxyl; –COOR
9.511.2
imo-ishida-01.indd 11imo-ishida-01.indd 11 3/1/10 2:12 PM3/1/10 2:12 PM
12 XPS AND ESCA Chapter 1
increase in the oxygen content. XPS/ESCA characterization using the C 1s photo-peak indicated an increase in the carboxyl or ester functional groups. Plasma treat-ment in ammonia resulted in the incorporation of amine-type nitrogen functional groups at the expense of oxygen-containing groups. The changes in functional
Figure 1.7 Carbon 1s photoelectron spectra of carbon fibers following anodic oxida-tion in 2.7M nitric acid at selected potentials16
imo-ishida-01.indd 12imo-ishida-01.indd 12 3/1/10 2:12 PM3/1/10 2:12 PM

1.3 APPLICATIONS OF XPS/ESCA TO COMPOSITES 13
group content corresponded to an increase in the acidity of the fi ber following treatment in argon or air and to an increase in basicity upon treatment in an ammonia plasma.
Polymer Matrix Materials
Composite materials contain polymeric components at the outer surface; thus the study of polymer surfaces via XPS/ESCA is important. The surface chemistry of polymer materials can be changed by chemical processes and by gaseous plasma/discharge treatments. The modifications are carried out to render the polymer surface compatible for adhesive bonding or for interaction with fibers in the com-posite. Because only the outer polymer surface is modified, XPS/ESCA measure-ments permit a determination of the changes that take place following polymer surface modification.
The effects of various treatments of polyethylene and polypropylene have been reported.19 XPS/ESCA measurements show that oxidizing processes yield polar functional groups. Chromic acid etching produces –C–OH, >C=O, –O–C=O–, and –SO3H groups on low-density polyethylene (LDPE) and polypropylene (PP). Flame treatment of LDPE oxidizes the surface; however, oxidized material is found only in a layer 4–9 nm thick on the polymer surface. Oxidation in air yields >C=O groups. XPS/ESCA spectra for corona-treated polyolefi ns confi rms alcohol, ketone, and car-boxylic acid functional groups.
Exposure of fl uoropolymers to glow discharge plasmas produces near–surface alterations in chemical properties.20 Sputter etching in argon by RF glow discharge introduces –C–O– functional groups on the surface. Exposure of PTFE to ionizing
Table 1.4 XPS/ESCA analysis of plasma-treated IM7 carbon fibers18 (atomic %)
Treatment (15 seconds)
Element As received Argon Air Ammonia
Carbon 84.5 79.5 76.0 85.1
Oxygen 10.2 15.8 19.8 7.8
Nitrogen 5.3 4.7 4.1 7.0
Curve-resolved carbon
C–C, C–H 58.8 50.8 50.4 42.5
C–O, C–N, C=N 13.1 21.8 16.5 11.4
C=O, N–C–O 7.1 6.4 7.5 8.2
O–C=O 4.2 4.4 5.0 8.6
C (π → π*) 1.6 1.4 2.2 3.9
imo-ishida-01.indd 13imo-ishida-01.indd 13 3/1/10 2:12 PM3/1/10 2:12 PM
14 XPS AND ESCA Chapter 1
radiation in the presence of oxygen yields acid-fl uoride functionality. Chemical changes taking place during RF sputtering of PTFE include cross-linking reac-tions and the generation of >C=O functional groups. The formation of >C=O groups is favored for long exposure times. Bombardment of Tefl on with nitro-gen or nitrous oxide ions results in a lower carbon concentration, and fl uorine is replaced by nitrogen. XPS/ESCA data suggest the formation of –NCF– moieties from –CF2– groups.
Gaseous plasma treatment of poly(ethylene terephthalate) (PET) in nitrogen or argon results in21 little change in the CHn, –O–CH2–, or –COO– functional group content as revealed by XPS/ESCA measurements.
Composites
Treatments of composites are selected to prepare surfaces that are resistant to chemi-cal attack, that are compatible with the chemistry of an adhesive, that are able to survive high-temperature exposure, or that will endure hot/wet environments. In understanding the materials chemistry of composites following various treatments, XPS/ESCA measurements play a vital role.
A principal problem regarding surfaces of composites is the presence of mold release agents. For example, common practices for removing these contaminants in the preparation of the surface for adhesive bonding or for other surface reaction pro-cesses include abrasion of the surface in a solvent, grit blasting, or other more severe treatments, such as fl ame or plasma treatment.
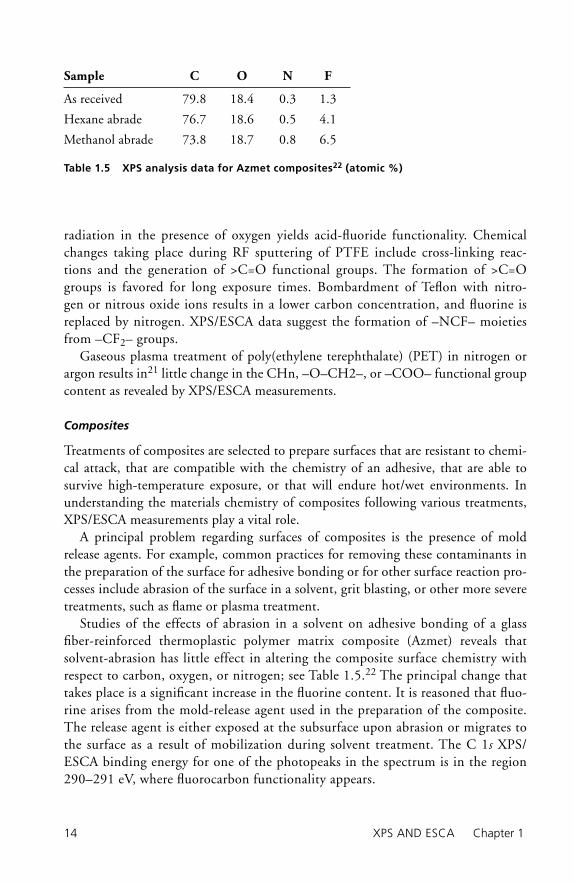
Studies of the effects of abrasion in a solvent on adhesive bonding of a glass fi ber-reinforced thermoplastic polymer matrix composite (Azmet) reveals that solvent-abrasion has little effect in altering the composite surface chemistry with respect to carbon, oxygen, or nitrogen; see Table 1.5.22 The principal change that takes place is a signifi cant increase in the fl uorine content. It is reasoned that fl uo-rine arises from the mold-release agent used in the preparation of the composite. The release agent is either exposed at the subsurface upon abrasion or migrates to the surface as a result of mobilization during solvent treatment. The C 1s XPS/ESCA binding energy for one of the photopeaks in the spectrum is in the region 290–291 eV, where fl uorocarbon functionality appears.
Table 1.5 XPS analysis data for Azmet composites22 (atomic %)
Sample C O N F
As received 79.8 18.4 0.3 1.3
Hexane abrade 76.7 18.6 0.5 4.1
Methanol abrade 73.8 18.7 0.8 6.5
imo-ishida-01.indd 14imo-ishida-01.indd 14 3/1/10 2:12 PM3/1/10 2:12 PM
1.3 APPLICATIONS OF XPS/ESCA TO COMPOSITES 15
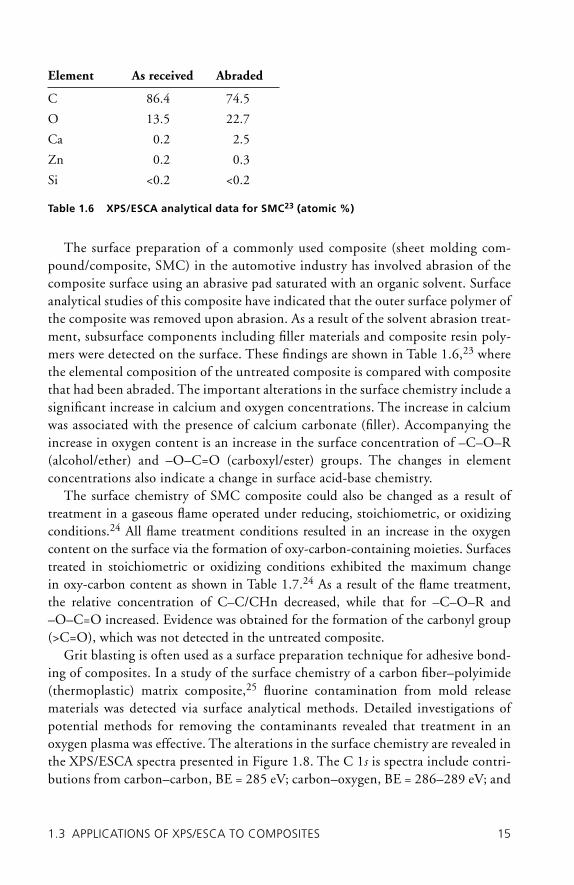
The surface preparation of a commonly used composite (sheet molding com-pound/composite, SMC) in the automotive industry has involved abrasion of the composite surface using an abrasive pad saturated with an organic solvent. Surface analytical studies of this composite have indicated that the outer surface polymer of the composite was removed upon abrasion. As a result of the solvent abrasion treat-ment, subsurface components including fi ller materials and composite resin poly-mers were detected on the surface. These fi ndings are shown in Table 1.6,23 where the elemental composition of the untreated composite is compared with composite that had been abraded. The important alterations in the surface chemistry include a signifi cant increase in calcium and oxygen concentrations. The increase in calcium was associated with the presence of calcium carbonate (fi ller). Accompanying the increase in oxygen content is an increase in the surface concentration of –C–O–R (alcohol/ether) and –O–C=O (carboxyl/ester) groups. The changes in element concentrations also indicate a change in surface acid-base chemistry.
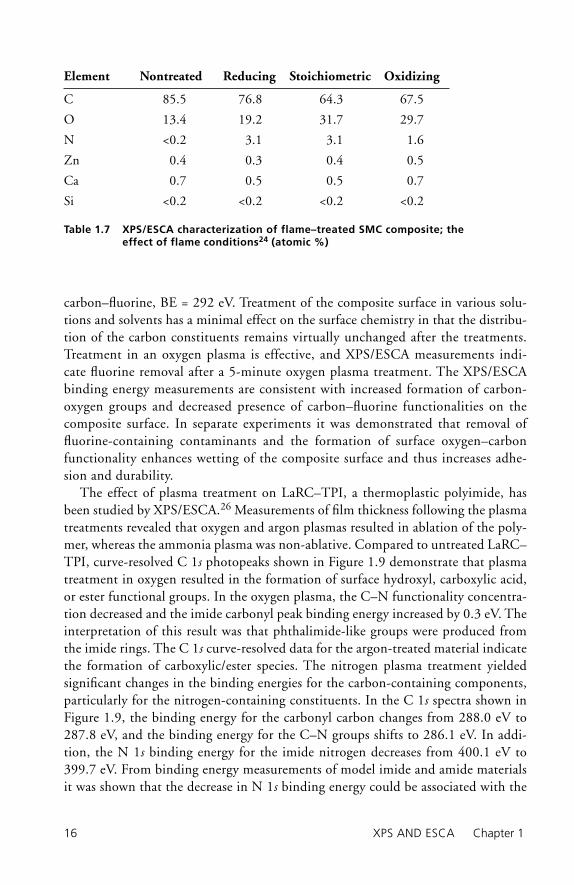
The surface chemistry of SMC composite could also be changed as a result of treatment in a gaseous fl ame operated under reducing, stoichiometric, or oxidizing conditions.24 All fl ame treatment conditions resulted in an increase in the oxygen content on the surface via the formation of oxy-carbon-containing moieties. Surfaces treated in stoichiometric or oxidizing conditions exhibited the maximum change in oxy-carbon content as shown in Table 1.7.24 As a result of the fl ame treatment, the relative concentration of C–C/CHn decreased, while that for –C–O–R and –O–C=O increased. Evidence was obtained for the formation of the carbonyl group (>C=O), which was not detected in the untreated composite.
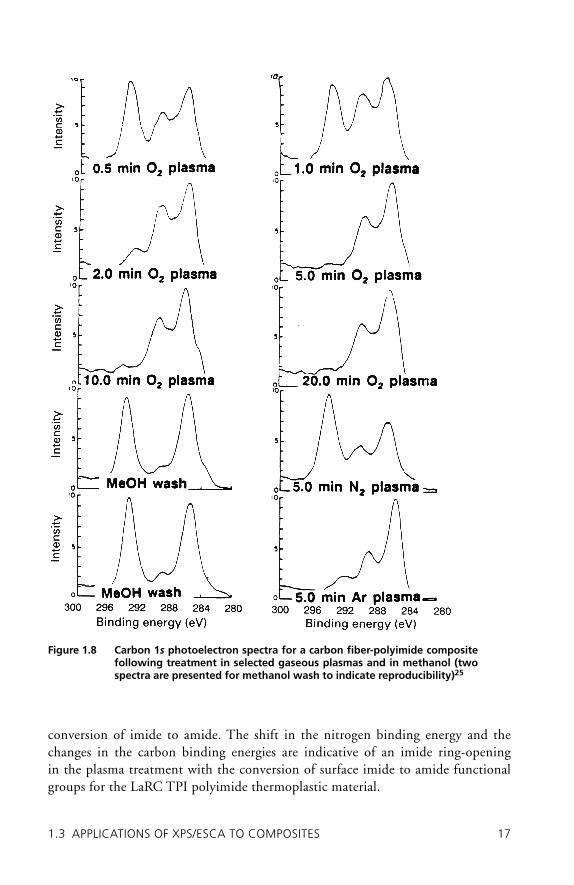
Grit blasting is often used as a surface preparation technique for adhesive bond-ing of composites. In a study of the surface chemistry of a carbon fi ber–polyimide (thermoplastic) matrix composite,25 fl uorine contamination from mold release materials was detected via surface analytical methods. Detailed investigations of potential methods for removing the contaminants revealed that treatment in an oxygen plasma was effective. The alterations in the surface chemistry are revealed in the XPS/ESCA spectra presented in Figure 1.8. The C 1s is spectra include contri-butions from carbon–carbon, BE = 285 eV; carbon–oxygen, BE = 286–289 eV; and
Table 1.6 XPS/ESCA analytical data for SMC23 (atomic %)
Element As received Abraded
C 86.4 74.5
O 13.5 22.7
Ca 0.2 2.5
Zn 0.2 0.3
Si <0.2 <0.2
imo-ishida-01.indd 15imo-ishida-01.indd 15 3/1/10 2:12 PM3/1/10 2:12 PM
16 XPS AND ESCA Chapter 1
carbon–fl uorine, BE = 292 eV. Treatment of the composite surface in various solu-tions and solvents has a minimal effect on the surface chemistry in that the distribu-tion of the carbon constituents remains virtually unchanged after the treatments. Treatment in an oxygen plasma is effective, and XPS/ESCA measurements indi-cate fl uorine removal after a 5-minute oxygen plasma treatment. The XPS/ESCA binding energy measurements are consistent with increased formation of carbon-oxygen groups and decreased presence of carbon–fl uorine functionalities on the composite surface. In separate experiments it was demonstrated that removal of fl uorine-containing contaminants and the formation of surface oxygen–carbon functionality enhances wetting of the composite surface and thus increases adhe-sion and durability.
The effect of plasma treatment on LaRC–TPI, a thermoplastic polyimide, has been studied by XPS/ESCA.26 Measurements of fi lm thickness following the plasma treatments revealed that oxygen and argon plasmas resulted in ablation of the poly-mer, whereas the ammonia plasma was non-ablative. Compared to untreated LaRC–TPI, curve-resolved C 1s photopeaks shown in Figure 1.9 demonstrate that plasma treatment in oxygen resulted in the formation of surface hydroxyl, carboxylic acid, or ester functional groups. In the oxygen plasma, the C–N functionality concentra-tion decreased and the imide carbonyl peak binding energy increased by 0.3 eV. The interpretation of this result was that phthalimide-like groups were produced from the imide rings. The C 1s curve-resolved data for the argon-treated material indicate the formation of carboxylic/ester species. The nitrogen plasma treatment yielded signifi cant changes in the binding energies for the carbon-containing components, particularly for the nitrogen-containing constituents. In the C 1s spectra shown in Figure 1.9, the binding energy for the carbonyl carbon changes from 288.0 eV to 287.8 eV, and the binding energy for the C–N groups shifts to 286.1 eV. In addi-tion, the N 1s binding energy for the imide nitrogen decreases from 400.1 eV to 399.7 eV. From binding energy measurements of model imide and amide materials it was shown that the decrease in N 1s binding energy could be associated with the
Table 1.7 XPS/ESCA characterization of flame–treated SMC composite; the effect of flame conditions24 (atomic %)
Element Nontreated Reducing Stoichiometric Oxidizing
C 85.5 76.8 64.3 67.5
O 13.4 19.2 31.7 29.7
N <0.2 3.1 3.1 1.6
Zn 0.4 0.3 0.4 0.5
Ca 0.7 0.5 0.5 0.7
Si <0.2 <0.2 <0.2 <0.2
imo-ishida-01.indd 16imo-ishida-01.indd 16 3/1/10 2:12 PM3/1/10 2:12 PM
1.3 APPLICATIONS OF XPS/ESCA TO COMPOSITES 17
conversion of imide to amide. The shift in the nitrogen binding energy and the changes in the carbon binding energies are indicative of an imide ring-opening in the plasma treatment with the conversion of surface imide to amide functional groups for the LaRC TPI polyimide thermoplastic material.
Figure 1.8 Carbon 1s photoelectron spectra for a carbon fiber-polyimide composite following treatment in selected gaseous plasmas and in methanol (two spectra are presented for methanol wash to indicate reproducibility)25
imo-ishida-01.indd 17imo-ishida-01.indd 17 3/1/10 2:12 PM3/1/10 2:12 PM

18 XPS AND ESCA Chapter 1
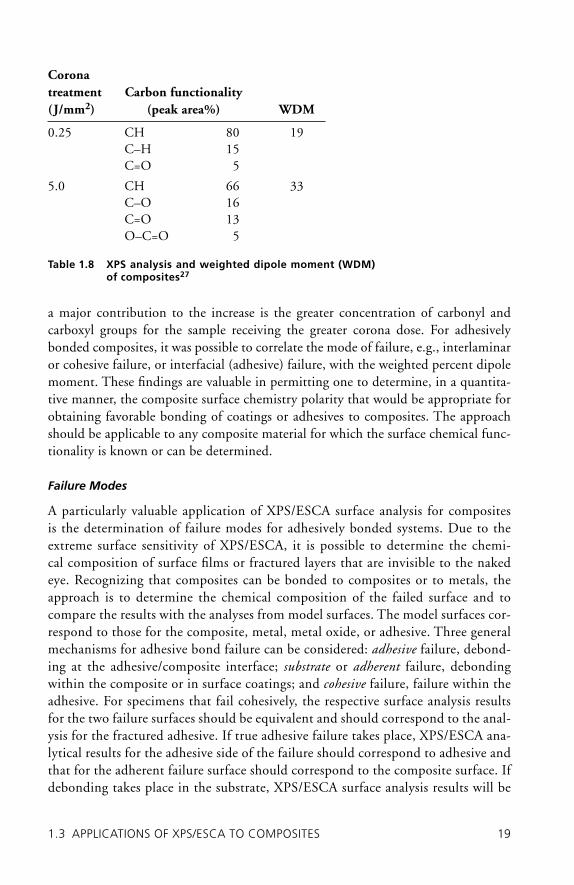
A number of thermoplastic-fi ber composite materials have been studied by XPS/ESCA to determine the polarity of the surface following corona treatment.27 The surface analysis results indicated the presence of –C–N, –C–O–, >C=O, and –O–C=O species. The polarity of the surface was evaluated by determining a weighted percent dipole moment (WDM). Values of the dipole moments of indi-vidual functional groups (reported in the literature) were multiplied by the relative contribution of each functional group (determined from curve resolution of the C 1s data), the products normalized, and the sum taken to give the weighted percent dipole moment. The infl uence on the WDM due to corona treatment for a U/K-PA composite is shown in Table 1.8. The WDM is greater by ac least a factor of 2 for the sample treated at 5 J/mm2. Based on the XPS/ESCA data it is apparent that
Figure 1.9 Structure for LaRC-TPI and C 1s photoelectron spectra (curve resolved) for LaRC-TPI:26 (a) untreated, (b) oxygen plasma, (c) argon plasma, and (d) ammonia plasma
imo-ishida-01.indd 18imo-ishida-01.indd 18 3/1/10 2:12 PM3/1/10 2:12 PM
1.3 APPLICATIONS OF XPS/ESCA TO COMPOSITES 19
a major contribution to the increase is the greater concentration of carbonyl and carboxyl groups for the sample receiving the greater corona dose. For adhesively bonded composites, it was possible to correlate the mode of failure, e.g., interlaminar or cohesive failure, or interfacial (adhesive) failure, with the weighted percent dipole moment. These fi ndings are valuable in permitting one to determine, in a quantita-tive manner, the composite surface chemistry polarity that would be appropriate for obtaining favorable bonding of coatings or adhesives to composites. The approach should be applicable to any composite material for which the surface chemical func-tionality is known or can be determined.
Failure Modes
A particularly valuable application of XPS/ESCA surface analysis for composites is the determination of failure modes for adhesively bonded systems. Due to the extreme surface sensitivity of XPS/ESCA, it is possible to determine the chemi-cal composition of surface fi lms or fractured layers that are invisible to the naked eye. Recognizing that composites can be bonded to composites or to metals, the approach is to determine the chemical composition of the failed surface and to compare the results with the analyses from model surfaces. The model surfaces cor-respond to those for the composite, metal, metal oxide, or adhesive. Three general mechanisms for adhesive bond failure can be considered: adhesive failure, debond-ing at the adhesive/composite interface; substrate or adherent failure, debonding within the composite or in surface coatings; and cohesive failure, failure within the adhesive. For specimens that fail cohesively, the respective surface analysis results for the two failure surfaces should be equivalent and should correspond to the anal-ysis for the fractured adhesive. If true adhesive failure takes place, XPS/ESCA ana-lytical results for the adhesive side of the failure should correspond to adhesive and that for the adherent failure surface should correspond to the composite surface. If debonding takes place in the substrate, XPS/ESCA surface analysis results will be
Table 1.8 XPS analysis and weighted dipole moment (WDM) of composites27
Corona treatment (J/mm2)
Carbon functionality (peak area%) WDM
0.25 CHC–HC=O
8015
5
19
5.0 CHC–OC=OO–C=O
661613
5
33
imo-ishida-01.indd 19imo-ishida-01.indd 19 3/1/10 2:12 PM3/1/10 2:12 PM

20 XPS AND ESCA Chapter 1
indicative of the depth or the region in which debonding occurred. If failure in metal/composite bonded materials is considered and failure occurs at the metal adherent surface, XPS/ESCA results may be used to distinguish the locus of fail-ure in the metal. If failure occurs in the metal oxide layer of the metal, the XPS/ESCA analysis data for the two failed surfaces should correspond to metal oxide. If failure occurs at the metal/oxide interface, the analysis for one surface should cor-respond to metal and that for the other should correspond to metal oxide. In the latter case, for an adhesively bonded system that can be represented schematically as metal(oxide)/adhesive/composite, if failure occurs at the metal/oxide interface, XPS/ESCA data for the adhesive side of the failure specimen should correspond to metal oxide. It should be noted that these comments describing specifi c features of XPS/ESCA spectra as indicative of a particular failure mode apply to uniform failure processes on the area scale analyzed by the technique. In a practical sense, XPS/ESCA analyses are obtained on the millimeter scale. Thus if the failure mode is not uniform on this size scale, the XPS/ESCA spectra will be more complex and will likely not be easily interpreted.
In adhesive bonding to composites and to metals, knowledge of the chemical nature of the adhesive/composite or adhesive/metal interphase provides signifi -cant aid in understanding the failure processes. An investigation of the nature of the interphase for an epoxy adhesive on silver has been presented.28 An epoxy/4,4'-diaminodiphenylsulfone (DADPS) adhesive was cured against silver, and the inter-phase region was characterized using XPS/ESCA. The important results are sum-marized in Table 1.9, where the data are given for bulk adhesive, and the adhesive and silver failure surfaces. Of particular importance are the respective nitrogen and sulfur concentrations. The nitrogen and sulfur concentrations are greater on the fail-ure surfaces than in the bulk adhesive. In addition, the carbon 1s spectra for the adhesive and silver failure surfaces compared more favorably with the spectrum for
Table 1.9 Adhesive cured against silver28 (atomic %): nd—not detected; the limit of detection is greater for silver than for silicon
Element Specimen
Bulk adhesive Adh. fract. surf. Silver fract. Surf.
C 69.2 74.3 53.6
O 24.5 20.0 9.8
N 0.9 2.7 1.6
S 0.4 1.5 0.8
Si 5.0 1.3 nd (<0.3%)
Ag nd (<0.1%) 0.2 34.2
imo-ishida-01.indd 20imo-ishida-01.indd 20 3/1/10 2:12 PM3/1/10 2:12 PM
1.3 APPLICATIONS OF XPS/ESCA TO COMPOSITES 21
DADPS than for the bulk adhesive. These results indicate that DADPS from the adhesive was preferentially adsorbed at the silver surface and that failure occurred within the silver/DADPS interphase region. The fact that silver was detected on the adhesive failure surface suggests that the locus of failure, while being interfacial, took place near the silver surface.
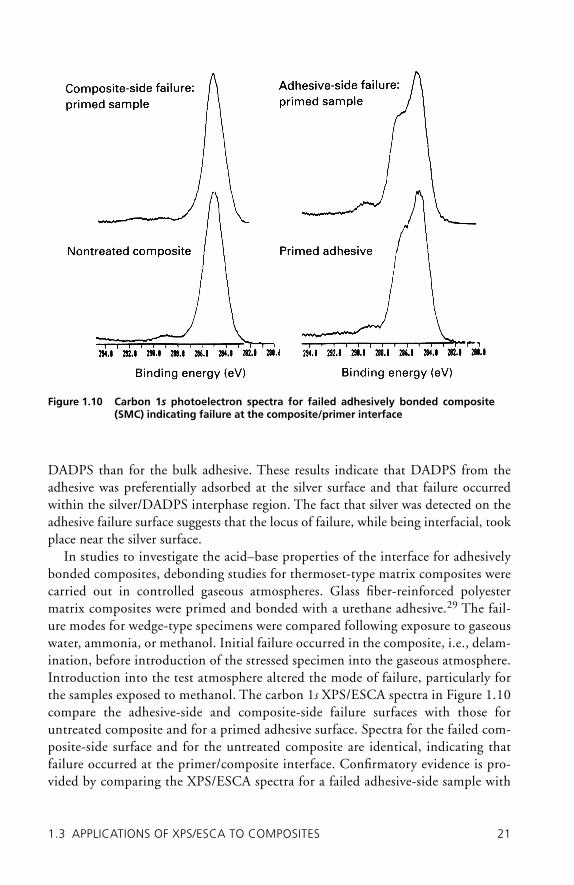
In studies to investigate the acid–base properties of the interface for adhesively bonded composites, debonding studies for thermoset-type matrix composites were carried out in controlled gaseous atmospheres. Glass fi ber-reinforced polyester matrix composites were primed and bonded with a urethane adhesive.29 The fail-ure modes for wedge-type specimens were compared following exposure to gaseous water, ammonia, or methanol. Initial failure occurred in the composite, i.e., delam-ination, before introduction of the stressed specimen into the gaseous atmosphere. Introduction into the test atmosphere altered the mode of failure, particularly for the samples exposed to methanol. The carbon 1s XPS/ESCA spectra in Figure 1.10 compare the adhesive-side and composite-side failure surfaces with those for untreated composite and for a primed adhesive surface. Spectra for the failed com-posite-side surface and for the untreated composite are identical, indicating that failure occurred at the primer/composite interface. Confi rmatory evidence is pro-vided by comparing the XPS/ESCA spectra for a failed adhesive-side sample with
Figure 1.10 Carbon 1s photoelectron spectra for failed adhesively bonded composite (SMC) indicating failure at the composite/primer interface
imo-ishida-01.indd 21imo-ishida-01.indd 21 3/1/10 2:12 PM3/1/10 2:12 PM
22 XPS AND ESCA Chapter 1
that for a primed adhesive sample. The spectra are equivalent, indicating that primer is on the adhesive failure surface. The comparison supports the notion that debonding occurs at the primer/composite interface.
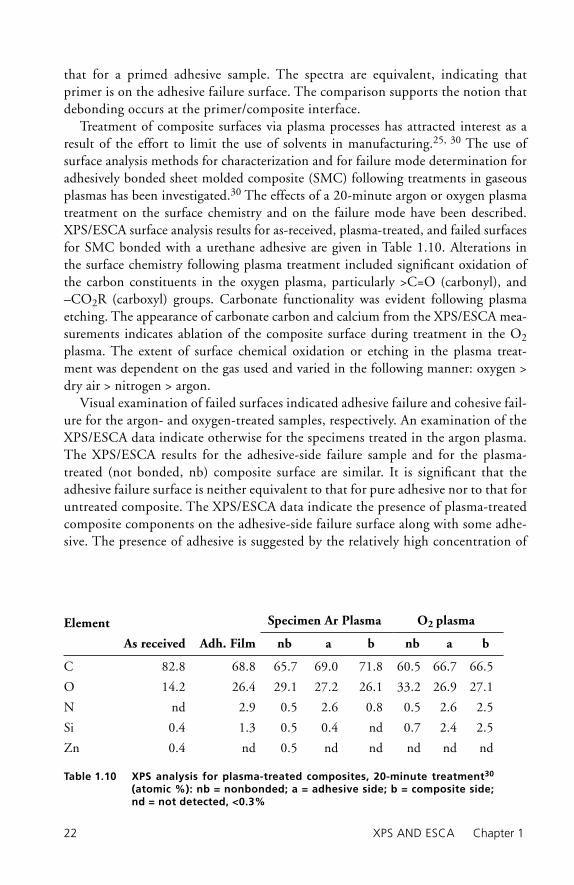
Treatment of composite surfaces via plasma processes has attracted interest as a result of the effort to limit the use of solvents in manufacturing.25, 30 The use of surface analysis methods for characterization and for failure mode determination for adhesively bonded sheet molded composite (SMC) following treatments in gaseous plasmas has been investigated.30 The effects of a 20-minute argon or oxygen plasma treatment on the surface chemistry and on the failure mode have been described. XPS/ESCA surface analysis results for as-received, plasma-treated, and failed surfaces for SMC bonded with a urethane adhesive are given in Table 1.10. Alterations in the surface chemistry following plasma treatment included signifi cant oxidation of the carbon constituents in the oxygen plasma, particularly >C=O (carbonyl), and –CO2R (carboxyl) groups. Carbonate functionality was evident following plasma etching. The appearance of carbonate carbon and calcium from the XPS/ESCA mea-surements indicates ablation of the composite surface during treatment in the O2 plasma. The extent of surface chemical oxidation or etching in the plasma treat-ment was dependent on the gas used and varied in the following manner: oxygen > dry air > nitrogen > argon.
Visual examination of failed surfaces indicated adhesive failure and cohesive fail-ure for the argon- and oxygen-treated samples, respectively. An examination of the XPS/ESCA data indicate otherwise for the specimens treated in the argon plasma. The XPS/ESCA results for the adhesive-side failure sample and for the plasma-treated (not bonded, nb) composite surface are similar. It is signifi cant that the adhesive failure surface is neither equivalent to that for pure adhesive nor to that for untreated composite. The XPS/ESCA data indicate the presence of plasma-treated composite components on the adhesive-side failure surface along with some adhe-sive. The presence of adhesive is suggested by the relatively high concentration of
Table 1.10 XPS analysis for plasma-treated composites, 20-minute treatment30 (atomic %): nb = nonbonded; a = adhesive side; b = composite side; nd = not detected, <0.3%
Element Specimen Ar Plasma O2 plasma
As received Adh. Film nb a b nb a b
C 82.8 68.8 65.7 69.0 71.8 60.5 66.7 66.5
O 14.2 26.4 29.1 27.2 26.1 33.2 26.9 27.1
N nd 2.9 0.5 2.6 0.8 0.5 2.6 2.5
Si 0.4 1.3 0.5 0.4 nd 0.7 2.4 2.5
Zn 0.4 nd 0.5 nd nd nd nd nd
imo-ishida-01.indd 22imo-ishida-01.indd 22 3/1/10 2:12 PM3/1/10 2:12 PM
1.4 SUMMARY 23
nitrogen. The XPS/ESCA results indicate that failure occurred via near-surface delamination of the treated composite.
The XPS/ESCA data for failure specimens using adhesively bonded composite treated in an oxygen plasma (Table 1.10) clearly indicate cohesive failure. The atomic percent compositions presented in the table, for the two failure surfaces indicate equal concentrations, respectively, for carbon, oxygen, and nitrogen. This equiva-lence could exist only if cohesive failure occurred, so that adhesive was present on each of the failure surfaces. Additional supporting evidence is that the XPS/ESCA spectra for both failure surfaces are equivalent to that for the adhesive.30 This inves-tigation demonstrates the ability of XPS/ESCA to reveal novel failure processes for adhesively bonded composite systems as infl uenced by plasma treatment of the com-posite surface.
1.4 Summary
XPS/ESCA studies of polymeric composite materials yield information on the chemical nature of the composite surface to a depth of about 5 nm. Elemental and chemical functional group information can be obtained for all elements of interest in composites, except hydrogen. A signifi cant application of XPS/ESCA measure-ments in composites includes studies to gain knowledge of adhesive bonding and the chemical nature of interphases in complex materials. The capability to obtain photoelectron spectra at high-energy resolution8 and the ability to obtain elemental and chemical functional group maps of surfaces5–7 will permit signifi cant advances in understanding the chemistry of composite surfaces.
References
1 Handbook of Composites, G. Lubin, Ed., Van Nostrand Reinhold, New York, 1982.
2 K. Siegbahn, C.N. Nordling, A. Fahlman, R. Nordberg, K. Hamrin, J. Hedman, G. Johansson, T. Bergmark, S.E. Karlsson, I. Lindgren, and B. Lindberg, ESCA: Atomic, Molecular and Solid State Structure Studies by Means of Electron Spectroscopy, Almqvist and Wiksells, Uppsala, 1967.
3 D. Briggs and M.P. Seah, Practical Surface Analysis by Auger and X-ray photoelectron Spectroscopy, Wiley, New York, 1983, p.6–8.
4 A.W. Czanderna, Methods of Surface Analysis, Elsevier, New York, 1975.
5 M.P. Seah and G.C. Smith, Surface Interface Anal., 11, 69, 1988.
6 H. Gelius, B. Wannberg, P. Baltzer, H. Fellner-Feldegg, G. Carlsson, C.G. Johansson, J. Larsson, P. Münger, and G. Vegerfors, J. Electron Spectrosc. Related. Phenom., 52, 747, 1990.
imo-ishida-01.indd 23imo-ishida-01.indd 23 3/1/10 2:12 PM3/1/10 2:12 PM

24 XPS AND ESCA Chapter 1
7 P. Coxon, J. Krizek, M. Humpherson, and I.R.M. Wardell, J. Electron Spectrosc. Related. Phenom., 52, 821, 1990.
8 G. Beamson, A. Bunn, and D. Briggs, Surf. Interface Anal., 17, 105, 1991.
9 A. Naves de Brito, M.P. Keane, N. Correia, S. Svensson, U. Gelius, and B. Lindberg, Surf. Interface Anal., 17, 94, 1991.
10 D.R. Penn, J. Electron Spectrosc. Related. Phenom., 9, 29, 1976.
11 T.A. Carlson, Photoelectron and Auger Spectroscopy, Plenum Press, New York, 1975, p. 264.
12 J.H. Scofi eld, J. Electron Spectrosc. Related. Phenom., 8, 129, 1976.
13 C.D. Wagner, L.E. Davis, M.V. Zeller, J.A. Taylor, R.M. Raymond, and L.H. Gale, Surf. Interface Anal., 3, 211, 1981.
14 L.T. Drzal, M.J. Rich, and M.F. Koenig, J. Adhesion, 16, 133, 1983.
15 D.M. Brewis, J. Comyn, J.R. Fowler, D. Briggs, and V.A. Gibson, Fibre Sci. Technol., 12, 41, 1979.
16 C. Kozlowski and P.M.A. Sherwood, J. Chem. Soc., Faraday Trans. I., 80, 2099, 1984.
17 C. Kozlowski and P.M.A. Sherwood, J. Chem. Soc., Faraday Trans. 1., 81, 2745, 1985.
18 P. Commercon and J.P. Wightman, Proceedings 14th Annual Meeting The Adhesion Society, 1991, p. 51.
19 H. Yasuda, H.C. Marsh, S. Brandt, and C.N. Reilley, J. Polym. Sci., Polym. Chem. Ed., 15, 991, 1977.
20 L.M. Siperko and R.R. Thomas, J. Adhesion Sci. Technol., 3, 157, 1989.
21 D. Briggs, D.G. Rance, C.R. Kendall, and A.R. Blythe, Polymer, 21, 895, 1980.
22 B.L. Holmes and J.G. Dillard, Proceedings 15th Annual Meeting The Adhesion Society, 1992, p. 79.
23 J.G. Dillard, C. Burtoff, and T. Buhler, J. Adhesion, 25, 203, 1988.
24 J.G. Dillard, T.F. Cromer, C.E. Burtoff, A.J. Cosentino, R.L. Cline, and G.M. MacIver, J. Adhesion, 26, 181, 1988.
25 D.J.D. Moyer and J.P. Wightman, Surf. Interface Anal., 14, 496, 1989.
26 J.W. Chin and J.P. Wightman, J. Adhesion, 36, 25, 1991.
27 A.J. Kinloch and G.K.A. Kodokian, The Adhesive Bonding of Thermo-plastic Composites, U.S. Army Final Technical Report, Contract No. DAJA-45-86-C-0037, September, 1989.
28 J.T. Young, N.G. Cave, and F.J. Boerio, J. Adhesion, 37, 143, 1992.
imo-ishida-01.indd 24imo-ishida-01.indd 24 3/1/10 2:12 PM3/1/10 2:12 PM

REFERENCES 25
29 B.T. Thompson, J.C. Wells, and J.G. Dillard, Bond Failure in Adhesively Bonded Composites, Proceedings 14th Annual Meeting The Adhesion Society, 1991, p. 82; J.C. Wells and J.G. Dillard, Proceedings 15th Annual Meeting The Adhesion Society 1992, p. 77.
30 J.G. Dillard and I.M. Spinu, J. Adhesion, 31, 137, 1990.
imo-ishida-01.indd 25imo-ishida-01.indd 25 3/1/10 2:12 PM3/1/10 2:12 PM