characterization of chromosomal architecture in arabidopsisby
TRANSCRIPT

Grob et al. Genome Biology 2013, 14:R129http://genomebiology.com/2013/14/11/R129
RESEARCH Open Access
Characterization of chromosomal architecturein Arabidopsis by chromosome conformationcaptureStefan Grob1, Marc W Schmid1, Nathan W Luedtke2, Thomas Wicker1 and Ueli Grossniklaus1*
Abstract
Background: The packaging of long chromatin fibers in the nucleus poses a major challenge, as it must fulfill bothphysical and functional requirements. Until recently, insights into the chromosomal architecture of plants weremainly provided by cytogenetic studies. Complementary to these analyses, chromosome conformation capturetechnologies promise to refine and improve our view on chromosomal architecture and to provide a moregeneralized description of nuclear organization.
Results: Employing circular chromosome conformation capture, this study describes chromosomal architecture inArabidopsis nuclei from a genome-wide perspective. Surprisingly, the linear organization of chromosomes isreflected in the genome-wide interactome. In addition, we study the interplay of the interactome and epigeneticmarks and report that the heterochromatic knob on the short arm of chromosome 4 maintains a pericentromere-likeinteraction profile and interactome despite its euchromatic surrounding.
Conclusion: Despite the extreme condensation that is necessary to pack the chromosomes into the nucleus, theArabidopsis genome appears to be packed in a predictive manner, according to the following criteria: heterochromatinand euchromatin represent two distinct interactomes; interactions between chromosomes correlate with the linearposition on the chromosome arm; and distal chromosome regions have a higher potential to interact with otherchromosomes.
BackgroundIn eukaryotic nuclei, chromosomes of considerable lengthare densely packed into a very small volume. In Arabidopsis,chromatin with a total length of about 8 cm has to bepackaged into a nucleus of about 70 μm3 volume and 5 μmdiameter [1,2]. Nonetheless, the extremely dense packagingof chromatin does not lead to a chaotic entanglement ofchromatin fibers. Eukaryotes have evolved mechanismsto untangle chromatin and to organize the nucleus intostructural domains, facilitating chromosome packagingand, hence, the accessibility of the information storedwithin chromosomes. Therefore, chromosomal architectureis likely to influence the transcriptional state of a given cell,and might be a major player in the epigenetic regulationof cell fate.
* Correspondence: [email protected] of Plant Biology and Zürich-Basel Plant Science Center, Universityof Zürich, Zollikerstrasse 107, CH-8008 Zürich, SwitzerlandFull list of author information is available at the end of the article
© 2013 Grob et al.; licensee BioMed Central LtCommons Attribution License (http://creativecreproduction in any medium, provided the or
Over the past 15 years, the field of epigenetics hasgrown rapidly, addressing basic questions about thelong-term regulation of genes, and how diverse cell typesreach their differentiated states. These studies haveprovided insights into the mechanisms that enable cells todifferentiate into diverse cell types with distinct phenotypes,despite sharing exactly the same genotype.To date, most of the commonly studied epigenetic
processes have been shown to involve covalent modifica-tions of DNA, such as cytosine methylation, modificationsof the core histone proteins H3 and H4, and histone vari-ants. Thereby, chromatin can be grouped into activatingand repressive chromatin states, defined by their epigeneticlandscape. Among the main players are trimethylation oflysine 36 of H3 (H3K36me3) and dimethylation of lysine4 of H3 (H3K4me2), which act as activating marks, andmonomethylation of lysine 27 of H3 (H3K27me1) anddimethylation of lysine 9 of H3 (H3K9me2), which areassociated with the repressive state [3-5].
d. This is an open access article distributed under the terms of the Creativeommons.org/licenses/by/2.0), which permits unrestricted use, distribution, andiginal work is properly cited.

Grob et al. Genome Biology 2013, 14:R129 Page 2 of 19http://genomebiology.com/2013/14/11/R129
Although studied for over 100 years [6] (for example,with respect to cell division), chromosomal architecture,and thus higher-order chromatin organization, has notbeen a major focus of epigenetic research. Until recently,the lack of high-resolution techniques made structural stud-ies of the nucleus extremely difficult. Nevertheless, chroma-tin condensation as seen in heterochromatin, reflecting,chromosomal architecture, could be viewed as the first de-scribed epigenetic mark [7,8]. Recently, it became possibleto study chromosomal architecture in more detail, on botha global and a local scale, for instance with respect to phys-ical interactions between enhancers and promoters [9,10].In plants, chromosomal architecture has been studied for
many years using cytogenetic techniques and microscopicobservations. Early studies allowed the discovery of thebasic chromosome conformations, heterochromatin andeuchromatin, which were first described in mosses byEmil Heitz as early as 1929 [7]. Most condensed chromatin,or heterochromatin, is associated with centromeric regions.However, large heterochromatic regions outside the peri-centromeres were also detected and, because of theirmicroscopic appearance, were termed ‘knobs’. Althoughfirst observed and best described in maize [11], knobswere also shown to exist in the model plant Arabidopsis,on chromosomes 4 and 5 [12-14]. The heterochromaticknob on the short arm of chromosome 4 (hk4s) is derivedfrom an inversion event, which caused a pericentromericregion to lie in a more centrally located region of thechromosome arm. Owing to its length of 750 kb, hk4s iseasily detectable, and is therefore the best studied knob inArabidopsis. By contrast, the merely 60 kb long knob onchromosome 5 is only poorly described. Despite its central,and therefore euchromatic, position on the chromosomearm, hk4s has kept the heterochromatic features of itspericentromeric origin. The knob h4ks is characterized bylow gene density and an abundance of highly repetitivesequences, such as transposable elements.To date, two methods have been frequently used to
study chromosomal architecture. For microscopic observa-tions, fluorescence in situ hybridization (FISH) visualizeschromosomal architecture by detecting specific sectionsof chromosomes through hybridization with fluorescentlylabeled probes. Over the past decade, a completely differentset of methods has been developed, which are summarizedas chromosome conformation capture (abbreviated to 3C)technologies [15,16]. 3C uses formaldehyde cross-linkedchromatin that is subsequently digested and religated.This produces circular DNA, comprised of two restrictionfragments that were initially in close spatial proximitywithin the nucleus. The abundance of these circular 3Ctemplates can then be used to calculate interaction frequen-cies between two given fragments in the genome. In bothanimal model systems and yeast, various studies havesuccessfully used 3C technologies since the first publication
in 2002 [15]. Whereas 3C is used to analyze pair-wiseinteractions (one specific fragment interacting with anotherspecific fragment; that is, one to one), circular chromo-some conformation capture (4C) identifies interactionsgenome-wide to a viewpoint of interest [17] (that is, oneto all). HiC, the most recent 3C technology, facilitates theanalysis of genome-wide interactions from all restrictionfragments of a genome (that is, all to all) [18].In the plant field, however, the adoption of these tech-
nical advances has been slower, and only a few studieshave been performed using 3C technology. A 3C study inmaize revealed chromatin looping at the paramutagenicb1 locus [19], and another recent study showed the im-portance of local DNA looping for the correct expressionof the flowering time regulator locus FLC [20]. Moissiardand colleagues compared global changes in the interac-tome between mutant atmorc6 and wild-type plants [21].However, that study did not focus on a detailed descriptionof the chromosomal architecture of Arabidopsis nuclei.Here, we provide insights into the general architecture
of the Arabidopsis nucleus, using 4C applied to severalviewpoints followed by Illumina sequencing. Our studyaimed at characterizing global principles of chromosomalinteractions and their correlations with epigenetic marks.Additionally, we found that the heterochromatic knob hk4sis characterized by a distinct interactome, which stronglyresembles its pericentromeric origin.
ResultsThe current knowledge on chromosomal architecture inArabidopsis is largely based on microscopic observations.Therefore, we aimed to gain insights into higher-orderchromatin organization based on 4C technology, whichpromises to complement previously published FISH experi-ments, and to reveal novel mechanisms governing chromo-somal architecture.We performed 4C experiments on aerial tissue of 2-
week-old Arabidopsis seedlings using thirteen specificrestriction fragments (viewpoints) distributed across all fivechromosomes (Figure 1A). Employing high-throughputsequencing, 4C technology identifies sequences that phys-ically interact with a given viewpoint. Therefore, theposition and number of mapped 4C sequencing readsdefine the interactome of the given restriction fragment(that is, the viewpoint) in space (position) and in frequencyor specificity (number of reads).To cover a wide distribution of chromosomal inter-
actions, we chose viewpoints that reside in various loca-tions: from pericentromeric, to mid-chromosome arm, todistal positions (Figure 1A).
Data evaluation reveals robustness of 4C experimentsTo obtain the interactome of a given viewpoint, shortsequence reads were mapped to restriction fragments,

Figure 1 Primary circular chromosome conformation capture (4C) data analysis. (A) Schematic representation of the viewpoints chosen forthis study. Viewpoints were named according to nearby genes or according to a region of special interest (hk4s). (B) Cluster analysis representingthe reproducibility of biological duplicates. The letters ‘A’ and ‘B ‘at the end of the names indicate biological replicates. (C) Power law scaling,indicative of the interaction decay for all viewpoints, across a distance to the viewpoint from 1 kb to 10 Mb.
Grob et al. Genome Biology 2013, 14:R129 Page 3 of 19http://genomebiology.com/2013/14/11/R129
and subsequently merged into sliding windows consistingof 100 HindIII restriction fragments. We then assignedP-values to each window describing the specificity of theinteraction to a given viewpoint. To obtain these P-values,read counts of 4C windows were compared with the prob-abilities of a normal distribution. The parameters of thisdistribution were calculated using 1,000 sets of windows,each generated by random shuffling of 4C fragments.As chromosome arms differ considerably in their lengthand, therefore, their DNA amount, we calculated P-valuesindividually for each chromosome arm. Windows withP ≤ 0.01 where defined as specifically interacting with theircorresponding viewpoint and are, hereafter, referred to as‘preys’.The mappability of sequencing reads poses a major
concern for any genomic study. Owing to the incompleteassembly of centromeric repeats in the Arabidopsis refer-ence genome, we excluded regions within 100 kb distanceof the centromere. Visual inspection of genomic Illuminasequencing data revealed an even distribution of mapped
reads along the remaining chromosome sequence and,therefore, no other major mappability biases were identified.To assure the reproducibility of this study, 4C experi-
ments were performed in duplicate. Correlations betweenduplicates and different viewpoints were calculated usingthe sum of reads per window. Spearman correlation coef-ficients were high for duplicates (mean ± SD 0.88 ± 0.07),and relatively low for different viewpoints (0.26 ± 0.31).However, interacting viewpoints and viewpoints located inclose proximity (see Figure 1A), such as the two viewpointsat the MEDEA (MEA) locus, had correlation coefficientsclose to those of replicates of the same viewpoint. Clusteranalysis supported these findings (Figure 1B), furtherdemonstrating that viewpoints on the same chromosomearm also show higher correlations with each other thanwith viewpoints located on other chromosomes arms.Taken together, these analyses reveal the robustness ofour data.To differentiate between random interactions, which
are mainly dependent on chromosomal proximity to

Grob et al. Genome Biology 2013, 14:R129 Page 4 of 19http://genomebiology.com/2013/14/11/R129
the viewpoint, and specific interactions, we estimated thegenomic distance-dependent decay of the interactionprobability on a distance of 1 kb to 10 Mb from theviewpoint. For this, we pooled 4C reads of all viewpointswithin the given distance to their viewpoints. Performinglinear regression on logarithmized distance and contactprobabilities, we calculated a slope of −0.73, that is, thecontact probability decays with a power law function ofdistance-0.73 (Figure 1C). This result resembles similaranalyses of the Drosophila (−0.85) [22] and human (−1.08)[18] genomes.
Cis interactions are enriched within chromosome armsBecause the replicate correlation was high, we pooledreplicates for a common representation of the 4C interac-tome (Figure 2A,B) using the software Circos [23].Figure 2C illustrates an example of a more detailedrepresentation of 4C interactomes for the FIS2 viewpoint.All other representations of individual viewpoints are shownin the additional files (see Additional file 1: Figure S1;Additional file 2: Figure S2; Additional file 3: Figure S3;Additional file 4: Figure S4; Additional file 5: Figure S5;Additional file 6: Figure S6; Additional file 7: Figure S7;Additional file 8: Figure S8; Additional file 9: Figure S9;Additional file 10: Figure S10; Additional file 11: Figure S11;Additional file 12: Figure S12; Additional file 13: FigureS13). At first sight, we observed an apparent enrichment ininter-chromosomal interactions of distal regions of chro-mosomes (Figure 2A). Additionally, intra-chromosomalinteractions appeared to be occurring mostly locally aroundthe viewpoint and between the distal regions of the twochromosome arms (Figure 2B and Figure 2C).Interactions can be categorized into cis and trans inter-
actions, which require different analysis techniques [24].Cis interactions (Figure 2B) refer to intra-chromosomeinteractions, whereas trans interactions (Figure 2A) aredefined as inter-chromosome interactions.By visual inspection of the interaction frequencies, we
observed that local interactions rarely spread across thecentromeres, (Figure 2B, Figure 2C; see Additional file 1:Figure S1; Additional file 2: Figure S2; Additional file 3:Figure S3; Additional file 4: Figure S4; Additional file 5:Figure S5; Additional file 6: Figure S6; Additional file 7:Figure S7; Additional file 8: Figure S8; Additional file 9:Figure S9; Additional file 10: Figure S10; Additional file 11:Figure S11; Additional file 12: Figure S12; Additionalfile 13: Figure S13), indicating that interactions between thetwo arms of the same chromosome (that is, the inter-arminteractions) are distinct from the intra-arm interactions,thus splitting the cis interactions into two groups.Therefore, we investigated whether chromosomes, or
rather chromosome arms, are the basic unit of nucleararchitecture. To answer this question, we calculatedthe average number of reads per million (RPM) for each
chromosome arm, and defined three chromosome armtypes: The chromosome arm hosting the viewpoint(viewpoint arm), the other arm on the same chromosomeas the viewpoint (cis arm), and arms of all other chromo-somes (trans arms). We observed the highest interactionfrequencies and, therefore, the highest mean RPM valueswithin the viewpoint arm (Figure 3A), showing that a highproportion of chromosomal interactions occur within thesame arm.Interactions with cis arms were significantly more
frequent than those with trans arms (Student’s t-test,P = 0.0135 for replicate A and P = 0.0129 for replicateB). However, the differences were small compared withthe RPM values for the viewpoint arm and the cis arm(Student’s t-test, P = 1.4 × 10⁻¹³ for replicate A and P =1.7 × 10⁻¹³ for replicate B) (Figure 3A). A large proportionof interactions within the viewpoint arm occurred withinthe close vicinity of the viewpoint itself. To investigatewhether long-range interactions also preferentially occurwithin the viewpoint arm, we excluded regions surroundingthe viewpoints by 2 Mb on each side of the viewpoint(Figure 2A). Devoid of the viewpoint region, the RPMvalues were strongly reduced; however, they were stillsignificantly higher than those of the cis arms (Student’st-test, P= 0.012 for replicate A and P= 0.010 for replicate B).The difference between the trans and cis arms appears
to be dependent on the distance of the viewpoint from thecentromere. Distal viewpoints (for example, MEA andCYTOKININ-INDEPENDENT1 (CKI1), see Additionalfile 1: Figure S1; Additional file 2: Figure S2; Additionalfile 6: Figure S6) did not appear to interact preferentiallywith their respective cis arm compared with the transarm. This could been observed by comparing the overallinteraction values of the viewpoint’s respective cis armcompared with the overall interaction values of the transarms. By contrast, viewpoints residing in the vicinity ofthe centromeres (for example, YAOZHE (YAO) andAT3G44380; see Additional file 7: Figure S7; Additionalfile 10: Figure S10) exhibited increased cis arm interactionscompared with trans arm interactions and, thus, limitedspreading of local interactions across the centromere.In summary, intra-arm interactions were about ten-fold
more frequent than inter-arm interactions, whereas inter-arm and inter-chromosomal interactions differed by abouttwo-fold on average. Therefore, our results show thatchromosome arms are the main interaction unit, andthat interaction frequencies decrease sharply close to thecentromeres.
Linear position along the chromosome influences theinteraction potential of the viewpointWe found that trans interactions could make up to 50%of the total interactome of a given viewpoint. Therefore,we were interested in understanding the mechanisms

Figure 2 (See legend on next page.)
Grob et al. Genome Biology 2013, 14:R129 Page 5 of 19http://genomebiology.com/2013/14/11/R129
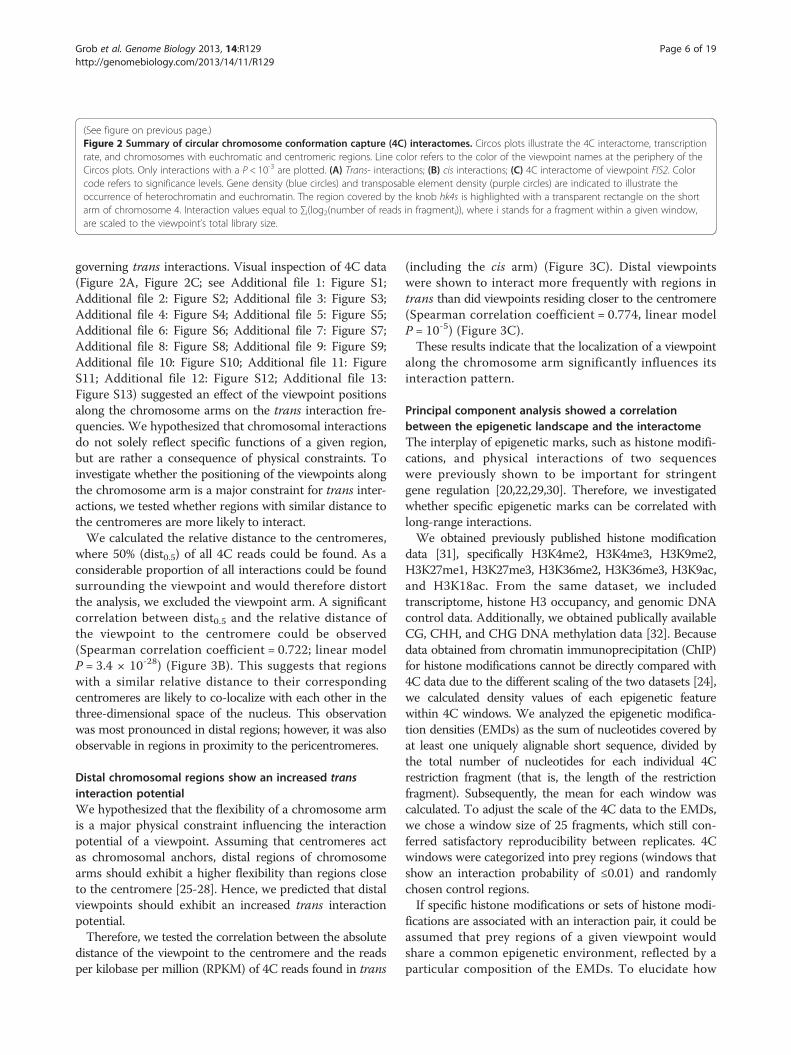
(See figure on previous page.)Figure 2 Summary of circular chromosome conformation capture (4C) interactomes. Circos plots illustrate the 4C interactome, transcriptionrate, and chromosomes with euchromatic and centromeric regions. Line color refers to the color of the viewpoint names at the periphery of theCircos plots. Only interactions with a P < 10-3 are plotted. (A) Trans- interactions; (B) cis interactions; (C) 4C interactome of viewpoint FIS2. Colorcode refers to significance levels. Gene density (blue circles) and transposable element density (purple circles) are indicated to illustrate theoccurrence of heterochromatin and euchromatin. The region covered by the knob hk4s is highlighted with a transparent rectangle on the shortarm of chromosome 4. Interaction values equal to ∑i(log2(number of reads in fragmenti)), where i stands for a fragment within a given window,are scaled to the viewpoint’s total library size.
Grob et al. Genome Biology 2013, 14:R129 Page 6 of 19http://genomebiology.com/2013/14/11/R129
governing trans interactions. Visual inspection of 4C data(Figure 2A, Figure 2C; see Additional file 1: Figure S1;Additional file 2: Figure S2; Additional file 3: Figure S3;Additional file 4: Figure S4; Additional file 5: Figure S5;Additional file 6: Figure S6; Additional file 7: Figure S7;Additional file 8: Figure S8; Additional file 9: Figure S9;Additional file 10: Figure S10; Additional file 11: FigureS11; Additional file 12: Figure S12; Additional file 13:Figure S13) suggested an effect of the viewpoint positionsalong the chromosome arms on the trans interaction fre-quencies. We hypothesized that chromosomal interactionsdo not solely reflect specific functions of a given region,but are rather a consequence of physical constraints. Toinvestigate whether the positioning of the viewpoints alongthe chromosome arm is a major constraint for trans inter-actions, we tested whether regions with similar distance tothe centromeres are more likely to interact.We calculated the relative distance to the centromeres,
where 50% (dist0.5) of all 4C reads could be found. As aconsiderable proportion of all interactions could be foundsurrounding the viewpoint and would therefore distortthe analysis, we excluded the viewpoint arm. A significantcorrelation between dist0.5 and the relative distance ofthe viewpoint to the centromere could be observed(Spearman correlation coefficient = 0.722; linear modelP = 3.4 × 10⁻²⁸) (Figure 3B). This suggests that regionswith a similar relative distance to their correspondingcentromeres are likely to co-localize with each other in thethree-dimensional space of the nucleus. This observationwas most pronounced in distal regions; however, it was alsoobservable in regions in proximity to the pericentromeres.
Distal chromosomal regions show an increased transinteraction potentialWe hypothesized that the flexibility of a chromosome armis a major physical constraint influencing the interactionpotential of a viewpoint. Assuming that centromeres actas chromosomal anchors, distal regions of chromosomearms should exhibit a higher flexibility than regions closeto the centromere [25-28]. Hence, we predicted that distalviewpoints should exhibit an increased trans interactionpotential.Therefore, we tested the correlation between the absolute
distance of the viewpoint to the centromere and the readsper kilobase per million (RPKM) of 4C reads found in trans
(including the cis arm) (Figure 3C). Distal viewpointswere shown to interact more frequently with regions intrans than did viewpoints residing closer to the centromere(Spearman correlation coefficient = 0.774, linear modelP = 10-5) (Figure 3C).These results indicate that the localization of a viewpoint
along the chromosome arm significantly influences itsinteraction pattern.
Principal component analysis showed a correlationbetween the epigenetic landscape and the interactomeThe interplay of epigenetic marks, such as histone modifi-cations, and physical interactions of two sequenceswere previously shown to be important for stringentgene regulation [20,22,29,30]. Therefore, we investigatedwhether specific epigenetic marks can be correlated withlong-range interactions.We obtained previously published histone modification
data [31], specifically H3K4me2, H3K4me3, H3K9me2,H3K27me1, H3K27me3, H3K36me2, H3K36me3, H3K9ac,and H3K18ac. From the same dataset, we includedtranscriptome, histone H3 occupancy, and genomic DNAcontrol data. Additionally, we obtained publically availableCG, CHH, and CHG DNA methylation data [32]. Becausedata obtained from chromatin immunoprecipitation (ChIP)for histone modifications cannot be directly compared with4C data due to the different scaling of the two datasets [24],we calculated density values of each epigenetic featurewithin 4C windows. We analyzed the epigenetic modifica-tion densities (EMDs) as the sum of nucleotides covered byat least one uniquely alignable short sequence, divided bythe total number of nucleotides for each individual 4Crestriction fragment (that is, the length of the restrictionfragment). Subsequently, the mean for each window wascalculated. To adjust the scale of the 4C data to the EMDs,we chose a window size of 25 fragments, which still con-ferred satisfactory reproducibility between replicates. 4Cwindows were categorized into prey regions (windows thatshow an interaction probability of ≤0.01) and randomlychosen control regions.If specific histone modifications or sets of histone modi-
fications are associated with an interaction pair, it could beassumed that prey regions of a given viewpoint wouldshare a common epigenetic environment, reflected by aparticular composition of the EMDs. To elucidate how

Figure 3 Physical constraints of chromosomal architecture. (A)Number of reads per million for four distinct classes of interactomes.Viewpoint: circular chromosome conformation capture (4C) readsthat map on the same chromosome arm as the viewpoint.Viewpoint (removed): interactions mapping the viewpoint’s arm,excluding interactions that map within 2 Mb distance on either sideof the viewpoint. Cis: 4C reads that map to the other arm of thechromosome harboring the viewpoint. Trans: 4C reads that map toall other chromosome arms. (B) The relative distance to thecentromere (0 at the centromere, 1 at the telomere) in which 50%of the 4C reads can be found depends on the relative distance ofthe viewpoint to the centromere. (C) The percentage of 4C readsthat can be mapped to trans arms was positively correlated with theviewpoint’s absolute distance to the centromere in base pairs (bp).In all parts, red circles represents replicate A, blue representsreplicate B.
Grob et al. Genome Biology 2013, 14:R129 Page 7 of 19http://genomebiology.com/2013/14/11/R129
histone modifications are related to the interactome, weperformed principal component analysis (PCA) (Figure 4A).For each viewpoint, the mean EMDs (selecting only histonemodification data) of prey and control regions werecalculated and included in the PCA. As the first principalcomponent was found to explain 97% of the total variation,it was the only component used for further analyses.Two opposing groups of EMDs, H3K36me3/H3K4me2
and H3K27me1/H3K9me2, were found to be the majorcontributors to the first principal component of the PCA(Figure 4A, arrows). Closer observation of three viewpoint/prey pairs revealed how EMDs and interaction frequenciesare coupled (Figure 4C). Euchromatic viewpoints, suchas FLOWERING WAGENINGEN (FWA) (Figure 4C, toprow), which are characterized by low levels of H3K27me1and enrichment of H3K36me3, preferentially interactedwith regions of a similar EMD pattern. This is evidentfrom the increased H3K36me3 levels surrounding theregion of high interaction frequencies and local peaks ofH3K27me1 enrichment, coinciding with a significant dropin interaction frequencies (Figure 4C, top row, right panel).By contrast, heterochromatic viewpoints (Figure 4C, middleand bottom rows), which are characterized by the inverseEMD composition, preferentially interacted with regionsexhibiting low H3K36me3 and high H3K27me1 levels.For example, local enrichment of H3K27me1 coincidedwith increased interaction frequencies to PHE1 (Figure 4C,middle row, right panel). Moreover, the asymmetric localinteractions surrounding hk4s appeared to be reflectedby the asymmetric distribution of H3K27me1 (Figure 4C,bottom row, left panel).Additionally, we performed PCA separately for indi-
vidual viewpoints (see Additional file 14: Figure S15).Although the same EMDs could be identified as majorfactors for most viewpoints, the first component of thePCA was less dominant, indicating a more complex collab-oration of factors separating control regions from preyregions. Furthermore, various viewpoints did not showa very clear separation of prey and control regions.

Figure 4 Crosstalk of epigenome and interactome. (A) Principal component analysis (PCA) using mean epigenetic modification densities(EMDs) of control and prey regions for each viewpoint. EMDs included in the PCA were: H3K4me2, H3K4me3, H3K9me2, H3K27me1, H3K27me3,H3K36me2, H3K36me3, H3K9ac, and H3K18ac. Colored arrows represent the two highest contributing EMDs to the variance of the firstcomponent in positive and negative direction, respectively. Note that the first principal component explains almost all the variance (97%), andtherefore, this was the only component plotted. Prey regions are represented by green dots, control regions by yellow dots. (B) Mean CGmethylation densities of prey and control regions for individual viewpoints. The mean was calculated across 1000 times randomly sampled 50prey and 50 control regions, respectively. Green bars represent preys and yellow bars represent controls. (C) Examples of the interactome-epigenome interplay for three different viewpoints and one of their corresponding prey regions. Top track: log summed 4C reads per window(100 fragments, starting every fragment). 4C reads of replicate A are plotted in the positive intercept, and 4C reads of replicate B are plotted inthe negative intercept. Middle Track: EMD of the highest contributing factors of the PCA in positive and negative direction, respectively. In orderto achieve comparable representation of H3K36me3 and H3K27me1 densities, the density of every window (25 fragments, starting every 5fragments) was divided by the mean density of each histone modification. Arrowheads point at regions where the 4C interactome and localEMD peaks appeared to correlate. FWA: viewpoint on chromosome 4, 12 to 14 Mb; prey on chromosome 5, 23 to 25 Mb. PHE: viewpoint onchromosome 1, 23.5 to 25.5 Mb; prey on chromosome 1, 20 to 22 Mb. hk4s: viewpoint on chromosome 4, 0.8 to 2.8 Mb; prey on chromosome 2,4 to 6 Mb.
Grob et al. Genome Biology 2013, 14:R129 Page 8 of 19http://genomebiology.com/2013/14/11/R129
Interestingly, this was most evident for viewpointswhose preys are associated with heterochromatic marks(PHERES1 (PHE1), hk4s, AT1G51860) (see Additionalfile 14: Figure S15).To address the individual contribution of epigenetic
marks to the interactome, we performed a test basedon a modified Gene Set Enrichment Analysis (GSEA)[33]. In summary, we tested whether prey regions wouldshow a non-random distribution in their EMD profiles(see Materials and Methods for a detailed description).The obtained empirical P-values are indicative of the
likelihood of a random set of regions to show a similardistribution of EMD values as the tested prey regions(Table 1).To independently investigate whether control and prey
regions differ significantly for individual epigenetic fea-tures, we developed a permutation test. In the first step,we calculated for each viewpoint the mean density foreach epigenetic feature (Figure 4B and Additional file 15:Figure S16). Epigenetic features that coincide with theoccurrence of heterochromatin and euchromatin, suchas DNA methylation, clearly split the viewpoints into two
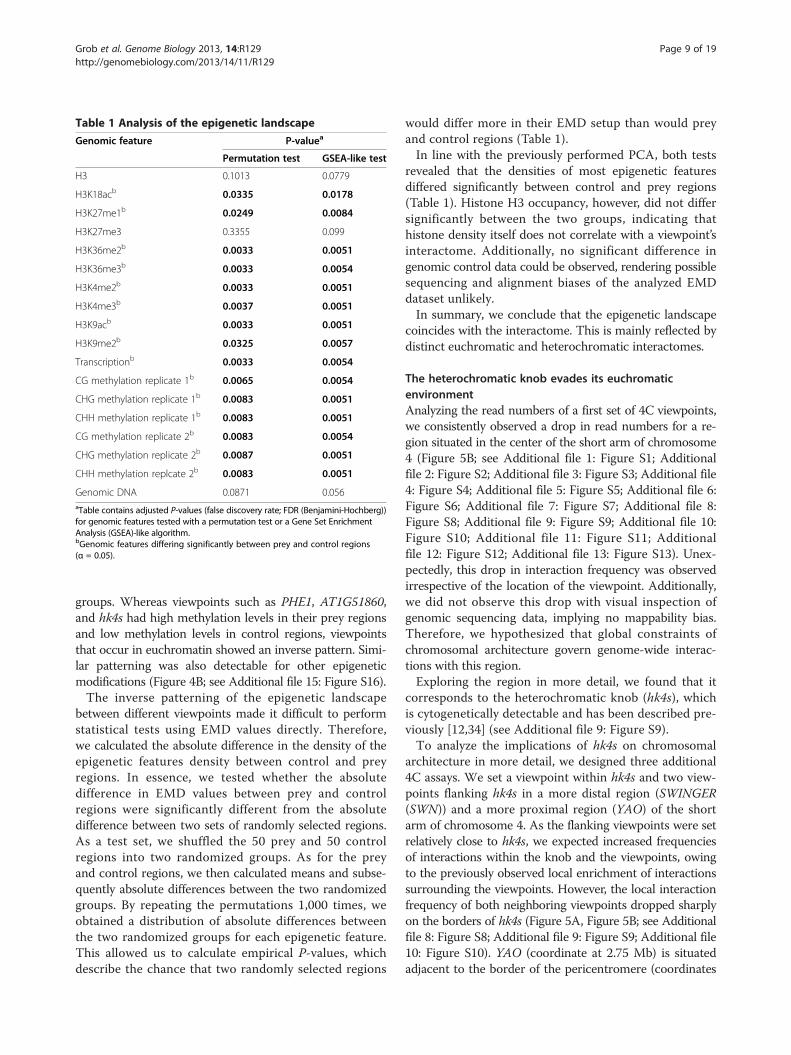
Table 1 Analysis of the epigenetic landscape
Genomic feature P-valuea
Permutation test GSEA-like test
H3 0.1013 0.0779
H3K18acb 0.0335 0.0178
H3K27me1b 0.0249 0.0084
H3K27me3 0.3355 0.099
H3K36me2b 0.0033 0.0051
H3K36me3b 0.0033 0.0054
H3K4me2b 0.0033 0.0051
H3K4me3b 0.0037 0.0051
H3K9acb 0.0033 0.0051
H3K9me2b 0.0325 0.0057
Transcriptionb 0.0033 0.0054
CG methylation replicate 1b 0.0065 0.0054
CHG methylation replicate 1b 0.0083 0.0051
CHH methylation replicate 1b 0.0083 0.0051
CG methylation replicate 2b 0.0083 0.0054
CHG methylation replicate 2b 0.0087 0.0051
CHH methylation replcate 2b 0.0083 0.0051
Genomic DNA 0.0871 0.056aTable contains adjusted P-values (false discovery rate; FDR (Benjamini-Hochberg))for genomic features tested with a permutation test or a Gene Set EnrichmentAnalysis (GSEA)-like algorithm.bGenomic features differing significantly between prey and control regions(α = 0.05).
Grob et al. Genome Biology 2013, 14:R129 Page 9 of 19http://genomebiology.com/2013/14/11/R129
groups. Whereas viewpoints such as PHE1, AT1G51860,and hk4s had high methylation levels in their prey regionsand low methylation levels in control regions, viewpointsthat occur in euchromatin showed an inverse pattern. Simi-lar patterning was also detectable for other epigeneticmodifications (Figure 4B; see Additional file 15: Figure S16).The inverse patterning of the epigenetic landscape
between different viewpoints made it difficult to performstatistical tests using EMD values directly. Therefore,we calculated the absolute difference in the density of theepigenetic features density between control and preyregions. In essence, we tested whether the absolutedifference in EMD values between prey and controlregions were significantly different from the absolutedifference between two sets of randomly selected regions.As a test set, we shuffled the 50 prey and 50 controlregions into two randomized groups. As for the preyand control regions, we then calculated means and subse-quently absolute differences between the two randomizedgroups. By repeating the permutations 1,000 times, weobtained a distribution of absolute differences betweenthe two randomized groups for each epigenetic feature.This allowed us to calculate empirical P-values, whichdescribe the chance that two randomly selected regions
would differ more in their EMD setup than would preyand control regions (Table 1).In line with the previously performed PCA, both tests
revealed that the densities of most epigenetic featuresdiffered significantly between control and prey regions(Table 1). Histone H3 occupancy, however, did not differsignificantly between the two groups, indicating thathistone density itself does not correlate with a viewpoint’sinteractome. Additionally, no significant difference ingenomic control data could be observed, rendering possiblesequencing and alignment biases of the analyzed EMDdataset unlikely.In summary, we conclude that the epigenetic landscape
coincides with the interactome. This is mainly reflected bydistinct euchromatic and heterochromatic interactomes.
The heterochromatic knob evades its euchromaticenvironmentAnalyzing the read numbers of a first set of 4C viewpoints,we consistently observed a drop in read numbers for a re-gion situated in the center of the short arm of chromosome4 (Figure 5B; see Additional file 1: Figure S1; Additionalfile 2: Figure S2; Additional file 3: Figure S3; Additional file4: Figure S4; Additional file 5: Figure S5; Additional file 6:Figure S6; Additional file 7: Figure S7; Additional file 8:Figure S8; Additional file 9: Figure S9; Additional file 10:Figure S10; Additional file 11: Figure S11; Additionalfile 12: Figure S12; Additional file 13: Figure S13). Unex-pectedly, this drop in interaction frequency was observedirrespective of the location of the viewpoint. Additionally,we did not observe this drop with visual inspection ofgenomic sequencing data, implying no mappability bias.Therefore, we hypothesized that global constraints ofchromosomal architecture govern genome-wide interac-tions with this region.Exploring the region in more detail, we found that it
corresponds to the heterochromatic knob (hk4s), whichis cytogenetically detectable and has been described pre-viously [12,34] (see Additional file 9: Figure S9).To analyze the implications of hk4s on chromosomal
architecture in more detail, we designed three additional4C assays. We set a viewpoint within hk4s and two view-points flanking hk4s in a more distal region (SWINGER(SWN)) and a more proximal region (YAO) of the shortarm of chromosome 4. As the flanking viewpoints were setrelatively close to hk4s, we expected increased frequenciesof interactions within the knob and the viewpoints, owingto the previously observed local enrichment of interactionssurrounding the viewpoints. However, the local interactionfrequency of both neighboring viewpoints dropped sharplyon the borders of hk4s (Figure 5A, Figure 5B; see Additionalfile 8: Figure S8; Additional file 9: Figure S9; Additional file10: Figure S10). YAO (coordinate at 2.75 Mb) is situatedadjacent to the border of the pericentromere (coordinates

Figure 5 Interactome of the knob hk4s. (A) Circos plot illustrating all cis and trans interactions of viewpoints located on chromosome 4. Onlyinteractions with P ≤ 10-4 were considered. Line color corresponds to the color of the viewpoints name indicated at the periphery of the plot.Chromosomes are not drawn to scale. (B) Representation of interaction frequencies for viewpoints situated on chromosome 4. Note that only theregion up to 4 Mb is plotted, therefore, viewpoints AG and FWA cannot be seen. Black dots show positions of viewpoints; turquoise dots, genes;violet dots, transposable elements; light grey, euchromatic chromosomal segment; dark grey, heterochromatic chromosomal segments; dark greyellipse, centromere. (C) Model of a potential mid-range chromosomal loop, connecting hk4s with the centromere of chromosome 4.
Grob et al. Genome Biology 2013, 14:R129 Page 10 of 19http://genomebiology.com/2013/14/11/R129
2.78 to 5.15 Mb) [3]. Interestingly, the local interactionpattern appears to be asymmetric. We observed a lossof specific interactions not only along the boundary tothe knob but also along the much closer border of thepericentromeric region (Figure 5B; see Additional file10: Figure S10). The defined sharp boundaries for localYAO interactions resembled the interaction pattern ofhk4s. Whereas YAO resides in euchromatin surroundedby heterochromatin, hk4s can be viewed as its counterpart,residing in heterochromatin but surrounded by euchroma-tin (Figure 5B).Regions situated on the long arm of chromosome 4
(AGAMOUS (AG) and FWA) interacted strongly withregions surrounding hk4s, including YAO, but not withhk4s itself (Figure 5B; see Additional files 11: Figure S11;Additional file 12: Figure S12), resembling the sharp dropin the interaction frequencies of SWN and YAO (Figure 5A,Figure 5B; see Additional file 8: Figure S8; Additional file 9:Figure S9; Additional file 10: Figure S10).Consistent with observations for the two flanking view-
points, the significant local interaction frequencies of theviewpoint set in the center of hk4s were limited by theborders of the knob. Additionally, we observed stronginteractions of hk4s with the pericentromeric regions of
chromosome 4 and with the pericentromeres of otherchromosomes (Figure 5A). The apparent absence of spe-cific interactions between hk4s and the pericentromere ofthe short arm of chromosome 4 is likely to be an artifactof the method used to assign P-values. Indeed, as P-valueswere calculated for individual chromosome arms, the highnumber of reads covering the viewpoint itself masks otherregions on the same chromosome from being associatedwith low P-values.
DiscussionReplication and the choice of appropriate window sizeare key to ensuring robustness of 4CBased on a correlation analysis of biological replicates,we show that 4C interaction profiles in Arabidopsiscan be reproducibly obtained. However, reproducibility isdependent on the window size chosen. As chromosomalinteractions are dynamic and partly stochastic, one singlerestriction fragment of two replicates can vary consider-ably in read number. Taking windows consisting of severalfragments into account can balance this variation. As wewere mainly interested in the global architecture of theArabidopsis nucleus, we chose window sizes of up to 100restriction fragments. However, the resolution for studying
Grob et al. Genome Biology 2013, 14:R129 Page 11 of 19http://genomebiology.com/2013/14/11/R129
short-range interactions is decreased by increasing thewindow size. Whereas 4C is well suited to study mid-range and long-range interactions in Arabidopsis, it isnot necessarily the method of choice to study short-rangeinteractions (for example, promoter/enhancer interactions).Regulatory sequences that are presumably involved inshort-range interactions, such as chromatin loops, areoften separated by less than a few kb. They are, therefore,difficult to analyze using 3C technologies, which rely ona sufficient number of restriction sites between the tworegions of interest to confer satisfactory resolution.
Arabidopsis and Drosophila show comparable chromatincompaction and genome sizeThe interaction decay exponent describes the slope withwhich the interaction probability decays from the view-point. Therefore, it can provide an approximation ofregional chromosomal compaction. Theoretically, a steeperslope indicates decreased flexibility of a given viewpoint, asdistant regions are less likely to interact with it. Decreasedflexibility can be interpreted as higher local chromatincompaction. Drosophila and Arabidopsis are similar withrespect to chromosome number, genome size, total numberof genes, and nuclear volume [1,35]. These characteristicscould lead to similar constraints of chromosomal architec-ture. The interaction decay exponent determined in thisstudy (−0.73) is close to that described earlier for Drosophila(−0.85) [22]. Interestingly, the interaction decay exponentin human nuclei is lower (−1.08), implying higher localcompaction [18]. This observation is consistent with thephysical characteristics of human nuclei compared withthose in Arabidopsis and Drosophila. Although varyingconsiderably, human nuclei show a lower volume/DNAratio than the nuclei in Drosophila and Arabidopsis,indicating a higher global chromatin compaction [35].It is important to mention, however, that interactiondecay exponents cannot be compared very easily betweendifferent studies, as the calculated exponents of the powerlaw scaling depend on the range of distances used forcalculations. However, which scale best describes anoverall distance-dependent interaction decay is a matter ofdebate. Additionally, the slope with which interactionsdecay was previously shown to vary between domainswith different epigenetic landscapes [18,22]. We observeda variation in interaction decay exponents between the dif-ferent viewpoints, from −0.56 to −0.96 (see Additional file16: Figure S14). However, we could not explain these dif-ferences, either by the positional or by the epigenetic en-vironment of a given viewpoint. Therefore, the globaldistance-dependent interaction decay does not necessarilyadd to the understanding of how interaction frequenciesdecrease with distance from an individual viewpoint.How and whether global nuclear compaction and inter-
action probability decay really correlate is not entirely clear.
An exploration of the Arabidopsis linc1,linc2 doublemutant could possibly answer this question, as these plantswere reported to exhibit increased DNA density comparedwith wild-type plants [1].
4C results refine the view on general chromosomalarchitecture in ArabidopsisThe investigation of general features of chromosomalarchitecture in this study is consistent with previousfindings studying Arabidopsis nuclei using cytogeneticmethods [27,36]. However, 4C technology enables us togenerate genome-wide interaction maps for variousviewpoints and, hence, does not depend on a pair-wiseanalysis of two interacting sequences. This greatly adds toour understanding of general constraints on chromosomalarchitecture.Basic interaction units appear to be defined as chromo-
some arms, with centromeres acting as a boundary. Thesefindings are in agreement with an earlier study by Schubertand colleagues, reporting that chromosome arms arelocalized in distinct territories, as evidenced by FISHon Arabidopsis nuclei [36]. However, whether centromeresalways act as strict boundaries cannot be conclusivelyanswered, as the boundary effect of centromeres is likelyto vary between the different chromosomes.We observed a strong influence of the chromosomal
location of a viewpoint on its interaction potential. Re-markably, the linear organization of chromosomes wasreflected in the overall interaction potential of a givenviewpoint, despite the dense packaging of the genomein the nucleus.We propose that centromeres anchor the chromosomes
in the nucleus, thereby allowing chromosome arms toprotrude inside the nuclear volume [25-28]. The flexibilityof chromosome arms thus increases with their length,allowing distant regions to interact more frequently intrans than more centrally located regions. Our hypothesisis supported by strong evidence for clustering of cen-tromeres and their adherence to the nuclear matrix indifferent model organisms [37-39]. Taken together, thesefindings may explain why regions with a similar distance tothe centromeres, which act as anchor points, preferentiallyinteract with each other.We also observed significant inter-telomeric interac-
tions. A high interaction frequency of (sub-)telomericregions in Arabidopsis was recently also shown byFISH [36]. In addition, previously published HiC datasuggest increased interaction frequencies between telo-meres [21,38]. By contrast, telomeres and centromeresdo not interact, indicating a strict separation of thesetwo key organizational elements of Arabidopsis chro-mosomes. These findings are in line with previousstudies, and may be explained by the nucleolar localizationof telomeres [27,40].

Grob et al. Genome Biology 2013, 14:R129 Page 12 of 19http://genomebiology.com/2013/14/11/R129
Remarkably, in Drosophila, long-range interactions seemto occur nearly exclusively within the viewpoint’s chromo-somal arm [30]; however, in the present study, up to 50%of all interactions were found to be outside this region.Whether this difference from Drosophila holds biologicalmeaning is unclear. The presence of a higher number ofindividual cell types in the sample could theoreticallyincrease the number of observable interactions, and resultin a more complex interactome of a given viewpoint. Suchincreased complexity could thereby lead to an increasednumber of trans interactions. However, we do not estimatethe number of cell types to be significantly differentbetween the present study and the report by Tolhuis andcolleagues, in which 4C was performed on Drosophilalarval brain tissue [30], as the aerial seedling tissue usedin our study is predominantly composed of mesophyll cells.The phase of the cell cycle might be a more importantconfounding factor. Over a cell cycle, chromosomal archi-tecture changes dramatically. Cells of Arabidopsis seedlingsdivide at high frequency, leading to a rather short timeperiod in which cells reside in interphase. Therefore, theproportion of cells in specific stages of the cell cycle couldbe a major factor influencing the (average) chromosomalconformation of a population of cells.
The interactome of a viewpoint is reflected in itsepigenetic landscapePCA revealed two distinct groups of prey regions, whichcould be discriminated mainly by the level of H3K36me3/H3K4me2 and H3K27me1/H3K9me2 densities. Interest-ingly, these histone modifications are commonly attributedto euchromatin or heterochromatin, respectively [31]. Fur-thermore, the heterochromatic pair H3K27me1/H3K9me2is described to be the major component of ‘chromatin state3’, which is mainly associated with transposable elements,as previously reported by Roudier and colleagues, whereasthe pair H3K36me3/H3K4me2 primarily contributes to‘chromatin state 1’, associated with active genes [3]. Filionand colleagues describe five distinct chromatin types inDrosophila, distinguished by the composition of proteinsadhering to the DNA. H3K4me2 was shown to be mostabundant in ‘red chromatin’, which represents one of twoeuchromatic chromatin states, whereas H3K9me2 isenriched in ‘green chromatin’, which can best be describedas the classic heterochromatin of pericentromeric regions[4]. As anticipated by previous cytological studies of Arabi-dopsis nuclei, the interactome obtained by 3C technologiescan be separated into two distinct domains, correlatingwith both the epigenetic and the cytogenetic definitionof heterochromatin and euchromatin. Interestingly, thisdistinction is not only confined to cis interactions but canalso be observed at the level of the whole genome. Inaddition, we suggest a further discrimination of heterochro-matic interactions. The purely heterochromatic viewpoint
hk4s predominantly interacts with visible heterochromatinsuch as the pericentromeric regions. PHE1, which showsmoderate H3K27me1 enrichment surrounding the view-point, interacts predominantly with heterochromaticislands within otherwise euchromatic regions (Figure 2,Figure 4C; see Additional file 4: Figure S4).Previous work in Arabidopsis has shown that homolo-
gous pairing is decreased in hypomethylation mutants [41],indicating a role for cytosine methylation in long-rangeinteractions. We observed significant differences betweencontrol and prey regions with respect to their CG, CHH,and CHG methylation densities. Additionally, transcriptionrates exhibited significant differences between prey andcontrol regions. Whether transcriptionally active genesinteract with each other is not clear, as the genes residingin our viewpoints were not evenly balanced with regard totheir transcriptional state (active versus silenced), renderingthem inappropriate for statistical analysis.Taking these results together, we conclude that interac-
tomes share a common epigenetic landscape, leading todistinguishable heterochromatic and euchromatic interac-tomes. However, it is not clear to what extent individualepigenetic modifications influence the interactome, andto what extent the epigenetic landscape is the cause orconsequence of a given interactome.
The knob hk4s: exception or rule?Finally, the knob hk4s appears as an exceptional featurewithin the Arabidopsis nuclear landscape, as it interactspredominantly with pericentromeric regions. We think thathk4s represents the exception that proves the rule becauseits interactome reflects the pericentromeric origin of hk4s,which arose by an inversion that placed a pericentromericregion into the center of the chromosome arm. As dis-cussed above, heterochromatic regions form a distinctinteractome, in which heterochromatic islands that residein an euchromatic environment are included. Figure 5Cillustrates a model suggesting overall chromosomal archi-tecture and chromosomal looping of hk4s to the clusteredcentromeres. Our results indicate that the knob hk4s actsas an interaction insulator for its neighboring regions, andconserves its pericentromeric origin with respect to itsinteraction frequencies.To date, neither a functional role as a (neo)centromere
nor an association with the nuclear matrix has beenreported for hk4s. However, the specific interaction ofhk4s with centromeres could raise speculation concerningthe functional role of hk4s in the nucleus. The specificityof a given region to function as a centromere is surprisinglyflexible. Previous reports show that in maize, centromereidentity is not irreversibly defined. Wolfgruber andcolleagues demonstrated that the centromere of maizechromosome 5 has moved to a new location, due to theinvasion of non-centromeric retrotransposons, splitting the
Grob et al. Genome Biology 2013, 14:R129 Page 13 of 19http://genomebiology.com/2013/14/11/R129
centromere into two. Consequently, one of the two cleavageproducts lost its association with histone CenH3, whichdefines centromeres epigenetically by replacing the regularhistone H3 protein [42]. In maize, centromere identitycorrelates with the abundance of centromeric retrotranspo-sons [43], which specifically invade centromeric regions.Nevertheless, centromere identity appears to be mainlycontrolled epigenetically and not by DNA sequence[44,45]. However, previous reports show that that histoneCenH3 accumulation defines the functional centromere inArabidopsis and that CenH3 is predominantly associatedwith the 178 bp centromeric repeats [46,47]. As the knobhk4s lacks the centromeric 178 bp repeats and is thoughtto originate from a pericentromic region, which is notassociated with CenH3, we conclude that hk4s is mainlyinvolved in heterochromatin formation, and that hk4s isunlikely to play a role as a (neo)centromere.
ConclusionsCentromeres are key elements for chromosomal organi-zation, as the position relative to the centromere stronglyinfluences the interactome of a chromosomal region.We propose that the length of chromosome arms limitsthe mobility with which a region can traverse through thenuclear space and, therefore, influences the interactionpotential in trans. Another hallmark of chromosomalarchitecture in Arabidopsis nuclei is the separation of twoseemingly distinct interactomes, strongly correlating withvisible heterochromatin and euchromatin. Interestingly,heterochromatic islands are partly able to evade theireuchromatic context. The epigenetic landscapes of theheterochromatic and euchromatic interactome are clearlydistinguishable. Therefore, histone modifications, whichwere previously described to be characteristic of chromatinstates, may also be predictive for the interaction potentialof a given chromosomal region.
Materials and methodsNuclei extraction and 4C sample preparationSeedlings of Arabidopis thaliana (L.) Heynh, accessionColumbia (Col-0), were grown for 14 days on MS plates(4.3 g/l Murashige and Skoog salt (Carolina BiologicalSupply Company, Burlington, North Carolina, USA), 10 g/lsucrose (Applichem GmbH, Darmstadt, Germany), 7 g/lPHYTAGAR (Life Technologies Europe, Zug, Switzerland),pH5.6). Aerial tissue of seedlings was collected (approxi-mately 10 g per sample), and distributed evenly betweenfour conical 50 ml tubes. Under vacuum, the seedlingswere incubated for 1 hour at room temperature in 15 mlfreshly prepared nuclei isolation buffer (NIB: 20 mmol/lHepes (pH8), 250 mmol/l sucrose, 1 mmol/l MgCl2,5 mmol/l KCl, 40% (v/v) glycerol, 0.25% (v/v) TritonX-100, 0.1 mmol/l phenylmethanesulfonylfluoride (PMSF),0.1% (v/v) 2-mercaptoethanol) and 15 ml 4% formaldehyde
solution, then 1.9 ml of 2 mol/l glycine was added toquench the formaldehyde, and the mixture was incubatedfor another 5 minutes under vacuum. The seedlingswere snap-frozen in liquid nitrogen, and ground to a finepowder. The powder from two initial tubes was pooledand suspended in 10 ml NIB, with added protease inhibi-tor (Complete Protease Inhibitor Tablets; Roche, Basel,Switzerland; two tablets in 150 ml NIB). The suspensionwas filtered twice through Miracloth (Calbiochem/EMDMilipore, Darmstadt, Germany) adding an additional 10 mlNIB. The filtered nuclei suspension was spun for 15 minutesat 4°C and 3000×g. The supernatant was discarded, andthe pellet was resuspended in 4 ml NIB and transferred totwo 1.5 ml reaction tubes. After the tubes were spunfor 5 minutes at 4°C and 1900×g, the supernatant wasremoved, and the pellet was resuspended in 1 ml NIB,followed by centrifugation under the above conditions. Thisstep was repeated twice. Then, the nuclei were washedtwice with 1.2 × NEB buffer 4 (New England Biolabs,Ipswich, MA, USA) (10 × NEB buffer 4: 50 mmol/l potas-sium acetate, 20 mmol/l Tris acetate, 10 mmol/l magne-sium acetate, 1 mmol/l dithiothreitol (DTT)), using thecentrifugation conditions described above. The nuclei werefinally resuspended in 500 ml 1.2 × NEB buffer 4, with 5 μlof 20% SDS added. The samples were incubated for40 minutes at 65°C, followed by 20 minutes at 37°C underconstant shaking, then 50 μl of 20% Triton X-100 wereadded. The mixture was incubated for 1 hour at 37°C underconstant shaking, then 60 μl of sample was removed as apre-digestion control.For digestion 15 μl 10 × NEB buffer 4 and 115 μl H20
were added to the samples, and digestion was startedusing 100 U of HindIII restriction enzyme (New EnglandBiolabs). After 3 hours of incubation at 37°C, 200 U ofHindIII were added, followed by overnight incubation at37°C. Next morning 100 U of HindIII were added, andsamples were incubated for a final 2 hours. An aliquot(80 μl) of the sample was transferred to a fresh tube, andkept aside as a post-digestion control. To inactivateHindIII, 20 μl 20% SDS were added, and samples wereincubated at 65°C for 25 minutes under constant shaking.Samples were transferred to 15 ml conical tubes, and700 μl of 10× ligation buffer (0.5 mol/l Tris-Cl, 0.1 mol/lMgCl2, 0.1 mol/l DTT, pH 7.5), 375 μl of 20% TritonX-100, and H2O to a final volume of 7 ml was added,followed by 1 hour of incubation at 37°C under constantshaking.Ligation was performed by adding 70 μl of 100 mmol/l
ATP (Roche) and 50 Weiss Units (WU) of DNA Ligase(Fermentas/ThermoFisher, Waltham, USA). The samplewas incubated for 5 hours at 16°C. During incubation,additional 10 WU of DNA ligase were added. Followingligation, 30 μl 10 mg/ml proteinase K (Qbiogene; MPBiomedicals, Santa Ana, CA, USA) were added, and the
Grob et al. Genome Biology 2013, 14:R129 Page 14 of 19http://genomebiology.com/2013/14/11/R129
sample was incubated overnight at 65°C. Next morning,30 μl of 10 mg/ml RNase A (Roche) were added, and thesample was incubated for 30 minutes at 37°C.The DNA was purified by two chloroform:phenol ex-
tractions, followed by ethanol precipitation using 1 ml3 mol/l sodium acetate, 7 ml H2O and 25 μl glycogen,taken up to a final volume of 50 ml with ice-cold ethanol.The mixture was kept overnight at −80°C. The pellet wasfinally resuspended in 150 μl H2O.Pre-digestion control, post-digestion control, and the
final 3C sample (120 ng of DNA each) were analyzed on1.5% agarose gels. Samples with satisfactory digestionwere then pooled to proceed further.The 3C samples were digested with a final quantity of
0.2 U/μl of the secondary restriction enzymes DpnII orNlaIII, respectively (New England Biolabs). The 4C digestedsamples were analyzed on an agarose gel. For the 4Cligation, 700 μl of T4 Ligase Buffer (Fermentas/Thermo-Fisher), 70 μl 100 mmol/l ATP, and 50 WU of DNA Ligase(Fermentas/ThermoFisher), were taken up to 7 ml withH2O; this mixture was added to the samples, and theligation reaction was incubated for 5 hours at 16°C. Finally,the samples were purified by phenol:chloroform ex-traction, followed by ethanol precipitation, and storedat −20°C.For each viewpoint, 16 PCRs (for detailed PCR conditions
and primer sequences, see Additional file 17: Table S1)were set up, using 30 ng of 4C template for each reaction.For ease of later Illumina library preparation, primers of asubset of samples were designed with an Illumina sequen-cing adapter tail (batch 1: MEA F6, MEA F8, PHE, FIS2,CKI1, FWA, AG, FLC). For all other samples (batch 2:AT1G51860, AT3G44380, SWN, hk4s, YAO), Illuminasequencing adapters were ligated later in the librarypreparation process.An aliquot of each PCR product was analyzed on an
agarose gel, and the remaining PCR product was purifiedusing the QIAquick PCR Purification Kit (Qiagen, Hilden,Netherlands), following the manufacturer’s protocol.
Library preparationHereafter, library preparation is described for samplesthat had no Illumina (Illumina, San Diego, CA, USA)adapter attached to the 4C primer. Samples of eachreplicate were pooled in equimolar amounts, and assessedon a Bioanalyzer (Agilent Technologies, Santa Clara, CAUSA). Finally, each sample volume was adjusted to 100 μlusing H2O. Replicates were then split into two aliquotsof 50 μl each, and 10 μl of Resuspension Buffer (RSB;Illumina) and 40 μl End-Repair Mix (ERP) (Illumina)was added. The mixture was incubated for 30 minutes at30°C. Then, 100 μl of Agencourt AMPure beads (BeckmanCoulter, Brea, CA, USA) were added, and the mixturewas incubated for 15 minutes at room temperature. The
reaction tubes were then placed on a magnetic stand. Thesupernatants were removed without disturbing the beads,and 400 μl of freshly prepared 80% ethanol was added.After 30 seconds, the ethanol was replaced with another400 μl of 80% ethanol. The supernatant was removed,and the tubes were left open to dry. The beads binding the4C PCR products were resuspended in 17.5 μl RSB, and in-cubated for 2 minutes before being placed on a magneticstand for 15 minutes. Finally, 15 μl of sample was trans-ferred to a fresh 0.2 ml reaction tube. To each sample,2.5 μl of RSB and 12.5 μl A-tailing Mix (ATL) (Illumina)were added and mixed thoroughly, followed by incubationat 37°C for 30 minutes. Following this, 2.5 μl of RSB, 2.5 μlof DNA Ligase Mix (LIG) (Illumina) and 2.5 μl of indexedDNA adapters (Illumina) were added, and mixed gently bypipetting the mixture up and down. Subsequently, the mix-ture was incubated for 10 minutes at 30°C. To inactivatethe reaction 5 μl of Stop Ligase Mix (STL) (Illumina)were added, and samples were transferred to a fresh1.5 ml reaction tube. Then 42.5 μl of AgencourtAMPure beads (Beckman Coulter) were added to eachtube, and the mixture was incubated for 15 minutes atroom temperature. The tubes were subsequently placed ona magnetic stand for 2 minutes, then 80 μl of supernatantwere removed and replaced with 200 μl of freshly prepared80% ethanol. After incubation for 30 seconds, the super-natant was removed, and the tubes were left open to dry.The previous ethanol washing step described above wasrepeated once, then, the pellet was resuspended in 52.5 μlRSB. After 2 minutes of incubation at room temperature,tubes were placed on a magnetic stand for 2 minutes, then50 μl of the supernatant were transferred to a fresh 1.5 mlreaction tube. The Agencourt AMPure (Beckman Coulter)cleanup was repeated once; however, at the final step,instead of being suspended in 52.5 μl RSB, the pelletwas resuspended in 22.5 μl RSB, of which 20 μl weretransferred to a fresh 0.2 ml reaction tube. Sampleswith adapters already attached to the 4C PCR primerswere treated in the same way from this point on. Toperform final library amplification, 5 μl of PCR PrimerCocktail (PPC) and 25 μl of PCR Master Mix (PMM)(both Illumina) were added to each tube. PCR was per-formed under the following conditions: 98°C for 30 seconds;then 12 cycles of 98°C for 10 seconds, 60°C for 30 seconds,and 72°C for 30 seconds; followed by a final elongation at72°C for 5 minutes. Samples were then transferred to a1.5 ml reaction tube, and 50 ml of Agencourt AMPurebeads (Beckman Coulter) were added. After 15 minutes ofincubation at room temperature, the tubes were placed ona magnetic stand for 2 minutes. Following this, 95 μl ofsupernatant were removed, and the beads were washedtwice with 200 μl of freshly prepared 80% ethanol. Afterthe supernatant was removed, tubes were left open to dry.The pellet was then resuspended in 32.5 μl RSB and

Grob et al. Genome Biology 2013, 14:R129 Page 15 of 19http://genomebiology.com/2013/14/11/R129
incubated for 2 minutes at room temperature. The tubeswere placed on a magnetic stand, and 30 μl of the purifiedlibrary were transferred to a fresh 1.5 ml reaction tube.From each library a 10 nmol/l stock in Tris-Cl (pH 8.5)with 0.1% (v/v) Tween 20 was prepared. All replicatesin the libraries were subsequently pooled, and used forIllumina HiSeq 100 bp single end sequencing. For eachbatch of replicates, one lane per replicate was loaded(total of four lanes). Batch 1 replicate A had a total yieldof 92,063,669 raw reads, with a mean quality score of35.35. Batch 1 replicate B had a total yield of 80,777,012raw reads with a mean quality score of 35.31; batch 2replicate A had a total yield of 43,296,252 raw readswith a mean quality score of 36.85; and batch 2 replicateB had a total yield of 55,187,969 raw reads with a meanquality score of 36.76.
4C sequencing data pre-processingThe two fastq files (one per replicate) were split intoseparate viewpoints according to the 4C primer se-quences and the HindIII restriction pattern within thereads. No mismatches were allowed, and the remainingreads were discarded. After removal of primer andrestriction site sequences, reads were trimmed to 30 bpand aligned to the Arabidopsis reference genome [48]using bowtie (version 0.12.7) [49] with the commandline arguments -a -v 0 -m 25. For alignment statistics,see Additional file 17: Table S2.Reads with multiple alignments were processed as
described previously [50]. Because we estimated the lengthof a single interaction unit as 100 kb, we used an allocationdistance of ±50 kb. To specify potential 4C fragments, wegenerated an in silico HindIII digest of the ArabidopsisCol-0 genome. Reads mapping to the ends of the resultingfragments were considered for further analysis. For a morerobust measure of interactions, fragments were then usedto generate windows spanning a larger region of thegenome (that is, 100 fragments, corresponding to 180 kbon average). During this process, fragments closer than1 kb to the viewpoint were discarded, given that a largeproportion of their reads would probably originate fromincomplete digestion and/or self-circularization. Further-more, we discarded all fragments closer than 100 kb to acentromere, as the quality of alignments to centromeres islow. Finally, fragments whose distance from the primaryrestriction site to the first occurring secondary restrictionsite was 1000 bp or more with respect to both ends of thefragment were also removed. As a measure of interactionof a given window (interaction value), fragment countswere log-transformed to avoid high impact of outlier frag-ments, and then summed. Depending on the downstreamanalysis, windows spanned either 100 fragments fromeach fragment on (overlapping) or 25 fragments startingfrom every 25th fragment (non-overlapping).
Processed 4C data files (split according to primersequence) and raw-data sequencing files are publicallyavailable on Gene Expression Omnibus (GEO), accessionnumber GSE50181.
Data processing of histone modifications, transcription,DNA methylation, and genomic sequencingTo add additional information, such as histone modificationpatterns and transcription rates, we obtained publiclyavailable data from GEO [51], specifically ChIP sequencing(ChIP-seq) data GSM701923, GSM701924, GSM701925,GSM701926, GSM701927, GSM701928, GSM701929, GSM701930, GSM701931 [30], and RNA-seq data GSM701934[30]. Pre-processed DNA methylation data was obtainedfrom [32].ChIP-seq and RNA sequencing (RNA-seq) reads (SOLiD
sequencing, 50 bp (Applied Biosystems/Life Technologies)were aligned to the Arabidopsis reference genome (Col-0,TAIR10 [52]) using bowtie (version 0.12.7) with the follow-ing command line arguments: –a –v 2 –m 25. Reads withmultiple alignments were processed as described previously[50]. Allocation distances were set to ±5 kb and ±50 bp forthe ChIP-seq and the RNA-seq data, respectively. Histonemodification densities and DNA methylation densities werecalculated by the sum of nucleotides covered by at least oneuniquely alignable short sequence, divided by the total num-ber of nucleotides for each individual 4C restriction fragment.To estimate potential biases related to sequence compos-
ition (such as repetitive sequences), we obtained genomicDNA sequencing data (Illumina, 100 bp) of the data setGSM567816, and processed them identically to the 4Csequencing data.
Assigning P-values to individual windowsTo estimate the significance of an interaction, we calculatedfor each window the probability (that is, P-value) to observeits interaction value by chance. Given that an interactionof two fragments would lead to a higher read count inthe neighboring fragments as well (hence in the window),random shuffling of fragment positions and recalculationof window interaction values provides randomized inter-action data with the values following a normal distribution.Using the parameters of this distribution, a preliminaryP-value was then calculated for each window. We repeatedthis process 1,000 times, and averaged for each windowthe P-values from all individual repetitions to obtain a finalP-value. To take into account the differences betweenchromosome arms (for example, the different amountof DNA between the short arm and the long arm ofchromosome 2), the P-values were calculated for eachchromosome arm separately.P-value thresholds were chosen to best fulfill the require-
ments of either plotting or data analysis. Generally, we setthe threshold for prey regions to 10-3. In the Circos plot of

Grob et al. Genome Biology 2013, 14:R129 Page 16 of 19http://genomebiology.com/2013/14/11/R129
Figure 5A we chose P ≤ 10-4 for better visibility. Becausefor various viewpoints, a threshold of 10-3 did not yield asufficient number of prey regions for robust data analysis,we chose a threshold of P ≤ 0.05 to perform PCA.
Distance decayWe estimated the genomic distance-dependent decay ofthe interaction probability on a distance of 1 kb to 10 Mbfrom the viewpoint. This stretch was log-transformed, andsplit into 41 intervals with length of 0.1 (on the log scale).For each sample, the reads of the fragments correspondingto the intervals were summed up and assigned to the inter-val. Given that the centromere acts as an interactionboundary, only fragments on the viewpoint's arm wereconsidered. Read counts per interval were then divided bythe total number of reads across all intervals representingcontact probabilities, which across the full distance add upto 1. Given that some intervals contained only a few frag-ments and, in certain cases, only fragments from a subsetof the viewpoints, we used a locally weighted scatterplotsmoothing (LOESS) predictor fitted to the original data tocalculate one single contact probability value for each inter-val. To obtain the slope, and hence the distance decay coef-ficient, we then approximated the data with a linear model.Slope and P-value were derived from the fit of the linearmodel to the values predicted by the LOESS fit. However,direct fitting of a linear model to the original data yieldedalmost equal results with a slope of −0.72 instead of −0.73,and an extremely low P value (<10-100).
Centromere distanceTo analyze the effect of a viewpoint's distance to thecentromere on the distribution of the observed interactionfrequencies along chromosome arms, we calculated foreach chromosome arm (except the viewpoint's arm)the distance to the centromere at which 50% of allreads were aligned, and then fitted a linear model. Theprocedure was performed twice, first using absolutevalues, and then relative distances, defined as the absolutedistance divided by the length of the chromosome arm(transformed by taking the arcsine of the square root).
Principal component analysisAll PCAs were based on non-overlapping windows thatincluded 25 fragments. For each viewpoint, mean prey andcontrol histone densities for each histone modification(that is, EMD) were calculated. Subsequently, PCA wasperformed on a dataset including mean EMD values of con-trol and prey regions for each viewpoint and EMD. PCAwas performed using the built-in R princomp() function.
Permutation testTo analyze differences in the epigenetic landscape of preyand control regions, we randomly selected 50 prey and 50
control regions (sampled) for each viewpoint, and obtaineda corresponding randomized test set by pooling their EMDsand permuting them (shuffling them into two randomizedgroups of 50 values each). We then calculated the absolutedifferences in averaged EMDs between the sampled (Real-Diffij), and the permutated (RandDiffij) prey and controlregions, respectively.Repeating this step i times for each of the j viewpoints
yielded an empirical distribution for RandDiff for everyepigenetic modification with 13,000 values (j = 13 view-points, and i = 1,000 repetitions). Comparing the averageRealDiffm (mean across all repetitions and viewpoints)with this distribution then provided an empirical P-value(p =∑(RandDiffij > RealDiffm)/(i*j)), which was subsequentlyadjusted for multiple testing calculating false discoveryrate (FDR; Benjamini-Hochberg).
Analysis of individual epigenetic marks employingGSEA-like analysisTo test whether prey regions have a different epigeneticlandscape from that of regions chosen randomly acrossthe genome, we developed a procedure similar to theGSEA described previously [33]. It requires densities ofEMDs (for example, CG methylation density or H3K9me2)assigned to all (n) regions in the genome (that is, non-overlapping windows spanning 25 restriction fragments),and a subset (m) of the regions as a test set (that is, preyregions with a P < 0.01 in both replicates). During theprocedure, the regions are first sorted according to theirEMD. We then assigned a value of −1 to regions not inthe test set, and a value of (n-m)/m to the regions in thetest set (to assure that the sum of these values across allregions would be zero). In a third step, the cumulativesum of these values was calculated and the enrichmentscore (ES) was defined as the maximum (absolute) devi-ation from zero. If the regions in the test set were randomlydistributed across the sorted list of all regions, the cumula-tive sum would fluctuate around zero with a relatively smallES. Conversely, a non-random distribution of the test set(for example, accumulation at one end of the sorted list)would lead to a high ES. A P-value could then be assignedby comparing an observed ES to an ES distribution ob-tained by randomly choosing m regions 10,000 times.To obtain one P-value per epigenetic feature, the ES wereaveraged across all viewpoints. As we were focusing onlong-range interactions, we excluded all interactions withinthe viewpoint’s arm. Because statistical testing for allepigenetic features was employed, using the same 4C data,P-values were adjusted for multiple testing, calculatingFDR (Benjamini-Hochberg).
PlottingAll plotting of 4C data, genomic features, and histonemodification data was performed using either Circos

Grob et al. Genome Biology 2013, 14:R129 Page 17 of 19http://genomebiology.com/2013/14/11/R129
[23] or built-in R functions [53] plotting. Code is availableupon request.
Data availabilityAll sequencing data and processed 4C files are availableon Gene Expression Omnibus (GEO) accession numberGSE50181.
Additional files
Additional file 1: Figure S1. Circular chromosome conformationcapture (4C) interactome of MEA F6.
Additional file 2: Figure S2. Circular chromosome conformationcapture (4C) interactome of MEA F8.
Additional file 3: Figure S3. Circular chromosome conformationcapture (4C) interactome of AT1G51860.
Additional file 4: Figure S4. Circular chromosome conformationcapture (4C) interactome of PHE1.
Additional file 5: Figure S5. Circular chromosome conformationcapture (4C) interactome of FIS2.
Additional file 6: Figure S6. Circular chromosome conformationcapture (4C) interactome of CKI1.
Additional file 7: Figure S7. Circular chromosome conformationcapture (4C) interactome of AT3G44380.
Additional file 8: Figure S8. Circular chromosome conformationcapture (4C) interactome of SWN.
Additional file 9: Figure S9. Circular chromosome conformationcapture (4C) interactome of hk4s.
Additional file 10: Figure S10. Circular chromosome conformationcapture (4C) interactome of YAO.
Additional file 11: Figure S11. Circular chromosome conformationcapture (4C) interactome of AG.
Additional file 12: Figure S12. Circular chromosome conformationcapture (4C) interactome of FWA.
Additional file 13: Figure S13. Circular chromosome conformationcapture (4C) interactome of FLC.
Additional file 14: Figure S15. Principal component analysis (PCA) forindividual viewpoints. Each graph represents a bi-plot of a PCA, includinghistone modification densities (EMDs) for prey and control regions of agiven viewpoint, respectively. Contributions to the variance of the first twoprincipal components are indicated below the bi-plot. Loadings of the fourmajor factors to the first principal component are listed.
Additional file 15: Figure S16. Epigenetic modification density (EMD).For each EMD and viewpoint, the mean EMD for 1,000 × randomlychosen 50 prey and control regions was calculated and plotted. Greenbars, prey; yellow bars, control.
Additional file 16: Figure S14. Interaction frequency decay forindividual viewpoints. Interaction frequency decay is plotted forindividual viewpoints. Black line: LOESS smoothened decay. Red dottedline: Linear regression. Values of the slopes are indicated in the lower leftcorner of each graph.
Additional file 17: Table S1. Viewpoint coordinates and primersequences. Indicated are the viewpoints’ names, their respectivechromosome and position in bp, primer sequences, and restrictionenzymes used for primary (1°RS) and secondary (2°RS) digest, respectively.Table S2. Alignment scores. Columns indicating chromosomes shownumbers of mapped reads. Other columns show unmapped reads,percentage of mapped reads, and total reads.
Abbreviations3C: Chromosome conformation capture; 4C: Circular chromosomeconformation capture; ChIP-seq: Chromatin immunoprecipitation
sequencing; EMD: Epigenetic modification density; ES: Enrichment score;FDR: False discovery rate; FISH: Fluorescent in situ hybridization; GEO: GeneExpression Omnibus; GSEA: Gene Set Enrichment Analysis;H3K27me1: Monomethylation of lysine 27 of H3; H3K36me3: Trimethylationof lysine 36 of H3; H3K4me2: Dimethylation of lysine 4 of H3;H3K9me2: Dimethylation of lysine 9 of H3; PCA: Principal componentanalysis; RNA-seq: RNA sequencing; RPKM: Reads per kilobase per million;RPM: Reads per million.
Competing interestsThe authors declare that they have no competing interests.
Authors’ contributionsSG conceived the study, conducted the experiments, performed dataanalysis, and wrote the manuscript. MWS performed data analysis andhelped to write the manuscript. TW helped to conceive the study andhelped to edit the manuscript. NL helped to conceive the study. UGconceived the study, and helped with data interpretation and writing of themanuscript. All authors read and approved the final manuscript.
AcknowledgementsWe thank Keith Harshman, Johann Weber, and Corinne Peter (University ofLausanne) for advice on Illumina library construction, and Heike Lindner,Aurélien Boisson-Dernier, and Pauline Jullien for critically reading themanuscript. This work was supported by the University of Zürich, theUniversity Research Priority Program Functional Genomics/Systems Biology,an IPhD project grant from SystemsXch, the Swiss Initiative for SystemsBiology (to UG, TW, and NL), and an Advanced Grant of the EuropeanResearch Council (to UG).
Author details1Institute of Plant Biology and Zürich-Basel Plant Science Center, Universityof Zürich, Zollikerstrasse 107, CH-8008 Zürich, Switzerland. 2Institute ofOrganic Chemistry, University of Zürich, Winterthurerstrasse 190, CH-8057Zürich, Switzerland.
Received: 18 June 2013 Accepted: 24 November 2013Published: 24 November 2013
References1. Dittmer TA, Stacey NJ, Sugimoto-Shirasu K, Richards EJ: LITTLE NUCLEI
genes affecting nuclear morphology in Arabidopsis thaliana. Plant Cell2007, 19:2793–2803.
2. Arnott S, Hukins DW: Optimised parameters for A-DNA and B-DNA.Biochem Biophys Res Commun 1972, 47:1504–1509.
3. Roudier FCO, Ahmed I, Rard CBE, Sarazin A, Mary-Huard T, Cortijo S, Bouyer D,Caillieux E, Duvernois-Berthet E, Al-Shikhley L, Giraut LEN, s BDE, Drevensek SEP,Barneche FED, Rozier SDE, Brunaud VER, Aubourg SEB, Schnittger A, Bowler C,Martin-Magniette M-L, Robin SEP, Caboche M, Colot V: Integrative epigenomicmapping defines four main chromatin states in Arabidopsis. EMBO J 2011,30:1928–1938.
4. Filion GJ, van Bemmel JG, Braunschweig U, Talhout W, Kind J, Ward LD,Brugman W, de Castro IJ, Kerkhoven RM, Bussemaker HJ, van Steensel B:Systematic protein location mapping reveals five principal chromatintypes in Drosophila cells. Cell 2010, 143:212–224.
5. Pfluger J, Wagner D: Histone modifications and dynamic regulation ofgenome accessibility in plants. Curr Opin Plant Biol 2007, 10:645–652.
6. Rabl C: Über die Zelltheilung. Morphologisches Jahrbuch 1885, 10:214–330.7. Heitz E: Das Heterochromatin der Moose. 1 Jahrb Wiss Bot 1929,
69:762–818.8. La Cour L: Heterochromatin and the organization of nucleoli in plants.
Heredity 1951, 5:37.9. Noordermeer D, Leleu M, Splinter E, Rougemont J, De Laat W, Duboule D:
The dynamic architecture of Hox gene clusters. Science 2011,334:222–225.
10. Gheldof N, Smith EM, Tabuchi TM, Koch CM, Dunham I,Stamatoyannopoulos JA, Dekker J: Cell-type-specific long-range loopinginteractions identify distant regulatory elements of the CFTR gene.Nucleic Acids Res 2010, 38:4325–4336.
11. McClintock B: Chromosome morphology in Zea mays. Science 1929,69:629.
Grob et al. Genome Biology 2013, 14:R129 Page 18 of 19http://genomebiology.com/2013/14/11/R129
12. Fransz PF, Armstrong S, de Jong JH, Parnell LD, van Drunen C, Dean C,Zabel P, Bisseling T, Jones GH: Integrated cytogenetic map ofchromosome arm 4S of A. thaliana: structural organization ofheterochromatic knob and centromere region. Cell 2000, 100:367–376.
13. Laboratory TCSH, Washington University Genome Sequencing Center,Consortium PBAS: The complete sequence of a heterochromatic islandfrom a higher eukaryote. Cell 2000, 100:377–386.
14. Fransz P, Armstrong S, Alonso-Blanco C, Fischer TC, Torres-Ruiz RA, Jones G:Cytogenetics for the model system Arabidopsis thaliana. Plant J 1998,13:867–876.
15. Dekker J, Rippe K, Dekker M, Kleckner N: Capturing chromosomeconformation. Science 2002, 295:1306–1311.
16. De Wit E, De Laat W: A decade of 3C technologies: insights into nuclearorganization. Genes Dev 2012, 26:11–24.
17. Zhao Z, Tavoosidana G, Sjölinder M, Göndör A, Mariano P, Wang S, KanduriC, Lezcano M, Sandhu KS, Singh U, Pant V, Tiwari V, Kurukuti S, Ohlsson R:Circular chromosome conformation capture (4C) uncovers extensivenetworks of epigenetically regulated intra- and interchromosomalinteractions. Nat Genet 2006, 38:1341–1347.
18. Lieberman-Aiden E, Van Berkum NL, Williams L, Imakaev M, Ragoczy T, TellingA, Amit I, Lajoie BR, Sabo PJ, Dorschner MO, Sandstrom R, Bernstein B, BenderMA, Groudine M, Gnirke A, Stamatoyannopoulos J, Mirny LA, Lander ES, DekkerJ: Comprehensive mapping of long-range interactions reveals foldingprinciples of the human genome. Science 2009, 326:289–293.
19. Louwers M, Bader R, Haring M, Van Driel R, De Laat W, Stam M: Tissue- andexpression level-specific chromatin looping at maize b1 epialleles. PlantCell 2009, 21:832–842.
20. Crevillen P, Sonmez C, Wu Z, Dean C: A gene loop containing the floralrepressor FLC is disrupted in the early phase of vernalization. EMBO J2012, 32:140–148.
21. Moissiard G, Cokus SJ, Cary J, Feng S, Billi AC, Stroud H, Husmann D, Zhan Y,Lajoie BR, McCord RP, Hale CJ, Feng W, Michaels SD, Frand AR, Pellegrini M,Dekker J, Kim JK, Jacobsen S: MORC family ATPases required forheterochromatin condensation and gene silencing. Science 2012,336:1448–1451.
22. Sexton T, Yaffe E, Kenigsberg E, Bantignies F, Leblanc B, Hoichman M,Parrinello H, Tanay A, Cavalli G: Three-dimensional folding and functionalorganization principles of the Drosophila genome. Cell 2012, 148:458–472.
23. Krzywinski M, Schein J, Birol I, Connors J, Gascoyne R, Horsman D, Jones SJ,Marra MA: Circos: an information aesthetic for comparative genomics.Genome Res 2009, 19:1639–1645.
24. Splinter E, de Wit E, van de Werken HJG, Klous P, De Laat W: Determininglong-range chromatin interactions for selected genomic sites using 4C-seqtechnology: from fixation to computation. Methods 2012, 58:221–230.
25. Hou H, Zhou Z, Wang Y, Wang J, Kallgren SP, Kurchuk T, Miller EA, Chang F,Jia S: Csi1 links centromeres to the nuclear envelope for centromereclustering. J Cell Biol 2012, 199:735–744.
26. de Nooijer S, Wellink J, Mulder B, Bisseling T: Non-specific interactions aresufficient to explain the position of heterochromatic chromocenters andnucleoli in interphase nuclei. Nucleic Acids Res 2009, 37:3558–3568.
27. Fransz P, De Jong JH, Lysak M, Castiglione MR, Schubert I: Interphasechromosomes in Arabidopsis are organized as well definedchromocenters from which euchromatin loops emanate. Proc Natl AcadSci U S A 2002, 99:14584–14589.
28. Fang Y, Spector DL: Centromere positioning and dynamics in livingArabidopsis plants. Mol Biol Cell 2005, 16:5710–5718.
29. Gheldof N, Tabuchi TM, Dekker J: The active FMR1 promoter is associatedwith a large domain of altered chromatin conformation with embeddedlocal histone modifications. Proc Natl Acad Sci U S A 2006,103:12463–12468.
30. Tolhuis B, Blom M, Kerkhoven RM, Pagie L, Teunissen H, Nieuwland M,Simonis M, De Laat W, van Lohuizen M, van Steensel B: Interactions amongPolycomb domains are guided by chromosome architecture. PLoS Genet2011, 7:e1001343.
31. Luo C, Sidote DJ, Zhang Y, Kerstetter RA, Michael TP, Lam E: Integrativeanalysis of chromatin states in Arabidopsis identified potential regulatorymechanisms for natural antisense transcript production. Plant J 2012,73:77–90.
32. Stroud H, Greenberg MVC, Feng S, Bernatavichute YV, Jacobsen SE:Comprehensive analysis of silencing mutants reveals complex regulationof the Arabidopsis methylome. Cell 2013, 152:352–364.
33. Subramanian A, Tamayo P, Mootha VK, Mukherjee S, Ebert BL, Gillette MA,Paulovich A, Pomeroy SL, Golub TR, Lander ES, Mesirov JP: Gene setenrichment analysis: a knowledge-based approach for interpretinggenome-wide expression profiles. Proc Natl Acad Sci U S A 2005,102:15545–15550.
34. La Bastide DM, Huang E, Spiegel L, Gnoj L, Tabata S, Kaneko T, Nakamura Y,Kotani H, Kato T, Asamizu E, Miyajima N, Sasamoto S, Kimura T, Hosouchi T,Kawashima K, Kohara M, Matsumoto M, Matsuno A, Muraki A, Nakayama S,Nakazaki N, Naruo K, Okumura S, Shinpo S, Takeuchi C, Wada T, WatanabeA, Yamada M, Yasuda M, Sato S, et al: Sequence and analysis ofchromosome 5 of the plant Arabidopsis thaliana. Nature 2000,408:823–826.
35. Maul GG, Deaven L: Quantitative determination of nuclear porecomplexes in cycling cells with differing DNA content. J Cell Biol 1977,73:748–760.
36. Schubert V, Berr A, Meister A: Interphase chromatin organisation inArabidopsis nuclei: constraints versus randomness. Chromosoma 2012,121:369–387.
37. Jin QW, Fuchs J, Loidl J: Centromere clustering is a major determinant ofyeast interphase nuclear organization. J Cell Sci 2000, 113:1903–1912.
38. Duan Z, Andronescu M, Schutz K, Mcilwain S, Kim YJ, Lee C, Shendure J,Fields S, Blau CA, Noble WS: A three-dimensional model of the yeastgenome. Nature 2010, 465:363–367.
39. Sanyal A, Baù D, Marti-Renom MA, Dekker J: Chromatin globules: acommon motif of higher order chromosome structure? Curr Opin Cell Biol2011, 23:325–331.
40. Armstrong SJ, Franklin FC, Jones GH: Nucleolus-associated telomereclustering and pairing precede meiotic chromosome synapsis inArabidopsis thaliana. J Cell Sci 2001, 114:4207–4217.
41. Watanabe K, Pecinka A, Meister A, Schubert I, Lam E: DNA hypomethylationreduces homologous pairing of inserted tandem repeat arrays insomatic nuclei of Arabidopsis thaliana. Plant J 2005, 44:531–540.
42. Wolfgruber TK, Sharma A, Schneider KL, Albert PS, Koo D-H, Shi J, Gao Z,Han F, Lee H, Xu R, Allison J, Birchler JA, Jiang J, Dawe RK, Presting GG: Maizecentromere structure and evolution: sequence analysis of centromeres 2and 5 reveals dynamic loci shaped primarily by retrotransposons. PLoSGenet 2009, 5:e1000743.
43. Nagaki K, Song J, Stupar RM, Parokonny AS, Yuan Q, Ouyang S, Liu J,Hsiao J, Jones KM, Dawe RK, Buell CR, Jiang J: Molecular and cytologicalanalyses of large tracks of centromeric DNA reveal the structure andevolutionary dynamics of maize centromeres. Genetics 2003,163:759–770.
44. Henikoff S: The centromere paradox: stable inheritance with rapidlyevolving DNA. Science 2001, 293:1098–1102.
45. Berr A, Pecinka A, Meister A, Kreth G, Fuchs J, Blattner FR, Lysak MA,Schubert I: Chromosome arrangement and nuclear architecture but notcentromeric sequences are conserved between Arabidopsis thaliana andArabidopsis lyrata. Plant J 2006, 48:771–783.
46. Nagaki K, Talbert PB, Zhong CX, Dawe RK, Henikoff S, Jiang J: Chromatinimmunoprecipitation reveals that the 180-bp satellite repeat is the keyfunctional DNA element of Arabidopsis thaliana centromeres. Genetics2003, 163:1221–1225.
47. Shibata F: Differential localization of the centromere-specific proteins inthe major centromeric satellite of Arabidopsis thaliana. J Cell Sci 2004,117:2963–2970.
48. Huala E, Dickerman AW, Garcia-Hernandez M, Weems D, Reiser L, LaFond F,Hanley D, Kiphart D, Zhuang M, Huang W, Mueller LA, Bhattacharyya D,Bhaya D, Sobral BW, Beavis W, Meinke DW, Town CD, Somerville C, Rhee SY:The Arabidopsis Information Resource (TAIR): a comprehensive databaseand web-based information retrieval, analysis, and visualization systemfor a model plant. Nucleic Acids Res 2001, 29:102–105.
49. Langmead B, Trapnell C, Pop M, Salzberg SL: Ultrafast and memory-efficientalignment of short DNA sequences to the human genome. Genome Biol2009, 10:R25.
50. Schmid MW, Schmidt A, Klostermeier UC, Barann M, Rosenstiel P,Grossniklaus U: A powerful method for transcriptional profiling of specificcell types in eukaryotes: laser-assisted microdissection and RNAsequencing. PLoS ONE 2012, 7:e29685.
51. Edgar R, Domrachev M, Lash AE: Gene Expression Omnibus: NCBI geneexpression and hybridization array data repository. Nucleic Acids Res 2002,30:207–10.

Grob et al. Genome Biology 2013, 14:R129 Page 19 of 19http://genomebiology.com/2013/14/11/R129
52. Lamesch P, Berardini TZ, Li D, Swarbreck D, Wilks C, Sasidharan R, Muller R,Dreher K, Alexander DL, Garcia-Hernandez M, Karthikeyan AS, Lee CH, NelsonWD, Ploetz L, Singh S, Wensel A, Huala E: The Arabidopsis InformationResource (TAIR): improved gene annotation and new tools. NucleicAcids Res 2011, 40:D1202–D1210.
53. Development Core Team R: R: A language and environment for statisticalcomputing. Vienna, Austria: R Foundation for Statistical Computing; 2008.http://www.R-project.org. ISBN 3-900051-07-0.
doi:10.1186/gb-2013-14-11-r129Cite this article as: Grob et al.: Characterization of chromosomalarchitecture in Arabidopsis by chromosome conformation capture.Genome Biology 2013 14:R129.
Submit your next manuscript to BioMed Centraland take full advantage of:
• Convenient online submission
• Thorough peer review
• No space constraints or color figure charges
• Immediate publication on acceptance
• Inclusion in PubMed, CAS, Scopus and Google Scholar
• Research which is freely available for redistribution
Submit your manuscript at www.biomedcentral.com/submit