characterization of carbonate fraction of the atlantic bluefin tuna … · 2019-07-18 · bluefin...
TRANSCRIPT
Submitted 11 December 2018Accepted 23 May 2019Published 18 July 2019
Corresponding authorPatricia L. Luque, [email protected]
Academic editorMatt Sponheimer
Additional Information andDeclarations can be found onpage 12
DOI 10.7717/peerj.7176
Copyright2019 Luque et al.
Distributed underCreative Commons CC-BY 4.0
OPEN ACCESS
Characterization of carbonate fraction ofthe Atlantic bluefin tuna fin spine bonematrix for stable isotope analysisPatricia L. Luque1, María Belén Sanchez-Ilárduya2, Alfredo Sarmiento3,Hilario Murua1 and Haritz Arrizabalaga1
1Marine Research Division, AZTI Tecnalia, Pasaia, Guipuzcoa, Spain2Advanced Research Facilities (SGIker)/ X-ray Photoelectron Spectroscopy Laboratory (XPS)/Faculty ofScience and Technology, University of the Basque Country (UPV/EHU), Leioa, Bizcaia, Spain
3Advanced Research Facilities (Sgiker) / Coupled Multispectroscopy Singular Laboratory (Raman-LASPEA)/Faculty of Medicine and Odontology, University of the Basque Country (UPV/EHU), Leioa, Bizcaia, Spain
ABSTRACTThe mineral component of fish otoliths (ear bones), which is aragonitic calciumcarbonate (CaCO3), makes this structure the preferred sample choice for measuringbiological carbon and oxygen-stable isotopes in order to address fundamental questionsin fish ecology and fisheries science. The main drawback is that the removal of otolithsrequires sacrificing the specimen, which is particularly impractical for endangeredand commercially valuable species such as Atlantic bluefin tuna (Thunnus thynnus)(ABFT). This study explores the suitability of using the first dorsal fin spine boneof ABFT as a non-lethal alternative to otolith analysis or as a complementary hardstructure. The fin spines of freshly caught ABFT were collected to identify carbonateions within the mineral matrix (i.e., hydroxyapatite) and to determine the nature of thecarbonate substitution within the crystal lattice, knowledge which is crucial for correctmeasurement and ecological interpretation of oxygen and carbon stable isotopes ofcarbonates. Fin spine sections were analyzed via X-ray Photoelectron Spectroscopy(XPS), Raman Spectroscopy, and Fourier Transform InfraRed (FTIR). The XPS surveyanalysis showed signals of Ca, O, and P (three compositional elements that comprisehydroxyapatite). The Raman and FTIR techniques showed evidence of carbonate ionswithin the hydroxyapatite matrix, with the IR spectra being the most powerful foridentifying the type B carbonate substitution as shown by the carbonate band in thev2 CO3
2− domain at ∼872 cm−1. The results of this study confirmed the presenceof carbonate ions within the mineral matrix of the fin spine bone of ABFT, showingthe feasibility of using this calcified structure for analysis of stable isotopes. Overall,our findings will facilitate new approaches to safeguarding commercially valuable andendangered/protected fish species and will open new research avenues to improvefisheries management and species conservation strategies.
Subjects Aquaculture, Fisheries and Fish Science, EcologyKeywords Fin spine, Inorganic matrix, Raman spectroscopy, Thunnus thynnus, XPS, FTIR,Isotope analysis
How to cite this article Luque PL, Sanchez-Ilárduya MB, Sarmiento A, Murua H, Arrizabalaga H. 2019. Characterization of carbonatefraction of the Atlantic bluefin tuna fin spine bone matrix for stable isotope analysis. PeerJ 7:e7176 http://doi.org/10.7717/peerj.7176

INTRODUCTIONUse of otoliths (ear bones) found in teleost fish species is preferred by fishery biologistsas they provide time-calibrated archives of isotopic information (δ13C and δ18O ) withinthe mineral matrix that can be used to address fundamental questions in fish ecologyand fisheries science related to migration, habitat use (Campana, 2005; Elsdon et al.,2008; McMahon, Berumen & Thorrold, 2012) and stock structure (Patterson, Mcbride &Julien, 2004). The premise of this approach is that as these biogenic structures grow,they precipitate material (e.g., stable isotopes) that are naturally incorporated into theirmineral matrix (aragonite, CaCO3) in direct proportion to the concentration at whichthey occur in their habitat. As the fish grow, they record the chemistry of their naturalhabitat as well as other environmental parameters (e.g., temperature, salinity) (Lin etal., 2007; Miller, 2009), thereby linking the hard structure chronology with the chemicalrecord of the fish’s life. This enables a retrospective description to be produced of theenvironmental history of individual fish over ecological time scales (e.g., Walther &Limburg, 2012; Rooker et al., 2014). However, otolith removal from live specimens requiresspecimen sacrifice, which may be forbidden in the case of endangered and/or protected fishspecies. In addition, it is not practical for commercially valuable species such as Atlanticbluefin tuna since it greatly affects the appearance of a fish, diminishing its market value.Alternative hard tissues such as the first dorsal fin spine bone may provide valuable andcomplementary chemical information, so sampling these tissues represents a non-lethal,minimally invasive sampling method (Zymonas & McMahon, 2006). This makes using finspines particularly attractive for fish species that cannot be sacrificed for their otolithssuch as endangered (threatened) fish or those of management concern (e.g., protected, orcommercially valuable whole fish). The term ‘‘fin spines’’ is applied to the anterior-moststructural components of fins that are unsegmented, rigid, and more calcified than thesoft, segmented ‘‘fin rays’’ (Tzadik et al., 2017). Similar to other bones of the endoskeleton,fin spines are assumed to be composed of three main constituents of bone: organic matter(mainly type I collagen), the mineral fraction being composed of hydroxyapatite (HA), andwater (10%wt.) (e.g., Koch, 2007; Rey et al., 2009; Ugarte et al., 2011). As such, the mineralcomponent of bone, Hydroxyapatite (Ca10(PO4)6(OH)2), is a type of calcium phosphateapatite, which is deposited onto collagen fibrils, providing strength to the bone structureand also serving as an ion reservoir (LeGeros, 1981). In biological tissues, thismineralmatrixis complex, rarely stoichiometric, and usually calcium-deficient. It accommodates chemicalsubstitution relatively easily, incorporating a wide variety of relatively small amounts ofother substituent atoms or groups taken up from the surrounding body fluids duringbone metabolism (Mathew & Tagaki, 2001; Matsunaga et al., 2010; Figueiredo, Gamelas &Martins, 2012). As such, the HA structure in bone may contain carbonate CO3
2− ionsthat substitute either for phosphate (B-type HA) or hydroxyl (A type-HA) groups withinthe crystal lattice (LeGeros, 1991; Rey et al., 2009). Although the B-type is the preferentialCO3
2− substitution found in the bone of a variety of species (Landi et al., 2003; Murugan,Ramakrishna & Panduranga, 2006), this substitution remains unexplored specifically inthe fin spine bone of teleost species. Although these levels of substitution are small, it
Luque et al. (2019), PeerJ, DOI 10.7717/peerj.7176 2/15

has been established that these elements are associated with the properties of biologicalapatite and play a major role in the biochemistry of bone (Ibrahim, Mostafa & Korowash,2011). However, our lack of understanding of metabolic pathways, routes of ion uptake,and differential abilities of structures to incorporate elements and stable isotopes shouldbe taken into consideration when using these structures (Campana, 1999). The generalassumption that the mineral content of fin spine bone (i.e., hydroxyapatite) is identical toother bones needs further exploration, and a thorough understanding of species-specificskeletal biology may make interpretation of these isotopic records possible. For correctmeasurement and reliable biological interpretation of the isotopic signal of carbonatescontained in the fin spine bone, the required first step is to assess whether or not thiscarbonate substitution is regular within the HA matrix. The main goal of this study is tocharacterize the carbonate fraction in the fin spine bone and determine the level and natureof the carbonate substitution within the calcium phosphate apatite, which is the mainmineral component of the fin spine bone. This is critical to analyzing and interpreting thecarbon and oxygen stable isotope signature retained within the mineral fraction of the finspine bone. We used Fourier transform Infrared (FTIR) and Raman spectroscopy for thebulk analysis and complemented this investigation using X-ray photoelectron spectroscopy(XPS) as a highly sensitive surface technique.
MATERIALS & METHODSSample collectionIn this study, the first spiniform ray of the first dorsal fin (fin spine hereafter) was collectedfrom fresh Atlantic bluefin tuna caught by commercial bait boats in the Bay of Biscay(North-east Atlantic Ocean). The sample set comprised four individual fin spine samplescollected from young specimens of 81, 101, 114, and 128 cm straight fork lengths (SFL).
Fin spine bone preparationFin spine preparation and sectioning procedures were performed following the proceduresdescribed by Luque et al. (2014). Once the fin spine was removed, the remaining skin tissuewas carefully removed with a sharp scalpel, avoiding any damage to the surface of the baseof the fin spine. Then, before sectioning, individual fin spines were washed with Milli-Qwater and air dried at room temperature. A cross-section of ∼1. five mm thickness wassectioned at a point 1.5 times the condyle base width (1.5Dmax) (Figs. 1A and 1B) withan Isomet low-speed diamond saw (Buehler, Lake Bluff, IL, USA). Additionally, fin spinesections underwent an extra cleaning cycle, by placing them into individual one.five mLvials with ultrapure deionized water (Milli-Q, 18.2 Mohm. cm-3) and using an ultrasonicwater bath for 10 min to remove excess organic tissue. Finally, the samples were rinsedagain with ultra-pure water and placed in new vials, then allowed to dry in a class 100laminar-flow hood for 48 h.
X-ray Photoelectron Spectroscopy (XPS)XPS experiments were recorded with a SPECS (Berlin, Germany) system equipped with aPhoibos 150 1D-DLD analyzer and using monochromatic AlK α radiation (1486.7 eV, 300
Luque et al. (2019), PeerJ, DOI 10.7717/peerj.7176 3/15
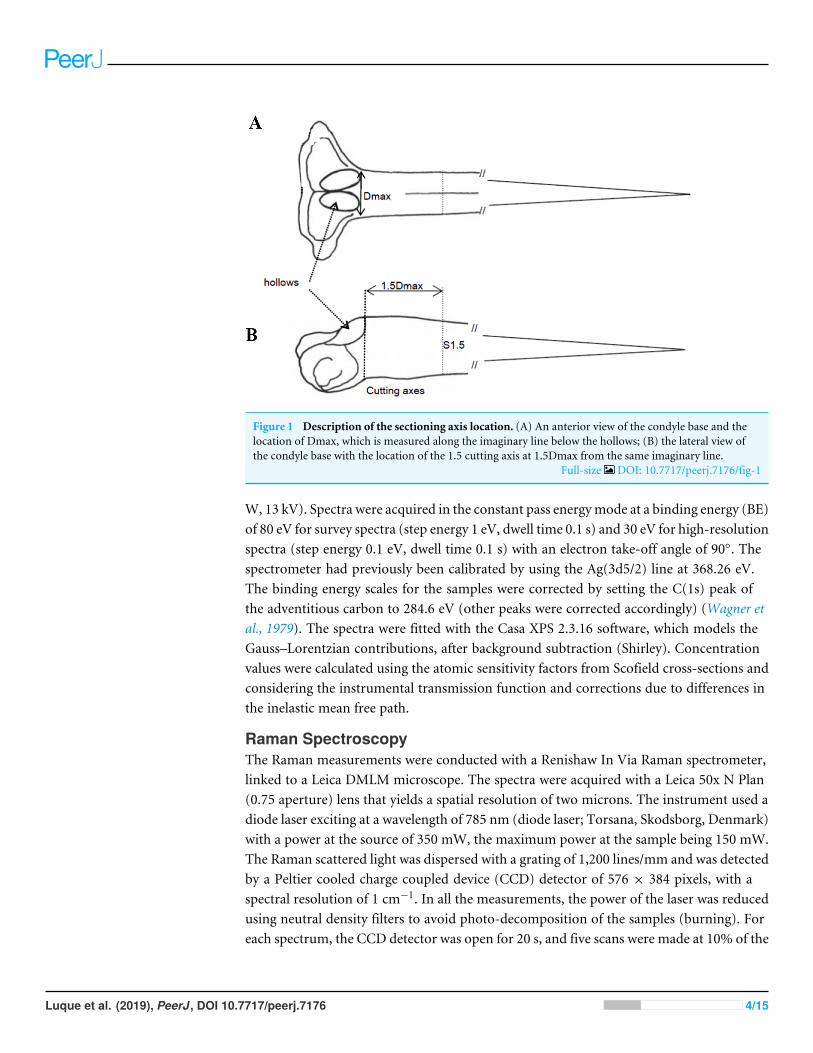
Figure 1 Description of the sectioning axis location. (A) An anterior view of the condyle base and thelocation of Dmax, which is measured along the imaginary line below the hollows; (B) the lateral view ofthe condyle base with the location of the 1.5 cutting axis at 1.5Dmax from the same imaginary line.
Full-size DOI: 10.7717/peerj.7176/fig-1
W, 13 kV). Spectra were acquired in the constant pass energymode at a binding energy (BE)of 80 eV for survey spectra (step energy 1 eV, dwell time 0.1 s) and 30 eV for high-resolutionspectra (step energy 0.1 eV, dwell time 0.1 s) with an electron take-off angle of 90◦. Thespectrometer had previously been calibrated by using the Ag(3d5/2) line at 368.26 eV.The binding energy scales for the samples were corrected by setting the C(1s) peak ofthe adventitious carbon to 284.6 eV (other peaks were corrected accordingly) (Wagner etal., 1979). The spectra were fitted with the Casa XPS 2.3.16 software, which models theGauss–Lorentzian contributions, after background subtraction (Shirley). Concentrationvalues were calculated using the atomic sensitivity factors from Scofield cross-sections andconsidering the instrumental transmission function and corrections due to differences inthe inelastic mean free path.
Raman SpectroscopyThe Raman measurements were conducted with a Renishaw In Via Raman spectrometer,linked to a Leica DMLM microscope. The spectra were acquired with a Leica 50x N Plan(0.75 aperture) lens that yields a spatial resolution of two microns. The instrument used adiode laser exciting at a wavelength of 785 nm (diode laser; Torsana, Skodsborg, Denmark)with a power at the source of 350 mW, the maximum power at the sample being 150 mW.The Raman scattered light was dispersed with a grating of 1,200 lines/mm and was detectedby a Peltier cooled charge coupled device (CCD) detector of 576 × 384 pixels, with aspectral resolution of 1 cm−1. In all the measurements, the power of the laser was reducedusing neutral density filters to avoid photo-decomposition of the samples (burning). Foreach spectrum, the CCD detector was open for 20 s, and five scans were made at 10% of the
Luque et al. (2019), PeerJ, DOI 10.7717/peerj.7176 4/15
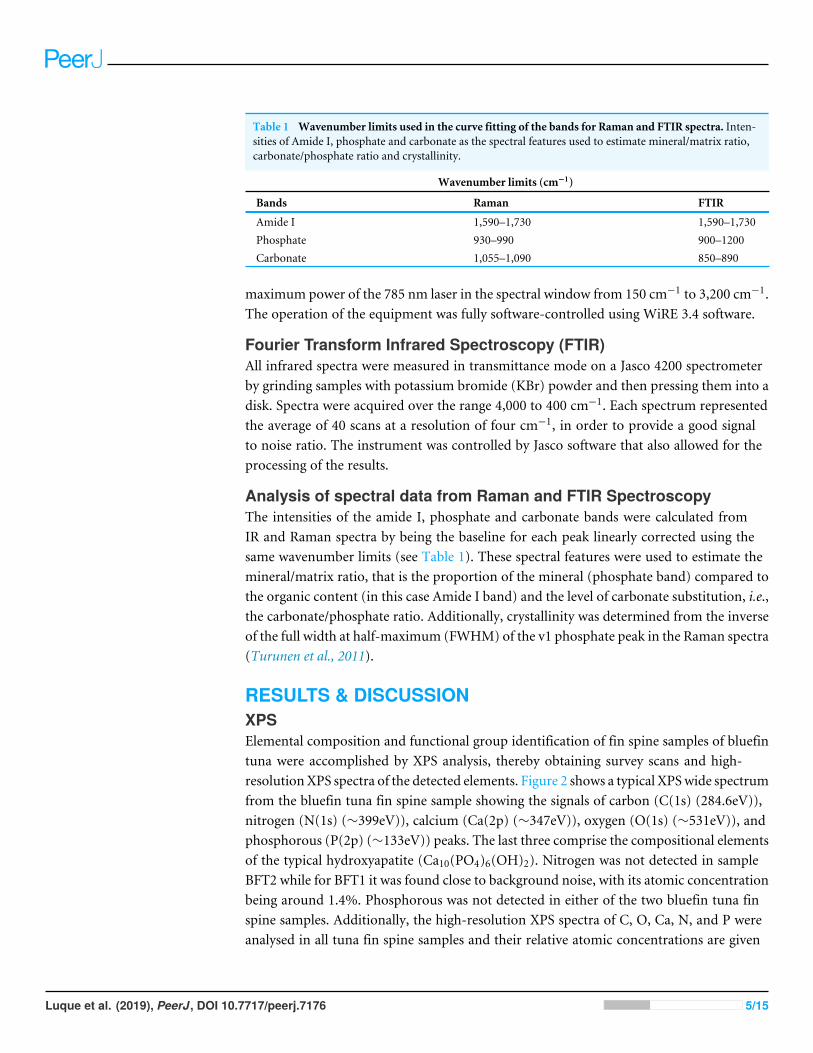
Table 1 Wavenumber limits used in the curve fitting of the bands for Raman and FTIR spectra. Inten-sities of Amide I, phosphate and carbonate as the spectral features used to estimate mineral/matrix ratio,carbonate/phosphate ratio and crystallinity.
Wavenumber limits (cm−1)
Bands Raman FTIR
Amide I 1,590–1,730 1,590–1,730Phosphate 930–990 900–1200Carbonate 1,055–1,090 850–890
maximum power of the 785 nm laser in the spectral window from 150 cm−1 to 3,200 cm−1.The operation of the equipment was fully software-controlled using WiRE 3.4 software.
Fourier Transform Infrared Spectroscopy (FTIR)All infrared spectra were measured in transmittance mode on a Jasco 4200 spectrometerby grinding samples with potassium bromide (KBr) powder and then pressing them into adisk. Spectra were acquired over the range 4,000 to 400 cm−1. Each spectrum representedthe average of 40 scans at a resolution of four cm−1, in order to provide a good signalto noise ratio. The instrument was controlled by Jasco software that also allowed for theprocessing of the results.
Analysis of spectral data from Raman and FTIR SpectroscopyThe intensities of the amide I, phosphate and carbonate bands were calculated fromIR and Raman spectra by being the baseline for each peak linearly corrected using thesame wavenumber limits (see Table 1). These spectral features were used to estimate themineral/matrix ratio, that is the proportion of the mineral (phosphate band) compared tothe organic content (in this case Amide I band) and the level of carbonate substitution, i.e.,the carbonate/phosphate ratio. Additionally, crystallinity was determined from the inverseof the full width at half-maximum (FWHM) of the v1 phosphate peak in the Raman spectra(Turunen et al., 2011).
RESULTS & DISCUSSIONXPSElemental composition and functional group identification of fin spine samples of bluefintuna were accomplished by XPS analysis, thereby obtaining survey scans and high-resolutionXPS spectra of the detected elements. Figure 2 shows a typical XPSwide spectrumfrom the bluefin tuna fin spine sample showing the signals of carbon (C(1s) (284.6eV)),nitrogen (N(1s) (∼399eV)), calcium (Ca(2p) (∼347eV)), oxygen (O(1s) (∼531eV)), andphosphorous (P(2p) (∼133eV)) peaks. The last three comprise the compositional elementsof the typical hydroxyapatite (Ca10(PO4)6(OH)2). Nitrogen was not detected in sampleBFT2 while for BFT1 it was found close to background noise, with its atomic concentrationbeing around 1.4%. Phosphorous was not detected in either of the two bluefin tuna finspine samples. Additionally, the high-resolution XPS spectra of C, O, Ca, N, and P wereanalysed in all tuna fin spine samples and their relative atomic concentrations are given
Luque et al. (2019), PeerJ, DOI 10.7717/peerj.7176 5/15
Figure 2 XPS survey spectrum of fin spine (BFT3) showing signals for Ca, P, O (three compositionalelements of calcium phosphate ‘‘hydroxyapatite’’).
Full-size DOI: 10.7717/peerj.7176/fig-2
in Table 2. Using sample BFT3 as an example, the high-resolution Ca(2p) core spectrumsplits into two peaks identified as Ca(2p3/2) and Ca(2p1/2) due to spin–orbit coupling. Themain peak Ca(2p3/2) can be observed at 346.6 eV, while Ca(2p1/2) appears at 350.2 eV. Inthe same way, the P(2p) core spectrum splits into two peaks, the main peak P(2p3/2) at132.4 eV and P(2p1/2) at 133.4 eV, in good agreement with phosphate type compounds(Lu et al., 2000; Rey et al., 2009). Meanwhile, the high-resolution O(1s) spectrum was fittedwith only one component detected at 530.8 eV. Similar spectra for Ca(2p) and O(1s) wereobtained from samples BFT1, BFT2 and BFT4 and for P(2p) from sample BFT4. Twocontributions could be distinguished for the high-resolution spectra of C(1s) at 284.6eV(main peak) and 287.5 eV. The first one may have been associated with the C-C/C-Hbonding. The other peak at 287.5 eV can be attributed to a bonding between carbon andoxygen. The C(1s) spectra observed for the other samples were quite similar, with themain contribution at 284.6 eV. Nitrogen coming from the collagen protein source of bonewas also detected in three fin spine samples at binding energies around 399 eV. Regardingcomposition, all fin tuna spine samples showed high levels of carbon. Overall, the presenceof carbon and nitrogen and the high proportion of oxygen (O/Ca and O/P ratios werehigher than expected in hydroxyapatite) in all tuna fin spines analyzed in comparison withthe synthetic HA (Lu et al., 2000) is certainly evidence of the presence of collagen Type I,an organic matrix that makes up the protein component of bone and is assimilated fromthe carbon and nitrogen contained in the protein constituents of a consumer’s diet (Koch,2007; Rey et al., 2009). Because of the high amount of carbon detected due to the organicmatrix of the fin spine bone (>80% in % At rel. in samples BFT1 and BFT2, and ∼60%in BFT3 and BFT4), and considering that XPS is a surface-sensitive technique, the relativeatomic percentages of the HA elements such as Ca and P were quite low, 5.9% and 4%,
Luque et al. (2019), PeerJ, DOI 10.7717/peerj.7176 6/15

Table 2 Spectral features of the detected elements in the different samples. Binding energy (BE), fullwidth at half maximum (FWHM), percentage of relative atomic concentration (% At. rel.), total relativeatomic percentage of the element (% At. rel. Total).
Fin spinesample
Element Id. BE (eV) FWHM %At. rel. % At. rel.(Total)
C-C, C-H 284.6 2.1 72.3C 1s 286.9 2.1 5.7C (1s)
C 1s 288.5 2.1 4.3
82.2
O (1s) O 1s 530.6 3.0 15.5 15.5Ca 2p (3/2) 346.6 2.0 0.6
Ca (2p)Ca 2p (1/2) 350.0 2.0 0.3
0.9
BFT1
N (1s) N 1s 399.0 1.9 1.4 1.4C-C, C-H 284.6 2.2 79.4
C (1s)C 1s 288.2 2.1 5.9
85.2
O (1s) O 1s 531.8 2.9 12.5 12.5Ca 2p (3/2) 347.3 2.2 1.6
BFT2
Ca (2p)Ca 2p (1/2) 350.9 2.2 0.8
2.3
C-C, C-H 284.6 2.7 48.7C (1s)
C 1s 287.5 2.7 9.257.9
O (1s) O 1s 530.8 2.8 24.6 24.6Ca 2p (3/2) 346.6 2.3 4.0
Ca (2p)Ca 2p (1/2) 350.2 2.4 2.0
5.9
N (1s) N 1s 398.8 2.3 7.6 7.6P 2p (3/2) 132.4 2.2 2.6
BFT3
P (2p)P 2p (1/2) 133.4 2.2 1.3
4.0
C-C, C-H 284.6 2.6 54.0C (1s)
C 1s 287.4 2.6 10.965.0
O (1s) O 1s 530.6 3.0 23.1 23.1Ca 2p (3/2) 346.5 2.0 1.9
Ca (2p)Ca 2p (1/2) 350.1 2.1 1.0
2.9
N (1s) N 1s 399.0 2.3 7.1 7.1P 2p (3/2) 133.0 2.1 1.3
BFT4
P (2p)P 2p (1/2) 134.0 2.1 0.6
1.9
respectively, in the case of BFT3. Moreover, Ca and P concentrations were still lower ornot detected in the other three samples, as can be seen in Table 2.Based on the concentrations found for Ca and P, a stoichiometric correspondence to
syntheticHACa5(PO4)3(OH) canbe concluded. For samples BFT3 and 4, the observedCa/Pratios were 1.50 and 1.53, respectively, close to the nominal value of 1.67 in hydroxyapatite.These slightly low values for the Ca/P ratio have previously been reported (Lu et al., 2000).Additionally, carbonate is commonly found in biological minerals (LeGeros, 1981) and is abasic component of bone that might interfere with the biological interpretation of the data,particularly important for isotopic signals. In the present study, the presence of carbonate-type carbon could not be demonstrated by XPS in any of the fin spine samples. This wasprobably due to the high amount of carbon from the organic fraction that prevented
Luque et al. (2019), PeerJ, DOI 10.7717/peerj.7176 7/15
detection of the low contribution of the carbonate in the C(1s) spectrum, referenced ataround 289 eV (Liu et al., 2018). Future work should be devoted to pre-treating the finspine bone samples with chemicals (e.g., hydrazine) commonly used for removing organicmaterial and/or contamination, in order to eliminate competing sources of C and O stableisotopes associated with organic material and secondary carbonates (Snoeck & Pellegrini,2015; Pellegrini & Snoeck, 2016).
Raman and FTIR spectroscopyMineralogical and compositional analysis of the fin spine bone samples was also performedby means of Raman and FTIR spectroscopy. Both techniques revealed that the spectrawere very similar to the spectrum of human bone (Fig. 3) confirming that the mineralfraction of tuna fin spine bone mainly consisted of hydroxyapatite. Overall, the mostintense bands arise from the mineral fraction, in accordance with its larger proportion inthe composite. Most of the absorptions from phosphate vibrations were clearly observedin the spectra of fin spine. Mineral bands were more conspicuous in Raman spectra than inIR spectra, whereas organic signatures appeared stronger in IR spectra. Relative intensitieswere slightly different, but most matrices were distinguished in both types of spectra. Thus,detailed spectral assignments for a fin spine bone included vibrationalmodes for phosphate,carbonate and the organic matrix bands of the amides I, II, III and C-H stretch (Table 3).The main differences were found in the phenylalanine band that is weak in the Ramanspectrum (1,004–1,005 cm−1) or absent in the IR spectrum, whereas the amide II in the IRspectrum (1,540–1,580 cm−1) was absent in the Raman spectrum (Table 3). In addition,Table 4 displays the main compositional parameters for each fin spine sample obtainedfrom peak intensities in the IR and Raman spectra. The mineral/matrix ratio obtainedin the IR spectra seemed to show higher values in larger specimens (i.e., in body size)whereas no clear pattern was observed in the Raman spectra. Considering that the numberof analysed specimens was too low to carry out comparative and correlation analysis, theobserved trends should be taken with caution. Turunen and colleagues (2011) stated thatthis ratio describes the degree of mineralization in the bone and average increases duringmaturation. As this is beyond the scope of this exploratory study, a deeper quantitativestudy using a larger sample size including immature and mature individuals is certainlynecessary to confirm this.
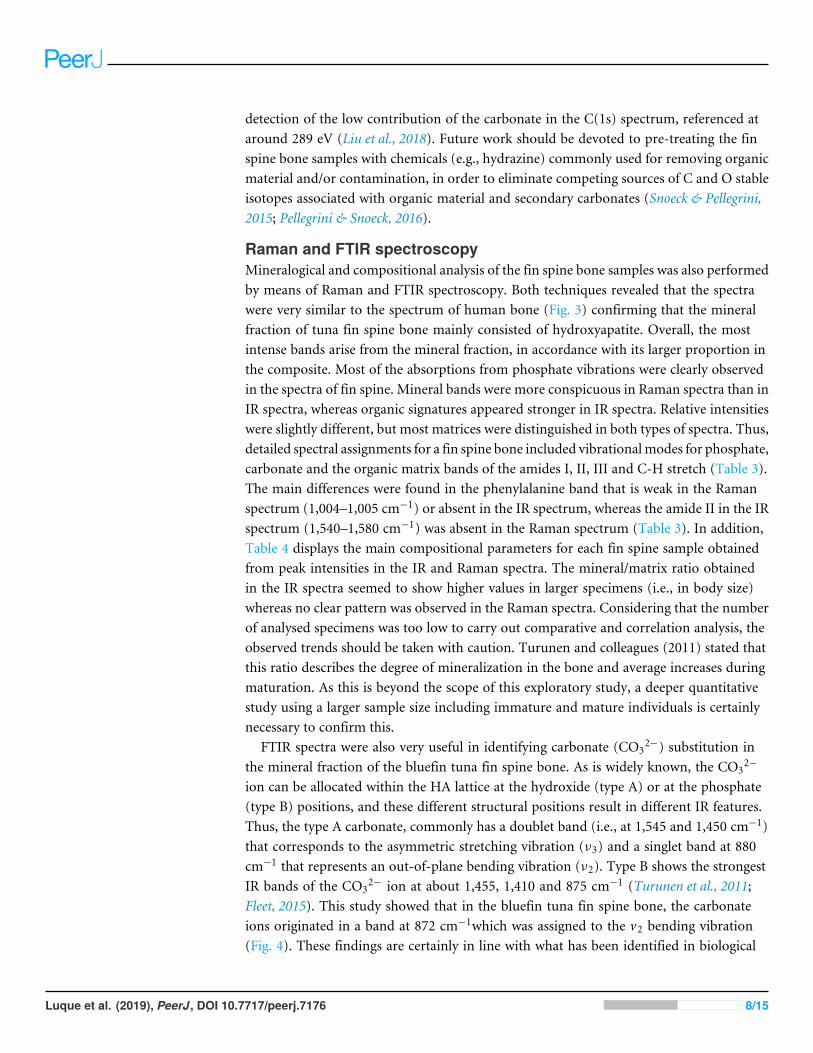
FTIR spectra were also very useful in identifying carbonate (CO32−) substitution in
the mineral fraction of the bluefin tuna fin spine bone. As is widely known, the CO32−
ion can be allocated within the HA lattice at the hydroxide (type A) or at the phosphate(type B) positions, and these different structural positions result in different IR features.Thus, the type A carbonate, commonly has a doublet band (i.e., at 1,545 and 1,450 cm−1)that corresponds to the asymmetric stretching vibration (ν3) and a singlet band at 880cm−1 that represents an out-of-plane bending vibration (ν2). Type B shows the strongestIR bands of the CO3
2− ion at about 1,455, 1,410 and 875 cm−1 (Turunen et al., 2011;Fleet, 2015). This study showed that in the bluefin tuna fin spine bone, the carbonateions originated in a band at 872 cm−1which was assigned to the v2 bending vibration(Fig. 4). These findings are certainly in line with what has been identified in biological
Luque et al. (2019), PeerJ, DOI 10.7717/peerj.7176 8/15

Figure 3 Raman spectra of bluefin fin spine bone and human bone measured in the same instrumentalconditions.
Full-size DOI: 10.7717/peerj.7176/fig-3
Table 3 Band assignments for the Raman and FTIR spectra of bluefin tuna fin spine bone (BFT3). Thebaseline for each peak was linearly corrected using the same wave numbers.
Assigment Raman band (cm −1) IR band (cm −1)
ν (O–H), ν (N-H) 3,434ν (C–H) 2,884, 2,936 2,958, 2,923, 2,847Amide I 1,672 1,660Amide II – 1,565δ(CH2), CH2 deformation 1,449 1,454ν3CO3
2 − – 1,416δ(CH2) – 1,337Amide III 1,241 1,243ν1CO3
2 − ν3PO43 − 1,075 1,110, 1,028
ν3PO43 − 1,030 –
ν(C–C) Phenylalanine 1,005 –ν(C–C) Collagen proline 852 –ν2CO3
2 – 872ν4 antisymmetric bending (OPO) – 602, 560ν4PO4
3 − 581 560ν2PO4
3 − 430–450 –
apatites as the band characteristic of type B carbonates (Figueiredo, Gamelas & Martins,2012). As a result of that, it was verified that the bluefin tuna fin spine bone resembledtype B carbonates. Moreover, the v3 mode (∼1,454, ∼1,416) was overlapped by strongorganic absorption bands. This finding should be taken with caution as it may lead to
Luque et al. (2019), PeerJ, DOI 10.7717/peerj.7176 9/15

Table 4 Values of compositional parameters for each fin spine obtained from peak intensities in Ra-man and FTIR spectra.
Parameters
Technique SampleID
Body length Mineral/Matrix(intensities)
Carbonate/Phosphate(intensities)
Crystallinity
Raman BFT1 128 cm 3.973 0.102 0.058BFT2 114cm 7.025 0.093 0.061BFT4 101cm 4.700 0.108 0.056
mean ±SD 5.93 ± 1.594 0.101 ± 0.008 0.058 ± 0.003FTIR BFT1 128 cm 2.945 0.077
BFT4 101cm 2.171 0.079BFT3 81cm 1.845 0.126
mean ±SD 2.32 ± 0.565 0.094 ± 0.028
misinterpretations of bone samples (Termine & Lundy, 1973). In the present study, thetype B carbonate substitution was not as clearly observed in the Raman spectra as in theIR spectra. The sharpest band at 1,070 cm−1 (ν1 CO3
2−) was very close to a componentof a phosphate band at 1,076 cm −1 (ν3 PO4
3−) which is commonly overlapped with theband at 1,110 cm−1 due to the anionic substitution of HPO4
2− (acidic phosphates), verylikely leading to misinterpretation of the spectra. The carbonate/phosphate ratio seemsto represent different phenomena in each analytical technique. In the present study, thecarbonate/phosphate ratios estimated from the Raman spectra were similar for the threeindividual bluefin tuna fin spine samples (mean 0.101 ± 0.008 SD). However, in the IRspectra, this ratio was slightly higher in the smallest and youngest specimen, BFT3 (81 cmSFL, aged two years old) (Table 4). Nevertheless, this result should be treated cautiously aswe only analyzed fin spine samples from juvenile tuna that were three years old and assumedto be immature. This parameter seems to be a good indicator of the bone turnover andremodeling activity of bone (Isaksson et al., 2010), which remarkably occurs at older ages(Luque et al., 2014) and in mature bluefin tunas, and is linked to the physiology of this fishin relation to its feeding, reproduction, migrating and growing characteristics (Santamariaet al., 2015). In addition, the crystallinity index was similar for BFT1 (128 cm SFL), BFT2(114 cm SFL), and BFT4 (101 cm SFL) with values of 0.058, 0.061, and 0.056, respectively(mean 0.058± 0.03 SD) which indicate a similar maturation state, as expected, consideringthat the three fin spines were collected from immature juvenile bluefin tuna that werethree years old. Nevertheless, it should be considered that such parameters (i.e., mineralmaturity and crystallinity) depend on several factors, not only age, but also nutrition andhealth condition (Figueiredo, Gamelas & Martins, 2012). Since it was beyond the scope ofthe present study, we suggest further spectroscopy analysis using larger sample sizes andincluding specimens of different maturity stages to confirm whether spectroscopic datamay provide a measure of the maturity of the crystal.
Luque et al. (2019), PeerJ, DOI 10.7717/peerj.7176 10/15
Figure 4 Spectral regions in the FTIR spectrum of bluefin tuna fin spine bone related to Type B car-bonate substitution.
Full-size DOI: 10.7717/peerj.7176/fig-4
CONCLUSIONSThe major contribution of this study is the confirmation that the mineral matrix (i.e.,the apatite calcium phosphate) of fin spine bone regularly showed carbonate ions thatsubstitute for phosphate (B-type) as carbonate ions were detected within all the ABFT finspines analyzed. As such, these findings, which are generalizable to other fish species, willallow analysis of the carbon and oxygen stable isotope within the mineral matrix, providingimportant ecological information on the environmental histories of fish, including stockmixing,movement and dispersal patterns etc. in areas where geographic differences in waterchemistry exist. The use of fin spines is advantageous as a non-lethal, minimally invasivesampling method. This makes using fin spines particularly promising for fish species thatcannot be sacrificed for their otoliths, such as endangered species (i.e., rare or threatenedspecies) or those of management concern (such as stock, protected, or commerciallyvaluable whole fish), which include ABFT, opening new research avenues to improvefisheries management and species conservation strategies. Regarding analytical techniques,Raman and FTIR seem to be more powerful than XPS in providing relevant informationon the carbonate environment and its preferential substitution within the HA lattice. Theresults indicate that caution is required when performing surface analysis as other skeletalcomponents, such as organic matter, probably affect the surface detection of inorganiccarbon from carbonate impurities, leading to misinterpretation of structure/functionrelationships. When studying the fin spine bone mineral fraction, it is recommended toremove the organic component to avoid any misdetection of components of interest.
Luque et al. (2019), PeerJ, DOI 10.7717/peerj.7176 11/15
ACKNOWLEDGEMENTSThe fin spine samples used in this work were collected by AZTI under the provision ofthe ICCAT Atlantic Wide Research Program for Bluefin Tuna (GBYP). The contents ofthe paper do not necessarily reflect the point of view of ICCAT or of the other funders.The manuscript benefited from helpful discussions with and technical support from Dr.Gorka Bidegain, Juan Carlos Raposo, Dr. Luis Bartolome, Dr. Olatz Zuloaga, ProfessorJuan Manuel Madariaga.
ADDITIONAL INFORMATION AND DECLARATIONS
FundingThis work is part of the SIFINS project that has received funding from the EuropeanUnion’s Horizon 2020 research and innovation programme under the Marie Sklodowska-Curie grant agreement No 753304. The funders had no role in study design, data collectionand analysis, decision to publish, or preparation of the manuscript.
Grant DisclosuresThe following grant information was disclosed by the authors:European Union’s Horizon 2020: No 753304.
Competing InterestsPatricia Lastra Luque, Hilario Murua and Haritz Arrizabalaga are employed by AZTITecnalia, Marine Research Division.
Author Contributions• Patricia L. Luque conceived and designed the experiments, analyzed the data, contributedreagents/materials/analysis tools, prepared figures and/or tables, authored or revieweddrafts of the paper, approved the final draft.
• María Belén Sanchez-Ilárduya and Alfredo Sarmiento performed the experiments,analyzed the data, contributed reagents/materials/analysis tools, prepared figures and/ortables, authored or reviewed drafts of the paper.
• Hilario Murua and Haritz Arrizabalaga authored or reviewed drafts of the paper,approved the final draft.
Animal EthicsThe following information was supplied relating to ethical approvals (i.e., approving bodyand any reference numbers):
AZTI facilities are licensed for collection of samples according to the Spanish legislation(RD1201/2005, royal law for the protection of animals used in scientific experiments).
There are no special ethical issues associated with this work. This study uses fish spinesamples collected from fish captured by commercial fisheries of Spain. However, all projectactivities are undertaken within the clear boundaries of national and EU legal frameworks,specifically those relating to animal welfare (i.e., Directive 2010/63/EU).
Luque et al. (2019), PeerJ, DOI 10.7717/peerj.7176 12/15

Data AvailabilityThe following information was supplied regarding data availability:
The raw data are available as Supplemental Files. The raw data show elementalcomposition and functional groups identification_ XPS data of BFT 1,2,3,4, FTIR spectraof BFT 1, 3 & 5 (wavenumber vs. %Transmitance), and Raman spectra of BFT 1, 2 &5 (Raman Shift vs. Intensity), respectively. Raw data were used to build the spectrumsprovided in Figs. 2–4.
Supplemental InformationSupplemental information for this article can be found online at http://dx.doi.org/10.7717/peerj.7176#supplemental-information.
REFERENCESCampana SE. 1999. Chemistry and composition of fish otoliths: pathways, mechanisms
and applications.Marine Ecology Progress Series 188:263–297DOI 10.3354/meps188263.
Campana SE. 2005. Otolith science entering the 21st century.Marine and FreshwaterResearch 56:485–495 DOI 10.1071/MF04147.
Elsdon T,Wells B, Campana SE, Gillanders B, Jones C, Limburg K, Secor DH, ThorroldSR,Walther BD. 2008. Otolith chemistry to describe movements and life-history pa-rameters of fishes. Oceanography and Marine Biology: An Annual Review 46:297–330DOI 10.1201/9781420065756.ch7.
FigueiredoMM, Gamelas JAF, Martins AG. 2012. Characterization of bone andbone-based graft materials using FTIR spectroscopy. In: Theophanides T, ed.Infrared spectroscopy life and biomedical sciences. London: IntechOpen, 316–338DOI 10.5772/36379.
Fleet M. 2015. Carbonated hydroxyapatite. New York: Pan Stanford.IbrahimDM,Mostafa AA, Korowash SI. 2011. Chemical characterization of some
substituted hydroxyapatites. Chemistry Central Journal 5:74DOI 10.1186/1752-153X-5-74.
Isaksson H, TurunenMJ, Rieppo L, Saarakkala S, Tamminen IS, Rieppo J, KrögerH, Jurvelin JS. 2010. Infrared spectroscopy indicates altered bone turnover andremodeling activity in renal osteodystrophy. Journal of Bone and Mineral Research25(6):1360–1366 DOI 10.1002/jbmr.10.
Koch PL. 2007. Isotopic study of the biology of modern and fossil vertebrates. In:Michener R, Lajtha K, eds. Stable isotopes in ecology and environmental science. 2ndedition. Boston: Blackwell Publishing, 99–154 DOI 10.1002/9780470691854.ch5.
Landi E, Celotti G, Logroscino G, Tampieri A. 2003. Carbonated hydroxyapatiteas bone substitute. Journal of the European Ceramic Society 23(15):2931–2937DOI 10.1016/S0955-2219(03)00304-2.
LeGeros RZ. 1981. Apatites in biological systems. Progress in Crystal Growth andCharacterization 4:1–45 DOI 10.1016/0146-3535(81)90046-0.
Luque et al. (2019), PeerJ, DOI 10.7717/peerj.7176 13/15
LeGeros RZ. 1991. Calcium phosphates in oral biology and medicine.Monographs inOral Science 15:1–201 DOI 10.1159/000419232.
Lin S, Chang C, Iizuka Y, TzengW. 2007. Salinities, not diets, affect strontium/calciumratios in otoliths of Anguilla japonica. Journal of Experimental Marine Biology andEcology 341(2):254–263 DOI 10.1016/j.jembe.2006.10.025.
Liu Y, Ma L, Guo J, Dong G, Cong J, Ji Y, Ning J, Yang G,Wu K. 2018. Study of a newpractical ESR dosimeter based on carbonated hydroxyapatite and its dosimetricproperties. PLOS ONE 13(5):e0197953 DOI 10.1371/journal.pone.0197953.
Lu HB, Campbell CT, GrahamDJ, Ratner BD. 2000. Surface characterization ofhydroxyapatite and related calcium phosphates by XPS and TOF-SIMS. AnalyticalChemistry 72(13):2886–2894 DOI 10.1021/ac990812h.
Luque PL, Rodriguez-Marin E, Landa J, Ruiz M, Quelle P, Macias D, Ortiz de UrbinaJM. 2014. Direct ageing of Thunnus thynnus from the eastern Atlantic Oceanand western Mediterranean Sea using dorsal fin spines. Journal of Fish Biology84:1876–1903 DOI 10.1111/jfb.12406.
MathewM, Tagaki S. 2001. Structures of biological minerals in dental research. Journalof Research of National Institute of Standards and Technology 106(6):1035–1044DOI 10.6028/jres.106.054.
Matsunaga K, Murata H, Mizoguchi T, Nakahira A. 2010.Mechanism of incor-poration of zinc into hydroxyapatite. Acta Biomaterialia 6(6):2289–2293DOI 10.1016/j.actbio.2009.11.029.
McMahon KW, BerumenML, Thorrold SR. 2012. Linking habitat mosaics and connec-tivity in a coral reef seascape. Proceedings of the National Academy of Sciences of theUnited States of America 109:15372–15376 DOI 10.1073/pnas.1206378109.
Miller J. 2009. The effects of temperature and water concentration on the otolithincorporation of barium and manganese in black rockfish Sebastes melanops. Journalof Fish Biology 75(1):39–60 DOI 10.1111/j.1095-8649.2009.02262.x.
Murugan R, Ramakrishna S, Panduranga RK. 2006. Nanoporous hydroxy-carbonateapatite scaffold made of natural bone.Materials Letters 60(23):2844–2847DOI 10.1016/j.matlet.2006.01.104.
Patterson HM,Mcbride RS, Julien N. 2004. Population structure of red drum (Sciaenopsocellatus) as determined by otolith chemistry.Marine Biology 144:855–862DOI 10.1007/s00227-003-1254-x.
Pellegrini M, Snoeck C. 2016. Comparing bioapatite carbonate pre-treatments forisotopic measurements: part 2—Impact on carbon and oxygen isotope compositions.Chemical Geology 420:88–96 DOI 10.1016/j.chemgeo.2015.10.004.
Rey C, Combes C, Drouet C, Glimcher MJ. 2009. Bone mineral: update on chem-ical composition and structure. Osteoporosis International 20:1013–1021DOI 10.1007/s00198-009-0860-y.
Rooker JR, Arrizabalaga H, Fraile I, Secor DH, Dettman DL, Abid N, Piero A, DeguaraS, Karakulak FS, Kimoto AI, Sakai O, Macias D, Neves Santos M. 2014. Crossingthe line: migratory and homing behaviors of Atlantic bluefin tuna.Marine EcologyProgress Series 504:265–276 DOI 10.3354/MEPS10781.
Luque et al. (2019), PeerJ, DOI 10.7717/peerj.7176 14/15

Santamaria N, Bello G, Pousis C, Vassallo-Agius R, delaGándara F, Corriero A. 2015.Fin spine bone resorption in Atlantic bluefin tuna, Thunnus thynnus, and com-parison between wild and captive-reared specimens. PLOS ONE 10(3):e0121924DOI 10.1371/journal.pone.0121924.
Snoeck C, Pellegrini M. 2015. Comparing bioapatite carbonate pre-treatments forisotopic measurements: part 1—Impact on structure and chemical composition.Chemical Geology 417:394–403 DOI 10.1016/j.chemgeo.2015.10.004.
Termine JD, Lundy DR. 1973.Hydroxide and carbonate in rat bone mineral and its syn-thetic analogues. Calcified Tissue International 13(1):73–82 DOI 10.1007/BF02015398.
TurunenMJ, Saarakkala S, Rieppo L, Helminen HJ, Jurvelin JS, Isaksson H. 2011.Comparison between infrared and raman spectroscopic analysis of maturing rabbitcortical bone. Applied Spectroscopy 65:565–603 DOI 10.1366/10-06193.
Tzadik OE, Curtis JS, Granneman JE, Kurth BN, Pusack TJ, Wallace AA, HollanderDJ, Peebles EB, Stallingset CD. 2017. Chemical archives in fishes beyond otoliths:A review on the use of other body parts as chronological recorders of micro-chemical constituents for expanding interpretations of environmental, ecological,and life-history changes. Limnology and Oceanography: Methods 15:238–263DOI 10.1002/lom3.10153.
Ugarte A, Unceta N, Pecheyran C, Goicolea MA, Barrio RJ. 2011. Development of amatrix matching hydroxyapatite calibration standards for quantitative multi-elementLA-ICP-MS analysis: application to the dorsal spine of fish. Journal of AnalyticalAtomic Spectrometry 26:1421–1427 DOI 10.1039/c1ja10037h.
Wagner CD, RiggsWM, Davis LE, Moulder JFF, Muilenberg GE, StickleWF. 1979.Data interpretation. In: Handbook of X-ray photoelectron spectroscopy. Eden Prairie:Perkin-Elmer DOI 10.1002/sia.740030412.
Walther B, Limburg K. 2012. The use of otolith chemistry to characterize diadro-mous migrations. Effects of preservatives and acidification on the stable isotoperatios (15N:14N, 13C:12C) of two species of marine animals. Journal of Fish Biology81(2):796–825 DOI 10.1111/j.1095-8649.2012.03371.
Zymonas ND,McMahon TE. 2006. Effect of pelvic fin ray removal on the survival andgrowth of bull trout. North American Journal of Fisheries Management 26:953–959DOI 10.1577/M05-119.1.
Luque et al. (2019), PeerJ, DOI 10.7717/peerj.7176 15/15