characterization of acetylcholine esterase‐ gold
TRANSCRIPT

Characterization of Acetylcholine esterase‐ Gold Nanoparticle Conjugates
Bachelor of Science Thesis SEBASTIAN ÅKESSON Department of Chemical and Biological engineering CHALMERS UNIVERSITY OF TECHNOLOGY Gothenburg, Sweden 2012
400 500 600 700 8000.0
0.1
0.2
0.3
0.4
0.5
Abs
orba
nce
Wavelength (nm)
Absorbance of 14nm gold nanoparticles at 519nm

ii

iii
Acknowledgement I wish to thank my supervisor Jacqueline Keighron for her guidence and support. I would also like to thank my examinator Ann‐Sofie Cans for her comments and tips. I want to thank all at the department on floor 4 and 5 who have helped me with instruments and/or answered all my questions.
I would like to thank my parents for their support and encouragement. Finally I would like to thank my girlfriend Anna Kaminski for her extrodinary help and support.

iv

v
Abstract The purpose of this project was to synthesize and characterize enzyme‐gold nanoparticle conjugates based on acetylcholine esterase (AChE). In this work gold nanoparticles were synthesized according to the Turkevich process and attachment of AChE to the synthesized gold nanoparticles was performed using direct adsorption. The long‐term goal is to use these nanostructured materials in the construction of a biosensor for the detection of acetylcholine release at secretory cells during the process of exocytosis. It is therefore of great importance for the enzyme nanoparticle conjugates to achieve as high enzymatic activity as possible since it results in a more efficient biosensor. To this end, it was important to determine the retained enzyme activity when attached to the nanoparticles. Hence, this analysis included determination of the number of enzymes per particle and the difference in enzyme activity when AChE was attached to the gold nanoparticles compared to the free enzyme activity. The synthesized gold nanoparticles had an average diameter of 14 nm according to TEM. From the direct and indirect quantification, the number of enzymes attached to each gold nanoparticle was 28 ± 2 and 25 ± 3 respectively. This corresponds very well to the calculated theoretical value of an AChE monolayer coverage of 27 ± 2 enzymes per gold nanoparticle. The bioconjugate activity was significantly lower than the activity of free enzymes in solution and was determined to be 9 % activity compared to the free enzyme activity.

vi
vii
Table of Contents 1. Introduction .................................................................................................................................... 1
2. Theory ............................................................................................................................................. 1
2.1 Gold nanoparticles ..................................................................................................................... 1
2.2 Acetylcholine and Acetylcholine esterase ................................................................................. 2
2.3 Ultraviolet‐visible spectroscopy (UV‐VIS) .................................................................................. 2
2.4 Fluorescence .............................................................................................................................. 3
2.5 Dynamic Light Scattering (DLS) .................................................................................................. 3
2.6 Transmission electron microscopy (TEM) .................................................................................. 3
3. Methods .......................................................................................................................................... 4
3.1 Gold nanoparticle synthesis ...................................................................................................... 4
3.1.1 Preparation of samples for TEM ............................................................................... 4
3.2 Estimation of monolayer coverage ........................................................................................... 5
3.3 Fluorescence labeling of the enzyme ........................................................................................ 6
3.4 Flocculation assays ................................................................................................................... 7
3.5 Hydrodynamic radius ................................................................................................................. 8
3.6 Direct Quantification of Bioconjugate Stoichiometry ............................................................... 8
3.7 Indirect Quantification of Bioconjugate Stoichiometry .......................................................... 10
3.8 Bioconjugate activity and free enzyme activity ....................................................................... 11
3.9 Determination of specific activity ............................................................................................ 13
4. Results ........................................................................................................................................... 15
5. Discussion ...................................................................................................................................... 22
6. Conclusions ................................................................................................................................... 24
7. References ..................................................................................................................................... 25

1
1. Introduction
Metal nanoparticles have unique properties and they can also be synthesized to have desired shape and size which makes them very useful in many different fields of science. Combining these with the unique properties of enzymes results in nanoparticle conjugates, which are used for making biocatalysts and biosensors among many things. The purpose of this study is to compare the specific activity of the enzyme acetylcholinesterase (AChE) attached to gold nanoparticles (gold nanoparticle conjugates) with the specific activity of free AChE in solution. The goal is also to determine how many molecules of AChE can be attached to each nanoparticle. Gold nanoparticles have been chosen for this study due to some of their unique properties (see chapter 2.1 for details). The long‐term goal of this project is to construct a biosensor, which can detect the release of non‐electroactive neurotransmitters, in this case acetylcholine. The concept is a sensor based the enzymatic catalysis the neurotransmitter into an electroactive substance that can be detected electrochemically. A possible biosensor design for the detection of acetylcholine can be to co‐attach AChE and a second enzyme, choline oxidase (ChO), onto gold nanoparticle coating the surface of an electrode. Using this scheme for a biosensor acetylcholine can be hydrolyzed by the enzyme AChE into acetate and choline by hydrolysis. Choline reacts then with ChO and result in the products betaine and hydrogen peroxidase by redox reaction. Hydrogen peroxidase is an electro active product that subsequently can be detected by the electrode sensor surface. The attachment of gold nanoparticles to the sensor provides a surface with high curvature that has potential to reduce enzyme denaturation in comparison to a planar surface when enzymes are attached. Additionally, the nanostructured surface offers an increase in sensor surface area and therefore leads to an increase in total enzyme activity compared to a flat sensor surface.
2. Theory
In this chapter the theory behind the project is presented and a general description of the instruments used. 2.1 Gold nanoparticles
Gold is well known for its ability to conduct electricity and the main reason behind this is that gold has free electrons, which can move freely in the metallic lattice. This can be described as a cloud of electrons and if an electromagnetic wave is applied it makes the electrons move to one area, which induces a dipole. At a specific wavelength the electron cloud will move back and forth (oscillation) and this is referred to as a plasmon. In the field of gold nanoparticles these plasmons are one of the most interesting properties. These so‐called plasmons give rise to extinction of certain wavelengths and depend on the material of the nanoparticle, size of the particle and the surrounding medium. Because of the extremely effective absorption of light, the plasmons offer great opportunities in the field of sensors [1].

2
There are several methods available for producing gold nanoparticles but the simplest method is the Turkevich process that was proposed by Turkevich in 1951. [2] With this method spherical monodispersed gold nanoparticles with a diameter ranging between 10 to 20 nm are obtained. Hot chloroaurate ions is mixed with sodium citrate. The latter is used both as a reducing agent as well as a capping agent. The reducing agent reduces Au3+ ions to Au0 and the capping agent prevent the gold nanoparticle from agglomerating by stabilizing the particles through charge repulsion. 2.2 Acetylcholine and Acetylcholinesterase
Acetylcholine is a neurotransmitter which is required for signaling between nerves and skeletal muscles in all vertebrates. Acetylcholine is also required by the heart and the smooth muscles and effects signaling in the brain. Studies have shown that acetylcholine has effects on diseases such as Alzheimer disease and the interest for substances that can enhance or reduce the effects of acetylcholine is therefore large [3]. AChE is the catalyst used for this project. After acetylcholine is released for signaling, the enzyme takes action and hydrolyzes acetylcholine into acetic acid and choline. Since the amount of AChE effects acetylcholine it is related to different types of diseases correlated to acetylcholine such as Alzheimer disease [4]. 2.3 Ultraviolet‐visible spectroscopy, UV‐VIS
Ultraviolet‐visible spectroscopy (UV‐VIS) is an absorption spectroscopy technique in the ultraviolet‐visible region [5]. In this technique radiation passes through the sample and the intensity of the light coming out from the sample is measured. When electromagnetic radiation is absorbed, atoms or molecules will undergo transitions and this result in electrons moving from the ground state to an excited state. The energy difference is given by equation 1:
ΔE = Eexcited – Egroundstate (1)
The extent of light absorption is dependent on the molecules and how capable they are to absorb light at a certain wavelength but also how efficient the absorption is. The absorbance can be calculated by the Lambert‐Beer equation 2:
A = log( I / I0) = Ɛcl (2) where A is the absorbance, I0 is the intensity of the incoming light to the sample, I is the intensity of light coming out from the sample, c is the concentration of the solution and Ɛ is the molar absorptivity, which is a constant for a given solvent and l is the path length, 1 cm. Schematically, UV‐VIS equipment consists of a light source, a monochromator and a detector. Often deuterium is used as light source in the ultraviolet region and emits electromagnetic radiation. For wavelengths in the visible region often a tungsten filament is used. The monochromator works as a grid

3
by spreading the incoming beam. The intensity of the light passing through the sample is measured in a detector, often a photomultiplier [5]. 2.4 Fluorescence
Fluorescence is a valuable tool for detecting and also quantifying biomolecules such as proteins. It is based on the fact that some molecules absorb light at a particular wavelength and emit light at a longer wavelength with lower energy after a short time. [6] In order to detect specific proteins in a sample, fluorescent tags are often attached to the molecules and then recordings of a specific emission wavelength are used to locate and/or quantify the fluorescing molecules studied [7].
2.5 Dynamic light scattering, DLS Dynamic light scattering (DLS) is a laser scattering technique that is used to determine the size of nanoparticles in solutions. [8] The liquid sample is exposed to a focused laser beam and when hitting the sample, light will be scattered with a specific scattering angle, 173 degrees in this project, and is later collected by a detector which can be a photomultiplier for example. DLS measures the hydrodynamic radius of the particles which means that it measures the diffusion and uses that to calculate a hard spherical radius by using Stokes’ radius equation [8]. Particles are rarely perfectly spherical and extended molecules will give a higher Stokes’ radius than a compact molecule with the same weight.
The Stokes’ radius is dependent on how fast the nanoparticles are moving in the liquid. Particles in solution undergo Brownian motion, which is the motion of smaller particles resulting from bombardment by solvent molecules [9]. The intensity of the scattered light varies at a rate that is dependent on the size of the particle. Analysis of these fluctuations in scattered light intensity gives the velocity of the Brownian motion. The particle size can then be obtained by using the Stokes‐Einstein relationship. [8].
DLS is a very useful method when studying nanoparticles in liquids but the sample preparation is critical in that sense that the procedure is very sensitive to dust and other particles.
2.6 Transmission Electron Microscopy, TEM The transmission electron microscopy (TEM) differs from an ordinary microscope in the regard that it uses a beam of electrons instead of ordinary light. Since the electron beam has shorter wavelength (higher energy) compared to ordinary light it is possible to enlarge samples so much that detection at nanoscale is achievable. An emission source emits electrons. Depending on the studied specimen, these electrons will adsorb to the sample and thus enabling a shadow image to be formed from the unscattered electrons. In this way, a detailed photograph is obtained. The sample preparation is thus complicated where the sample has to be very thin, a couple of hundred nanometers [10]. A TEM picture of gold nanoparticles is displayed on the front page of this thesis.

4
3. Methods
In this section the methods used for characterizing free AChE and AChE‐nanoparticle conjugates are presented and made according to provided methods [11]. 3.1 Gold nanoparticle synthesis Equipment: 2 liter round bottom flask, condenser, heating mantel, stir bar, motor, graduated cylinders (20ml for AuCl3 and 100ml for citrate), 2 dark bottles, 1mM AuCl3 solution, milli‐Q water. To eliminate contamination by possible metal ions during the gold nanoparticle synthesis, all surfaces of the equipment that will be used were cleaned 3 times with aqua regia solution (3:1 ratio of HCl and HNO3) and then carefully rinsed 3 times with milli‐Q water prior to use. The equipment setup is done according to figure 1. Procedure: All batches of gold nanoparticles were synthesized in a large volume batch. This was done by placing 1 liter of 1 mM AuCl3 solution in a round bottom flask cleaned with aqua regia solution. A motorized stir bar was placed in the solution and set to a spin rate of 260 rpm. The gold solution was heated until solution was boiling. The set up used is shown in figure 1. To achieve a homogenous size of the gold nanoparticle solution, a 38.8 mM sodium citrate solution was quickly added to the batch during continuous stirring. A color shift from yellow to red was seen as the gold solution was reduced and the nanoparticles were synthesized. The solution was left to boil for another 10 minutes before the heating mantle was turned off. The size of gold nanoparticles generated is depending on the concentration of AuCl3 and the amount of sodium citrate added. For the synthesis of 30 nm particles, 67ml of 38.8mM sodium citrate was added to 1 liter of 1mM AuCl3. 3.1.1 Preparation of samples for TEM
To acquire the size for the synthesized nanoparticles, the particles were imaged using TEM. The samples for TEM were prepared by first taking a small film of weight paper and place it on the table. A small drop of sample was placed on the weight paper, approximately 100µl and then a formvar‐coated cupper grid was placed on top of the droplet with the formvar coated side facing downward. After 30 seconds the grid was gently removed by using a tweezers. Liquids that remained on the filter were removed by carefully using a pipette. The grid was then left to dry overnight before TEM imaging the following day.
Figure 1. The equipment setup for gold nanoparticles synthesis.

5
3.2 Estimation of monolayer coverage
To determine the concentration of the synthesized gold nanoparticles, the absorbance was measured at 400‐800 nm using UV‐VIS (3 times) and the samples were diluted 1:3 before measurement to yield an absorbance peak below 1.0 to ensure optimal quantitative measurement. The extinction coefficient for the gold nanoparticles were acquired from the table in Appendix A after the nanoparticle diameter of the particles was determined with DLS and TEM. The surface area ANP, of the nanoparticles was then calculated using equation 3 and assuming the nanoparticles are spherical with a radius rNP , that was recovered from TEM and DLS measurements as described in section 3.1.1 and 3.2.
A!" = 4πr!"! As the crystal structure of the Acetylcholine esterase was unknown, the molecular footprint of AChE on the nanoparticle surface was therefore calculated using equation 4 by assuming a spherical shape of the enzyme. Here v is the specific volume of a protein, that correspond to 0.74cm3/g, 𝑚 is the enzymes molecular weight, 67000g/mole, and NA is Avogadro’s number.
𝐴! = 𝜋 !!"!!!!
!/!
Figure 2. Estimation of monolayer coverage
From the calculated surface area of the gold nanoparticle, ANP, and the estimated size of the protein, AE, the numbers of enzymes per nanoparticle was calculated. These calculations gave an approximate concentration of the gold nanoparticle solution and the amount of enzymes per particle which were used for continued tests.
(3)
(4)

6
3.3 Fluorescence labeling of the enzyme In order to perform quantitative fluorescence measurement of AChE, a fluorescent group, Alexa fluor® 488, bis (triethylammonium salt), was attached to the enzyme. This was made according to a standard “Alexa fluor 488 Protein labeling kit” method as described below [12]. The labeling started with addition of 1ml milli‐Q water to the provided vial with sodium bicarbonate (component B). Then a 2mg/ml AChE solution were made by Weighting 1 mg of AChE and put in a vial together with 0.5 ml milli‐Q. 50µl of the sodium bicarbonate solution was then added to the AChE solution to change the pH to neutral. The sample was then transferred to a vial with “Alexa Fluor 488 reactive dye” (component A). The sample was carefully shaken and then wrapped up in aluminum foil and stirred for 1 hour without heating. The separation column was setup in the meantime according to figure 3. The entire column was filled with the gel (component C) except for the 3 centimeters at the top and made sure there were no bubbles in the column. Then small amount of water were added to measure the flow rate. It was determined to be approximately 1 drop/min. The sample was added to the top of the column (the component A cuvette). 100 µl of water was added to the cuvette and was poured at the top of the column to make sure no sample remained. The column was additionally filled with water once the entire sample had started to pass through the gel to ensure a continuous flow. The sample became separated into two distinct phases where the first phase was the fluorescently labeled enzyme. The labeled enzyme was collected when eluting and the absorbance of the sample was measured to determine the AChE concentration and was calculated according to equation 5:
AChE concentration (E) = [A!"# − 0.11 ∗ A!"!)] ∗ dilution factor
126000
where 126000 cm‐1M‐1 is the molar extinction factor of AChE. The value 0.11 is the correction factor which accounts for the absorption of the dye at 280nm and A is the absorbance at the specific wavelengths, 280nm for the dye and 494nm for the conjugate. The final step was to calculate the degree of labeling according to the following equation:
Moles dye per mole AChE = A!"! ∗ dilution factor
71000 ∗ enzyme concentration (E)
where 71000 cm‐1M‐1 stands for an approximation of the molar extinction coefficient for Alexa Fluor 488 dye at the wavelength 494 nm. If the labeling is a success there should be 4‐9 moles of dye per mole of enzyme according to the molecular probes protocol.
(5)
(6)
Figure 3. The equipment set-up for protein labeling.

7
3.4 Flocculation assays A flocculation assay is a method to determine the ratio between AChE and gold nanoparticles needed in solution to get fully saturated gold nanoparticles during synthesis. Since this ratio is entirely unknown many ratios need to be tested to find a ratio were the particles are fully saturated, figure 4.
Figure 4. When flocculation ratios are tested a certain amount of AChE is added (blue) to the gold nanoparticle solution to form gold nanoparticles conjugates. If there is enough AChE the gold particles will get complete protection and there will be no major color change when NaCl is added, but if there is insufficient protection the gold particle conjugates will aggregate and the color changes to gray.
The ratio that yields complete protection is the one further used to synthesize stable enzyme gold nanoparticle conjugates. The flocculation ratio tested was made by adding AChE to a gold nanoparticle solution according to the table shown below:
Au:AChE ratio Volume of Au (µl) Volume of AChE (µl) Volume of 10mM sodium bicarbonate (µl)
1:0 (reference) 200 0.00 300.00 1:15 200 1.08 298.92 1:23 200 1.62 298.38 1:31 200 2.16 297.84 1:39 200 2.70 297.30 1:77 200 5.40 294.60
Table 1. The flocculation ratios that were tested.
After solutions of enzyme gold nanoparticle solutions in different ratios were made, the conjugates were stored dark for 40 minutes and then 200µl of 2M NaCl was added to all of the samples. After the addition of salt the samples were again placed dark for additional 20 minutes. This was done for all samples except the reference sample in which case 50µl water was added in replacement of the salt solution. The absorbance was measured for all samples between 400‐800 nm and the sample that was determined to have the spectra with closest resemblance to the spectra of the reference sample was the ratio of enzyme gold nanoparticle needed to achieve a stabile conjugate during synthesis.
8
Flocculation ratios were tested in both a 10 mM sodium bicarbonate buffer as well as water, but only 10 mM sodium bicarbonate is presented in table 1 since water showed insufficient protection of the gold nanoparticles for all ratios in table 1. 3.5 Hydrodynamic radius Dynamic light scattering was used to determine the hydrodynamic radius of gold nanoparticles and the enzyme‐gold nanoparticle conjugates. Sample preparation was started by making three samples of gold nanoparticle: enzyme ratio found to form stable conjugates from the flocculation assays, section 3.4. The samples were then centrifuged for 30 minutes at 10000 rpm and the supernatant was then removed (950µl). Fresh milli‐Q water was added and the sample was again centrifuged for 10 min at 5000 rpm, this was repeated three times. The purpose of the centrifugation was to remove the free enzyme that was unable to attach to any gold nanoparticles. Thereafter, the samples were shaken to allow the pellet to re‐dissolve and DLS analysis could be performed. The DLS were a Zetasizer Nano Series (Nano‐ZS). The following conditions were used in the set‐up during the DLS tests:
• 4 sided standard glass cuvette • Equilibrium time 60 sec, 25°C
• Material – gold • Wait 10 s between samples
• Dispersion – water 25°C • Mark Houwink parameters
• Settings – general
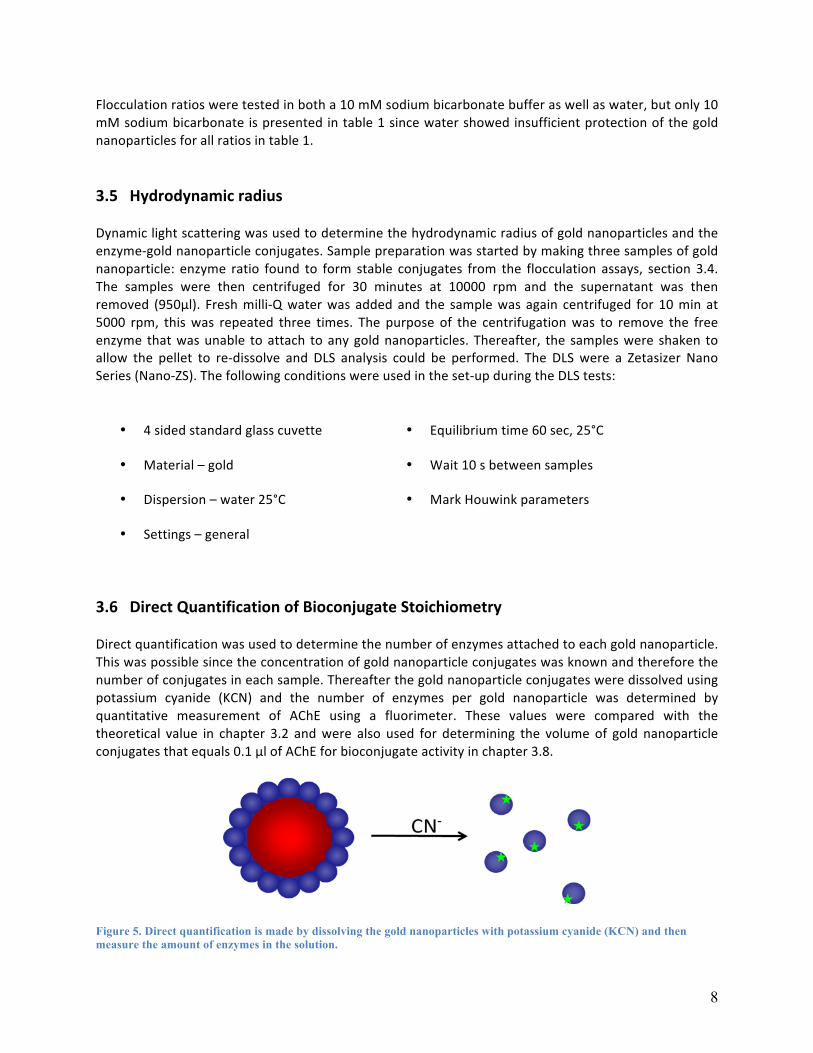
3.6 Direct Quantification of Bioconjugate Stoichiometry Direct quantification was used to determine the number of enzymes attached to each gold nanoparticle. This was possible since the concentration of gold nanoparticle conjugates was known and therefore the number of conjugates in each sample. Thereafter the gold nanoparticle conjugates were dissolved using potassium cyanide (KCN) and the number of enzymes per gold nanoparticle was determined by quantitative measurement of AChE using a fluorimeter. These values were compared with the theoretical value in chapter 3.2 and were also used for determining the volume of gold nanoparticle conjugates that equals 0.1 µl of AChE for bioconjugate activity in chapter 3.8.
Figure 5. Direct quantification is made by dissolving the gold nanoparticles with potassium cyanide (KCN) and then measure the amount of enzymes in the solution.

9
The experiment started by making five samples of enzyme gold nanoparticle conjugates using a ratio of enzyme:nanoparticle that was determined from the flocculation assay to form stable conjugates as described in chapter 3.5. The samples were then centrifuged at 10000 rpm for 30 minutes. After the centrifugation a small pellet of the gold nanoparticle conjugates could be seen at the bottom and 950µl of the supernatant was carefully removed and saved in a new tube that were later used for the indirect quantification as described in chapter 3.7. Fresh 10mM sodium bicarbonate (950µl) was added to the samples after the supernatant was removed and then centrifuged again for 10000rpm for 30 minutes. This step was repeated 3 times for all of the samples which make it a total of 15 supernatants used for indirect quantification in chapter 3.7. This was made to make sure that all the enzymes that were not attached to the gold particles had been removed from the samples. Figure 6 show a detailed description of how direct and indirect quantification works. After 3 centrifugations the absorbance was measured for the five samples at 519 nm. Then 200 µl of each sample was taken and placed in five separate new tubes, in which each contained 50 µl of 25 mM KCN solution and 75 µl of 10 mM sodium bicarbonate solution. The samples were then shaken gently and placed in darkness overnight (25°C). Next day the samples were colorless and if that hadn’t been the case then they should have been incubated for additional hours. To determine the concentration of AChE in the samples, fluorescence measurements of the samples were made and referred to an AChE standard curve. The standards were treated in the same way as the samples except for the centrifugation and they were made according to table 2 below: Standard Conc. AChE (M) AChE (µl) Au (µl) KCN (µl) Water (µl)
A 0 0 100 50 175 B 6.50E‐10 0.5 100 50 174.5 C 1.30E‐9 1 100 50 174 D 2.60E‐9 2 100 50 173 E 6.50E‐9 5 100 50 170 F 1.30E‐8 10 100 50 165
Table 2. Standards used for the direct quantification. The AChE stock was diluted 1:10 with water and then used according to the table.
The concentrations of AChE in table 2 were determined from the concentration of AChE in chapter 3.4 and could therefore be determined by using the following equation:
c1V1 = c2V2 Fluorescence was measured on all of the standards and a calibration curve was then made by plotting the concentration of AChE against fluorescence intensity. The fluorescence intensity of the samples was then used in the calibration curve to acquire the AChE concentration.
(7)

10
3.7 Indirect Quantification of Bioconjugate Stoichiometry Instead of measuring the number of enzymes attached to the conjugates as described in the direct quantification of AChE, an indirect method was also used where the number of enzymes that did not attach is determined and then subtracted from the amount enzyme added during the synthesis of enzyme‐gold nanoparticle conjugates. Here the samples consisted of the 15 supernatants collected from the first purification step after the bioconjugate synthesis.
For the indirect quantification, the fluorescence on the supernatants were related to a calibration curve where the standards were made according to the following table:
Standard Conc. AChE (M) AChE (µl) Water (µl) A 0 0 300 B 7.04E‐10 0.5 299.5 C 1.41E‐9 1 299 D 2.81E‐9 2 298 E 7.05E‐9 5 295 F 1.41E‐8 10 290
Table 3. Standards for the indirect quantification. The AChE stock was not diluted.
The samples were centrifuged once at 14000 rpm for 20 minutes to make sure that no conjugates were present in the samples. Fluorescence was measured on all standards and samples and a calibration curve were made from the standards by plotting fluorescence intensity against AChE concentration. The intensity of the samples could then be used to determine the concentration of AChE in the samples. The average value and standard deviation for each sample was calculated and the stoichiometry between direct and indirect quantification were then compared to see if they gave the same answer.
Figure 6. After the synthesis of the enzyme gold nanoparticle conjugates, the enzymes that were unable to attach to any particle is separated using centrifugation and collected in the supernatant solution when the conjugates are spun down at the bottom. After each centrifugation as much supernatant is removed as possible and replaced with fresh buffer. By doing this three times almost all free enzymes will be separated from the conjugates. The amount of enzymes is then determined using fluorescence measurement on all three supernatants and then added together. Subtracting this number with the amount of enzyme added gives the amount of enzymes attached to the conjugates.

11
3.8 Bioconjugate activity and free enzyme activity To achieve a maximized catalytic efficiency of the enzyme nanoparticle conjugates, the activity is ideally retained as high as possible when enzymes are attached to the nanoparticles in comparison to the activity of enzymes free in solution. To determine the change in activity between free AChE and AChE attached to gold nanoparticles, the bioconjugate activity and the free enzyme activity was measured using a UV/VIS based enzymatic assay. When designing the enzymatic assay for AChE bioconjugate activity, a three enzyme reaction scheme was needed to determine the hydrolysis reaction rate of acetylcholine according to reaction the first reaction. This was due to the products in reaction one could not be distinguished from the reactants by UV‐VIS. Therefore a second enzyme, Choline oxidase (ChO) which made reaction 2 possible and a third enzyme, Horseradish peroxidase (HRP), combined with the reagent, O – Phenylenediamine (OPD) was added to the assay, which resulted in the product formation of 2,3 – Diaminophenaline (DAP) according to the last reaction. The formation of DAP was detectable with an absorbance peak at 492 nm. Hydrolysis reaction with acetylcholine esterase (AChE): Reaction 1. Hydrolysis reaction with acetylcholine esterase.
Choline oxidase (ChO): Reaction 2. Choline oxidase.
Horseradish peroxidase (HRP) and O – Phenylomediamine (OPD): Reaction 3. Horseradish peroxidase and O‐Phenylomediamine.

12
In preparation for the experiment the following solutions were required:
• PBS buffer (137 mmol/L NaCl, 2.7 mmol/L KCl, 10 mmol/L Na2HPO4∙2H2O, 2 mmol/L KH2PO4. pH
= 7.4)
• 11.4 µM HRP made in 10 mM PBS buffer
• 2.63 µM CHO made in 10 mM PBS buffer
• 50 mM Acetylcholine made in 10 mM PBS buffer
• 100 mM OPD made in 10mM PBS buffer
• 3 M HCl
• 3 samples of AChE gold nanoparticle conjugates acquired and made according to chapter 3.6.
To make sure that all the reactants from previous steps had reacted, the concentration increased throughout the experiment. The assay was initiated by adding the free enzyme or the enzyme bioconjugates to 3 separate tubes containing HRP, acetylcholine, OPD, ChO and PBS buffer at pH=7.4. The enzyme was left to react in 5 minutes and then 200µl of HCl was added to quench the reaction. After the addition of HCl the sample was not exposed to light to ensure that the reaction had stopped. To determine the product formation of DAP, the absorbance at 492nm was measured for all samples.
Component Conc. (µM)
Sample 2,79 E‐5
ChO 0.53
HRP 1.14
Ach 5000
OPD 10,000
PBS buffer 4720
Table 4. Amount of each component added in the bioconjugate activity assays.
To be able to acquire the activity and the specific activity of the bioconjugates the number of enzymes per gold nanoparticle needed to be determined. This was measured according to section 3.6‐3.7 and the calculations are presented in section 3.4. To determine the activity of free enzyme a 4 step assays was designed accordingly:
1. Determination of amount of grams AChE present in the starting solution and the absorbance at 492nm for each sample. The amount of AChE could be calculated since the concentration and the volume was known.
2. The extinction coefficient for DAP (ε = 2100 M‐1cm‐1) together with the absorbance in step 1 was
used to determine the number of moles of product created in each step with Lambert‐Beers
law. The concentration was converted into µmoles by using the total volume of the samples.

13
3. The number of moles created was divided by the time in minutes the assays ran (30 minutes) to get the activity in µmol/min.
4. The blank rate was subtracted from each of the activity measurements to obtain the measured
activity (V) for each reaction.
Free enzyme assays was made in the same way except that the sample was replaced with an amount of AChE with a volume equal to the amount of enzymes attached to the bioconjugates, table 5. The calculations made for determine that volume is based on the results from the direct and indirect quantification (chapter 3.6‐3.7) and will be explained in the result.
Component Volume (µM)
AChE 8.46E‐4
ChO 0.53
HRP 1.14
Ach 5000
OPD 10,000
PBS buffer 4998
Table 5. Amount of each component added for the free enzyme activity assays.
3.9 Determination of specific activity The values acquired in chapter 3.6, 3.7 and 3.8 were used to calculate the specific activity by using the following equation:
𝑆𝑝𝑒𝑐𝑖𝑓𝑖𝑐 𝑎𝑐𝑡𝑖𝑣𝑖𝑡𝑦 𝑆𝐴 = 𝑉
[𝐴𝐶ℎ𝐸]
were V is the specific activity aquired in chapter 3.8 for the free enzyme assays and [AChE] is the amount of grams AChE present in the starting solution aquired in chapter 3.8 for the free enzyme assays. To get the bioconjugate activity additional information is required:
1. The concentration of conjugates is determined by measuring the absorbance after centrifuging the samples 3 times in chapter 3.2 and then use Lambert‐Beers law, equation 2. The moles of conjugate could then be determined since the volume of conjugate added to each assay in
chapter 3.2 is known (14 µl).
2. The number of moles was then multiplied with the number of AChE attached to each gold
nanoparticle determined in chapter 3.6‐3.7 to get the moles of enzyme. This could then be converted into grams by using the molar mass for AChE (67000 g/mol).
(8)

14
3. The absorbance of DAP in chapter 3.8 made it possible to determine the concentration in each
sample. The concentration of DAP is equal to the concentration of AChE and the number of micromoles (µmol) AChE can therefore be calculated by using the total volume of each assay (700 µl). The micromoles of AChE are then divided by the number of minutes the assay ran to
get micromoles per minute (µmol/min) which is the activity.
4. The specific activity is then acquired by dividing the activity with number of grams AChE
determined in step 2.

15
4. Results
In this report, the goal was to study the formation and characterization of AChE‐gold nanoparticle conjugates. This work included to determine the enzyme:nanoparticle ratio of the conjugates and the specific enzyme activity when adsorbed to the nanoparticle surface. For the quantitative evaluation, the concentration of the synthesized gold solution had to be determined. This was measured to be 4.81 nM using UV/VIS measurements and applying Lambert Beer’s law with an extinction coefficient used for 15 nm gold nanoparticles listed in Appendix A. To estimate the nanoparticle size, first DLS measurements were performed. These data showed two different size distributions of particles in the solution, see figure 8, with peaks of 20 and 250 nm. The larger peak was most likely due to cluster formation of nanoparticles in solution and this peak was easily eliminated when 1.5ml of sample in an Eppendorf tube was centrifuged for 5 minutes at 5000 rpm. Although 5 minutes of centrifugation was enough to separate the different particle clusters, the samples used in the experiments were centrifuged for 10 minutes to ensure separation of clusters from the nanoparticle solution. During this preparation, a small pellet could be seen at the bottom and 1ml of the supernatant was removed and placed in a large storage bottle. This centrifugation procedure was performed on the reminder of the nanoparticle solution to eliminate nanoparticle clusters before any further experiments. The data from the DLS measurement suggested a nanoparticle diameter of 18 ± 2nm based on nine measurements.
Figure 8. The size distribution in the gold nanoparticle solution before centrifugation.
Figure 9. The size distribution in the gold nanoparticle solution after centrifugation at 5000 rpm for 10 min.

16
The size of the nanoparticles were also determined using TEM imaging. The gold nanoparticles were adsorbed to the surface of a formvar coated cupper grid and was used to collect 10 number of high resolution TEM images. One of the TEM images evaluated of individually resolved nanoparticles is shown in figure 10 and the scale bar corresponds to 10 nm. The images were evaluated using ImageJ software and the average size was determined by measuring the diameter of each particle in three different directions and then calculated an average diameter. The average nanoparticle size was determined to be 14±1 nm based on 10 nanoparticles. Hence, the results from DLS and TEM were clearly different and the reason for this is most likely that the DLS measurements the hydrodynamic radius while TEM measures the actual radius.
Flocculation assays were performed to determine the nanoparticle to enzyme ratio needed in solution during enzyme nanoparticle conjugate formation to ensure conjugates that have full surface coverage of enzymes. Gold nanoparticles to enzyme ratios ranging from 1:0 to 1:77 were tested and the spectra from the assays and the flocculation assays are displayed in figure 11. The ratio 1:77 was considered to result in a full enzyme layer of the particle when using 10mM sodium bicarbonate as buffer. During conjugate formation in water the conjugates aggregated (turned into gray) in all the ratios.
Figure 10. TEM results of the gold nanoparticles

17
Figure 11. The result of the flocculation ratios were ratio 1:77 was considered the best and therefore chosen.
DLS was used to monitor the size of the enzyme nanoparticle conjugates formed using a ratio of 1:77, the average diameter was found to be 64 ± 1 nm, based on three measurements. This result show that the size of the particles is approximately tripled after enzyme has been attached to the particle. To determine the number of enzymes adsorbed per gold nanoparticle after conjugate formation both a direct quantification and indirect quantification method was used. The method was based on a quantitative fluorescence measurement of Alexa‐labeled AChE. For the analysis two separate standard curves were prepared and were used for direct analysis (figure 12) and indirect analysis (figure 13) respectively. The direct standard is showed in figure 12 and the deviation, R2, is fulfilled and could therefore be used.
400 500 600 700 800
0.05
0.10
0.15
0.20
0.25
0.30
0.35
0.40A
bsor
banc
e
Wavelength (nm)
Ratio 1:0 Ratio 1:15 Ratio 1:23 Ratio 1:31 Ratio 1:39 Ratio 1:77

18
Figure 12. The result from the direct standard when concentration of AChE was plotted against intensity.
The indirect standards and samples were made on a different fluorimeter and because of this the scale and unit of intensity on the standard curves differs. Due to the high concentration of the free enzymes from the indirect quantification, a different fluorimeter had to be used since the high sensitivity of the detector would result in inaccurate results.
Figure 13. The result from the indirect standard when concentration of AChE was plotted against intensity.
0 20 40 60 80 100 120 140 1600
50000
100000
150000
200000
250000
300000
350000
400000
y = 2626.7x - 9063R² = 0.9960
Inte
nsity
(CPS
)
Conc. AChE (10e-9M)
Direct standard
0 20 40 60 80 100 120 140 1600
200
400
600
800 y=5.6561x-11.459R2=0.9982
Inte
nsity
(a.u
.)
Conc. AChE (10e-9M)
Indirect standard
19
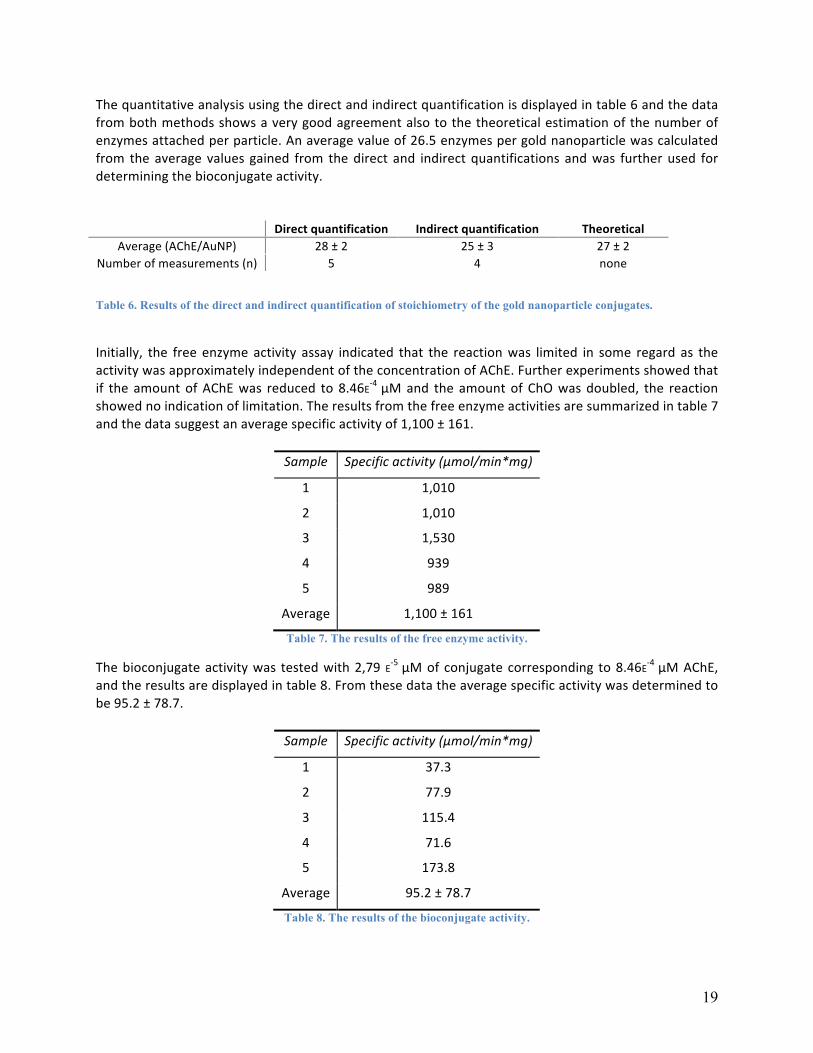
The quantitative analysis using the direct and indirect quantification is displayed in table 6 and the data from both methods shows a very good agreement also to the theoretical estimation of the number of enzymes attached per particle. An average value of 26.5 enzymes per gold nanoparticle was calculated from the average values gained from the direct and indirect quantifications and was further used for determining the bioconjugate activity.
Direct quantification Indirect quantification Theoretical Average (AChE/AuNP) 28 ± 2 25 ± 3 27 ± 2
Number of measurements (n) 5 4 none
Table 6. Results of the direct and indirect quantification of stoichiometry of the gold nanoparticle conjugates.
Initially, the free enzyme activity assay indicated that the reaction was limited in some regard as the activity was approximately independent of the concentration of AChE. Further experiments showed that if the amount of AChE was reduced to 8.46E‐4 µM and the amount of ChO was doubled, the reaction showed no indication of limitation. The results from the free enzyme activities are summarized in table 7 and the data suggest an average specific activity of 1,100 ± 161.
Sample Specific activity (µmol/min*mg)
1 1,010
2 1,010
3 1,530
4 939
5 989
Average 1,100 ± 161
Table 7. The results of the free enzyme activity.
The bioconjugate activity was tested with 2,79 E‐5 µM of conjugate corresponding to 8.46E‐4 µM AChE, and the results are displayed in table 8. From these data the average specific activity was determined to be 95.2 ± 78.7.
Sample Specific activity (µmol/min*mg)
1 37.3
2 77.9
3 115.4
4 71.6
5 173.8
Average 95.2 ± 78.7
Table 8. The results of the bioconjugate activity.

20
By comparing these, the free enzyme activity and the enzyme activity of the bioconjugates, it is clear that the bioconjugate activity has a much lower specific activity and display only 9% of the free enzyme activity. The standard deviation for the bioconjugate activity became very large which is very likely to be due to the small difference in detection of enzyme product formation between blank and samples. This can be seen in figure 14 compared with free enzyme activity shown in figure 15.
Figure 14. The result from the bioconjugate activity.
400 500 600 700 8000.0
0.1
0.2
0.3
0.4
0.5
Abs
orba
nce
Wavelength (nm)
blank bioconj. 1 bioconj. 2 bioconj. 3 bioconj. 4 bioconj. 5

21
Figure 15. The result from the free enzyme activity.
The standard deviation of the theoretical estimation of number of enzymes per gold nanoparticle is based on the standard deviation of the gold nanoparticle size determined from the TEM. Since the size was 14 ± 1 according to TEM, the deviation is approximately 7% and this was further applied to the theoretical value of AChE per gold nanoparticle.
400 500 600 700 800
0.0
0.1
0.2
0.3
0.4
0.5
0.6
0.7
0.8
0.9A
bsor
banc
e
Wavelength (nm)
blank free enzyme 1 free enzyme 2 free enzyme 3 free enzyme 4 free enzyme 5

22
5. Discussion
The gold nanoparticle synthesis was aimed to produce approximately 15 nm spheres, but the DLS measurements identified two peaks, one corresponding to nanoparticles around the desired size, but also displayed a peak with a much higher particle size. This formation of larger particle material could perhaps be due to uneven heating of the gold solution during the synthesis forming larger spheres or clusters. There were also a low amount of extremely large particles in the gold solution which could probably be contaminants like dust. This larger particle material however was easily separated from the nanoparticle solution by centrifugation procedures. During the determination of the enzyme activity, it was discovered that the absorbance of the samples was increasing with time. This was due to the fact that OPD was autocatalyzing itself into the product DAP, which was the end‐product being detected. Because of this, a new standard had to be made frequently to eliminate inaccurate results during analysis. The autocatalyzing affect could be halted by storing the OPD in the refrigerator at 4°C compared to storage in room temperature when not used, but results still showed that the OPD concentration seemed to increase exponentially with time. After approximately one hour after formation, the solution could not be used anymore. In room temperature OPD had to be used within 30 minutes [13]. This autocatalyzing effect of OPD is displayed and can be seen in figure 15.
Figure 16. The result from using different amounts of conjugate in the samples when determining the bioconjugate
activity.
Due to the autocatalysis of OPD, the difference in DAP absorbance was very low when comparing samples to blanks and also various amount of conjugates in the assay was very low and additionally the absorbance between samples with was very uneven as illustrated in figure 16. Since the bioconjugate activity is only 9% of the free enzyme activity this could suggest that there could be something halting
400 500 600 700 8000.00
0.05
0.10
0.15
0.20
0.25
0.30
0.35
0.40
0.45
0.50
0.55
0.60
Abs
orba
nce
Wavelength (nm)
Blank 0h Blank 1h 5ul conjugate at 0h 10ul conjugate at 0h 15ul conjugate at 0h 20ul conjugate at 0h 1ul conjugate at 1h 50ul conjugate at 1h

23
the reaction to great extent. One reason can be the enzyme finds the surface different parts of the structure begin to interact with the surface, steric blockage. This can change the arrangement of amino acids around the active sites, which can change the activity of the enzyme. The second reason can be if enzymes denature as they adsorb to the surface it can lead to the enzyme turning inactive [14].

24
6. Conclusions
In this report, the synthesis and characterization of AChE gold nanoparticle conjugates is described. Initially, gold nanoparticles were synthesized and were characterized using TEM and DLS. The diameter of the gold nanoparticles was determined by TEM to be 14±1 nm and the hydrodynamic diameter of gold nanoparticles by DLS to 18 ± 2nm. To optimize the formation process of stable AChE gold nanoparticle conjugates, a flocculation assays was used to study the conditions needed for nanoparticles with full protein coverage. It was also determined that a 10 mM sodium bicarbonate with pH=7.4 was used as a buffer, offering suitable conditions for AChE adsorption to the gold nanoparticle surfaces. This could be due to the increase in pH which resulted in a larger difference in charge between the enzyme and nanoparticle. For the characterization of determining the number of enzymes attached per particle after conjugate formation, both a direct and an indirect quantification method was used. These analyses showed an absorption of 28 ± 2 and 25 ± 3 proteins per particle respectively. This data was further compared to the theoretical predictions of how many AChE molecules in theory could fit a 14 nm particle and the obtained results of 27 ± 2 proteins were very similar. This means that the theoretical prediction goes hand in hand with the experimental tests. This also means that the ratio 1:77 is optimal for monolayer coverage of 14 nm gold nanoparticles. Finally, evaluating the bioconjugate activity in comparison to the free enzyme activity, a 9% retained activity of the enzymes was detected. This might be due to the enzyme partly or fully denaturing during the adsorption process to the nanoparticle surface. Ideally, in the final goal of construction of an efficient biosensor based on the AChE gold nanoparticle conjugates, the retained enzyme activity need to be significantly higher. Therefore further studies are needed to improve the AChE attachment schemes the gold nanoparticle surface.

25
7. References
[1] L. Cadenartutu and G.A. Ozin. Concepts of nanochemistry, Wiley‐VCH, 2009 [2] J. Turkevich. P. Cooper Stevenson, and J. Hillier. A study of the nucleation and growth processes in the synthesis of colloidal gold. Faraday Soc., 11:55‐75, 1951. DIO: 10.1039/DF9511100055
[3] Powers, J.L. (2012) Acetylcholine. Chemistry explained. http://www.chemistryexplained.com/A‐Ar/Acetylcholine.html (2012‐05‐05) [4] Goodsell,D. (2004) Acetylcholinesterase. RCSB Protein Data Bank. http://www.rcsb.org/pdb/101/motm.do?momID=548 (2012‐05‐26) [5] Lampman, G.M., Pavia, D.L., Kriz, G.S. (2010) Spectroscopy. 4thedition. Belmont: Brooks/Cole
[6] Axelrod, D. (2009 )Fluorescence Microscopy. Molecular expressions ™ http://micro.magnet.fsu.edu/primer/techniques/fluorescence/fluorhome.html (2012‐05‐23)
[7] The Fluorescence Microscope (2012) Nobelprize.org http://www.nobelprize.org/educational/physics/microscopes/fluorescence/index.html (2012‐05‐23) [8] R. Pecora Dynamic Light Scattering Measurement of Nanometer Particles in Liquids. Journal of Nanoparticle Research, 2, 123‐131, 2000
[9] P. Atkins, L. Jones, Chemical Principles. 3rd Edition, W H Freeman & Co, 2004
[10] The Transmission Electron Microscope (2012) Nobelprize.org http://www.nobelprize.org/educational/physics/microscopes/tem/index.html (2012‐05‐27)
[11] Keighron, J. D.; Keating, C. D. Enzyme‐gold nanoparticle bioconjugates: Quantification of particle stoichiometry and enzyme specific activity. In Methods in Molecular Biology: NanoBiotechnology Protocols, 2nd ed. Humana Press: Totowa, NJ‚ submitted. [12] Alexa Fluor® 488 Protein Labeling Kit, Life Technologies Corporation (2012) http://products.invitrogen.com/ivgn/product/A10235?ICID=search‐product (2012‐09‐14) [13] Vladimir M. Mekler, Olga V. Belonogova, Victor I. Nikulin. (1994) Photochemical mimetics of chromogenic catalymetric reactions of arylamines in water solutions. Journal of Photochemistry and Photobiology, vol. 87, Issue 3, ss. 243‐247. [14] Jacqueline D. Keighron and Christine D. Keating. (2010) Enzyme: Nanoparticle Bioconjugates with Two Sequential Enzymes: Stoichiometry and Activity of Malate Dehydrogenase and Citrate Synthase on Au Nanoparticles, Langmuir 2010, 26(24), 18992–19000.

26
Appendix A
www.tedpella.com/gold_html/page‐193.jpg