characterization of a pre-trajan wall structure by ... fileoppio (rome historical centre), near the...
TRANSCRIPT

HAL Id: hal-01022030https://hal.inria.fr/hal-01022030
Submitted on 10 Jul 2014
HAL is a multi-disciplinary open accessarchive for the deposit and dissemination of sci-entific research documents, whether they are pub-lished or not. The documents may come fromteaching and research institutions in France orabroad, or from public or private research centers.
L’archive ouverte pluridisciplinaire HAL, estdestinée au dépôt et à la diffusion de documentsscientifiques de niveau recherche, publiés ou non,émanant des établissements d’enseignement et derecherche français ou étrangers, des laboratoirespublics ou privés.
Characterization of a Pre-Trajan Wall Structure byIntegrated Geophysical Methods
Luciana Orlando, Ettore Cardarelli, Michele Cercato, Giorgio De Donno,Beatrice Renzi
To cite this version:Luciana Orlando, Ettore Cardarelli, Michele Cercato, Giorgio De Donno, Beatrice Renzi. Charac-terization of a Pre-Trajan Wall Structure by Integrated Geophysical Methods. Le Cam, Vincentand Mevel, Laurent and Schoefs, Franck. EWSHM - 7th European Workshop on Structural HealthMonitoring, Jul 2014, Nantes, France. 2014. <hal-01022030>

CHARACTERIZATION OF A PRE-TRAJAN WALL STRUCTURE BY
INTEGRATED GEOPHYSICAL METHODS
Luciana Orlando1, Ettore Cardarelli
1, Michele Cercato
1, Giorgio De Donno
1, Beatrice Renzi
1
1“Sapienza” University of Rome – D.I.C.E.A. Via Eudossiana, 18 00184 Rome, Italy
ABSTRACT
The aim of this study is the characterization of a pre-Trajan wall structure decorated
with mosaics and located below the Cryptoporticus of the “Baths of Trajan” complex
in Rome. The surveyed wall is 15 m large and 0.9 m wide, with an height ranging from
3 to 5 m.
Ground Penetrating Radar (GPR) and Seismic Refraction Tomography profiles were
performed on the wall for reconstructing its inner geometry as well as characterizing its
building materials, with the additional purposes of mapping fractures and evaluating
seismic velocities of materials, to give safety indications before restarting the
excavation.
The wall was surveyed with horizontal and vertical massive GPR profiles and with two
seismic lines.
Both the seismic lines and the GPR profiles are able to detect the discontinuity
between the two different materials forming the wall, confirming the consistency of the
joint interpretation of the two different non-invasive techniques. Moreover they
allowed us to locate weak materials and fractures. These results will be used for
planning a safety project for the future archaeological excavations.
We demonstrate that this approach constitutes an important tool for the
characterization of the current status of an archaeological wall.
KEYWORDS : pre-Trajan wall, Sesimic Tomography, Ground Penetrating Radar,
mapping fractures
INTRODUCTION
Over the past few decades, non-invasive geophysical techniques have been successfully applied for
the safety assessment of ancient structures to support forthcoming archaeological investigations.
Despite the large amount of applications, a unified approach for data acquisition and monitoring is
still lacking, because the peculiar characteristics of each archaeological site prevent from using a
standardized procedure.
GPR has been widely used for archaeological prospection in recent years, since it can rapidly
provide important information about the location and the geometry of buried bodies, without any
damage to the structure under investigation; in fact, GPR has been successfully applied to detect
and characterize ancient structures (e.g. Orlando and Slob 2009; Cataldo et al. 2012) and to locate
Roman buildings (e.g. Neubauer et al. 2002; Piro et al. 2003), confirming the capability of the GPR
method for detecting buried structures, cavities and hidden objects in the shallow subsurface or
within ancient buildings to assess the current state of the structure and give safety indications to the
archaeologists.
On the other hand, seismic tomography has been used to reconstruct an high-resolution image
of structures and ancient buildings (e.g. Cardarelli and de Nardis 2001; Polymenakos et al. 2005)
with the primary aim to assess the elastic rock properties.
In the scientific literature on the subject, only a few studies concerned the application of multi-
method non-destructive testing for monitoring cultural heritage, encompassing GPR and seismic
7th European Workshop on Structural Health MonitoringJuly 8-11, 2014. La Cité, Nantes, France
Copyright © Inria (2014) 1809

tomography (e.g. Orlando and Renzi 2013; Perez-Gracia et al. 2013) or GPR and Electrical
Resistivity Tomography (e.g. Grangeia et al. 2011).
This study is focused on an integrated application of geophysical methods (GPR and seismic
refraction and transmission tomography) to characterize an archaeological wall of pre-Trajan age.
The investigated wall is located under the Cryptoporticus of the “Baths of Trajan” at the Colle
Oppio (Rome historical centre), near the Domus Aurea complex. It was discovered during the latest
archaeological campaign (2012) by the Sovrintendenza Comunale ai Beni Architettonici (City of
Rome – Authority of Cultural Heritage). The wall is 15 m large and 0.9 m wide, with an height
ranging from 3 to 5 m, and it is partially decorated with mosaics, probably representing the God
Apollo and the Muses (Fig. 1).
Figure 1 : Rectified image of the pre-Trajan wall.
This wall is probably only a part of a 300 m2 Roman domus, that is expected to be fully
excavated in a future archaeological campaign. Hence, the Authority needs to assess the integrity of
the wall to avoid any possible collapse during the planned future excavations. In light of this, it was
also crucial to map the materials constituting the wall (travertine and bricks), because they are
largely covered by plaster and mosaics (Fig. 1). In particular, a preliminary visual survey indicates
that probably the bricks are superimposed to the travertine that is located mainly in the central part
of the wall (y=1.5-3.0 m in Fig. 1).
The proposed investigation procedure involves the sequential application of GPR and seismic
tomography. These techniques are low-budget, rapid and their integrated application can provide
important information about the composition and the geometry of the wall, an extensive mapping of
fractures and anomalies embedded within the wall and eventually the correlation between different
physical and mechanical parameters.
1 DATA ACQUISITION AND PROCESSING
A preliminary GPR screening involved three different frequencies (600 MHz, 900 MHz and 2 GHz)
with different layouts and materials used for the protection of the surface mosaics. We chose the
900 MHz frequency for the whole investigation (Fig.2, left), as it was found to have, for this
application, the best trade-off between resolution and depth of investigation.
The surface of the wall was divided into 50x300 cm geo-referenced panels (Fig. 2, right), made
by plywood and polystyrene, deployed above the wall to preserve the integrity of the mosaics,
although reducing the signal penetration. Vertical and horizontal GPR profiles spaced 20 cm apart
were acquired (Fig. 3) according to this layout.
In addition, two seismic profiles were acquired on the wall (Fig. 3): a vertical profile for a
seismic refraction tomography (S1) and a seismic transmission tomography in the upper part of the
wall (S2).
EWSHM 2014 - Nantes, France
1810

Figure 2 : 900 MHz antenna (left) and plywood panels (right).
The S1 profile (Fig.4, left) is 3 m long and consists of 23 sensors spaced 13 cm apart. The
sensors are piezo-electric accelerometers with a cutoff frequency of 4 kHz. In order to avoid any
damage to the wall and to enhance the signal-to-noise ratio, the contact between wall and sensors
was implemented by using sticking plasters and silicone. The profile was collected using 13 shot
points (operating a 2 kg hammer source) with a sample rate of 31.5 micro-s.
For the S2 profile we employed the same instrumentation with 23 sensors spaced 15 cm apart,
while the 19 shot points are located on the investigated side of the wall and the receivers on the
opposite part (Fig.4, right).
The parameters employed for data acquisition are reported in Table 1.
Table 1 : Acquisition details for the GPR and seismic investigations.
Survey Acquisition details
Ground
Penetrating
Radar
Spacing: 20 cm (x and y directions)
Covering material: plywood and polystyrene
Device: IDS 900MHz antenna
Seismic
tomography
Receivers: 23 piezo-electric sensors 13 cm (S1) and
15cm (S2) spaced, with cut-off frequency 4kHz
Shots: 12 (L1) and 19 (L2) shot points
Device: 2 Seismographs Geode Geometrics
For each shot gather and for both acquisition geometry (S1 and S2), the first arrivals were
manually picked and the traveltimes computed as the difference between the shot instant and the
first breaks of the wave. Then, seismic tomography was performed employing the linear traveltime
interpolation (LTI) method for ray-tracing (Asakawa and Kawanaka 1993; Cardarelli and de Nardis
2001) and the iterative biconjugate gradient algorithm for traveltime inversion (Cardarelli and
Cerreto 2002).
2 RESULTS AND DISCUSSION
Firstly, GPR data processing (time zero correction, vertical band pass filter (200-1500 MHz), an
horizontal band pass filter, linear gain and migration) was tuned to improve the signal-to-noise ratio
and make easier the data interpretation. The time-depth conversion was obtained using a velocity of
9 cm/ns, evaluated by fitting the diffractions with the theoretical hyperbola. The interpretation is
based on the results derived from both the horizontal and vertical profiles and from the horizontal
sections at different times (time slices).
EWSHM 2014 - Nantes, France
1811

Figure 3 : Location of GPR and seismic profiles.
Figure 4 : S1 (left) and S2 (right) seismic profiles.
An example of unmigrated vertical and horizontal profiles (located as indicated in Fig. 3) is
shown in Fig. 5. The vertical profile (Fig. 5a) is situated along the transition zone between the
bricks and the travertine while the horizontal profile (Fig. 5b) is acquired entirely on the travertine.
The GPR profiles show different signatures of the two materials in terms of signal attenuation and
intensity of scattering. In fact, although the GPR investigates the whole thickness of the wall (90
cm) in the travertine part, only a depth of 40 cm is visible in the bricks (Figs. 5a and 5b), due to the
higher signal attenuation.
When the analysis is performed on the time-slices, we can retrieve additional information
about the composition of the wall and the location of anomalies and fractures.
More specifically, considering the time-slice computed over the entire wall (90 cm) using true
amplitude vertical profiles without the application of a gain (Fig. 6a), we detected an high energy
zone situated in the lower part of the wall (travertine blocks) and a low energy zone in the higher
part. Furthermore, since the scattering energy varies significantly passing from the left part of the
slice (x=0-4 m), to the right part (x = 4-12 m), the travertine blocks exhibit different properties
probably related to either composition or quality.
EWSHM 2014 - Nantes, France
1812

Figure 5 : A-A' (a) and B-B' (b) GPR profiles (see Fig.3 for the location of profiles)
The shallower time-slices (z=20 and 40 cm, Figs. 6b and 6c), calculated using the horizontal
profiles, show different anomalies both in the travertine and in the bricks, mainly located on two
main rows (y=2 and 3 m) and probably related to construction elements embedded within the
structure.
Starting from this extensive GPR mapping, the seismic tomography is employed for retrieving
the physical and mechanical parameters of the investigated structure.
The inverted section of the seismic tomography S1 (Fig. 7b) detected two main zones in the z-
direction, according to the respective GPR profile (Fig.7a): the shallower (up to 40 cm) having a P-
wave velocity ranging from 400 to 700 m/s and a maximum depth of 50 cm and the deeper with a
P-wave velocity of about 800-1000 m/s. We underline that where ray coverage is poor or absent the
algorithm colours the pixel in white. In addition to this, the P-wave velocity decreases passing from
travertine to bricks (x=1.4-1.5 m in Fig. 7b). Therefore, the investigated wall exhibits an high
degree of heterogeneity not only in the x- and y-directions but also in depth, where the shallower
part exhibits lower P-wave velocities when compared to those referable to deeper zones.
The inverted model of the seismic tomography S2 (Fig.8) provides a P-wave velocity
distribution that confirms the heterogeneity of the materials constituting the wall. In particular, the
high velocity zones (800-1200 m/s) are located near the wall surfaces, whereas the inner part of the
wall is characterized by lower velocities (400-700 m/s).
EWSHM 2014 - Nantes, France
1813
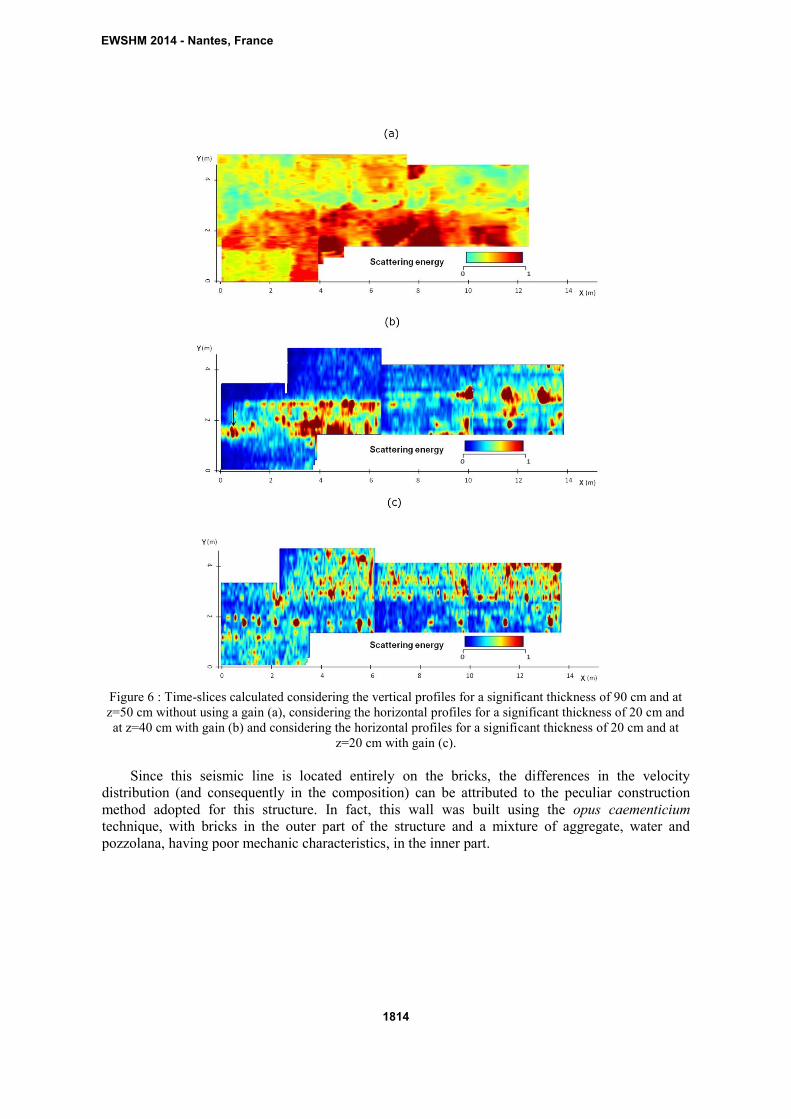
Figure 6 : Time-slices calculated considering the vertical profiles for a significant thickness of 90 cm and at
z=50 cm without using a gain (a), considering the horizontal profiles for a significant thickness of 20 cm and
at z=40 cm with gain (b) and considering the horizontal profiles for a significant thickness of 20 cm and at
z=20 cm with gain (c).
Since this seismic line is located entirely on the bricks, the differences in the velocity
distribution (and consequently in the composition) can be attributed to the peculiar construction
method adopted for this structure. In fact, this wall was built using the opus caementicium
technique, with bricks in the outer part of the structure and a mixture of aggregate, water and
pozzolana, having poor mechanic characteristics, in the inner part.
EWSHM 2014 - Nantes, France
1814

Figure 7 : C-C' GPR Profile (a) and inverted model of the seismic line S1 (b) (see Fig.3 for location of
profile).
Figure 8 : Inverted model of the seismic line S2 (b) along the D-D' profile (see Fig.3 for location of profile).
CONCLUSION
The use of integrated geophysical methods, as GPR and seismic tomography, allowed us to
characterize a pre-Trajan Roman structure, to assess the conservation status of the construction
materials and to locate the major fractures and discontinuities, giving also quantitative indications
about their geometry and typology. As a result we present in Fig. 9 the reconstructed model of the
wall, where discontinuities and anomalies are highlighted. In particular, discontinuities were
detected through the combined analysis of the GPR vertical and horizontal profiles and of the time-
slices in both the travertine and the bricks. Where the time-slices are mapped without using a gain,
the differences in terms of quality and composition of the construction materials become more
evident, because the attenuation is directly correlated to the lithology.
In addition to this, the two seismic profiles confirm the evidences derived from GPR, stressing
the difference between the two construction typologies (S1) or among the same typology (S2), in
the case of an high degree of heterogeneity, highlighting the low-velocity zones, corresponding to
poor mechanical properties.
The resulting high-resolution mapping of the wall reported in Fig. 9 confirms the consistency
of the joint interpretation of different non-invasive techniques. These findings can help the
archaeologists to plan accurately the future excavations, in order to preserve the integrity of the wall
EWSHM 2014 - Nantes, France
1815
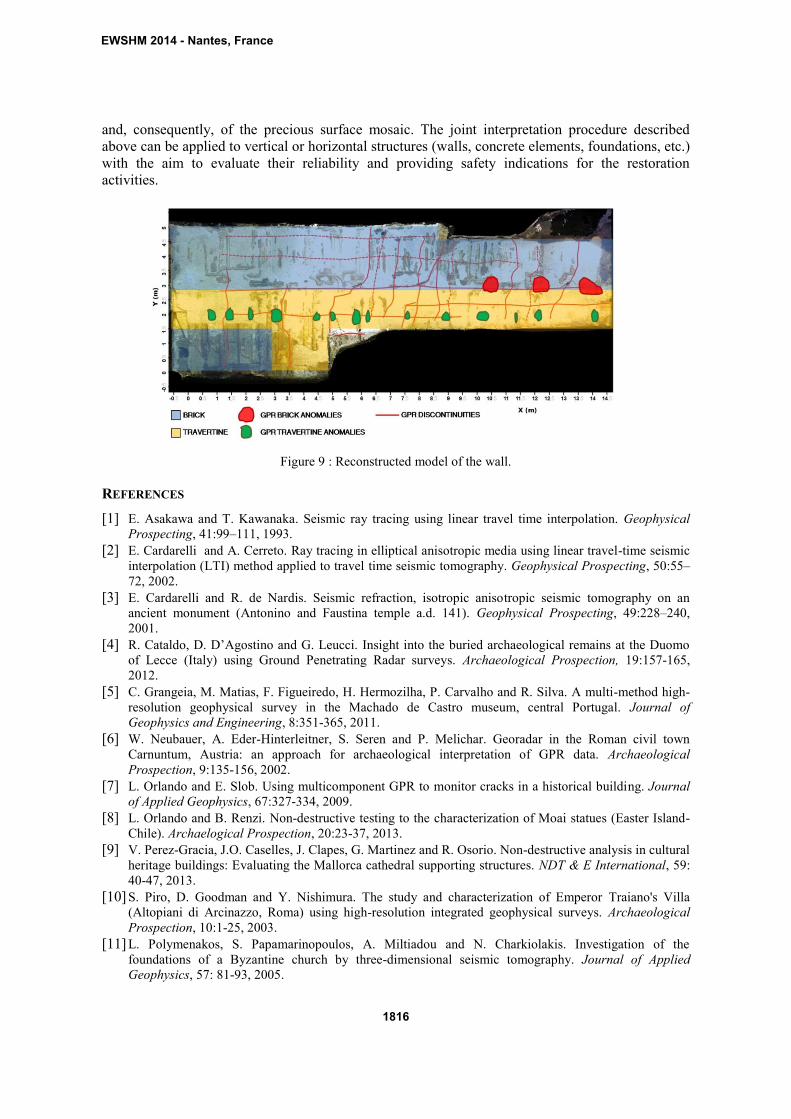
and, consequently, of the precious surface mosaic. The joint interpretation procedure described
above can be applied to vertical or horizontal structures (walls, concrete elements, foundations, etc.)
with the aim to evaluate their reliability and providing safety indications for the restoration
activities.
Figure 9 : Reconstructed model of the wall.
REFERENCES
[1] E. Asakawa and T. Kawanaka. Seismic ray tracing using linear travel time interpolation. Geophysical
Prospecting, 41:99–111, 1993.
[2] E. Cardarelli and A. Cerreto. Ray tracing in elliptical anisotropic media using linear travel-time seismic
interpolation (LTI) method applied to travel time seismic tomography. Geophysical Prospecting, 50:55–
72, 2002.
[3] E. Cardarelli and R. de Nardis. Seismic refraction, isotropic anisotropic seismic tomography on an
ancient monument (Antonino and Faustina temple a.d. 141). Geophysical Prospecting, 49:228–240,
2001.
[4] R. Cataldo, D. D’Agostino and G. Leucci. Insight into the buried archaeological remains at the Duomo
of Lecce (Italy) using Ground Penetrating Radar surveys. Archaeological Prospection, 19:157-165,
2012.
[5] C. Grangeia, M. Matias, F. Figueiredo, H. Hermozilha, P. Carvalho and R. Silva. A multi-method high-
resolution geophysical survey in the Machado de Castro museum, central Portugal. Journal of
Geophysics and Engineering, 8:351-365, 2011.
[6] W. Neubauer, A. Eder-Hinterleitner, S. Seren and P. Melichar. Georadar in the Roman civil town
Carnuntum, Austria: an approach for archaeological interpretation of GPR data. Archaeological
Prospection, 9:135-156, 2002.
[7] L. Orlando and E. Slob. Using multicomponent GPR to monitor cracks in a historical building. Journal
of Applied Geophysics, 67:327-334, 2009.
[8] L. Orlando and B. Renzi. Non-destructive testing to the characterization of Moai statues (Easter Island-
Chile). Archaelogical Prospection, 20:23-37, 2013.
[9] V. Perez-Gracia, J.O. Caselles, J. Clapes, G. Martinez and R. Osorio. Non-destructive analysis in cultural
heritage buildings: Evaluating the Mallorca cathedral supporting structures. NDT & E International, 59:
40-47, 2013.
[10] S. Piro, D. Goodman and Y. Nishimura. The study and characterization of Emperor Traiano's Villa
(Altopiani di Arcinazzo, Roma) using high-resolution integrated geophysical surveys. Archaeological
Prospection, 10:1-25, 2003.
[11] L. Polymenakos, S. Papamarinopoulos, A. Miltiadou and N. Charkiolakis. Investigation of the
foundations of a Byzantine church by three-dimensional seismic tomography. Journal of Applied
Geophysics, 57: 81-93, 2005.
EWSHM 2014 - Nantes, France
1816