characterization of 1mm lead-free joints. test results (dic 2d) 2 3 1 4
Post on 22-Dec-2015
213 views
TRANSCRIPT

Characterization of 1mm lead-free joints

Test results (DIC 2D)Measured stress-strain curves (DIC)
0.00E+00
1.00E+07
2.00E+07
3.00E+07
4.00E+07
5.00E+07
6.00E+07
0 0.005 0.01 0.015 0.02 0.025 0.03
1A
1B
1C
2A
2B
2C
3A
3B
3C
4A
4B
4C
2
31
4

Experimental results Measured stress-strain curves:
Improved resolution/noise with 2D DIC: Displacement +/-0.2 microns, strain +/- 2E-4 Correction of the out of plane displacement effects
Apparent properties and variability:
Plate Apparent yield stress var +/- Ultimate stress var +/- Hardening var +/-1 22.8 6.6% 43.0 5.8% 20.2 11.2%2 32.7 7.7% 52.8 4.7% 20.1 4.2%3 29.0 5.2% 46.7 2.7% 17.7 15.6%4 35.2 2.8% 49.3 6.4% 14.1 15.2%
Overall 29.9 25.1% 47.9 15.3% 18.0 27.5%
Large variability between plates, lower variability for a given plate
effects of processing parameters / microstructure ?

Plasticity - damage evolution (1B)Stress-strain curve 1B
0.00E+00
5.00E+06
1.00E+07
1.50E+07
2.00E+07
2.50E+07
3.00E+07
3.50E+07
4.00E+07
4.50E+07
5.00E+07
0 0.002 0.004 0.006 0.008 0.01 0.012 0.014
strain
stre
ss

Plasticity - damage evolution (2B)Stress-strain curve 2B
0.00E+00
1.00E+07
2.00E+07
3.00E+07
4.00E+07
5.00E+07
6.00E+07
0 0.001 0.002 0.003 0.004 0.005 0.006
strain
stre
ss

Plasticity - damage evolution (3A)Stress-strain curve 3A
0.00E+00
5.00E+06
1.00E+07
1.50E+07
2.00E+07
2.50E+07
3.00E+07
3.50E+07
4.00E+07
4.50E+07
5.00E+07
0 0.005 0.01 0.015 0.02 0.025 0.03
strain
stre
ss

Plasticity - damage evolution (4A)Stress-strain curve 4A
0.00E+00
5.00E+06
1.00E+07
1.50E+07
2.00E+07
2.50E+07
3.00E+07
3.50E+07
4.00E+07
4.50E+07
5.00E+07
-0.002 0 0.002 0.004 0.006 0.008 0.01 0.012 0.014 0.016
strain
stre
ss
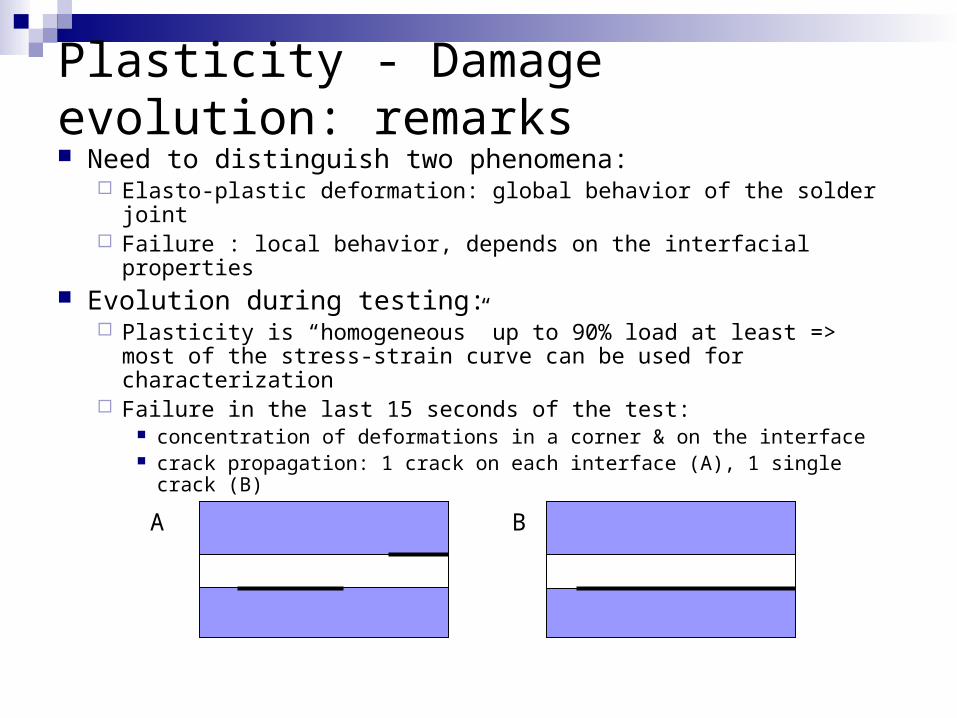
Plasticity - Damage evolution: remarks Need to distinguish two phenomena:
Elasto-plastic deformation: global behavior of the solder joint Failure : local behavior, depends on the interfacial properties
Evolution during testing: Plasticity is “homogeneous” up to 90% load at least => most of
the stress-strain curve can be used for characterization Failure in the last 15 seconds of the test:
concentration of deformations in a corner & on the interface crack propagation: 1 crack on each interface (A), 1 single crack (B)
A B

Characterization: 3D FE modelling
Inside
Outside
3D model: better accuracy & numerical stability,but resolution time x 2.
Average Strain: 2%Max Strain: 10%

Plasticity evolution
Stress-strain curve 1B
0.00E+00
5.00E+06
1.00E+07
1.50E+07
2.00E+07
2.50E+07
3.00E+07
3.50E+07
4.00E+07
4.50E+07
5.00E+07
0 0.002 0.004 0.006 0.008 0.01 0.012 0.014
strain
stre
ss

Characterization: identification
~1h / 40 FE solutions to identify the material properties, parameters: E, yield stress, hardening, exp. Hardening rateAccuracy: max error +/-4% !!

Identification results: constraining effects1B 2A
3A
0.00E+00
1.00E+07
2.00E+07
3.00E+07
4.00E+07
5.00E+07
6.00E+07
0 0.005 0.01 0.015 0.02 0.025
Constrained
Unconstrained
0.00E+00
1.00E+07
2.00E+07
3.00E+07
4.00E+07
5.00E+07
6.00E+07
0 0.005 0.01 0.015 0.02 0.025
Constrained
Unconstrained
0.00E+00
1.00E+07
2.00E+07
3.00E+07
4.00E+07
5.00E+07
6.00E+07
0 0.005 0.01 0.015 0.02 0.025
Constrained
Unconstrained
0.00E+00
1.00E+07
2.00E+07
3.00E+07
4.00E+07
5.00E+07
6.00E+07
0 0.005 0.01 0.015 0.02 0.025
Constrained
Unconstrained
4B

Constitutive stress-strain curvesConstitutive Stress Strain curves
0.00E+00
5.00E+06
1.00E+07
1.50E+07
2.00E+07
2.50E+07
3.00E+07
3.50E+07
4.00E+07
4.50E+07
5.00E+07
0 0.005 0.01 0.015 0.02 0.025
Strain
Str
es
s
1B
2A
2B
3A
3B

Next steps Testing:
0.5 mm & 0.2 mm joints Reinforced solder joints Split testing in 2 procedures:
A simple one to compare materials A complete test for characterization
Developpments Bulk solder specimen (FEM =>Design =>production) A better test specimen for joints ?
Shear test (Nokia)? Tensile test ?