characterization and treatment of brine wastewaters from...
TRANSCRIPT

UNC-WRRI-75-99
CHARACTERIZATION AND TREATMENT OF BRINE WASTEWATERS
FROM THE CUCUMBER PICKLE INDUSTRY
Linda W. LittleJames C. Lamb IIILouise F. Horney
UNC Wastewater Research CenterDepartment of Environmental Sciences and Engineering
School of Public HealthUniversity of North Carolina at Chapel Hill
The work upon which this publication is based wassupported in part by funds provided by the Office ofWater Research and Technology, U. S. Department ofthe Interior, through the Water Resources ResearchInstitute of The University of North Carolina asauthorized under the Water Resources Research Actof 1964, as amended, and in part by funds provided byPickle Packers International, Inc., St. Charles,I l l ino i s .
Project No. A-079-NCAgreement No. 14-31-0001-4033, FY 1974
May, 1976
ESE Publication No. 399

TABLE OF CONTENTS
P a g e
ACKNOWLEDGMENTS . . . . . . . . . . . . . . . . . . . . . . . . . . . . . . . . . . . . . . . . . . . . . . . . . . . . . .
ABSTRACT . . . . . . . . . . . . . . . . . . . . . . . . . . . . . . . . . . . . . . . . . . . . . . . . . . . . . . . . . . . . .
LIST OF FIGURES . . . . . . . . . . . . . . . . . . . . . . . . . . . . . . . . . . . . . . . . . . . . . . . . . . . . . .
LIST OF TABLES . . . . . . . . . . . . . . . . . . . . . . . . . . . . . . . . . . . . . . . . . . . . . . . . . . . . . .
SUMMARY AND CONCLUSIONS . . . . . . . . . . . . . . . . . . . . . . . . . . . . . . . . . . . . . . . . . . . . . .
RECOMMENDATIONS . . . . . . . . . . . . . . . . . . . . . . . . . . . . . . . . . . . . . . . . . . . . . . . . . . . . . .
V
vi
vii
v i i i
x i i
xv
INTRODUCTION 1. . . . . . . . . . . . . . . . . . . . . . . . . . . . . . . . . . . . . . . . . . . . . . . . . . . . . . . . . . .General Description of the Pickle Industry 1. . . . . . . . . . . . . . . . . . . . . . . . . . .Growth Projections of the Pickle Industry 3. . . . . . . . . . . . . . . . . . . . . . . . . . . .Product Description, Styles, and Types of Packs . . . . . . . . . . . . . . . . . . . . . .Pickle Production and the Wastewaters Generated
2
Previous Studies on Reduction of Wastes from Pickle Packing . . . . . . . . . 10Modification of In-Plant Procedures to Reduce Waste 12. . . . . . . . . . . . . . . . . .
CHARACTERIZATION OF WASTEWATER GENERATED IN PICKLE MANUFACTURE . . . . . . . . . 14Tankyard Wastes 14. . . . . . . . . . . . . . . . . . . . . . . . . . . . . . . . . . . . . . . . . . . . . . . . . . . . . .Wastewaters from Processing and from Other Operations . . . . . . . . . . . . . . . . 18Water Usage . . . . . . . . . . . . . . . . . . . . . . . . . . . . . . . . . . . . . . . . . . . . . . . . . . . . . . . . . . 22Overall Plant Wastewaters . . . . . . . . . . . . . . . . . . . . . . . . . . . . . . . . . . . . . . . . . . . . 23Potential for Ground Water Contamination . . . . . . . . . . . . . . . . . . . . . . . . . . . . . 47Discussion and Conclusions . . . . . . . . . . . . . . . . . . . . . . . . . . . . . . . . . . . . . . . . . . . 48
-LABORATORY EVALUATION OF COAGULATION-PRECIPITATION AND ULTRAFILTRA-TION FOR REGENERATION OF STORAGE BRINES . . . . . . . . . . . . . . . . . . . . . . . . . . . . . . . . 49
Coagulation-Precipitation . . . . . . . . . . . . . . . . . . . . . . . . . . . . . . . . . . . . . . . . . . . . 49Ultrafi l tration . . . . . . . . . . . . . . . . . . . . . . . . . . . . . . . . . . . . . . . . . . . . . . . . . . . . . . 53Discussion and Conclusions . . . . . . . . . . . . . . . . . . . . . . . . . . . . . . . . . . . . . . . . . . . 63
PILOT-SCALE EVALUATION OF COAGULATION-PRECIPITATION FOR REGENERATIONOF 36-HOUR AND SPENT BRINES . . . . . . . . . . . . . . . . . . . . . . . . . . . . . . . . . . . . . . . . . . . .
Regeneration of 36-40 Hour Brine65
. . . . . . . . . . . . . . . . . . . . . . . . . . . . . . . . . . . . . 65Regeneration of Spent Brine 70. . . . . . . . . . . . . . . . . . . . . . . . . . . . . . . . . . . . . . . . . .Discussion and Conclusions 73. . . . . . . . . . . . . . . . . . . . . . . . . . . . . . . . . . . . . . . . . . .
i i i

TABLE OF CONTENTS (continued)
Page--_ -
BIOLOGICAL TREATMENT OF WASTEWATERS FROM CUCUMBER PICKLING . . . . . . . . . . . 75Introduction . . . . . . . . . . . . . . . . . . . . . . . . . . . . . . . . . . . . . . . . . . . . . . . . . . . . . . . 75Goals of Biological Treatment . . . . . . . . . . . . . . . . . . . . . . . . . . . . . . . . . . . . . . 75Types of Biological Treatment Systems . . . . . . . . . . . . . . . . . . . . . . . . . . . . . . 76Applications in Pickle Industry . . . . . . . . . . . . . . . . . . . . . . . . . . . . . . . . . . . . 78Effects of Treated Effluent on Receiving Streams . . . . . . . . . . . . . . . . . . . 80Conclusions . . . . . . . . . . . . . . . . . . . . . . . . . . . . . . . . . . . . . . . . . . . . . . . . . . . . . . . . 81
R E F E R E N C E S . . . . . . . . . . . . . . . . . . . . . . . . . . . . . . . . . . . . . . . . . . . . . . . . . . . 8 2
LIST OF PUBLICATIONS . . . . . . . . . . . . . . . . . . . . . . . . . . . . . . . 85
G L O S S A R Y . . . . . . . . . . . . . . . . . . . . . . . . . . . . . . . . . . . . . . . . . . . . . . . . . . . . . . 86
APPENDICES . . . . . . . . . . . . . . . . . . . . . . . . . . . . . . . . . ......... 87Appendix A. Industrial Wastewater Survey of a Cucumber Pickle Plant 87Appendix B. Cos t o f P ick le Br ine Recovery . . . . . . . . . . . . . 113
iv

ACKNOWLEDGMENTS
This project was conducted by faculty and students of the Department ofEnvironmental Sciences and Engineering, School of Public Health, Universityof North Carolina at Chapel Hill.
The project was supported by the Water Resources Research Institute ofThe University of North Carolina and by Pickle Packers International, Inc.,Saint Charles, Illinois. A major factor making this report possible was theexcellent cooperation by members of PPI, especially the PPI Ecology Committeechaired by Mr. Herman Blum of Vlasic Foods, Inc. Special recognition is dueto the management and staff of the three North Carolina pickle packers --Mount Olive Pickle Company, Mount Olive; Perfect Packed Products, Henderson;and Cates Pickle Company, Faison.
The interest and assistance of Mr. Thomas A. Bell of the USDA-ARS FoodFermentation Laboratory, Raleigh, N. C. were invaluable before and throughoutthe study.
Ms. Horney was supported by an Alumni Fellowship and by a Young CarolinianEnvironmental Fellowship from First Union National Bank.
The analytical assistance of the UNC Wastewater Research Center and theUNC Limnology Laboratory, especially their patience and perseverance in analyz-ing concentrated brine samples, is gratefully acknowledged.
Finally, thanks are due Mrs. Delores Plummer for her patient typing andretyping of the drafts and final manuscript.


ABSTRACT
Pickling is one of the oldest means of food preservation. Currently,
the U.S. cucumber pickle industry is a $500 million/year industry involving
39 states. Wastes from pickling operations are characterized by high chloride
content, high oxygen demand, low pH, and high total and suspended solids.
Waste treatment technology for removing suspended solids, reducing oxygen de-
mand, and neutralizing pH is available, but no economical method for removing
sal t i s avai lable . The pickling industry is faced with the task of drastically
reducing salt content of its effluents.
Industrial water and wastes surveys were conducted at two pickle companies.
Water usage and waste characteristics were determined on major unit operations,
including tankyard brining, desalting and processing, slicing and cutting opera-
tions, and pasteurization. Laboratory and pilot scale studies were performed
to evaluate potential for recycling concentrated tankyard brines. Both a high
pH coagulation-precipitation procedure and an ultrafiltration procedure were
investigated. A "desk-top" evaluation of various brine treatment processes
compared their cost-effectiveness.
The study indicated that in-plant water and salt usage could be substan-
tially reduced by closer management and better housekeeping; that tankyard
brines could be treated and reused at least once with no sacrifice of product
quality; and that existing wastewater treatment facili t ies (aerated lagoons)
could be upgraded to improve BOD and solids removal. Addi t ional ly , the resul ts
of the study provide a detailed characterization of the types and concentration
of components of waste streams from unit operations in cucumber pickle produc-
tion.
vi


LIST OF FIGURES
Page
1. Flow Chart of Typica1 Unit Processes in the Productionof Fresh-Pack and Processed Cucumber Pickles . . . . . . . . . . . . . . . . . . . . 6
2. Diagram of Layout of Plant A . . . . . . . . . . . . . . . . . . . . . . . . . . . . . . . . . . . 42
3. Retention of Ultrafilters . . . . . . . . . . . . . . . . . . . . . . . . . . . . . . . . . . . . . . . 53
4. Effect of Seri.al Ultrafil.tration on Pectinase Activityin 36-Hr Brine . . . . . . . . . . . . . . . . . . . . . . . . . . . . . . . . . . . . . . . . . . . . . . . . 60
5. Effect of Ultrafiltration on Pectinase Activity inSpent Brine . . . . . . . . . . . . . . . . . . . . . . . . . . . . 61
6. Flux During Serial Ultrafiltration . . . . . . . . . . . . . . . . . 62
Appendix A
1. Sketch of Sewer System at Plant . . . . . . . . . . . . . . . . . . . . . . . . . . . 94
2. Daily pH Monitoring of Lagoon Simulation Units . . . . . . . . . . . . . . . . . 103
3. Titration Curves for Untreated Wastewater . . . . . . . . . . . . . . . . . . . . . . 108
4. Effects of Low pH and High Salt Shock Loading Upon Respiration. . . . . 111
Appendix B
1. Schematic of Stream Flows in Pickle Processing . . . . . . . . . 118
vi i


LIST OF TABLES
Page
1. Production of Cucumbers for Pickles in 1972 . . . . . . . . . 2
2. Economic Aspects of Cucumber Production and Pickling Process-ing in North Carolina . . . . . . . . . . . . . . . . . . . . 3
3. Pickle Consumption in the United States . . . . . . . . . . . 3
4. Salt (.NaCl) Solution Conversion Chart . . . . . . . . . 7
5. Characteristics of Wastewaters from Pickle Manufacture . . . . . . . . 15
6. Characteristics of Wastewater from Unit Processes in PickleManufacture . . . . . . . . . . . . . . . . . . . . . . . . . . . . . . . . . . . . . . . . . . . . . . . . . . . . . 15
7. Analytical Procedures . . . . . . . . . . . . . . . . . . . . . . . . . . . . . . . . . . . . . . . . . . . 16
8. Characterization of Tankyard Brines from Cucumbers . . . . . . . . . . . . . . 17
9. Tankyard Brine Compared to Typical Domestic Sewage . . . . . . . . . . . . . . 18
10. Characteristics of 36-Hour Drain, Plant A, 1974 . . . . . . . . . . . . . . . . 19
11. Characterization of Tankyard Brines from MiscellaneousVegetables, Plant A, 1974 . . . . . . . . . . . . . . . . . . . . . . . . . . . . . . . . . . . . . . . 19
12. Characterization of Wastewater Flows from Processing VariousPickle Products . * . . . 7 . . . . . * . . . . . , . . . . . . . . . . . . . . . . . . . . . . . . . . . . . . 20
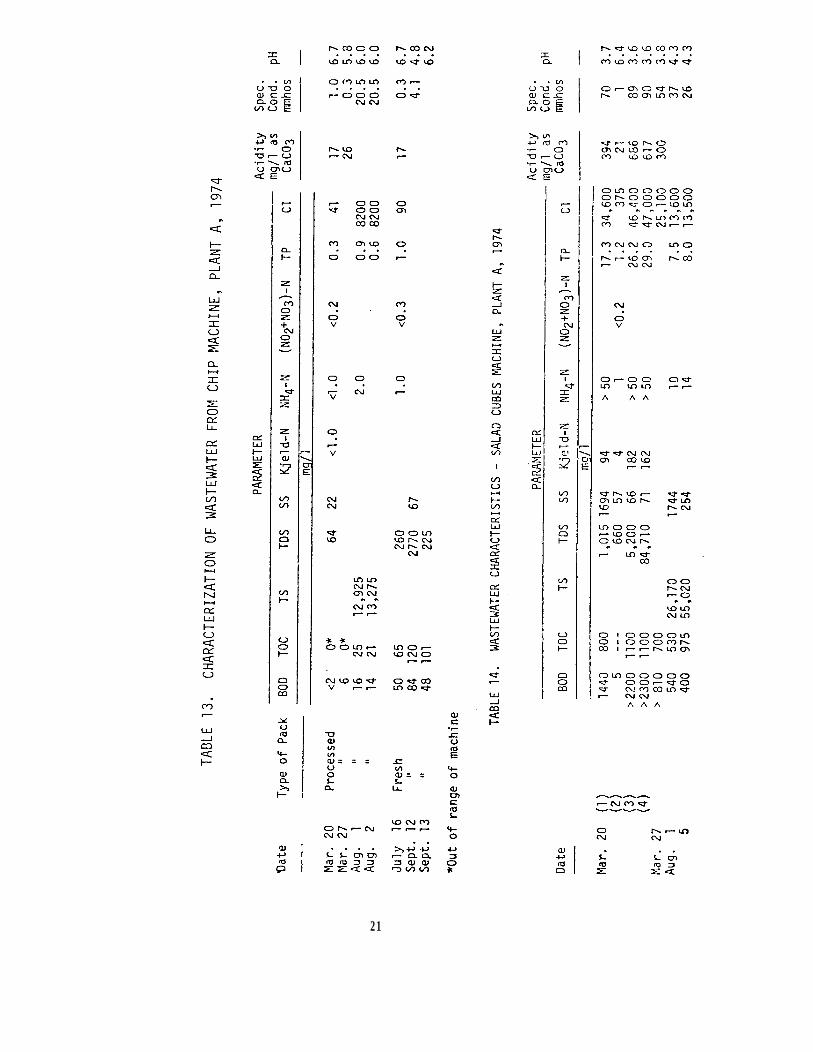
13. Characterization of Wastewater from Chip Machine, Plant A,1974 . . . . . . . . . . . . . . . . . . . . . 21
14. Wastewater Characteristics, Salad Cubes Machine, Plant A, 1974... 21
15. Characterization of Wastewater from Pricking Machine, Plant A . . . 22
16. Tankyard Water Usage, Plant A, March-August, 1974 . . . . . . . . . . . . . . . 24
17. Water Usage, Whole Pickle Machine, Plant A, June-July, 1974 . . . . . 29
18. Water Usage, Strip Machine, Plant A, July, 1974 . . . . . . . . . . . . . . . . . 30
v i i i

LIST OF TABLES (continued)
Page
19. Water Usage for Processing and Packaging Salad Cubes,Plant A, March-May, 1974 , . . . . . . . . . . . . . . . . . . . . . . . . . . . . . . . . . . . . 31
20. Water Usage, Chip Machine, Plant A, Processed Chips, SelectedDates . . . . . . . . . . . . . . . . . . . . . . . . . . . . . . . . . . . . . . . . . . . . . . . . . 32
21. Water Usage for Pricking Machine, Plant A., March-May, 1974 . . . . 33
22. Water Usage, Chips Machine, Plant A, Freshpack Season . . . . . . 35
23. Water Usage for Chip Machine, Plant A, March-May, 1974 . . . . . 36
24. Water Usage for Relish Machine, Plant A, May-June, 1974 . . . . . . 38
25. Water Usage, Pasteurizers, Plant A, March-August, 1974 . . . . . . . . . 39
26. Summary of Present and Potential Water Usage in Unit Operations. 43
27. Plant Waste Characteristics, Plant A, 1974 . . . . . . . . . . . . . . . . . . . . . 44
28. Plant Waste Characteristics, Plant B, 1974 . . . . . . . . . . . . . . . . . . . . . 45
29. Plant Waste Characteristics, Plant C, 1974 . . . . . . . . . . . . . . . . . . . . . 46
30. Effluent Discharge Volumes, Plant A, 1974 . . . . . . . . . . . . . . . . . . . . . . 47
31. Base or Acid Required for Spent Brine Coagulation-Precipitation. 51
32. Tank-Yard Brine Samples Before and After Coagulation-Precipitation . . . . . . . . . . . . . . . . . . . . . . . . . . . . . . . . . . . . . 52
33. Effect of Parallel Ultrafiltration on 36-Hr Brine . . . . . . . . . . . . . . 57
34. Effect of Serial Ultrafiltration (XM 300--> XM 50) on 36-Hr Brine 57
35. Effect of Standing on Pectinase Activity . . . . . . . . . . . . . . . . . . . . . . . 58
36. Effect of Serial Filtration (5.0 u -> UM 2) on 36-Hr Brine . . . . . . 59
37. Effect of Ultrafiltration (2000-10,000 MW Pores) on PectinaseActivity of Brine . . . . . . . . . . . . . 59
38. Experimental Design for Evaluation of Coagulation-Precipitationfor Regeneration of 36-40 Hr Brine . . . . . . . . . 65
39. Treatment of 36-Hr Brine by Lime-NaOH Addition . . . . . . . . . . . . 66
ix

40.
41.
42.
43.
44.
45.
46.
47.
LIST OF TABLES (continued)
Progress of Fermentation in New Brines and in Treated andUntreated 36-Hour Brines . . . . . . . . . . . . . . . . . . . . . . . . . . . . . . . . .
Quality of Brinestock Fermented in New, Treated, and Untreated36-Hour Brine . . . . . . . . . . . . . . . . .
Evaluation of Cucumber Pickles Brined in New, Untreated, andR e c y c l e d B r i n e s . . . . . . . . . . . . . . . . . . .
Experimental Design, Evaluation of Coagulation-Precipitationfor Regeneration of Spent Brine . . . . . . . . . . . . . . . . . . .
Treatment of Spent Brine by Lime-NaOH Addition . . . . . . . . . .
Quality of Brinestock Fermented in New Brines and in TreatedSpent Brines . . . . . . . . . . . . . . . . . . . . . . . . . . . . . . . .
Potassium Content of Brines During Fermentation of FreshCucumbers (2B and 3). . . . . . . . . . . . . . . . . . . . . . . . . . . . . . . . . . . . .
Progress of Fermentation of Fresh Cucumbers in New Brines and inTreated Spent Brines . . . . . . . . . . . . . . . . . . . . . . .
Appendix A . . . . . . . . . . . . . . . . . . . . . . . . . . . . . . . . . . . . . . . . . . . . . . . .
1.
2.
3.
4.
5.
6.
7A
7B
8.
Processing Room Grab Samples Collected Drain 15-B . . . . . . . . . . . . . .
Processing Room Data . . . . . . . . . . . . . . . . . . . . . . . . . . . . . . . . . . . . . . . . . . . .
Characteristics of Wastewater Flows from Manufacturing-PackingArea and from Pasteurizing Room . . . . . . . . . . . . . . . . . . . . . . . . . . . . . . . .
Characteristics of Wastewater Flows from Drains . . . . . . . . . . . . . . . .
Flows from Manufacturing Room-Line 6 . . . . . . . . . . . . . . . . . . . . . . . . . . .
Data from Preliminary Hydrasieve Trial . . . . . . . . . . . . . . . . . . . . . . . . .
Data from Treatability Studies . . . . . . . . . . . . . . . . . . . . . . . . . . . . . . . . .
Summary of Treatability Studies . . . . . . . . . . . . . . . . . . . . . . . . . . . . . . . .
67
68
69
70
71
71
71
72
87
95
96
97
98
99
99
105
106
Chemical Requirements for Neutralization . . . . . . . . . . . . . . . . . . . . . . . 107
X

LIST OF TABLES (continued)
Appendix B
1. Capital Cost Estimation . . . . . . . . . . . . . . . . . . . . . . . . . . . . . . . . . . . . 121
2. Annual Operating Costs . . . . . . . . . . . . , . . . . . . . . . . . . . . . . . . . . . . . 122
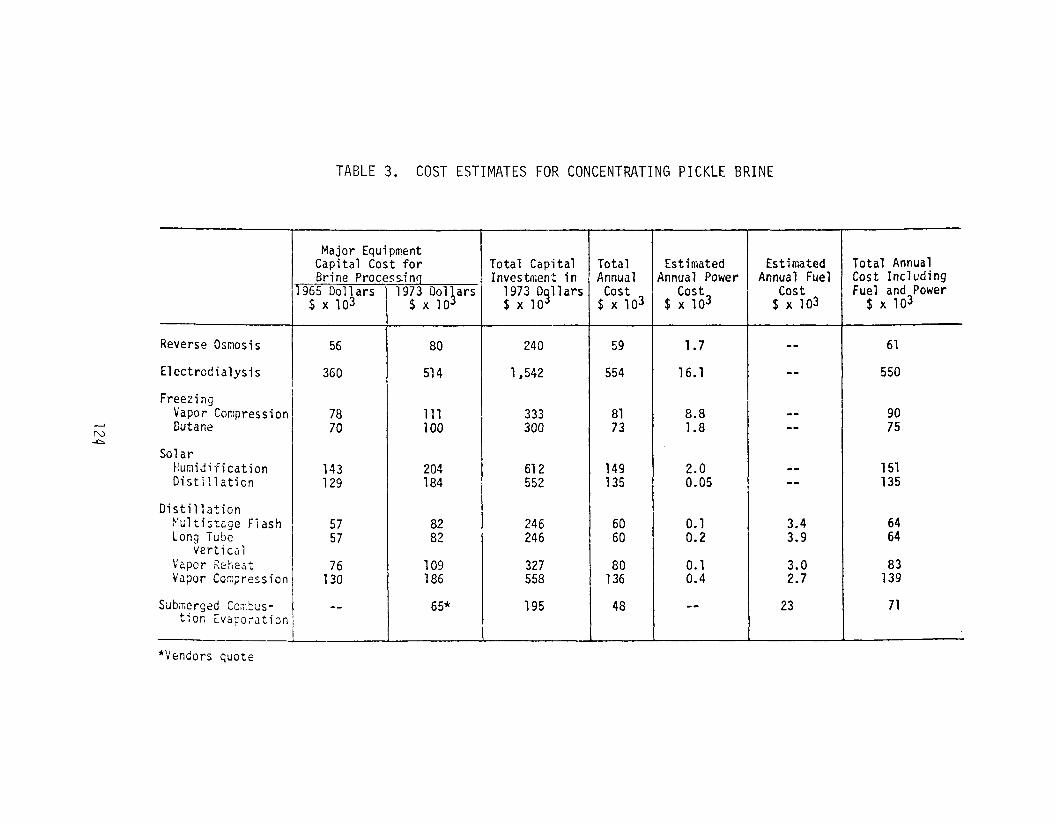
3. Cost Estimates for Concentrating Pickle Brines . . . . . . . . . . . . . 124
4. Cost Estimates for Organic Removal from Pickle Brine . . . . . . . 125

SUMMARY AND CONCLUSilONS
Pickling is one of the oldest means of food preservation. Currently,the U.S. cucumber pickle industry is a $500 million/year industry involving39 states. Wastes from pickling operations are characterized by high chloridecontent, high oxygen demand, low pH, and high total and suspended solids.Waste treatment technology for removing suspended solids, reducing oxygen de-mand, and neutralizing pH is available, but no economical method for removingsalt i s avai lable . The pickling industry is faced with the task of drasticallyreducing salt content of its effluents.
Industrial water and wastes surveys were conducted at two pickle companies.Water usage and waste characteristics were determined on major unit operations,including tankyard brining, desalting and processing, slicing and cutting opera-tions, and pasteurization. Laboratory and pilot scale studies were performedto evaluate potential for recycling concentrated tankyard brines. Both a highpH coagulation-precipitation procedure and an ultrafiltration procedure wereinvestigated. A "desk-top" evaluation of various brine treatment processescompared their cost-effectiveness.
Specific conclusions are as follows:
1. In general, wastewaters from cucumber pickling operations are character-ized by high chloride content, high oxygen demand, low pH, and high totaland suspended solids. Nutrient concentrations, especially Kjeldahl nitro-gen, are also appreciable.
2. Approximately 40-50% of each year's cucumber crop is fresh-packed (canned)rather than brined, and fresh-pack operations generally predominate duringthe period from May-August. Nevertheless, plant wastewater continues tobe characterized by high salt and organic carbon levels, since duringthis time 50-60% of the cucumbers are brined. The smaller cucumbers aredrained and rebrined after 36 hours and the "36-hour drain," containingabout 0.6 lb NaCl/gal and in addition organic carbon and other componentsleached from the cucumbers, is discharged.
3. Spent tankyard brines not only contain high concentrations of salt (l.O-1.6 lb NaCl/gal), but also, on the average, 3400 mg/l of organic carbon,330 mg/l of suspended solids, 730 mg/l of total Kjeldahl nitrogen, 90 mg/lof phosphorus,falls between
and 2300 mg/l of acidity (as CaC03). In addition the pH3 and 4. These brines have a high pollutional potential
and are much more concentrated than domestic sewage.
x i i

4. A major factor to consider in reuse of 36-hr and spent brines is theirsoftening enzyme (pectinase) content. Pectinase activity can be elimina-ted in these brines by coagulation-precipitation at high pH or by ultra-f i l t ra t ion .
5. Regeneration by high pH treatment involves raising pH of the brines to 11with lime and sodium hydroxide, followed by settling and neutralizationwith hydrochloric or acetic acid, Treatment of brines by this methodnot only eliminates pectinase activity but also removes phosphate anddrastically reduces bacterial populations. However, it does not removethe majority of the organic component as measured by TOC or COD analysis.
6. Brinestock brined in high pH treated brine (one reuse cycle) comparesfavorably with that brined in new brine.
7. Pickles packed as sweet or dill after brining in high pH treated brineare not significantly different in quality from those brined in newbrines.
8. Ultrafiltration of brines is another potential method of regeneration.In the laboratory, pectinase activity can be removed from 36-hr or spenttankyard brines by ultrafiltration through flat membranes with averagemolecular weight passthrough of 10,000 or less. Such treatment does notsignificantly reduce organics as measured by TOC or COD. Since the hollow-fiber membrane configuration is generally more efficient, it is possiblethat larger pore sizes could be used, with correspondingly greater fluxrate, in a full-scale application.
9. In the studies herein described, brine was reused only once. There issome question as to buildup of metals, organic compounds, or other materialsduring repeated reuse. In the long run, costs of treating brine will bedependent on whether elimination of pectinase activity alone will suffice,or whether removal of all organic compounds is necessary. Ultrafi l trationand high pH treatment appear to suffice for the former case; in the lattercase, other methods would be required.
10. It is estimated that at least 30% of the salt used is wasted because ofsalt spillage, tank leakage, and tank overflow.
11. Water requirements per unit of cucumbers handled vary widely within eachunit process. Part of the variation can be attributed to leakage, over-flow, or failure to close valves during times when the unit is not inoperation,
12. Desalting (processing) wastewaters are typically low pH and relativelyhigh in chloride concentration. In the first desalting water chloridelevels are about 40 gm Cl /l. Organic carbon levels are high and in gener-al the more finely divided the product, the higher the TOC, as well as theKjeldahl nitrogen and phosphorus levels, Apparently, the greater the sur-face area exposed to the processing water, the greater the loss of solublecomponents and fragments of cucumber tissue.
x i i i
13, Pickle plant wastes, with the exception of the salt, respond to biologicaltreatment provided sufficient detention time and sufficient oxygen areavailable. Neutralization of pH by addition of alkali appears to beunnecessary if sufficient aeration is provided to allow the aerobic degra-dation of the organic acids (such as lactic and acetic acids) in thewastewaters.
14. Observations on water use, salt handling, cucumber handling, and tankmanagement were conveyed to management personnel at Plants A and B. Atthe request of management at Plant A two additional presentations weresubsequently made to tankyard and line foremen and supervisors to acquaintthem with the relationship of conservation of water, salt, cucumbers, andother materials to reduction of volume and strength of wastewater and tooverall increase in net profits.
15. The work described herein has led to funding of a demonstration projectby the Environmental Protection Agency. The project will be conducted ata North Carolina pickle plant by scientists from North Carolina A & TState University (Greensboro) and the University of North Carolina atChapel Hill.
xiv


RECOMMENDATIONS
1. Due to the highly pollutional nature of tankyard brines the present wide-spread practices of discharging these brines untreated onto the tankyardor into a surface water should be discontinued. Instead, they should bereused or, if wasted, drained directly into a treatment facility ratherthan onto the ground where buildup is unsightly and causes odors, wherethey create a potential groundwater hazard, and where they are subjectto being washed by rain as "slugs" into the treatment system or receivingstream.
2. The use of fiberglass or other non-leaking tanks should be encouraged.If wooden tanks are used, leaks should be repaired promptly.
3. Strict supervision of dry salt and brine handling should be instituted toavoid salt loss. If 33% of the salt is presently wasted at a typicalplant using 10,000 tons/year, elimination of this wastage would resultin a savings of $72,600 (@ $22/T).
4. Water meters should be installed on lines serving each major unit process.Readings should be made at least daily, and unusually large volume re-quirements per unit of product should be investigated. Leaks, overflows,breaks in the waterline, and other mishaps should be corrected promptly.Water use studies indicate that 40-90% of the water currently used isunnecessary. Assuming a plant discharging 200,000 gallons per day (73million gallons per year) under present conditions cut water usage by 50%(a conservative value), the daily discharge would be cut to 100,000 gpd,effectively doubling the detention time in the wastewater treatment systemand the annual water usage would be cut to 36.5 million gallons. In watercosts alone, assuming a cost of $l/lOOO gallons, a savings of $36,500could be achieved.
5. Treatment and reuse of spent brines should be tested on a larger scale.Assume a plant using 6700 T of salt per year (10,000 at present, minus3.3 T saved by better housekeeping); assume 90 % of the 6 T remaining inthe spent brines can be recovered by coagulation-precipitation or ultra-f i l t ra t ion . Reuse of this 5.4 T would eliminate that load on thereceiving stream and in addition offer a potential savings in salt costs,depending on the cost of treatment. Costs of treatment can only be de-rived by further study on a larger scale.
6. Present treatment systems should be operated to conform to design capacity.Equipment for suspended solids removal is essential, and once in placeshould be closely monitored and maintained.reduced by water conservation.
Hydraulic loading should beMost important, dissolved oxygen concen-
xv

trations of at least 1 mg/l should be maintained in the aeration basins,Adequate oxygen is essential for BOD removal. In addition, if sufficientoxygen is available, neutralization of the influent by chemical additionis usually unnecessary, thus eliminating the costs, as well as the hazards,of strong alkalis such as sodium hydroxide or anhydrous ammonia. I t i sestimated that the cost of neutralizing 200,000 gallons per day of typicalpicklin wastewater with NaOH (@ $100 per ton as 50% strength) wouldexceed 55,000 per year.
7. The potential for reuse of pasteurizer water in cleanup or other areasshould be investigated. Alternatively, to reduce loading on the wastetreatment system the possibility of discharging the relatively cleanpasteurizer water to the municipal system should be investigated (as is al-ready the practice at some plants).
8. Since regeneration and reuse of brines is generally more feasible the moreconcentrated the brine, measures to reduce the volume of desalting watershould be investigated. One approach to this problem is the counter-current rinsing suggested by previous investigators.
9. Another alternative which would reduce the volume of desalting water, aswell as overall salt use, is the adoption of lower salometer salt stor-age for brinestock.
10. Efforts should be made to avoid dropping cucumbers, brinestock, or partsthereof onto the tankyard, onto the floors, or into the wastewater drains.Once dropped, a valuable raw commodity becomes a waste, causing a Z-foldloss - - (1) of initial cost and (2) of cost to treat it as a waste.
11. The first and cheapest approach to wastewater control should be elimina-tion of wastage of water, cucumbers, salt, and any other materials.Such improved "housekeeping" can be accomplished by continuing educationof all plant personnel. Without improved housekeeping it is doubtfulthat any other more sophisticated approaches -- brine treatment and reuse,countercurrent rinsing, advanced waste treatment processes, et cetera --can succeed in reducing the volume and loading of wastewaters sufficientlyto meet proposed effluent guidelines.
xvi

INTRODUCTION
In 1972 representatives of the Mount Olive Pickle Company and the U. S.Food Fermentation Laboratory requested assistance of the Department of Environ-mental Sciences and Engineering in handling wastewater problems related toproduction of pickles, with the understanding that any useful informationobtained would be made available to all interested pickle companies. Withsmall grants from the University Research Council (University of North Carol-ina at Chapel Hill, URC Council Grant VC 334) and from Pickle Packers Inter-national, Inc. (PPI) work was begun on characterization and treatment of brinewastes from the cucumber pickle industry. The scope of this work was greatlyexpanded in 1973 with a $12,000 research grant from the UNC Water ResourcesResearch Institute and $10,000 from PPI.
The scope of work undertaken included
I . Industrial water and waste surveys at two North Carolina pickleplants, including water usage and characterization of wastewaters
I I . Economic evaluation of various treatment processes for brine waste-waters
I I I . Laboratory and pilot evaluation of recycling of tankyard brines,by high pH coagulation-precipitation and by ultrafiltration.
This report represents the information obtained during this study andincludes recommendations for decreasing water usage; reducing waste loads ofsalt, BOD, and solids; and upgrading existing wastewater treatment facilities.
General Description of the Pickle Industry
The cultivation of cucumbers as a food crop and the preservation of foodsby pickling are practices so old that their origins are unknown. The cucumber,Cucumis sativus , a native of Southern Asia, has been in cultivation for morethan 4000 years, being grown in Egypt in Old Testament times (King, 1941;Bush-Brown and Bush-Brown, 1958).
Pickling is one of the oldest methods of preserving food, used long be-fore heat sterilization and freezing were available. The work pickle isderived from the Dutch pekel, "brine or pickle," and from the equivalent Ger-man pökel. Conventional pickling involves storage of food in salt brine,accompanied by natural fermentation mediated by indigenous micro-organisms

and leading to the production of acidic endproducts. The salt serves togovern the extent and type of microbial growth, and the combination of highsalt-low pH serves to preserve the food. Many vegetables can be preservedin brine, sauerkraut and cucumber pickles being the best-known examples.Others include okra, tomatoes, carrots, corn, and green beans.
Compared to canning or freezing, pickling is an energy-conservingmethod of food preservation, and during World War II fuel shortages there wasa revival of brining both in the home and commercially (Etchells, Jones, andBell, 1952).
In the last decade the term pickle has also been applied to cucumberproducts which have not been brined or fermented but have been packed directlyin vinegar (fresh-pack process).
The practice of pickling cucumbers was brought to America by early Dutchsettlers in the New York region (Binsted et al., 1962). Currently in theUnited States manufacture of cucumber pickles is a $500,000,000/yr industryinvolving some 39 states. Around 129,000 acres of pickling cucumbers areharvested each year, producing over 600,000 tons with a value to the farmer ofover $60 million. In North Carolina, a major cucumber-producing state, over27,000 acres are harvested, yielding over 85,000 tons of cucumbers with avalue to the farmer of nearly $9 million (Tables 1 and 2). In North Carolinathe usual field size is small, so that in this State cucumbers are producedby a relatively large number of farmers. Three large pickle processing plantsare located in North Carolina: Mount Olive Pickle Company, Mount Olive; Per-fect Packed Products Company, Inc., Henderson; and Cates Pickle Company,Faison.
TABLE 1. PRODUCTION OF CUCUMBERS FOR PICKLES IN 1972 (Almanac, 1974)
Area HarvestedAcreage(1000 acres)
North Carolina 27.0Southern States 71.5
M i c h i g a n 26.0Northern States 46.0
CaliforniaWestern States 11.4
Total processed 128.8Total, fresh mkt. 49.2
Total, U. S. 178.0
YieldTons/Acre
2.503.10
3.765.10
12.0510.11
4.43-----
Production Value Total Value(1000 T) ($/T) ($10OO)
67.5227.3
97.8234.4
67.5115.5
571.2216.3
806.3
117 7,89898 21,667
86 8,39192 21,478
93 6,28491 10,515
94 53,660--- -m-D--
2

TABLE 2. ECONOMIC ASPECTS OF CUCUMBER PRODUCTION AND PICKLINGPROCESSING IN NORTH CAROLINA*
Acreage harvested: ~27,300 acres (ranks second in acreage)
Yield per acre: 3.05 tons (122 bushels)
Crop harvested: 83,250 tons (-3.33 million bushels)
Price per ton: $95-$98 (~$2.50/bushel)
Value of crop to N. C. Farmers: ~$8 million
Average field size: 1.5-5 acres (a large number of farmers benefit)
Value at manufacturer's level: ~$50 million
Value at retail level: ~$62.5 million
Amount of manufactured goods sold outside of State: -95%
*Information supplied by J. L. Etchells, Head, Southeastern Market-ing and Nutrition Research Division, U.S. Food Fermentation Labora-tory, Raleigh, N. C., 1972.
Growth Projections of the Pickle Industry
The U.S. pickle industry has grown at a rapid rate, in terms of bothoverall consumption and consumption per capita. A major factor in pickleconsumption is the use of pickle slices in the fast-food industry. Table3 shows growth trends in the industry since 1930 (USDA, 1973).
TABLE 3. PICKLE CONSUMPTION IN THE UNITED STATES
Year
1930 1 2 , 0 5 8 , 4 0 0 2.351935 1 1 , 6 2 9 , 4 0 0 2.201940 15,872,600 2.881945 20,747,300 3.731950 29,249,500 4.621951 25,730,OOO 4.011955 35,876,300 5.221960 38,933,400 5.201965 45,674,700 5.621970 64,265,600 7.601973 72,542,500 8.34
CONSUMPTIONCases of 24/303's pounds/capita

Partly because of the growth of the pickle industry currently manyplants may find themselves with inadequate and overloaded waste treatmentsystems at a time when funds for capital improvements are hard to obtain.
Product Description, Styles, and Types of Packs
United States Standards for Grades of Pickles define pickles as follows:
"Pickles means the product prepared entirely or predominantlyfrom cucumbers (Cucumis sativus L,). Clean, sound ingredientsare used which may or may not have been previously subjectedto fermentation and curing in a salt brine (solution ofsodium chloride NaCl). The prepared pickles are packed invinegar solution, to which may be added salt and other vege-table(s), nutritive sweetener(s), seasoning(s), flavoring(s),spice(s), and other ingredients permissible under the FederalFood, Drug, and Cosmetic Act. The product is packed in suit-able containers and heat treated, or otherwise processed toassure preservation." (Almanac, 1974).
The term style refers to the shape of the product and includes the fol-lowing categories: whole, crosscut, slice lengthwise, cut, and relish (finelycut).
There are two major types of pack -- cured and fresh-pack.
Cured type pickles are naturally fermented in NaCl brine to which may beadded flavorings such as dill. During curing the internal salt concentrationmay reach levels too high for palatability, in which case the pickle then ispartially desalted before packing in vinegar solution. Types of cured picklesinclude
(1) Natural or genuine dills - cured in salt brine with dill herb(2) Processed dills - cured pickles packed in vinegar solution
with dill flavoring(3) Sour pickles - cured, packed in vinegar(4) Sweet pickles and mild sweet pickles - cured, packed in
vinegar with nutritive sweetening ingredient(5) Sour mixed - cured, packed in vinegar, packed with onions
and cauliflower and other ingredients(6) Sweet mixed and mild sweet mixed - as in 5, but with
nutritive sweeteners added(7) Sour mustard pickles or sour chow-chow - as in 5, except
packed in mustard sauce rather than in vinegar(8) Sour pickle relish - cured, finely cut or chopped cucumbers,
packed in vinegar solution, may contain other finely cutvegetables
(9) Sweet pickle relish - as in 8, but with nutritive sweeteneradded,
4

Fresh-pack type pickles are prepared from uncured unfermented cucumbersand packed in vinegar solutions of various types. They are processed by heatfor preservation. The types include
(1) fresh-pack dill - packed in vinegar solution with dill flavoring(2) fresh-pack sweet dill - as in 1, but with nutritive sweetener(3) fresh-pack sweetened dill relish - finely cut or chopped,
packed in vinegar, dill and nutritive sweetener added, maycontain other finely cut or chopped vegetables
(4) fresh-pack sweet and fresh-pack mild sweet - packed invinegar with nutritive sweetener
(5) fresh-pack sweet relish and fresh-pack mild sweet relish -as in 3, but without dill flavoring
(6) fresh-pack dietetic - may be prepared with or without additionof sweetener, salt, and other ingredients to meet requirementsfor special dietary uses.
Currently, of the annual crop about 40% is made directly into fresh-packor pasteurized pickle products using the canning operation largely developedat the U.S. Food Fermentation Laboratory (Etchells and Moore, 1971).
Pickle Production and the Wastewaters Generated
Sources of wastewaters from pickle manufacture are readily apparent asone follows the progress of cucumbers from field to finished product (Figure1). The three major divisions in production of brined-type pickles are (1)brining, (2) "processing" or freshening," and (3) finishing.
It must be noted that in the pickle industry brine strengths are expressedin terms of degrees salometer, measured with a hydrometer calibrated in per-cent saturation with respect to sodium chloride. A saturated solution of saltwould read 100° salometer (see Table 4).
Green cucumbers trucked in from field weighing stations may be firstgraded (sorted according to size) or put directly into brining tanks (fieldrun). As a rule, the cucumbers are not washed first.
In most plants green cucumbers are brined outdoors in large wooden tanksranging in size from lOOO-20,000 gallons and accommodating from 100-2000bushels of cucumbers. These tanks are actually huge barrels constructedwith staves and hoops; consequently, they must be kept wet to reduce theirtendency to shrink and leak. During the winter months the tanks are filledwith water containing lime (or in some instances, microbicides) to keep thewood wet and to "sweeten" the tanks. As tanks are needed in the spring andsummer, the limewater (~10 lb hydrated lime per 1000 gal) is drained out ontothe tankyard and the tanks are washed with freshwater. Care of empty tanksis reviewed by Veldhuis et al (1941).
Before cucumbers are added to the tank, a cushion (6"-8" deep) of 25°brine is placed in the bottom of the tank to prevent bruising the cucumbersas they are dumped in. After filling to within about a foot of the top of
5

FIGURE 1. FLOW CHART OF TYPICAL UNIT PROCESSES IN THE PRODUCTION OF FRESH-PACK AND PROCESSEDCUCUMBER PICKLES.

TABLE 4. SALT (NaCl) SOLUTION CONVERSION CHART*
the tank, the tanks are "headed down" with a cover of wooden boards, looselyconstructed to allow free movement of liquid while keeping the cucumberssubmerged. The cover is fastened in place with heavy beams. Salt brine isadded to about 4-6" above the head. Initially the cucumbers absorb brineand water diffuses out of the cucumbers, so dry salt is added periodicallyto maintain a brine strength of 20°-30°. Any leakage from the tanks willalso necessitate addition of brine. Rain may dilute the brine and requireaddition of more salt.
In the case of small cucumbers up to 1 l/4" (diameter) an additionalstep may be necessary. Small cucumbers often have flowers still attached tothe stems. Fungi associated with flowers have been shown to produce pect-inases, enzymes which destroy the pectin in the cucumber cell walls, thuscausing softening of the brinestock (Bell, Etchells, and Costilow, 1958). Tocombat this problem, it is common practice, especially in the South, to drainoff the initial 25" brine after 36 hours, replacing it with fresh brine.The 36-hour drain is discharged as a waste. Thus, additional salt is requiredfor small cucumbers and an additional waste stream is generated. For example,for a 500 bushel tank, 1500 lb of salt is required for the 25° brine, so smallstock requires an extra 3/4 ton of salt, much of which is wasted onto theyard over a relatively short period of time (Etchells and Hontz, 1972).
tank-
During the first 4-6 weeks of brining at 20-30° salometer, a naturalfermentation takes place. This fermentation is mediated by salt-tolerantmicroorganisms adhering to the cucumbers. Utilizing organics and nutrientsdiffusing from the cucumbers, these organisms produce lactic acid and theis depressed to -3.5. After sufficient acidity (~0.6%) is reached, the
brine strength is increased by addition of dry salt to a final strength of 45-70° salometer. The combination of low pH and high salt serves to suppressthe activity of many (but not all) undesirable organisms and to thus preservethe cucumbers.
When the brined cucumbers are needed for product, they are removed fromthe vats, processed or freshened, and packed (see below). The used or "spent"brine is commonly discharged to the ground as waste.
To control surface growths of yeast, tanks are commonly left open tosunlight. Despite the low pH and high salt conditions certain scum yeasts canthrive in the fermented brine. Scum yeasts, although not incriminated insalt-stock softening (Bell and Etchells, 1956), damage the appearance and over-all quality of the stock. Species of yeast involved are Debaryomyces (themost widespread), Zygosaccharomyces, Endomycopsis, and Candida (Etchells andBell, 1950). Scum growth is especially apt to occur when skies are overcastand when the weather is warm. Veldhuis et al (1941) recommend daily agitationof the liquid surface to retard growth of yeasts; they state that if scum isallowed to develop to the point at which it is visible irreparable damage canoccur. Since few plants practice agitation, when scum accumulates it is re-moved by skimming or by overflowing. In either case, brine is lost to theground.
Since the tanks are open they receive not only sunlight, but also rain-water. Consequently, brine is lost by overflow to the ground, the remaining
8

brine is diluted, and more salt is required. In addition loss of aciditymay necessitate addition of acetic acid.
A final source of wastewater is the leakage of brine from improperlymaintained tanks. To indicate the contribution of leakage to waste generation,the following calculation is illustrative:
Assume a tank 12' in diameter with 65° brine. Leakdown of 1"of brine will result in a volume loss of 68 gallons contain-ing 109 lb of salt. Leakdown of 1' of brine will result in avolume loss of 816 gallons containing 1306 lb of salt.
Loss of brine will necessitate its replacement and, thus, will requireadditional consumption of salt and water. In addition, loss of the acid end-products of fermentation will necessitate addition of acetic acid. Finally,the spilled brine will contribute oxygen-demanding materials to the wastewaterdraining from the tankyard.
Returning to the cucumbers, the brined cucumbers at this point are in-edible because of their high salt content (~16%). In order to reduce thesalt the cucumbers are soaked in l-2 equivalent volumes of fresh water. Finaldesired salt content for dills is ~4.7%; for sweets, ~2.5%. During thesecond washing process the water generally contains alum, for texture improve-ment, and may also contain turmeric or Food Yellow No. 5 for coloring. Dur-ing processing air is usually pumped into the solution to promote mixing andrapid diffusion of salt. The processing waters are discharged as wastewater.
Before and after processing, cucumbers may be regraded; pricked to pro-mote inward diffusion of flavoring agents; or sliced into spears, cubes,slices, relish, and so on. Cutting and pricking operations generally involvefluming of the cucumbers through the system and may also involve jet washingat the point of cutting or pricking. Flume waters may be reused until toodirty; washwaters go directly to waste.
Depending on the product, the pickles may be soaked in various combina-tions of vinegar, sugar, and spices. The flavoring liquors are expensive andthus efforts are usually made to avoid spillage. Some losses occur duringtransfers and during dumping of leftover liquors when a particular product runis finished.
The pickles may be packed by hand or machine into jars or buckets. Afterpacking the final cover brine is added, generally dispensed by an overflowbriner into the containers as they pass by on a conveyer belt. Caps or coversare added by machine and the outside of the jars is washed. Wastewaters in-clude the overflow brine, the washwater, and losses due to breakage or spill-age.
The finished product may or may not be pasteurized, depending on itssugar and acid content.the pasteurizers.
Large quantities of cooling water are generated by
Finally, the products are labelled and crated.
9

Additional wastewater is generated by washing the floors in the finish-ing and packing area. This wastewater will contain spilled brines, liquors,and pickles or parts thereof.
During the green season about 40% of the incoming cucumbers are made in-to fresh pack products. Cucumbers are graded, washed, and sent to the packingroom, where they may be blanched or shriveled in weak brine, then packed wholeor cut. All freshpack products are pasteurized. Since fermentation, storagein brine, and desalting are eliminated, much of the waste associated withbrined products is eliminated. Since fresh cucumbers can be held no longerthan 24 hours, the freshpack operation is limited to the green cucumber season.In order to pack as many as possible by freshpack, the cucumber season hasbeen extended by planting both spring and fall crops and during this time itis not unusual for plants to operate 2-3 shifts per day for 6-7 days a week.
Summarizing, major sources of wastewater are as follows:
(1) 36-hour drain(2) spent brine(3) leakage and overflow of tanks(4) lime water from sweetenting tanks(5) processing waters(6) wash waters from cutters, slicers, etc.(7) transfer losses(8) cooling water for pasteurization(9) loss of cover liquors
(10) water used in cleanup.
Previous Studies on Reduction of Wastes from Pickle Packing
Two in-depth wastes surveys of the pickle industry have been publishedand while some of the findings have been put into widespread practice,others bear repetition and adoption. Barnes and Weinberger (1958) emphasizedthe value of inventorying sources and amounts of wastes and of reducingpollution at the source where possible. Their survey was primarily directedtoward BOD reduction. Suggestions for reducing pollution included:
(1) double-netting when removing brined cucumbers from vats totransfer containers to reduce drippage
(2) saving of left-over concentrated cover liquors for later use(3) reduction of in-plant spills(4) segregation of high-strength liquors and storage for release
at times of high stream flow(5) metering of water usage(6) automatic cornposited sampling of waste flows, their character-
ization, and record-keeping to aid in control of plant opera-tion.
Nemerow (1963) surveyed a North Carolina pickle plant and evaluated effectsof the raw wastes discharge to the receiving stream. As in the previoussurvey, Nemerow's attention was primarily on BOD reduction. Suggestions forreducing BOD and solids included:
10

(1) installation of screens over drains in syrup tanks to aidin retaining small pickles and peels
(2) avoiding overfill of desalting vats to eliminate loss ofbrinestock
(3) dry-sweep collection of pickles and pickle parts which aredropped onto floors and their disposal to garbage ratherthan to the wastewater system.
Mercer et al. (1970, 1971) were able to recondition olive storage andprocessing brines with pilot-scale activated carbon treatment. The treatedbrines were used to store olives with no detectable effect on product quality.The costs for a plant processing 5000 tons of olives per year, amortizedover a 10-yr period, were estimated to be $2.76/ton or $27.60 per 1000 galof reconditioned brine. On the average, activated carbon treatment removed38 - 65 % of the COD in the olive brines. and 21 - 30 % of the suspendedsolids.
The authors estimated that cost could be reduced to around $1 per tonby reactivation and reuse of spent carbon if a centrally located reactivationfacility could serve 10 canneries.
Lowe and Durkee (1971) also examined the reclamation of salt from olivebrines, using the process of evaporation by submerged combustion. In thisprocess spent brines are heated by passage of gaseous combustion productsdirectly through the body of the liquid. The rapid heat transfer from therising gas bubbles takes place under low partial pressure conductions so thatboiling takes place at temperatures considerably less than the normal boilingpoint. Since there are no heat transfer surfaces there are no problems withfouling or corrosion, so that equipment cost can be lowered. The disadvan-tage of the process is its relatively low thermal efficiency. The slurryof crystals formed during submerged combusion is about 57.5% solids and con-tains in addition to the salt about 6% combustible organic material. Theorganics are destroyed and the water removed by incineration at 1200 F.The incinerated salt is stored dry. At time of reuse it is dissolved, filteredor settled to remove the ashed carbon residue, and made up into brine. Intheir studies the reconditioned brine contained 25 mg/l COD, compared to34,700 in the spent brine.
Since cost of the submerged combustion process is dependent on the vol-ume of water to be removed, the more concentrated brines are more economicallytreated.
Blizard (1973) reported work on submerged combustion by USDA-WesternLaboratory and Selas Corporation. Based on 5500 T of cucumbers requiring660,000 gal of 15% brine solution and considering costs of capital amortiza-tion (10 yr basis), labor, power, maintenance, filtration, balanced againstvalue of recovered salt, he estimated the cost of the process to be $0.06 perton of cucumbers.
11

Cranfield (1974) reported on a brine recycling program at Alaga-Whit-field Foods, Inc., in Montgomery, Alabama. Spent brine (60° salometer,pH 3.5) is collected in a storage tank, pumped through a heat exchangerwhere it is heated to 205 F, neutralized to pH 4.6 with lime, and settled.Salt is added to raise salometer to 100°, then the brine is pumped back tothe tankyard. Control of salt concentration in the tanks is achieved notby addition of dry salt, but by draining off lower-salometer brine and re-placing it with the 100° salometer brine.
Modification of In-Plant Procedures to Reduce Waste
Hoover (1974) poses the pertinent question to be answered in regard topreventing food-processing wastes: "Can we change existing processes so thatless waste is produced, while maintaining or improving product quality"?Reviewing the pickling industry he describes past and on-going innovationsdeveloped at the USDA Food Fermentation Laboratory located at N. C. StateUniversity. The most widely-adopted innovation is the fresh-pack processby which 40% of the annual cucumber crop is now handled. The fresh packprocess involves packing the fresh cucumbers directly in brine, vinegar, andseasonings, followed by pasteurization in the sealed jar. This process eli-minates fermentation, storage in brines, and desalting and in addition pro-duces a product of fresh texture and color.
Another approach developed at the USDA Laboratory is the controlledfermentation process (Etchells, Bell, and Costilow, 1966). Hontz (personalcommunication) estimates that currently 77.8% of the salt used in processed-type pickles is wasted, either as spent brine or desalting water. The con-trolled fermentation process was developed by USDA in cooperation with theNorth Carolina and Michigan Agricultural Experiment Stations. The firstapproach was in-the-jar fermentation, achieved b (1) pasteurization of thecucumbers to eliminate undesirable organisms, (2) aseptic addition of a pureculture of lactic acid organisms, and (3) aseptic addition of sterile brinesolution in the jar. Controlled fermentation in the jar offers the followingadvantages: elimination of weeks of vat storage, reduced pickling time,consistently high quality, and reduction of spoilage losses. By eliminationof vat storage, it would eliminate nearly all of the salt wastes. A disad-vantage of the in-the-jar process is that fresh cucumbers would have to behandled shortly after arrival, placing a large demand on labor and equipment.
In-the-vat controlled bulk fermentation is now under consideration(Etchells et al., 1973). This process would offer most of the advantages ofcontrolled fermentation without the time and equipment intensive aspects.Controlled bulk fermentation should result in drastic reductions in saltusage since the brinestock can be held at 25° salometer rather than at the60-65" level commonly used. The following calculations indicate the potentialsalt savings :
At 65° salometer 16.25 lb of salt is required per bushel of cucumbers.
12

At 25° salometer only 6.18 lb/bushel is required, a reduction of 10.07lb/bushel (62%).
Furthermore, the amount of desalting water, and consequently, the amountof processing wastewater, should be drastically reduced since the salt contentof the cucumbers brined at 25° will be close to that required in the final.product.
Unfortunately (Etchells et al., 1973) the controlled bulk fermentationprocess will not eliminate the need for the 36-hr drain with small cucumbers(up to 1.25" in diameter), necessitated by the softening enzymes which dif-fuse from mold-laden blossoms.
Vaughn et al. (1969) have proposed another modification of in-plantprocedure which would eliminate salt wastes. They propose that salt-storagebe eliminated and that anaerobiosis and acidification to 1.2% total acidwith lactic and acetic acids, supplemented with 0.3% sodium benzoate, besubstituted. Pilot and tank experiments were conducted with olives; labora-tory tests, with cauliflower, carrots, celery, cucumbers, onions, and chilipeppers. Anaerobiosis was maintained in tanks by overlaying the liquid sur-face with white polyethylene sheets secured with slats. Pinholes providedfor CO2 escape during fermentation,with a wax sealant.
and for storage the holes were covered
13


CHARACTERIZATION OF WASTEWATERS GENERATED IN PICKLE MANUFACTURE
Relatively little information is available in the literature on thepollutional characteristics of wastewaters from pickle manufacture,especially on the wastewaters from individual unit processes.
Results of previous studies are indicated in Tables 5 and 6. Overall,pickling wastewaters are characterized by high dissolved solids, low pH,high chloride content and high BOD.
Because of the relative lack of information on the character of pickl-ing wastewaters, coupled with a pressing need by pickle manufacturers toupgrade their wastewater treatment facilities, the need for extensive surveywas obvious.
Plant A was chosen for an extensive survey of water use, overall andin unit processes; wastewater generation, overall and for unit processes;characterization of wastewater components; handling of cucumbers, salt, andother ingredients. Cooperation of plant personnel made possible daily meterreadings, production figures, and sampling. Samples were chilled and takento the UNC Wastewater Research Center for analysis. Table 7 describes theanalytical methods employed in the study.
Plant B was also extensively studied and an industrial waste survey wasconducted by graduate students from UNC- Chapel Hill (see Appendix A).
Plant C was sampled occasionally, primarily for comparison with resultsobtained at Plants A and B.
Tankyard Wastes
At Plant A the average tank capacity is 6000 gallons, a size which ac-commodates 600 bushels of cucumbers.2400 gallons of spent brine.
Each 6000-gal tank produces aboutWhen the plant is running at peak capacity,
3-5 tanks are emptied each working day, i.e., 1800-3000 bushels of cucumbersare processed each working day.cessed, and thus ~
On a yearly basis, about 700 tanks are pro-1.68 million gallons of spent brine are generated.
from twoThese brto waste
cucumbers representing both spring and faltanks of relish; and from vats ofine samples represent the spent bras the vegetables are processed.
From the tankyard, samples of brine were taken from 23 vats of whole1 crops and 5 sizes of cucumbers;cauliflower, pepper, and onion.
ines which would be d ischarged
14

TABLE 5. CHARACTERISTICS OF WASTEWATER FROM PICKLE MANUFACTURE
TABLE 6. CHARACTERISTICS OF WASTEWATER FLOWS FROM UNIT PROCESSESIN PICKLE MANUFACTURE
Source Flow Description PH
Barnes and 2.9-3.1Weinberger(l958)
Sweet liquor
Cleanup wash 3.9-7.0
Nemerow(1963) Alum-tumeric wash
- whole pickles 4.1
- pickle chips 3.2
Drainings from relish 3.2
1024 420
1185 1890
7980 2500
15

TABLE 7. ANALYTICAL PROCEDURES
16

TABLE 8. CHARACTERIZATION OF TANKYARD BRINES FROM CUCUMBERS

Brines from whole cucumbers (Table 8) are, as expected, extremely highin chlorides, reflecting the high salometer storage brine strengths used inPlant A and many other plants, Additionally, these brines are extremelyhigh in organic carbon (averaging 3400 mg/l), suspended solids (averaging329 mg/l), Kjeldahl nitrogen (averaging 732 mg/l) and phosphorus (averaging87 mg/l). Because of the fermentation there is a low pH (around 3.4) and ahigh acidity (averaging 2324 mg/l). The discovery that spent brines containednot only salt but high levels of other pollutants was surprising to pickleplant personnel. However, one might anticipate that when cucumbers areplaced in concentrated brines soluble components will diffuse out into thebrine until an equilibrium is attained.
Values for relish brines were in the same ranges as those for wholecucumber brines (Table 8).
From the data shown in Table 8 it is obvious that spent brines fromcucumbers have a very high pollutional potential. In Table 9 the spentbrine characteristics are compared with ordinary domestic sewage, which seemsweak in comparison (Brown et al., 1973).
TABLE 9. TANKYARD BRINE COMPARED TO TYPICAL DOMESTIC SEWAGE
Table 10 shows the characteristics of the 36-hour drain brines from smallcucumbers. Again, this brine is very high in BOD, TOC, chlorides, and acidity.Since all of this brine is discharged to waste (usually onto the ground) dur-ing the green season it constitutes a major wastewater load during a relativelyshort period.
Pepper and cauliflower brines are similar to cucumber brines (Table 11).Onion brines, however, are markedly different, with low organic carbon levelsand low acidity. In relation to overall waste loads, the contribution ofonion, pepper, and cauliflower brines is minimal, as only a few vats of eachare used each year,
Wastewaters from Processing and from Other Operations
Characteristics of processing wastewaters from several products are shownin Table 12, Processing wastewaters are generated in the desalting step.
18

TABLE 10. CHARACTERISTICS OF 36-HOUR DRAIN, PLANT A, 1974

TABLE 12. CHARACTERIZATION OF WASTEWATER FLOWS FROM PROCESSING VARIOUS PICKLE PRODUCTS
21

Desalting may be done before or after cutting, At the plant studied, cut-ting was generally done prior to washing. This evidently resulted in greaterloss of soluble organics. As shown in Table 12, the more finely divided theproduct, the greater the TOC in the first wash water. While more dilutethan spent brines, the processing waters are nevertheless high in chlorides,acidity, nitrogen, solids and organic carbon. Since a unit volume ofcucumbers may require 2 to 3 times its volume in washwater, processing waterscontribute a large volume of wastewater,
The wastewaters from cutting salad cubes from brinestock are high inchlorides, phosphorus, Kjeldahl nitrogen, organic carbon, and suspended solids(Table 13).
Wastewaters from the chipping unit (Table 14) were quite variable dur-ing the sampling periods, but on the whole were lower in TOC and BOD andhigher in pH than those from relish and salad cubes operations. Wastewatersfrom the pricking machine were also quite variable (Table 15).
TABLE 15. CHARACTERIZATION OF WASTEWATERS FROM THE PRICKING MACHINE
3/20 3127
BOD, mg/l
TOC, mg/l
SS, mg/l
TS, mg/l
(NO2 +NO3 )-N, mg/l
NH4-N, mg/l
TP mg/l
PHAcidity, mg/l as CaC03Specific conductivity, mmhos
Cl, mg/l
11
<l00
13
2000
<0.2
1.0
0.3
6.1
26
3
1100
138
<l00
_ _ _
4.3
60
38
16,200
Water Usage
Knowledge of the volumes of water used in different operations, especiallyin relation to the amount of product produced, is important in locating prac-tices which waste water and which thus produce an unnecessarily large amountof wastewater to be treated. Meters were installed at a number of locationsinside and outside the plant, and where possible, water usage was computedfor unit of production. Water usage on the tankyard and in the restrooms isshown in Table 16. The seasonal nature of tankyard water requirements is readily
22

apparent, the requirements reaching up to 150,000-200,000 gallons dailyduring the height of the green season, While the tank wash waters and the36-hour drain brines will be released to waste during the green season,much of this water is used to prepare brines which may not be dischargedfor many months. Note from Table 16 that use of the meters during the studyalerted personnel to leaks and broken water lines.
Tables 17-25 show the amounts of water used in various unit processes,both in terms of gallons used and in terms of volume per unit of product.The average, maximum, and minimum amounts of water required show, in somecases, wide variations. From observation of the operations, it appearsthat the overall water use, in each case, can be reduced to at least theaverage value. Excessive use of water can usually be traced to leaks, toleaving the water running while no product is being handled, or to overflow.The problem of excessive water use is especially obvious on days when largeamounts of water are consumed when the unit is not in operation.
Table 26 summarizes the present water use at selected unit operationsand indicates the potential reduction in water use if the water volume is cutto the minimum values observed. Reducing water consumption would of coursereduce wastewater generation - in these operations, by 47-91%. Such drasticreduction would result in corresponding reduction in cost of water and incorresponding increased detention time in the hydraulically overloaded waste-water lagoons.
Table 25 shows water usage by pasteurizers. In this case, the datawere converted to reflect gallons of water used per standard case - 24/303(24 pints). Pasteurizer water is generally quite clean, being simply the cool-ing water. The BOD5 is usually < mg/l (Macon, personal communication).be, and often is, discharged directly to the municipal wastewater treatment
It can
system in order to reduce the volume of wastewater to be treated by the indus-try. Again wide variations, from 3.7 to 89.8 gallons per case, were seen. Aconsultation with plant personnel indicated that during portions of the studythere were operational problems with the pasteurizers, leading to excessivewater use. Since water use by the pasteurizers can run up to nearly 450,000gallons per day, the importance of quick repairs is obvious. In the case ofthose plants which treat pasteurizer waters in their own wastewater treatmentsystems, elimination of excessive water consumption again saves on water costsand wastewater treatment. At the end of Table 25 a summary is shown of theaverage, maximum, and minimum volumes of waste used per standard case of pro-duct, showing the large variations and the potential for reduction.
Overall Plant Wastewaters
In Figure 2 is shown a layout of a typical North Carolina pickle plantwith a perimeter drain system to collect tankyard and other runoff flows andwith aerated lagoons for wastewater treatment. Tables 27-29 show the charac-teristics of the overall plant wastewaters at three plants. These wastewatersare the influent to the plant wastewater treatment systems and represent whatis actually treated. At Plant A the wastewaters include tankyard runoff andall in-plant wastewaters except pasteurizer wastewaters; at Plant B, allwastewaters including pasteurizer wastewaters; at Plant C, all wastewatersexcept tankyard runoff.
23

TABLE 16. TANKYARD WATER USAGE, PLANT A, MARCH-AUGUST, 1974
*All values include water used in restrooms
24

TABLE 16. TANKYARD WATER USAGE, PLANT A, MARCH-AUGUST, 1974 (continued)
25

TABLE 16. TANKYARD WATER USAGE, PLANT A, MARCH-AUGUST, 1974 (continued)
* All values include water used in restrooms
26

TABLE 16. TANKYARD WATER USAGE, PLANT A, MARCH-AUGUST, 1974 (continued)
27

TABLE 16. TANKYARD WATER USAGE, PLANT A, MARCH-AUGUST, 1974 (continued)
28

TABLE 17. WATER USAGE, WHOLE PICKLE MACHINE, PLANT A, JUNE-JULY, 1974
29

TABLE 18. WATER USAGE, STRIP MACHINE, PLANT A, JULY, 1974
30

TABLE 19. WATER USAGE FOR PROCESSING AND PACKAGING SALAD CUBES, PLANT A,MARCH-MAY, 1974
31

TABLE 19. WATER USAGE FOR PROCESSING AND PACKAGING SALAD CUBES, PLANT A,MARCH-MAY, 1974 (continued)
TABLE 20. WATER USAGE, CHIP MACHINE, PLANT A, PROCESSED CHIPS, SELECTEDDATES
32

33

TABLE 21. WATER USAGE FOR PRICKING MACHINE, PLANT A, MARCH-MAY, 1974 (continued)
34

TABLE 22. WATER USAGE, CHIPS MACHINE, PLANT A, FRESHPACK SEASON
35

TABLE 23. WATER USAGE FOR CHIP MACHINE, PLANT A, MARCH-MAY, 1974
36

TABLE 23. WATER USAGE FOR CHIP MACHINE, PLANT A, MARCH-MAY, 1974 (continued)
37

TABLE 24. WATER USAGE FOR RELISH MACHINE, PLANT A, MAY-JUNE, 1974
38

TABLE 25 WATER USAGE, PASTEURIZERS, PLANT A, MARCH-AUGUST, 1974
39


41

FIGURE 2. DIAGRAM OF LAYOUT OF PLANT A (not to scale). Key: SD - Storm Drains, PER - TankYard Perimeter Drains, PD - Process Room Drains, PKD - Packing Room Drains,WTD - Wastewater Treatment Drain

TABLE 26. SUMMARY OF PRESENT AND POTENTIAL WATER USAGE IN UNIT OPERATIONS
Water Usage, gal/bushel
Unit Average Minimum Potential Reduction- - - -
Whole pickle machine 0.73 0.10 0.63 (86 %)
Strip machine 12.4 1.1 11.3 (91 %)
Salad cubes machine 8.8 0.9 7.9 (90 %)
Chips machine, fresh season 5.1 1.1 4.0 (78 %)
Chips machine, brine season 32 17 15 (47 %)
Relish machine 5.3 2.7 2.6 (49 %)
In general wastewater reflected type of input; in most cases, as expected,wastewater strength was greatest at Plant A.
In nearly all cases pH was low -3.6-4.9. BOD5 levels ranged from 200 tonearly 4000 mg/l. TOC levels were correspondingly high. To plant officialsKjeldahl nitrogen levels were surprisingly high - up to 90 mg/l. One mustconsider, however, that many soluble components of the cucumbers leach outduring brining and are discarded along with the spent brines and processingwaters. Oxidized nitrogen (nitrite, nitrate) concentrations were very low,usually less than 1 mg/l. Phosphate-P levels were generally less than 10and were lowest at Plant C. Some of the phosphorus can be attributed toleached cucumber components, some to detergents and lubricants.
Suspended solids values were high - up to 670 mg/l. In general theywere highest at Plant A, reflecting the effect of tankyard runoff.
Likewise, chloride and total dissolved solids were highest at Plant A.It should be stressed that chlorides, along with many of the other dissolvedsolids, are unaffected by conventional primary and secondary treatment.Therefore, any chlorides entering the wastewater system will be dischargedeventually to the receiving stream. The lagoon system does have the advan-tage of moderating the impact of concentrated "slugs."
Representative volumes of wastewater discharges at Plant A are shown inTable 30. Note that volumes are greater during the freshpack season whenthe plant operates at maximum capacity and when 24-hr operation for 6 daysper week is common.
43


TABLE 30. EFFLUENT DISCHARGE VOLUMES, PLANT A, 1974
Daily Volume, gallons/day*
Dates Maximum Average
Jan. 21-Feb. 15 240,000 200,000
Mar. 18-Apr, 12 250,000 215,000
Apr. 16-May 10 325,000 248,000
May 13-May 31 290,000 230,000
June 10-June 22 350,000 260,000
July l -July 19 320,000 250,000
July 19-Aug. 19 260,000 205,000
*Information provided by plant personnel. Volumes do not necessarilyrepresent total volume of wastewater since during heavy rainfallexcessive flow from the tankyard can be bypassed around the treat-ment system.
Potential for Ground Water Contamination
Although spent tankyard brines are often discharged directly onto theground and although unlined ponds or lagoons are frequently used for treat-ment of pickle wastewaters, there appears to be no published information onthe potential for groundwater contamination by chlorides in these wastes.Investigations of chloride contamination of groundwater by chlorides fromother sources seem to indicate that chlorides move readily through some soils,especially clay soils, and that the negative adsorption of [Cl]- by clayparticles results in movement of chloride ahead of the water front (Wierenga,O'Connor, and Dregne, 1972).
The vertical movement and the degree of spread under various conditionsof salt concentration and soil type is somewhat unpredictable (Brunotte et al,1971) . As the brine moves through the soil, ionic composition changes dueto ion exchanges with soil components and leaching of previously accumulatedsalts (Hornsby, 1973).
Fryberger (1972) described the pollution of a freshwater aquifer by oilfield brines, resulting from disposal of these brines in an unlined pit. Heestimated that flushing of the aquifer would take more than 250 years andrecommended extreme caution in discharge of brines to unlined pits.
47

Discussion and Conclusions
In general, as expected, wastewaters from cucumber pickling operationsare characterized by high chloride content, high oxygen demand, low pH, andhigh total and suspended solids. Nutrient concentrations, especially Kjeld-N, are also appreciable. The 36-hour drain from small cucumbers containsabout 0.6 lb NaCl/gal and also contains appreciable organic carbon and othercomponents leached from the cucumbers. The spent tankyard brines containhigh concentrations of salt (1.0-1.6 lb NaCl/gal) and also, on the average,3400 mg/l of organic carbon, 330 mg/l of suspended solids, 730 mg/l of totalKjeld-N, 90 mg/l of phosphorus, and 2300 mg/l of acidity (as CaCO3). ThepH falls between 3 and 4. These brines have a high pollutional potentialand are much more concentrated than domestic sewage.
Desalting (processing) wastewaters are also typically of low pH andrelatively high chloride concentrations. In the first desalting waterchloride levels are about 40 gm Cl/l. Organic carbon levels are high andin general the more finely divided the product, the higher the TOC as wellas the Kjeld-N and phosphorus levels. Apparently, the greater the surfacearea exposed to the processing water, the greater the loss of solublecomponents and fragments of cucumber tissue.
Water requirements per unit of cucumbers handled vary widely withineach unit process. Part of the variation can be attributed to leakage,overflow, or failure to close valves during times when the unit is notin operation. The water use studies indicate that 40-90 % of the watercurrently used is unnecessary. Reduction of unnecessary water use wouldlower the hydraulic loading on the wastewater treatment system, increasingthe detention time, and would also reduce cost of water.
The potential for reuse of pasteurizer water in cleanup or other areasshould be investigated. Alternatively, to reduce loading on the wastewatertreatment system the possibility of discharging the relatively cleanpasteurizer water to the municipal system should be investigated byplants not currently doing so.
Approximately 40-50 % of each year's cucumber crop is fresh-packed ratherthan brined, and fresh-pack operations generally predominate during the periodfrom May-August. However, the plant wastewater continues to be characterizedby high salt and organic carbon levels, since during this time 50-60 % of thecucumbers are brined. Brining is associated with intensive tankyard activity,including drainage of 36-hour brines from the smaller cucumbers. Salt spillageis also most apt to occur at this time. Loss of brines by overflow duringrainfall and by leakage also occurs. With perimeter drainage systems, allwastewaters from the tankyard area will be discharged to become a part ofthe overall plant wastewater. Therefore, it is not surprising that highsolidsand chloride levels are found year-round at plants with perimeter systems.
Because of the highly pollutional nature of tankyard brines the presentwidespread practices of discharging these brines untreated onto the tankyardshould be questioned. In addition, the potential of chloride contaminationof groundwater by tankyard runoff or by seepage from unlined wastewater treatmentponds should be investigated.
48

LABORATORY EVALUATION OF COAGULATION-PRECIPITATIONAND ULTRAFILTRATION FOR REGENERATION OF STORAGE BRINES
One approach to reduction of salt in pickle wastewater-s is regenera-tion and reuse of salt brines within the manufacturing process. As previouslynoted there are two major sources of high salt wastes: (1) the used (spent)brine from tanking and storage, and (2) the processing waters resulting fromwashing and firming the salt stock prior to packing. Tankyard brines, whichare currently discharged into the ground in most plants, are of two strengths(1) the "36-hr drain" of -7% salt from the smaller cucumbers, and (2) thestorage brine of -16% salt.
Coagulation-Precipitation
Coagulation-precipitation as a means of brine regeneration has been in-vestigated by Geisman and Henne (1973). These investigators, basing theirwork on earlier work by Popper et al. (1967), used chemical precipitationfollowed by clarification (filtration) and activated carbon treatment. Of thechemicals tested, NaOH was found to be the most economical and effective.Brines of 50° and 70° salometer were treated by adding NaOH to a pH of 11.0,then filtered through cotton precoated with diatomaceous earth. Filtereffluent was passed through an activated carbon bed, then neutralized withHCl. Geisman and Henne reported COD reductions of 50-97%, but since COD dataare not included in the tabulated data, it is not possible to determine volumesused or the step in the process responsible for the reduction. When the pro-cess was tested on commercial scale, the high costs of filtering and acti-vated carbon treatment resulted in omission of these steps. Settling for 48hr, followed by removal and neutralization of the clear supernatant, was sub-stituted.
Pickles made with brine regenerated by this method were found to becomparable in quality to those made with freshly made brine.
Geisman and Henne estimated the cost for treating brines by this methodat $1450 for brine for 100,000 bushels of cucumbers. This cost would becounterbalanced by a savings of $3100 for salt needed for that amount of brine.
Palnitkar and McFeeters (1974) treated spent brines with alkali, usingthe method of Geisman and Henne. Their results were similar to those foundin our work, i.e., little or no organic material was removed and only smallamounts of Kjeldahl nitrogen were removed.3B) in untreated brine, fresh brine,
They fermented cucumbers (sizebase treated brine, and heat treated
brine, and found that there was no difference in color, odor, and texture.
49

LABORATORY EVALUATION OF COAGULATION-PRECIPITATIONAND ULTRAFILTRATION FOR REGENERATION OF STORAGE BRINES
One approach to reduction of salt in pickle wastewaters is regenera-t ion and reuse of sa l t br ines within the manufacturing process . As previouslynoted there are two major sources of h igh sa l t wastes : (1) the used (spent)brine from tanking and storage, and (2) the process ing waters resul t ing fromwashing and f irming the sa l t s tock prior to packing. Tankyard brines, whichare current ly d ischarged into the ground in most p lants , are of two s trengths(1) the "36-hr drain" of -7% salt from the smaller cucumbers, and (2) thestorage brine of -16% salt .
Coagulat ion-Precipi tat ion
Coagulat ion-precipi tat ion as a means of br ine regenerat ion has been in-vest igated by Geisman and Henne (1973) . These invest igators , bas ing the irwork on earlier work by Popper et al. (1967), used chemical precipitationf o l l o w e d b y c l a r i f i c a t i o n ( f i l t r a t i o n ) a n d a c t i v a t e d c a r b o n t r e a t m e n t . O f t h e
chemicals tested, NaOH was found to be the most economical and effective.Brines of 500 and 700 salometer were treated by adding NaOH to a pH of 11.0,then f i l tered through cotton precoated with diatomaceous earth. Fi l tereffluent was passed through an activated carbon bed, then neutralized withHCl. Geisman and Henne reported COD reductions of 50-97%, but since COD dataare not inc luded in the tabulated data , i t i s not poss ible to determine volumesused or the s tep in the process responsible for the reduct ion. When the pro-cess was tes ted on commercia l sca le , the high costs of f i l ter ing and act i -vated carbon treatment resul ted in omiss ion of these s teps . S e t t l i n g f o r 4 8hr, followed by removal and neutralization of the clear supernatant, was sub-s t i t u t e d .
Pickles made with brine regenerated by this method were found to becomparable in quality to those made with freshly made brine.
Geisman and Henne estimated the cost for treating brines by this methodat $1450 for brine for 100,000 bushels of cucumbers. This cost would becounterbalanced by a savings of $3100 for salt needed for that amount of brine.
Palni tkar and McFeeters (1974) treated spent br ines with a lkal i , us ingthe method of Geisman and Henne. Their resul ts were s imi lar to those foundi n o u r w o r k , i . e . , l ittle or no organic material was removed and only smallamounts of Kjeldahl nitrogen were removed.3B) in untreated brine ,
They fermented cucumbers (sizefresh brine , base treated brine , and heat treated
brine , and found that there was no di f ference in color , odor, and texture .
49

Discussion and Conclusions
In general, as expected, wastewaters from cucumber pickling operationsare characterized by high chloride content, high oxygen demand, low pH, andhigh total and suspended solids. Nutrient concentrations, especially Kjeld-N, are also appreciable. The 36-hour drain from small cucumbers containsabout 0.6 lb NaCl/gal and also contains appreciable organic carbon and othercomponents leached from the cucumbers. The spent tankyard brines containhigh concentrations of salt (1.0-1.6 lb NaCl/gal) and also, on the average,3400 mg/l of organic carbon, 330 mg/l of suspended solids, 730 mg/l of totalKjeld-N, 90 mg/l of phosphorus, and 2300 mg/l of acidity (as CaCO3).pH falls between 3 and 4. These brines have a high pollutional p tentiala
The
and are much more concentrated than domestic sewage.
Desalting (processing) wastewaters are also typically of low pH andrelatively high chloride concentrations. In the first desalting waterchloride levels are about 40 gm Cl/l. Organic carbon levels are high andin general the more finely divided the product, the higher the TOC as wellas the Kjeld-N and phosphorus levels. Apparently, the greater the surfacearea exposed to the processing water, the greater the loss of solublecomponents and fragments of cucumber tissue.
Water requirements per unit of cucumbers handled vary widely withineach unit process. Part of the variation can be attributed to leakage,overflow, or failure to close valves during times when the unit is notin operation. The water use studies indicate that 40-90 % of the watercurrently used is unnecessary. Reduction of unnecessary water use wouldlower the hydraulic loading on the wastewater treatment system, increasingthe detention time, and would also reduce cost of water.
The potential for reuse of pasteurizer water in cleanup or other areasshould be investigated. Alternatively, to reduce loading on the wastewatertreatment system the possibility of discharging the relatively cleanpasteurizer water to the municipal system should be investigated byplants not currently doing so.
Approximately 40-50 % of each year's cucumber crop is fresh-packed ratherthan brined, and fresh-pack operations generally predominate during the periodfrom May-August. However, the plant wastewater continues to be characterizedby high salt and organic carbon levels, since during this time 50-60 % of thecucumbers are brined. Brining is associated with intensive tankyard activity,including drainage of 36-hour brines from the smaller cucumbers. Salt spillageis also most apt to occur at this time. Loss of brines by overflow duringrainfall and by leakage also occurs. With perimeter drainage systems, allwastewaters from the tankyard area will be discharged to become a part ofthe overall plant wastewater. Therefore, it is not surprising that highsolidsand chloride levels are found year-round at plants with perimeter systems.
Because of the highly pollutional nature of tankyard brines the presentwidespread practices of discharging these brines untreated onto the tankyardshould be questioned. In addition, the potential of chloride contaminationof groundwater by tankyard runoff or by seepage from unlined wastewater treatmentponds should be investigated.
48

Repetitive recycling experiments indicated that brine could be recycled atleast 5 times with no effect on product quality, even though there was somebuildup of organics. Their work also indicated a significant reduction inbloater content in pickles fermented in spent brine.
Laboratory studies conducted by Bell (personal communication, 1972)indicated that coagulation-precipitation of brine with lime and NaOH at pH11 essentially eliminated softening enzyme activity, either by irreversibledenaturation of the enzyme or by its physical removal with the sludge.
Since high pH coagulation-precipitation appeared to eliminate the soften-ing enzyme, laboratory studies were conducted on-site at Plant A and at theUNC Wastewater Research Center to estimate amount of chemicals required forregeneration of brines by this method. A variety of storage brines fromdifferent sizes of cucumbers, as well as from other vegetables, wasexamined to determine if the brines differed significantly in theirrequirements.
A list of tanks, contents, and dates of filling was obtained from theyard foreman, and representative tanks were chosen for sampling. Sampleswere removed from a vertical sampling channel located in each tank whichallows sampling at all depths.
To 1-L aliquots of each brine, 0.1% (1 gm) of hydrated lime [Ca(OH)2;purified grade] was added during rapid mixing with a magnetic stirrer. pHwas monitored with a pH meter (Leeds and Northrup, 7400-A 2 Series).
pH was recorded after lime addition. pH was then raised toll by addi-tion of 5% NaOH solution (prepared by diluting commercial NaOH solution, 50%concentration, commonly purchased by pickle plants). After 5 min mixingduring which floc formed, the brine was transferred to a 1-L graduate cylinderand allowed to settle for 30 min. Then, sludge volume was noted and a portion(300 ml)of supernatant was decanted to a 500 ml beaker (Pyrex) and titratedwith acetic acid, 6.5% (prepared by diluting commercial grade acetic acid ,13% concentration) to pH 7.0. Alkali and acid requirements for differentbrines are indicated in Table 31.
Samples of untreated and treated brine were analyzed for TOC, solids,N forms, total phosphorus, and Cl . Results are shown in Table 32. As ex-pected, phosphorus content was decreased and chloride content was unaffected.No appreciable amount of organic carbon was removed, indicating that theorganic carbon is primarily in soluble form. While a visible improvementin overall clarity of the brine was achieved, there was no significant changein suspended solids levels. Apparently there was only a qualitative differ-ence, possibly due to substitution for some of the solids initially presentby a fine light chemical floc.
The results show a wide variation in buffer capacity among the varioustypes of storage brines. Extremes generally were found in vegetables wasother than cucumbers. Onion brine was especially low in buffer capacity,and the addition of the lime was sufficient to raise pH to 11.6 and effectgood coagulation. Of course, little sludge was produced. At the other
50


TABLE 32. TANK-YARD BRINE SAMPLES BEFORE AND AFTER COAGULATION-PRECIPITATION
PRODUCT TANK * TOC SS NH4-N Kjeld-N TP PH
NO. mg/l
Cucumbers, field 18-l irun, fall f
Cucumbers, fieldrun, spring
Cucumbers, 1Bspring
Cucumbers, 2A, 24-121spring f
Cucumbers, 3,fall
Cucumbers, 4, 16-18ifal l f
Cucumber relish, l0-13ispring f
Cucumber relish, 24-14ifall f
Cauliflower
Pepper
Onion
30-4 if
45-14if
23-16if
28-17if
25-7 if
I-1Oif
5800 3885500 437
3700 4513300 342
1400 4601400 482
2800 2882800 530
4700 2604800 340
3500 3433400 348
1300 2591200 408
5000 3374700 321
7700 4476900 434
6900 262
0 1310 444
275 500 87.5 3.3250 400 10.1 11.8
200 300 85.0 3.7175 275 5.6 11.9
200 225113 163
175 250150 225
38.5 3.54.5 11.7
56.5 3.47.8 11.6
300 425 83.5 3.6275 425 6.6 11.7
225 363 152 3.5213 338 6.0 11.4
100 150 28.0 3.288 138 4.9 11.5
325275
350375
125
500450
950825
93.06.2
1555-3
80.0
3.511 8
4 . 111.7
4.3
4020
350
4530
8.91.5
4. 111.9
* i= initial, untreated sample; f= final, treated sample -
52

extreme, pepper brine had a high buffer capacity and exhibited little or nosettling after 30 min settling time,
Cucumber brines exhibited a range of buffer capacities, and there wasno apparent correlation of buffer capacity with size or season. On the aver-age, approximately 0.3% (vol/vol) of caustic soda solution (50% NaOH) wasrequired to raise the pH to 11.5. To neutralize the supernatant, approxi-mately 1.7% (vol/vol) of acetic acid solution(l3%) was required.
FIGURE 3. RETENTION OF ULTRAFILTERSRetention depends on molecular size and configuration.MW cut-off shown applies to protein. (From Amicon Corp.,1972)
Ultrafiltration
Molecular filtration (ultrafiltration) is a relatively new process forremoving large molecular weight (MW) compounds from aqueous solutions. Byselection of a membrane of suitable pore-size, compounds of a specific MWrange can be retained. While ultrafiltration has been used to recover valu-able components from milk and other wastes, no information has been publishedon the possibility of treating pickle brines by this method. Since enzymesare large macromolecules, generally with molecular weights of 100,000 ormore, it was anticipated that softening enzyme would be easily removed with arelatively large pore size. The bulk of the soluble organic material inpickle brines has not been identified. It was hoped, however, that withsuitable membranes substantial amounts of this organic carbon could be removed.
53

A. Materials and Methods
1. Membranes
a. Type
Amicon DiafloR ultrafilters were employed. This type of filter consistsof an anisotropic polymeric membrane on a porous substructure. Characteristicsof different ultrafilters and microporous filters are shown in Figure 3. Forthese studies the following membrane sizes were employed: XM 300, XM lOOA,XM 50, PM 30, PM 10, and UM 2. The number of each type of filter indicatesits porosity in terms of molecular weight, i.e., XM 300 has a mean poresize of 300,000 MW; XM, of 50,000 MW. As noted in Amicon literature, sinceindicated pore size is a mean value, for maximal retention a cut-off sizewell below MW of the solute to be retained is generally chosen.
b. Membrane Preparation and Storage
Ultrafilters of the XM series are supplied ready for use. Filters inthe PM and UM series have a glycerin film to prevent drying out; thesefilters were prepared by rinsing in distilled water for 1 hr with one changeof water prior to use. Filters could be stored by refrigeration in 10%ethanol. In most instances, however, new filters were used to make resultsmore comparable.
C. Flux
During serial filtration experiments rate of ultrafiltration was deter-mined for each of the membranes. This was done by collecting filtrate in10 ml graduate cylinders using a stopwatch to measure time required for pro-duction of 5 ml aliquots. By use of two stopwatches, flow rate over timecould be determined.
2. Cell
For ultrafiltration studies a stirred cell (Amicon) was employed. Cellcapacity is 50 ml of feed solution, but larger volumes can be filtered con-tinuously by coupling a feed reservoir between the cell and the pressurizedgas tank. Magnetic stirring in the cell minimizes concentration polarization.To prevent heating of cell contents, air from a laboratory air line was usedto cool the magnetic stirrer.
3. Pretreatment of Sample
Preliminary experiments indicated that unless gross suspended solidswere removed from the feed, ultrafiltration rates were extremely slow.Therefore, feed samples were pretreated by vacuum filtration through amembrane filter (5.0 um pore size, Metricel GA-l, Gelman).
54

4. Temperature
All filtrations were performed in a constant temperature room maintainedat 21 C. Samples stored by refrigeration were allowed to reach room tempera-ture before filtration.
5. Pressure
Pressure for the cell was provided with pressurized nitrogen gas andregulated by the pressure valve on the tank. A pressure of 30 psi was usedfor XM 300, XM lOOA, and XM 50 membranes; 60 psi, for smaller pore-sizedmembranes.
6. Experimental Approach
Experiments involved two approaches to ultrafiltration: parallel andser ia l . In the former, the feed sample was subdivided into identicalaliquots, each of which was passed through a different size of filter. Inthe latter, the feed was passed through a large-pore filter, the filtrateserving as feed for the next finer filter, and so on. In the second proce-dure it was difficult to filter enough through the initial membranes toprovide sufficient volume for feed and analyses throughout the filter series.
7. Analytical Procedures
Pickle brine samples present difficulties in analysis due to corrosive-ness and to interference of Cl in many analytical procedures. In manycases analytical methods required modification to compensate for thesecharacteristics.
a. Chloride
Chloride concentrations were measured chemically or electrometrically.In earlier work and in all of the coagulation-precipitation and ultrafiltra-tion studies Cl was determined using the high concentration modificationof the mercuric nitrate method (standard Methods,1971 ). Even with thismodification, the high salinity of spent brines required considerable (x 50)dilution of samples.
b. COD
Chemical oxygen demand (COD) was measured using the procedure recom-mended for wastewaters (Standard Methods, 1971.). To compensate for Clinterference, mercuric sulfate was added in the proportions indicated.
C. TOC
Total organic carbon (TOC) analysis generally offers a rapid means ofmeasuring organic carbon in wastewater. However, problems were encounteredwith brine samples due to their high Cl content. With the instrumentavailable (Model 915 TOC Analyzer, Beckman Instruments), brine caused
55

corrosion of the combustion chamber and the adjacent stainless steel tubing.Discussions with Beckman personnel indicated that there was no way tomodify the instrument so that it could handle undiluted spent brines:Therefore, samples were diluted sufficiently to lower Cl concentration to<l000 mg/l. This resulted in unavoidable loss of some accuracy, especiallyin instances in which Cl concentration was high in proportion to organiccarbon concentration.
d. Pectinase Activity
To assure high levels of enzyme activity in the untreated brine, com-mercial pectinase was added prior to filtration. These high levels made itpossible to magnify any reductions in enzyme activity. Pectinase wasobtained from the USDA Food Fermentation Laboratory in Raleigh.
All analyses of pectinase activity were performed by Ms. Horney at theUSDA Laboratory under the direction of T. A. Bell who developed the analyti-cal method (Bell et al, 1955). In brief, the method is based on the abilityof pectinase to break down sodium polypectate and thus reduce its viscosity.Since salt interferes with the test, the sample must be dialyzed prior toanalysis.
B. Results
Preliminary tests were conducted by filtering 50 ml aliquots of 36-hrbrine through the largest filters (XM 300, XM lOOA, and XM 50). Chlorideand COD concentrations were determined on the untreated brine and the filt-rate. Pectinase activity was measured in untreated brine, filtrate, andconcentrate. Results of these tests are shown in Table 33.
That pectinase was being removed by ultrafiltration is indicated by adecrease in filtrate activity along with increased concentrate activity.As anticipated, salt concentrations remained constant, within expected experi-mental error. Note that the amount of COD removed was approximately thesame regardless of filter size. This removal was due primarily to removalof suspended solids rather than to removal of soluble organics.
Results from a serial filtration of 36-hr brine through the XM 300,XM lOOA, and XM 50 filters are shown in Table 34. Again, the salt concen-trations were found to remain nearly constant throughout and there were nomarked changes in COD although some removal was observed as indicated pri-marily by increased values in concentrate samples. The low pectinase acti-vities throughout were due to enzyme breakdown during storage of the stocksolution. For subsequent tests fresh solutions were made. However, theproblem of whether decreases in enzyme activities could be attributed toeffects of ultrafiltration or were merely a function of time needed to beresolved.
To resolve this problem, a fresh batch of brine with added pectinasewas allowed to stand at room temperature with no preservative (toluene)
56


added. At intervals samples were taken, preserved with toluene, and re-frigerated. Enzyme activity levels are shown in Table 35.
TABLE 35. EFFECT OF STANDING ON PECTINASE ACTIVITY
Time,hr Pectinase Activity, units
0.0 650
2.5 957
4.0 800
6.0 1140
12.0 828
The reason for the low level of activity in the fresh sample is notknown. More important are the relatively constant levels at the latertimes, indicating that the enzyme does not break down within a few hours.It also points out the relatively wide variation that may occur within oneenzyme test. Therefore, actual reduction would be indicated by larger dif-ferences than those observed above.
Serial filtration was repeated with smaller pore-sized ultrafilters.Results are shown in Table 36 and in Figure 4. Again, the COD was affectedvery l i t t le by ultrafi l tration. Enzyme activity was substantially reducedby ultrafilters smaller than XM 50.
Since serial filtration necessitates filtering larger amounts of brinethrough the larger-sized filters, the different filter types could betterbe compared by filtering equal amounts of untreated brine. Again, pectinasewas added and the sample was pretreated by filtration through a 5.0 umembrane filter. Results of such tests are shown in Table 37 and in Figure5. Only enzyme activity was monitored since it had been demonstrated re-peatedly that no significant removal of COD could be achieved. It isapparent that pectinase is removed significantly by ultrafilters PM 30 andsmaller.
Flux of filtrate through the various sized ultrafilters during serialfiltration is shown in Figure 6. Originally experiments were designed touse the same pressure (30 psi) for each filter, but filtration rates becameso slow that higher pressure was used (60 psi). It should also be notedthat solute concentrations in the feed solutions of the smaller pore-sizedultrafilters would be decreasing continually. While this does not makethe flux performance for each filter as comparable as if the same feedsolutions were used, common operating procedures may use 20 or more dif-ferent s izes of f i l ters in series . These results should show optimumflux rates for brine solutions at the pressures shown.
58


ULTRAFILTER
F i l t r a t e Concent ra te
AVERAGE MOLECULAR WEIGHT CUT-OFF
FIGURE 4. EFFECT OF SERIAL ULTRAFILTRATION ON PECTINASE ACTIVITYIN 36-HR BRINE
60


Discussion and Conclusions
Previous studies by Bell had shown that coagulation-precipitation isan effective means of removing pectinase activity from spent brines. Ultra-filtration results from this study show that it too is an effective meansof removing pectinase activity. Neither treatment substantially reducesthe COD of the brine,
Further comparison of the two methods should be made in terms ofeconomics. Economic considerations were foremost in Geisman's (1973) re-commendation of coagulation-precipitation over other methods of brine re-generation. Inflation and fuel shortages of the past few years have rend-ered cost estimates made in previous studies outdated. While the scopeof this study does not allow detailed cost comparisons, factors to beconsidered for both types of treatment can be discussed.
Treatment by coagulation-precipitation requires large quantities ofcaustic soda and glacial acetic acid, both of which have become more ex-pensive and at some times unavailable immediately upon request. Chemicalcosts depend on quantities purchased and are cheapest by tank loads of20-23 tons. Prices given by local chemical supply companies range from$145-160 per ton for caustic soda; for acetic acid, from $300-340 per ton.In both cases, costs were based on tank load purchases. Cost of storagewould have to be compared with increased purchase costs for lower volumesper order. Freight and handling would also require consideration.
Costs of actual treatment (assuming batch type reactors) would includea mixing chamber and settling tank, pH monitoring equipment, and chemicalfeed equipment. The large quantities of sludge generated would requireadditional handling; possibly the sludge could be discharged into theaerated lagoon wastewater treatment system currently used at most plants.
Ultrafiltration eliminates the expense of chemical purchase, trans-port, and storage, and also does not present the occupational hazardsassociated with handling strong acids and caustics, However, the initialcosts of ultrafiltration units are high, as are the costs of replacingmembrane components when they become damaged or become fouled beyond regen-eration. Most waste treatment-operations utilizing ultrafiltration use thinchannel or hollow fiber systems rather than plate-type membranes. Thesesystems are reportedly more efficient and present less problems with clog-ging. Power costs are associated with ultrafiltration since a pressuregradient must be maintained across the membrane. The pressure to be main-tained depends on the flux desired and on the membrane surface area. Oftenit is more economical to increase surface area than to increase pressure,but this would have to be studied to determine the optimum area and pressurefor the optimum membrane pore size. From the results of this study, PM 10size membranes appear to be the largest feasible.
Both types of brine treatment require storage facilities for spentbrine after removal from brining vats prior to treatment, as well as stor-age of treated brine until reuse.
63

The question arises as to how well treated brine can be stored beforereuse. Since COD remains high in the treated brines, unless the brinesare stored aseptically there is a likelihood of bacterial or fungal growthand the possibility of causing off-flavors in cucumbers brined in the re-generated brine, Some companies have been reusing heat-treated brines andthey report no deterioration in quality of product, but the possible build-up of small molecular weight organics over a period of years cannot bedismissed. If spent brine were stored and then treated before reuse,excessive microbial growth might cause problems in sanitation. On the otherhand, if stored after treatment some microbial growth might necessitate re-treatment before reuse. One plant stores all salt as 100% saturated brineand uses no dry salt. Treated brine is recycled into the 1000 salometerholding tank and this high salt concentration evidently prevents any pro-blems of microbial growth.
Recycling of brines does seem feasible for cucumber pickling opera-t ions. From the point of view of this study, ultrafiltration appears morefavorable as it is simpler in terms of handling and personnel required, butit would be necessary for each plant to determine the most cost-effectivemethod based on its own situation,
64

PILOT-SCALE EVALUATION OF COAGULATION-PRECIPITATION FOR REGENERATIONOF 36-HOUR AND SPENT BRINES
Two large-scale pilot studies were conducted at Mount Olive PicklePlant. In the first study, 36-40 hour brine from small cucumbers was used;in the second study, spent brine. Objective of the experiments was toevaluate the feasibility of reuse of brine after treatment with lime andsodium hydroxide.
REGENERATION OF 36-40 HOUR BRINE
Brine (36-40 hr) was collected from a commercial vat of No. 1 sizecucumbers brined at 25" salometer (6.6% salt). This brine was used to re-pack cucumbers from the same commercial vat. For the pilot testing 60 galplastic-lined metal drums with plastic "heads" were used.
Four types of treatment were employed, and control with new brine wasincluded. Each test was run in duplicate, giving a total of 10 drums. Thetest drums were set up as shown in Table 38.
TABLE 38. EXPERIMENTAL DESIGN FOR EVALUATION OF COAGULATION-PRECIPITATIONFOR REGENERATION OF 36-40 HOUR BRINE
Drum No, Brine Treatment
A-l, A-ZB-l, B-ZC-l , c-z
D-l, D-Z
E-l, E-Z
New brine, 25" salometerUntreated 36-40 hr brineBrine treated by high pH procedure, no pH adjust-
mentBrine treated by high pH procedure, pH adjusted
to 5.5 with acetic acidBrine treated by high pH procedure, pH adjusted to
5.5 with HCl
65

Brines C, D, and E were prepared by the following procedures:
(1) Addition of 0.10% Ca(OH)2 while stirring(2) Addition of 50% NaOH to a final pH of 11.9(3) Quiescent settling for 2 hours(4) Decanting of 45 gallons of clear brine to each of 6 test
drums.
For C tanks, no further treatment was done. For D tanks, the pH was adjusteddown to 5.5 with acetic acid; and for E tanks, the pH was adjusted down to5.5 with HCl.
The test and control brines were used to repack the same cucumbersfrom which the 36-40 hr brine was drained. About 250 lbs of cucumbers wereplaced in each test drum. These cucumbers were at a low pH (around 5.3) andwere still carrying a high level of bacterial flora.
Table 39 shows effect of the lime-NaOH treatment on the brine. Notethat there was little or no effect on COD, indicating that most of the oxy-gen demand was associated with soluble components. An increase in Kjeldahlnitrogen was noted. This could possibly be due to solubilization of some ofthe nitrogen-containing organic materials. The major accomplishments of theprocedure were (1) decrease in pectinase activity and, (2) decrease in totalbacteria.
TABLE 39. TREATMENT OF 36-HOUR BRINE BY LIME-NaOH ADDITION
The drums were then headed down and subjected to the usual saltingschedule. Table 40 shows the progress of fermentation in the five sets oftest drums. Note that within 3 days the pH in the "C" drums was almost aslow as that in the control (A) drums. After 6 days the brines in the
66


TABLE 42. EVALUATION OF CUCUMBER PICKLES BRINED IN NEW, UNTREATED, ANDRECYCLED BRINES.
Type Type of Brine Appearance Flavor Texture Overall
Odor Taste Acceptabi l i ty
Sweet A
B
C
D
E
Dill A
B
C
D
E
New brine, 25O
Untreated brine
Floc, pH 11.5
Floc pH 5 ,a c e t i c
Floc, pH 5, HCl
New brine, 25O
Untreated brine
Floc, pH 11.5
Floc, pH 5,a c e t i c
Floc, pH 5, HCl
7 . 4 7 .5
7 . 5 7 .4
7 . 2 7 .2
7 . 0 6 . 7
6 . 8 6 . 9
7 . 5 7 . 0
7 . 2 6 . 7
7 . 0 6 . 4
7 . 3 7 . 3
7 . 8 7 . 3
7.1 7 . 8
7 . 3 7 . 9
7 . 2 7 . 2
6 . 2 6 . 4
6 . 4 7.1
6 . 7 6 . 7
6 . 2 6.1
5 . 2 6 . 0
7 . 3 7 . 4
7 .6 6 . 8
7 .3
7 . 4
6 . 8
6 . 3
6 . 8
6 . 6
6 . 6
5 . 3
7 . 2
7 .2
Rating: 10, 9 = E x c e l l e n t ; 8 , 7 = Good; 6 , 5 = Fair; 4 , 3 = Poor;2 , 1 = Barely or Not Acceptable
(Rating criteria devised by USDA Food Fermentation Laboratory)
69

drums were similar in pH, sugar, pectinase content, and Kjeldahl nitrogen.The COD in all of the recycled brines was somewhat higher than in the controlbrine.
After 18 days the quality of the brinestock was evaluated (Table 41).There was little or no difference in quality as indicated by pressure tests.Bloater content was low in all drums with one exception, one of the "C" drums.
After storage, the brinestock was processed into dill or sweet picklesand a taste panel evaluated the quality of the pickles. As shown in Table 42,all the pickles were evaluated as fair to good in overall acceptability.The least acceptable overall rating was given to dill pickles which had beenbrined in recycled brine without pH adjustment.
REGENERATION OF SPENT BRINE
In the second pilot study spent brine was regenerated by the lime-NaOHprocedure and used to brine fresh cucumbers. Again, several types of treatmentwere employed and controls with new brine were included. The experimentaldesign is shown in Table 43.
After the indicated treatments, the test brines were distributed to 10drums, each containing 260 lb of #2 size fresh cucumbers. In Table 44 effectof lime-NaOH treatment on spent brine is shown. There was no significant dif-ference in treated and untreated brine with the exception of the suspendedsolids, which decreased by almost 65% after treatment.
TABLE 43. EXPERIMENTAL DESIGN, EVALUATION OF COAGULATION-PRECIPITATION FORREGENERATION OF SPENT BRINE
Drum No.- _ I _ _ Brine Treatment
F-l, F-2G-l, G-2
H-l, H-2J - l , J -2
K-l, K-2
New brine, 30" SalometerBrine treated by high pH procedure, neutra--1ized to pH 6.0 with acetic acid, anddiluted to 30" salometerNew brine, 45" salometerBrine treated by high pH procedure, neutra-lized to pH 6.0 with acetic acid, anddiluted to 45" salometerBrine treated by high pH procedure, noneutralization, diluted to 45" salometer
70

TABLE 44. TREATMENT OF SPENT BRINE BY LIME-NaOH ADDITION
Parameter Before Treatment After Treatment
Suspended Solids, mg/l 599 209Total Solids, mg/l 241,490 210,500COD, mg/l 8,100 8,400Cl, g/ l 140 139Kjeld-N, mg/l 300 275NH4-N, mg/l 250 220pH 3.5 11.0
Brinestock quality was evaluated after 101 days (3 l/2 months). Resultsare shown in Table 45. In this experiment, quality of the cucumbers brinedin recycled brine was equal to or better than those brined in new brines.
TABLE 45. QUALITY OF BRINESTOCK FERMENTED TN NEW BRINES AND IN TREATEDSPENT BRINES
Drums Pressure Test, Units Presence of Bloaters(av. of 10 cucumbers) % of 40- -
F-l , F-2 14.6 23G-l, G-2 1 7 . 2 16H-l, H-2 15.7 14
J - l , J-2 17.9 13
The progress of fermentation was also monitored, as shown in Table 47.As shown in Table 47, the pH in the recycled high pH brine dropped within 6days to the level in the controls. Kjeldahl and ammonia N values were muchhigher initially in the recycled brines but after 6 days there were no consist-ent differences among treatments in content of these nitrogen forms.
TABLE 46. POTASSIUM CONTENT OF BRINES DURING FERMENTATION OF FRESH CUCUMBERS(2B and 3)
DaysE l a p s e dPotassium, mg/l
30" Brine 45" Brine- - .
0 110 78
6 1250 14501300 1550
22 1400 14401600 1200
71


using 6,700 tons of salt per year (10,000 tons at present, minus 3,300 tonssaved by better housekeeping); assume 90% of the 6,000 tons remaining inthe spent brines can be recovered by coagulation-precipitation or ultra-f i l t ra t ion . Reuse of this 5,400 tons would eliminate that load on thereceiving stream and in addition, offer a potential savings in salt costs,depending on the cost of treatment.
74

BIOLOGICAL TREATMENT OF WASTEWATERS FROM CUCUMBERPICKLING
Introduction
The only rational basis for undertaking wastewater treatment is cor-rection of deficiencies in quality which could cause harmful environmentalimpact. Wastewaters from the pickle industry contain several types ofconstituents which potentially could cause such difficulties, includingsuspended matter, biodegradable organics, and chlorides. Technology isavailable for removal of any or all of them to any extent desired, subjectonly to financial limitations.
Biological treatment, which includes the types of systems most com-monly installed today, is concerned principally with destruction and re-moval of biodegradable organics and, to a lesser degree, suspended matter.It must be recognized that biological treatment has no impact on chloridecontents of wastewaters. Removal of chlorides would require applicationof entirely different technology.
Goals of Biological Treatment
Biodegradable organic chemicals are those which can be utilized bybacteria and other microorganisms as sources of energy and elements re-quired by them to form additional cell material (growth). Biochemicalutilization of the organics leads to their breakdown into simpler chemi-cals and, perhaps, ultimately to inorganic ash and gases.
Although biodegradable organics in wastewater discharges may beobjectionable for many reasons, the concern most often encountered isbased on their impact on dissolved oxygen resources in receiving streams.This can be attributed to the fact that processes involved in biochemicaltransformation of carbon in organic compounds include utilization ofoxygen and production of carbon dioxide. The oxygen required is obtainedby the organisms from dissolved oxygen in the receiving water, therebyimposing a "biochemical oxygen demand" (BOD) on the limited supply ofthat gas in the stream. The total amount of BOD exerted depends upon theamount of organic chemical discharged and the extent to which it is bio-degradable. The rate at which exertion occurs is influenced by manyother variables, as well, including the numbers and types of organismspresent and several environmental factors, including temperature and pH.
75

If dissolved oxygen in the stream is used more rapidly than it canbe replaced from the atmosphere, and through photosynthesis by algae, itsconcentration will decrease. As more organics are added to a stream,dissolved oxygen concentration is reduced to progressively lower levelsuntil, eventually, adverse effects are observed on survival of varioustypes of fish and fish food organisms. Addition of sufficient organics toexhaust completely the supply of this essential element can render thewater unsuitable for supporting any fish life. Further, under those cir-cumstances, other types of biochemical reactions may lead to productionof foul odors in the vicinity of the stream.
For many years, depletion of dissolved oxygen has been the streampollution problem receiving greatest attention in the U.S.A. One shouldrecognize that this concern about dissolved oxygen levels in streams andlakes is not based on concern about human health because it never has beendemonstrated that any relationship exists between dissolved oxygen con-tent of the water and health of the population consuming that water. Ac-cordingly, stream pollution problems relating to dissolved oxygen, andtreatment processes directed towards removal of constituents causing BOD,are based primarily on maintenance of water quality adequate for supportof aquatic life, protection of recreation uses, and prevention of localnuisances.
One way in which these problems can be minimized or eliminated isthrough removing biodegradable organics from the wastewater prior to dis-charge. The origin and basic rationale for biological treatment is basedon the concept of providing facilities in which environmental conditionsare maintained to encourage completion of the biochemical reactions be-fore discharge of the wastewater. Thus, biological wastewater treatmentprocesses only cause those reactions to occur in the treatment plantbefore discharge which otherwise would occur subsequently in the receivingstream anyway. The difference, of course, is that by causing the reactionsto occur before discharge the impact on dissolved oxygen in the stream isminimized.
This goal generally is accomplished simply by accelerating reactionsin the treatment facilities to reduce necessary holding time and requiredland areas. That is done through providing optimum environmental condi-tions and increasing the numbers of microorganisms coming in contact withthe organics during treatment.
Types of Biological Treatment Systems
Of all biological treatment systems, the oxidation pond is the onewhich most closely approximates what happens in receiving streams and thisunit has a deceiving appearance of simplicity. The physical facilityconsists simply of a basin providing a holding time of weeks or months,depending upon character of the waste, during which bacteria and other
76

organisms can degrade organics in the wastewater. The reactions are thesame as those which would occur over a period of many days in the receiv-ing stream if the wastewater were discharged without treatment. Oxygenrequired to satisfy needs of the process and to avoid nuisances is furnishedprincipally through photosynthesis by algae growing in the pond. Algaeare microscopic green plants having capability for utilizing carbon di-oxide and producing oxygen in the presence of sunlight. Because energyrequired for the process is derived from sunlight, the rate of oxygensupply is controlled by the amount of sunlight intercepted and, therefore,pond area becomes the controlling design parameter. The high concentra-tions of biodegradable organics, and the corresponding oxygen demand exert-ed, in wastewaters from even a moderate size pickle processing plant wouldrequire many acres of oxidation ponds, even under the best of conditions.
Frequently, it is more economical to provide biological treatmentthrough using aerated lagoons. Again, the basic reactions which occur inthese units are the same as those in oxidation ponds or receiving streams.However, required land areas are smaller because oxygen is supplied throughman-made aeration systems which enhance transfer from the air to pondcontents. The aeration can be accomplished by introducing compressed airinto the basin, resulting in transfer of oxygen from bubbles into theliquid, or by surface aerators which cause violent agitation and enhancetransfer of oxygen through the pond surface or into liquid droplets.Adoption of this type of system removes the constraint of having to providelarge surface area to intercept adequate sunlight and leaves as primarydesign parameter the retention time of the wastewater in the pond. Inpractice, the time provided depends upon strength of the waste, its char-acteristics, pH, temperature and other eqvironmental factors, as well asrequired quality of effluent from the system. Frequently, aerated lagoonsare constructed by industries with retention times of 5-100 days. Thehigh concentrations of organics in wastewaters from pickle processing haveled to construction of facilities of 15-60 days.
The types of organisms which develop during biological treatment ofmost wastewaters have specific gravity slightly in excess of water andtend to agglomerate into particles large enough to settle at reasonablerates. Effluent from an aerated lagoon, for example, can be passed througha settling tank of approximately two hours retention, causing separationof most of the organisms from the liquid under the influence of gravity.Liquid from the bottom of this unit contains substantially higher concen-trations of microorganisms and can be returned to the aeration basin toincrease their population in that unit.
The rate of attack on organic constituents of wastewaters enteringthe aeration basin increases in proportion to population of viable organ-isms, resulting in increased treatment capacity in systems based on aera-tion, final settling, and return of the settled sludge. This approach istermed the "activated sludge" process. Although there are many differentversions, all of them accomplish the same purpose - they accelerate the
77

rate of biological destruction of organics by increasing the supply oforganisms in contact with the wastewater. This allows more extensivetreatment in a given facility, or permits construction of a substantiallysmaller plant to accomplish a specified degree of treatment of a givenwastewater. Still, the biochemical reactions which occur in this type ofsystem are basically the same as those which would occur in receivingstreams, oxidation ponds, or aerated lagoons.
Applications in Pickle Industry
Although several other biological treatment processes are available,and there are many modifications of ones already outlined, the types offacilities most commonly provided for treatment of wastewaters from pickleprocessing are aerated lagoons or activated sludge systems. Where adequateland is available at reasonable cost, the aerated lagoon usually issimpler and more economical. Where space is at a premium, activatedsludge represents a more reasonable approach. Several aspects of theseprocesses, combined with certain characteristics of wastewaters from thepickle industry, deserve at least brief attention.
It was pointed out earlier that biological treatment does not havesignificant impact on chloride content. On the other hand, it is possiblethat chlorides can have adverse effects on biological treatment becauseat sufficiently high concentration, growth of organisms may be inhibited.However, this effect usually is observed only at very high concentrationsof chlorides and it appears at least doubtful that their inhibiting effectswould be important at the levels commonly encountered in total wastewaterflow from pickle processing.
A different adverse effect of chlorides on the activated sludge pro-cess can result from increased specific gravity of wastewater with risein chloride concentration. That sometimes could interfere with settlingof organisms, which typically have specific gravity very close to that ofwater. Of course, any thing which impedes separation of organisms in thefinal settling tank can preclude adequate concentration for attainment oflevels in the aeration tank which produce acceptable treatment rates.The exact magnitude of chloride effects in treating pickle processingwastewaters in practice is not known currently.
A further consideration is that potentially harmful effects of chlo-rides may be magnified considerably in situations where they swing rapidlythrough wide ranges of concentration. These changes can be more harmfulto aquatic life than sustained operation at either low or high concentra-t ion. This question deserves serious consideration and should be exploredcarefully, especially in any treatment system in which it is planned touse short retention activated sludge, where chloride concentrations mayvary quickly.
78

A factor which sometimes is given too little consideration in planningand design of treatment facilities is production, handling and disposal ofsludge. In any biological treatment system, the biochemical reactions re-sult in partial destruction of biodegradable organics and utilization ofsome of the remaining wastewater constituents to produce new biologicalcells (growth). The proportions destroyed and converted into cells varyconsiderably depending on character of the chemical, environmental condi-tions, and period of retention in the system. Generally, aerated lagoonand activated sludge systems similar to those employed for treating waste-waters from the pickle industry produce net microbiological growth in therange of 0.1-0.5 pounds of suspended solids for each pound of BOD removedfrom the wastewater. Failure to remove these solids from the system inamounts corresponding to their net production must result in accumulationin the treatment plant. There, they either settle and reduce effectivevolume of the aeration tank or escape from the plant, which often is un-acceptable because of limitations on effluent suspended solids and becausethose suspended solids themselves exert a BOD.
The present trend in requirements for effluent quality suggests thatvery soon it will be necessary for virtually all plants to provide facili-ties for sludge handling. Some alternatives which can be considered in-clude providing very large sludge holding lagoons, land disposal, orsludge dewatering on drying beds, vacuum filters or sludge centrifugesfollowed by disposal in sanitary landfills, application to land or incin-eration. Usually, it is impossible for a biological treatment facilityto meet standards imposed upon it by EPA and State agencies without care-ful management of suspended solids. Sludge handling problems undoubtedlywill cause serious difficulties and major expense to most pickle processorsand, often, may cost more to solve than construction of the biologicalwastewater treatment plant.
Operating problems occur sometimes in treating pickle processing waste-waters because of pH variations. Organic acids in the wastewater and pro-duction of even more organic acids during biological treatment can causesharp decrease in pH in the aeration tank, even though the wastewater beingtreated is initially about neutral in pH. Successful biological treatmentrequires maintenance of reasonably uniform pH, usually in the range of6-8. Rapid variations and departures substantially outside of that rangeusually are harmful to the process and result in lower treatment efficiency.
Activated sludge and aerated lagoon systems are basically aerobicprocesses, requiring presence of excess dissolved oxygen to attain optimumtreatment and avoid odorous conditions. Inadequate oxygen supply can per-mit dissolved oxygen concentration in the aeration tank to drop below 1mg/l and, perhaps, exert significant adverse impact on treatment. Waste-waters from the pickle industry may suffer unusually serious impact frominadequate aeration because resulting increases in concentrations of organicacids also can cause drop in pH, interfering with biological treatment be-cause of low pH and low dissolved oxygen. This makes it especially import-
79

ant in treating wastewaters from the pickle industry to insure that dis-solved oxygen in the aeration basin always is maintained at least above1 mg/l. This requires provision of more conservative air supply, includingstandby equipment to cover failtures, and emergency neutralization equip-ment for addition of alkali to the aeration tank to prevent pH drop.
Biological treatment has been applied to pickle and olive wastes withgood results if critical operating parameters are controlled. Barnes andWeinburger (1958) reported the use of trickling filters, activated sludge,and oxidation ponds for pickle wastes, but no details were given. Hazel-tine (1952) conducted pilot studies on trickling filtration of sauerkrautand pickle wastes and concluded that with proper pH control and loading85% or more reduction of BOD could be achieved. He found that chlorideconcentrations of up to 5000-6000 mg/l had little effect on treatmentefficiency. Burnett (1974) reviewed effect of salinity variations on theactivated sludge system; high salinity could be tolerated if sharp variationswere avoided.
Ail North Carolina plants currently use aerated lagoons for wastetreatment. In some cases plant growth has outstripped treatment facili-ties, as is exemplified by Plant A. Plant A has two aerated lagoons, eachwith a capacity of close to '2 MGD. These ponds were designed tc accommo-date 100,000 gpd of wastewater, giving a total detention time of 40 days.However, the average hydraulic load consistently exceeds the design loadby a factor of 2 or more (Table 30). A similar situation exists at PlantB. Personal observations and observations by plant personnel indicatethat the dissolved oxygen level is frequently below that required foraerobic degradation of wastes. The low DO, coupled with shortened deten-tion time, low pH, and high chloride levels, has resulted in marginalbiological treatment efficiency.
Discharge of pickle wastes to municipal biological treatment systemshas resulted in problems in a number of cases. Kimball (1960) reportedthe effect on a municipal system in Crosswell, Michigan when increaseddemand for sweet pickles and relish caused a tripling of the BOD load froma local pickle plant. Not only did the efficiency of the Imhoff tank -trickling filter system drop from 85 to 56%, but odor and corrosion pro-blems developed. In a North Carolina town some years ago the municipalImhoff tank system had to be abandoned when wastes from the local pickleplant rusted out the system.
Effects of Treated Effluent on Receiving Streams
As pointed out previously, biological treatment does not affectchloride concentration of pickle plant wastewaters. Discharge of highconcentrations of salt can cause numerous undesirable effects of receivingstreams. Such effects have been reviewed and summarized by Field et al.(1973) and McKee and Wolfe (1963) and include the following:
(1) density stratification in receiving streams
80

(2) release of mercury from sediments due to exchange of mercurywith sodium and calcium
(3) groundwater pollution(4) increased corrosion rates(5) toxicity to freshwater fish(6) interference with use of water for stock and wildlife watering
if salt exceeds 1500 mg/l(7) interference with use of water for irrigation
Salt-tolerance varies with different crops. Crop species especiallysensitive to salt include green and field beans, celery, radish, citrusfruits , pear, apple, plum, peach, and avocado (Field et al., 1973) andtobacco (personal communication, P. Benton, N. C. Water and Air Resources,Industrial Wastes Section). The overall amount of acreage irrigated inNorth Carolina is -105,000 acres; in Michigan, 139,000; and in Delaware,15,000 (Skogerboe , 1971) .
McKee and Wolfe (1963) cited the following recommended chloride limits:domestic water supply, 250 mg/l; industrial water, 50 mg/l; irrigation,100 mg/l; stock and wildlife, 1500 mg/l.
Conclusions
Biological treatment is designed to remove biodegradable organicsfrom wastewater prior to discharge. It has no impact on chloride content.However, high chloride levels may interfere with biological treatment,especially if there are sharp variations in concentration.
The organic component of pickling wastewater is readily treatedbiologically if sufficient detention time and sufficient dissolved oxygenare available(see Appendix A). Since much of the acidity is due to organicacids, aerobic biological treatment will also reduce or eliminate the needfor pH adjustment with alkali.
There are numerous adverse effects of chlorides on receiving streams.The level of chloride considered "adverse" is highly dependent on theintended use of the stream.
81


LIST OF PUBLICATIONS
Horney, L. F., and L. W. Little, "Removal of Pectinase from Spent CucumberBrines by Ultrafiltration," presented at Annual Meeting, North CarolinaAcademy of Science (April 5, 1975). Abstract to be published in Journalof the Elisha Mitchell Scientific Society 91 (1975).-
Horney, L. F., Investigation of Coagulation-Precipitation and Ultrafiltrationfor the Regeneration of Brines in the Cucumber Pickle Industry Master'sreport. Department of Environmental Sciences and Engineering Sciencesand Engineering, University of North Carolina at Chapel Hi1l (1975).
85


APPENDIX A
INDUSTRIAL WASTEWATER SURVEY OF ACUCUMBER PICKLE PLANT
M. J. Garreis, Environmental Management and ProtectionC. L. Hagger, Water Resources EngineeringL. R. Hontz, Environmental Management and ProtectionL. F. Horney, Environmental Chemistry and BiologyD. R. Koenigshofer, Air and Industrial HygieneJ. C. Lamb, Professor of Sanitary Engineering
(Edited by L. W. Little)
A Report
from
Department of Environmental Sciences and EngineeringSchool of Public Health
The University of North Carolina at Chapel Hill
July, 1974
87

ABSTRACT
Manufacture of pickles results in large quantities of wastewater thatare not easily treated. The pickle plant studied in this project presentlyis under pressure from the State Board of Water and Air Resources to imple-ment more adequate treatment of its wastewater discharges. The combinationof present treatment facilities and operating procedures are judged to beinadequate to achieve proper treatment of the low pH, high organics andhigh salt content of effluents generated.
This investigation was undertaken to examine some areas of concern inproduction and treatment of the wastewater to provide a basis for improvingprocedures and facilit ies to reduce present treatment difficulties.
An inventory was conducted to determine the volume and character ofwastewaters generated within the plant. Further, the contribution of wastesfrom each plant manufacturing area was studied to determine where changeswould be most effective. Flow measurements and wastewater sampling andanalyses were employed to yield desired information, summarized in thereport.
Neutralization of plant wastewater with three common alkalis was studiedto compare their relative effectiveness. Small quantities of effluent weretitrated with aqueous ammonium hydroxide and sodium hydroxide and withcalcium hydroxide. A comparison of the neutralizing capacity of thesealkalis for this particular waste was obtained. Large quantities of alkalimay be required to raise the pH of the lagoon before biological treatmentcan be effective. Continued smaller additions may be needed to maintainproper pH within the system.of choice.
Sodium hydroxide appears to be the chemical
Pilot treatabili ty studies were conducted at bench scale to evaluatebiological treatabili ty by aerated lagoons and effects of variations in pHand salinity on biological treatment of wastes from the Henderson plant.Treatment facili t ies at the plant were simulated in each laboratory pilotunit through use of a series of three aerated columns.additions and transfers were made.
Daily plant effluentThree conditions were studied: 1) neu-
tralization to pH 7.0; 2) neutralization to pH 7.0 along with increasedsalinity and 3) neutralization to pH 5.5. Results indicated extensive re-movals of organics and revealed only slight differences in treatment pro-vided for the wastes of different pH.accomplished in 15-30 days detention.
Most of the organics removal is
Finally, a respiration study was carried out to demonstrate the effectof shock loads on the treatability of plant wastes. By measurement of dis-solved oxygen uptake by treatment organisms, it was possible to examinethe effects of large differences in salt content and acidity on treatability.These were less than had been anticipated.
88

INTRODUCTION
The plant surveyed produces pickles from cucumbers and other vegetablesand discharges wastes which are high in organic content (BOD), suspendedsolids, chlorides and organic acids, causing a low pH. They are treated inaerated lagoons before discharge into a small creek, a small tributary of areservoir. The treatment facilities consists of 6.7 million gallon aeratedlagoon, partitioned by baffles to provide continuous flow in series throughfour equally sized basins. A Hinde Air-Aqua system provides submergedaeration throughout the entire lagoon. The lagoon originally was designedwith a detention time of sixty days for an effluent flow estimated at100,000 gal/day.
quality in the receiving creekWater and Air Resources, whichrious effect on the tributary.suspended solids and chloride
Effluent from the lagoon has had an adverse effect on stream wateraccording to the North Carolina State Board
has ordered the plant to correct the delete-Specific areas of concern include BOD,
loadings, in addition to pH.
This preliminary study of the problem was undertaken as a special pro-ject by a class studying "Industrial Water Quality Management," a coursein the Department of Environmental Sciences and Engineering, the Universityof North Carolina at Chapel Hill.
EXISTING TREATMENT FACILITIES
All industrial wastewater flows from the plant, including those relateddirectly to preparation of product, cooling waters, cleanup flows and stormrunoff, are collected in a single sewerage system for treatment and disposal.The combined flow is screened for removal of some of the large suspendedmatter and currently is subjected to treatment in an aerated lagoon beforedischarge.
The screening operation is manual and has been observed during plantvisits to be sufficiently clogged to permit overflow of unscreened waste-water into the aerated lagoon. Flow passing through the screen is dis-charged into the lagoon near one end of the first "bay."
The aerated lagoon is approximately 270 ft wide by 330 ft long, with10 ft water depth. It is divided into 4 bays by 3 longitudinal timberbaffles, with openings at alternate ends which permit passage of flowthrough them in series. Condition of the facility suggests that some ofthe flow may short-circuit through leaks in the baffle walls, but that isnot viewed as a serious problem in view of the long detention period.
89

Total volume of the aerated lagoon is about 6.7 million gallons,providing detention of 67 days at the design flow of 100,000 gal/day. Actualflows through the plant are substantially higher than the design value,however, especially during the fresh pack season and when there is runoffduring rainfall. This results in actual detention periods substantiallylower than the design value.
Air supply is provided by two 40 hp blowers, rated at 595 cfm each.The air diffusion system is based on use of perforated plastic pipe (HindeAir-Aqua system). Because some of the tubes are submerged in bottom depositsand have clogged orifices, the air diffusion pattern throughout the basinsis somewhat irregular and the rate of air application appears to be too low,at least by visual estimate.
Recently an additional facility was installed to permit metering offlow entering the aerated lagoon, neutralization with sodium hydroxide orammonium hydroxide, and addition of nutrients. The Parshall flume, pHcontrol equipment and nutrient addition facilities were not in operationduring these visits. The low elevation at which the facilities were in-stalled, apparently, will require lowering the water level in the aeratedlagoon and reduce effective volume of that unit when operation of the newfac i l i ty i s in i t i a t ed la ter .
A 1970 report of the North Carolina Department of Water and Air Re-sources indicated influent BOD values ranging from 700-5,000 mg/l, witheffluent BOD of 3100 mg/l. pH of the influent waste was 3.6-4.2 and pHin various sections of the aerated lagoon varied from 3.4-4.1, leading to arecommendation that the waste be neutralized with sodium hydroxide orammonium hydroxide. Analyses for nutrients indicated presence of aboutone-half the recommended levels of nitrogen and phosphorus and addition ofboth nutrients on a regularly scheduled basis was recommended. The reportindicated that the treatment facilities were not performing as designed(14% BOD removal instead of 90%) because of low pH, nutrient deficiencies,high chloride content, and inaccurate selection of design BOD load.
PURPOSE AND SCOPE
The class undertook a limited in-plant study of processes and prac-tices, and investigated biological treatability of process wastes byaerated lagoon. The period of study was March-April, 1974. During this"off season" major plant activities are repair and maintenance of brinetanks, the firming process, processing and packing of sweet and sour pickles,and relish-making operations, all using pickles stored in brine (brinestock). The volume and nature of wastewaters produced and the range ofactivities are substantially lower than in the "green season."
90

Four operating processes within the plant were identified as majorsources of wastewater. Grab samples were collected and analyzed to deter-mine waste constituents and attempts were made to measure flows generatedby each process. Plant practices were observed and suggestions offeredfor their modification to reduce waste materials reaching the lagoon.
The treatability studies focused on determination of whether wasteswith these characterists can and should be treated biologically and, to alimited extent, under what conditions. Also, laboratory studies were con-ducted to determine which alkali would be most effective in neutralizingthe low pH plant effluent. Shock effects of low pH and changes in chloridelevels on biological activity of the organisms were examined through respi-ration rate studies. Of necessity, all of these studies were conductedwithin a limited time frame.
IN-PLANT SURVEY
Objective
The objective of this phase was identification of the many chemicaland organic constituents of the wastewater and measurement of the volumeof wastewater contributed to the lagoon by each of four plant operatingareas: 1) the processing room where cucumbers are colored and finned,where sweet pickling is accomplished and where relish is chopped and pre-pared; 2) the manufacturing and packing area where pickles are sliced andwhere products are packed into jars and capped; 3) the pasteurizing areawhere the sealed jars are pasteurized, labeled and packed for shipment;and 4) the tankyard,
Procedure
Since a limited study had been done previously by a company engineer,a decision was made to utilize the same sampling points so that data mightbe compared. A sketch of the drainage system is shown in Figure 1. Theprocessing room sample point was a large, shallow, open manhole (Drain 15B)on the hill overlooking the lagoon. Three tankyard drains also emptiedinto this manhole but the wastes could be distinguished one from anotherdue to three separate and easily sampled discharge pipes within the manhole.
Two sampling points were identified in the manufacturing area. Thewaste collection box at the end of the drain under Line 6 served as onesample point, collecting wastes from the capping lines and the picklesbeing packed on Line 6. The second sampling point was the waste collectionbox approximately 15 feet below the confluence of the drains serving Lines3 and 5 and the sorting and cutting area. In the pasteurization area,samples were collected from the drain two feet upstream from its dischargeto the waste collection box.
91

Flow measurements were made with a four-gallon bucket and stop watch.This method was not satisfactory for in-plant sampling due to the condi-tion of the drains which did not permit a free flow into the bucket. Thelarge volumes of water discharged from the pasteurizing room at Drain 15Balso made measurement difficult.
One night was spent observing the cleanup crew.
A few simple experiments were also carried out on a pilot size screen-ing device (hydrasieve) to determine its applicability for screening solidsfrom the lagoon influent.
All chemical tests on the samples collected were performed in accor-dance with the procedures outlined in Standard Methods' for the Examinationof Water and Wastewater. The laboratory analyses were conducted by theUNC Wastewater Research Center.
Results
From a survey of the wastewater flows it was found that the drainagesystem from the pasteurizing area also collected wastes from the concen-trated brine and pickling liquor preparation area. The processing roomdrains directly to the lagoon through a pipeline which also collects stormrunoff from the railroad yard and salt storage area. The manufacturing-packing area and the pasteurizing area drain to a sewer running in frontof the building, which also collect wastes from the boilers and tankyardbefore emptying into the lagoon.
Silt observed in all tankyard drains and during periods of heavy rain-fall is carried to the lagoon. Several tankyard drains were completelyclogged and had apparently been so for some time since storm runoff andtank drainage had worn deep rivulets in the hillside around and alongsidethe drains. The steep hillsides around the lagoon are essentially barrenpermitting sediment to be carried to the lagoon. Siltation in the lagooncontributes to the clogging of the air bubbling system and to the need fordredging.
Screens were used on several of the inside drains in an attempt toprevent large pickles and pieces of pickle from reaching the lagoon. Thesescreens were generally in poor condition and often did not fit properly.The basket screen at the end of Lines 3 and 5 functions only during periodsof high flow. During periods of low flow the deteriorated condition of thedrain lip allows wastes to run under the basket and directly to the sewer.The screens were generally observed to need cleaning. Several times em-ployees were observed removing the screens and flushing screened materialsinto the sewers.
The influent screen at the lagoon was clogged with screened materialson every visit. On several occasions the effluent poured over the clogged
92

screen into the lagoon carrying large pieces of material with it. Solidsremoved from the screen were piled on the ground to one side where rain-fall overflow washed them directly into the lagoon.
From observing the night shift cleanup crew, it was noted that thepoor condition of the flooring in the packing area hindered attempts tosweep the floor clean and necessitated the use of additional hosing to re-move food particles trapped between the bricks in the floor. These foodparticles were hosed to the drains and subsequently into the sewers. At-tempts to encourage plant personnel to measure the volumes of water usedin evening cleanup by reading the water meters were unsuccessful. Accor-dingly, no data was collected on this activity.
The analytical data and flow measurements are summarized in Tablesl-5. All of the wastes were acidic, with pH generally less than 4.0. Themost acidic wastes were generated in the processing area and Line 6 of themanufacturing-packing area.
Examination of the combined pasteurizing, manufacturing-packing andboiler room effluents collected at a manhole outside the building showlower BOD, total solids, organic carbon and acidity presumably due to dilu-t ion. Chlorides and pH, however, remained substantially unchanged, forwhich there currently is no explanation.
Extremely simple preliminary tests on plant wastes indicate a strongpotential for the reduction of organic loading through the use of a Hydra-sieve as seen from the reduction in DOD and solids given in Table 6.
Discussion
Experience during this limited study indicated that the wastes donot lend themselves to grab-sampling or unsophisticated flow measurements.There was high variability in both volume and nature of the wastes duringthis two-month period of the off-season. Reliance on averages and extrap-olation of data collected during the off-season to the "green season" isboth unrealistic and unreliable. A well-planned, organized study over anentire year of the manufacturing process and of the wastes it generates isneeded to provide a comprehensive and realistic analysis of the volume andnature of the wastewater involved and to determine those areas of theplant where in-plant process changes and water conservation will substan-tially reduce waste effluent. This study must be backed up by competentand full laboratory analyses of wastes so that the best treatment methodsmay be determined. Short cut solutions will only result in capital expen-ditures which offer little or no improvement. The age and operation ofthis processing plant together with variable nature of its wastes necessi-tates the services of a consulting engineer to develop a satisfactory solu-t ion.
The volume of wastes generated in those processes having the greatestbrine concentration, the highest oxygen demand and the lowest pH determine
93


impact of the wastes on the lagoon. Therefore, it is imperative to acquirea close approximation of the contribution of each process to the totallagoon capacity over the different "manufacturing seasons" of the year.Monitoring of water lines to each individual process would provide informa-tion on how, where and when water is used and, teamed with good laboratoryanalyses of wastes generated, would permit determining the impact of eachprocess on the lagoon.could become apparent.
Times of potential shock loading in the lagoonFurthermore, this information would be useful in
determining those plant areas where water conservation could make substan-tial contributions to waste reduction.
Organic suspended solids reaching the lagoon cause excessive oxygendemand and create accumulations of sludge which clog the air diffusionsystem and may necessitate occasional draining and dredging of the lagoon.High solids concentrations in the wastewater from the manufacturing-packingarea apparently originated with draining of the coloring and firming vats,the wastewater from relish washings, the practice of dumping syrups left invats after packing the products and poor cleaning practices in the manu-facturing-packing area. Control of these wastes alone would greatly reducethe volume of organic materials reaching the lagoon.
From a standpoint of oxygen depletion , all of these wastes are impor-tant. The syru wastes are especially significant due to their excessivelyhigh oxygen demand.
The installation of a Hydrasieve on the lagoon influent would preventmany organic solids not trapped by in-plant screening from reaching thelagoon. Organic wastes too fine to be screened by plant floor drains andpickles and other vegetable products carried by tankyard drains to the la-goon could be effectively trapped thereby reducing the oxygen-demand onthe lagoon.
Recommendations
1. Retain a consulting engineer.2. Meter the water flow to each process to obtain accurate data on the
wastewater generated.3. Reduce the solids reaching the lagoon in plant wastes.
a) Initiate equipment and floor cleaning by dry sweep whenever possi-ble. This may require closing manufacturing lines 15 minutes be-fore the end of the shift and all factory line workers sweepingthe machines with hand brushes and pans.
b) Eliminate hosing of organic materials to the floor drains wheneverpossible. If hosing is required for final cleanup, utilize high-pressure, low flow hoses to reduce volume of wastewater generated,but only after dry sweep.
c) Repair flooring in the sorting and packing area so that wastes maybe swept up easily and not trapped between bricks requiring use ofhigh-power hoses for flushing and cleaning floors.
100

d) Repair floor drains so that screens fit tightly.e) Establish a program for routine maintenance of all floor drains,
screens and waste collection boxes. Provide adequate disposal forscreenings and discourage practice of flushing screened materialsto sewer.
f) Evaluate the possibility of screening wastewater from the relishoperation to remove fine pieces and their recovery.
g) Pickles on the floor or platforms should be swept up and placed ingarbage barrels -- not flushed or swept into sewers or into thecracks around vats.
h) Exercise greater care in removing by netting the cut pickles fromthe alum process into the transport vats.
i) Establish routine maintenance for the influent screen at the lagoonand provide regular and adequate removal of screened wastes.
4. Install a Hydrasieve for the screening of lagoon influent.5. Control tankyard erosion.6. Establish clear communication between the decision-making offices, the
laboratory and engineering and maintenance regarding policies andimplementation of these recommendations.
7. Instruct plant personnel on the importance of all of these measuresand why they must be accomplished.
BIOLOGICAL TREATABILITY STUDY
In attempting to determine the treatability of wastes from this plant,many variables should be examined thoroughly. The fact that time availableto this group for the study was rather limited required that some assumptionsbe made and that the group of factors studied be limited to a few of the mostimportant ones.
It was assumed that before substantial improvement in the treatmentsystem can be made, three conditions must be corrected. These include 1)removal, prior to discharge into the lagoon, of large organic solids in theplant effluent, 2) substantial increase in the volume of air supplied foraeration, and 3) possible addition of certain nutrients required by themicrobial population of the treatment system but not available naturallyin this wastewater in optimum quantities. These changes are consideredprerequisite to proper treatment and were therefore incorporated into ourstudy.
Once these conditions were eliminated or corrected, the two most im-portant variables remaining and the ones which distinguish pickle wastesfrom practically all other food processing wastes are the low pH and thehigh chloride content. It was felt that knowledge of the effect of thesefactors on treatability would be most valuable in improving future treat-ment.
101

Therefore, three specific conditions were studied. They were (1)neutralization of plant effluent to pH 7.0, (2) neutralization to pH 7.0plus slight increase in chloride content, (3) neutralization to pH 5.5.Comparison of 1 with 3 indicates the degree of neutralization necessarywhile comparison of 1 with 2 shows the effect of increased chloride content.Should large scale water conservation measures be practiced in the futurewithout similar decreases in usage of salt, the chloride concentration ofthe lagoon could be expected to rise significantly above its present level.
The treatability study was designed to simulate treatment receivedin the lagoon. This was accomplished by daily batch additions of planteffluent, obtained from this plant and stored under refrigeration, to aseries of aerated columns.
The cylinders simulated the first three stages of this plant's aeratedlagoon. The nine columns ranged in height from 26-35 inches and in diameterfrom 3 3/4-4 l/4 inches. Several of these had conical bottoms while theremainder were flat bottomed. These minor variations in contour and di-mensions should not have influenced the experiment. Each column had a tapon the side for removal of samples for transfer and analysis. No attemptwas made to sinulate existing air supply conditions or to determine optimumair requirements. Instead we attempted only to maintain the air supply ata level such that there would be no concern for its adequacy. Air supplyto individual columns was from a common manifold. Originally, diffuserswere used for aeration. After several days these were replaced with largeopening pipettes since the air flow was inadequate. Air supply was regu-lated by screw clamps.
The units were arranged in three numbered sets, each of which hadthree columns in series ("A," “B," and "C"). Each column contained 3 liters.The "A" (first unit of each set of three) columns were begun with a seedmixture of plant pond effluent, effluent from the trickling filter at theMason Farm Sewage Treatment\Plant and Morgan Creek water. The other columnswere empty. Each day, 200 ml (l/15 of the column volume) were removed fromthe "A" columns and added to the "B" columns until the "B" columns reached3 l i t ers . After that 200 ml were removed from "B" and added to "C" andfrom "A" to "B". Columns "A" were fed each day from a composite sample oflagoon influent collected 3 times a day at the plant. Several days' sampleswere mixed together for the feed. Since it was assumed that coarse screen-ing would necessarily be provided, the sample was passed through coarseweave gauze which removed the large pieces of pickle but none of the smallersol ids .
Losses due to evaporation were made up daily. Transfers and feedingof the columns were made daily. The pH of the columns was recorded dailyas a simple monitoring test. More extensive analyses were done less fre-quently.
Each set of columns was operated under different conditions. Group1 was closest to common treatment procedure in that the sample was neutral-
102

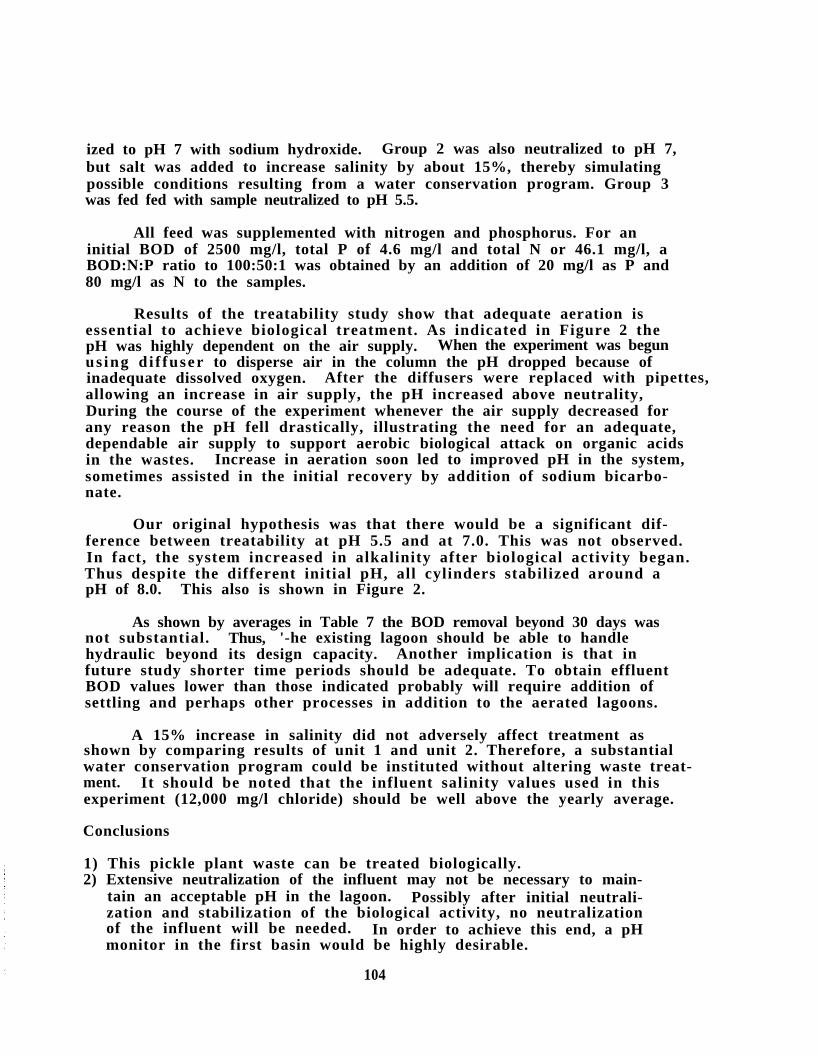
ized to pH 7 with sodium hydroxide. Group 2 was also neutralized to pH 7,but salt was added to increase salinity by about 15%, thereby simulatingpossible conditions resulting from a water conservation program. Group 3was fed fed with sample neutralized to pH 5.5.
All feed was supplemented with nitrogen and phosphorus. For aninitial BOD of 2500 mg/l, total P of 4.6 mg/l and total N or 46.1 mg/l, aBOD:N:P ratio to 100:50:1 was obtained by an addition of 20 mg/l as P and80 mg/l as N to the samples.
Results of the treatability study show that adequate aeration isessential to achieve biological treatment. As indicated in Figure 2 thepH was highly dependent on the air supply. When the experiment was begunus ing d i f fuser to disperse air in the column the pH dropped because ofinadequate dissolved oxygen. After the diffusers were replaced with pipettes,allowing an increase in air supply, the pH increased above neutrality,During the course of the experiment whenever the air supply decreased forany reason the pH fell drastically, illustrating the need for an adequate,dependable air supply to support aerobic biological attack on organic acidsin the wastes. Increase in aeration soon led to improved pH in the system,sometimes assisted in the initial recovery by addition of sodium bicarbo-nate.
Our original hypothesis was that there would be a significant dif-ference between treatability at pH 5.5 and at 7.0. This was not observed.In fact, the system increased in alkalinity after biological activity began.Thus despite the different initial pH, all cylinders stabilized around apH of 8.0. This also is shown in Figure 2.
As shown by averages in Table 7 the BOD removal beyond 30 days wasnot substantial. Thus, '-he existing lagoon should be able to handlehydraulic beyond its design capacity. Another implication is that infuture study shorter time periods should be adequate. To obtain effluentBOD values lower than those indicated probably will require addition ofsettling and perhaps other processes in addition to the aerated lagoons.
A 15% increase in salinity did not adversely affect treatment asshown by comparing results of unit 1 and unit 2. Therefore, a substantialwater conservation program could be instituted without altering waste treat-ment. It should be noted that the influent salinity values used in thisexperiment (12,000 mg/l chloride) should be well above the yearly average.
Conclusions
1) This pickle plant waste can be treated biologically.2) Extensive neutralization of the influent may not be necessary to main-
tain an acceptable pH in the lagoon. Possibly after initial neutrali-zation and stabilization of the biological activity, no neutralizationof the influent will be needed. In order to achieve this end, a pHmonitor in the first basin would be highly desirable.
104

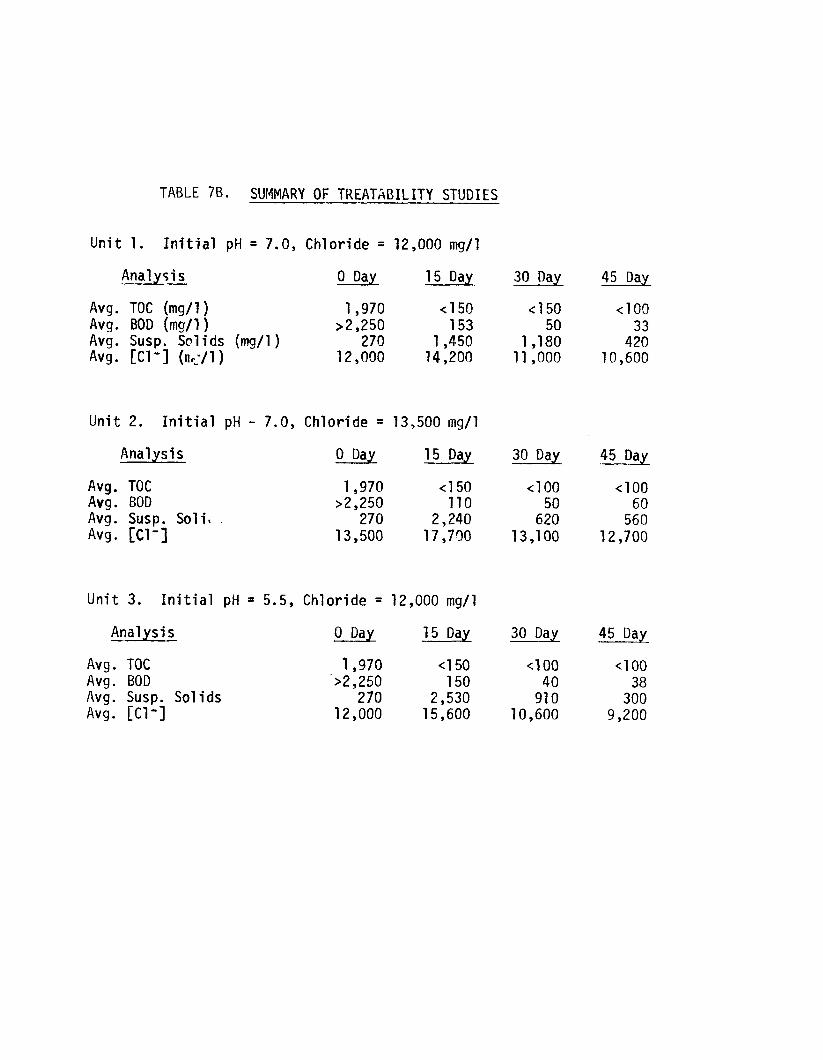

3) A water conservation program that increases salt concentration will notadversely affect treatment.
4) Unless further studies show differently, screening and nutrient additionshould be practiced.
5) The existing lagoon has sufficient detention time for flows significantlygreater than the design flow of 100,000 gals/day.
5) Adequate aeration is crucial to treatment.
WASTEWATER NEUTRALIZATION
Three alkalis were compared for neutralization of the plant wastewater.The purpose of the experiment was to provide a basis for determining the mosteconomical and effective alkali for wastewater neutralization should largequantities be needed in the future, either for initial raising of the lagoonpH or for maintenance of the proper pH once biological treatment has begun.
Composite samples (1 liter) of plant effluent were titrated with 5%sodium hydroxide, 30% ammonium hydroxide, or solid calcium hydroxide, whichwas weighed out in 0.1 gm aliquots that were slurried with distilled waterjust prior to use. The resulting pH of the plant wastewater was recordedafter each addition of alkali.
The titration curves for these bases are shown in Figure 3. Table 8summarizes the quantities of bases required to neutralize plant wastewaterto pH 5.5 and to pH 7.0.
107

It should be noted that the above figures are in gals/1000 gals forsodium and ammonium hydroxide, but are in lbs /l000 gals for calcium hy-droxide. Availability and cost, in addition to other factors, should beconsidered before selecting the alkali to use. For example, the possibleeutrophic effects of ammonium on the receiving stream, and even the reser-voir, must be evaluated carefully before using that base for neutraliza-t ion.
Conclusions and Recommendations
1. If available locally at a competitive price, sodium hydroxide appearsto be the chemical of choice because of availability of storage andfeed facilities at the site, ease of handling, and minimum precipitateproduction.
2. Ammonium hydroxide should not be added in excess of nutrient require-ments, if any, because of potential downstream eutrophication problems.
3. pH should be monitored in the aeration basin, rather than only inuntreated influent waste, to insure adequate control for the biologicaltreatment process.
RESPIRATION RATE STUDY
Because of the great variability in flows and wastes characteristics,it was important to consider the effects of shock loads upon the biologicalsystem. Two types of shocks were considered in this study: low pH andchanging salt concentrations.
Effects upon biological activity were noted by changes in the respira-tion rate of the microorganisms. The procedure followed was in accordancewith a technique developed earlier, which has been reproduced in the Appendix.A brief outline of the procedure follows.
Mixed liquor (ML) from several of the pilot lagoon units was mixedand aerated for two days without feeding to allow sufficient time for com-plete utilization of readily oxidized material. At that point, the endog-enous phase of microbial growth had been reached and oxygen uptake was ata minimum (endogenous rate). When material that can be utilized by theorganisms is added to a biological system in that condition, an increasedrate of oxygen uptake (respiration) is observed. No increase in respira-tion indicates that the material added is not utilized. A decrease in therespiration rate indicates a toxic effect.
The dissolved oxygen (DO) was measured with a Weston-Stack DO meterusing a probe tapered to fit into a BOD bottle. A stop watch was used tomeasure 1 minute intervals at which time DO was recorded. When DO wasplotted against time, a straight line was obtained, the slope of whichgave the respiration rate which was compared with the endogenous rate.Since the rate of oxygen uptake depends upon the number of organisms pre-sent, the respiration rate was calculated as mg/l of oxygen used per minute
109

per gram of suspended solids. The suspended solids indicated the relativenumber of organisms present. In this way, rates can be comparable betweenruns, in spite of different suspended solids values.
The BOD bottle held 300 ml. Twenty ml of feed (a composite sample asin the treatability study) was added and then the bottle was filled withthe aerated mixed liquor, To examine pH effects, the pH of the feed solu-tion was reduced by addition of HCl and respiration rate measured at eachvalue. Initial and final pH values were measured for each run, hut nochange was observed during the rate measurements.
The mixed liquor plus the feed had a Cl' content of 13,O0O mg/l. Toincrease sal inity, NaCl was dissolved in the feed prior to addition of theML. To see whether decreased salinity would have a beneficial effect, a1:2 dilution was made of both ML and feed, This also decreased the suspendedsolids by half. Nevertheless, data comparison and interpretation werefeasible because of calculating respiration rates as mg/l DO per gram ofsuspended solids, or as percent of endogenous rate.
The mixed liquor had been acclimated to a pH of 6.9 and Cl- concentra-tion of 13,000 mg/l. Figure 4 shows the changes in respiration rate whenfed samples of other pH. It is seen that the respiration rate decreaseswith decreasing pH of the shock load. However, it should be noted that evenat the lowest pH (1.5), the respiration rate still was higher than theshocks of low pH. That is not to say that such pH levels could be sustainedindefinitely without detrimental effects. pH levels near neutrality allowedmaximum utilization of oragnic material, which is most desirable in wastetreatment.
Figure 4 also shows effects of changing the salinity. While increasingthe salt concentration did reduce the respiration rate, it remained abovethe endogenous rate. Decreasing the salinity by half had neither a harmfulnor beneficial effect upon biological activity. Again, it is important tonote that this study shows acute effects due to shock loads and not longterm effects, which may be either more or less serious under various circum-stances.
Conclusions
1. The microorganisms are very resistant to low pH shock loads. Wastesshould be neutralized to maintain generally desirable pH throughoutthe system and acceptable effluent pH, without major concern aboutshock loadings of short duration.
2. Increased salinity does not have a greatly detrimental effect initially.Although further study on long term effects is necessary, water con-servation programs should not be delayed for fear of harmful effectsto the aerated lagoon by the resulting increased salinity.
110


Conclusions
1.
2.
The microorganisms are very resistant to low pH shock loads. Wastesshould be neutralized to maintain generally desirable pH throughoutthe system and acceptable effluent pH, without major concern aboutshock loadings of short duration.Increased salinity does not have a greatly detrimental effect initially.Although further study on long term effects is necessary, water conser-vatior programs should not be delayed for fear of harmful effects tothe aerated lagoon by the resulting increased salinity.
SUMMARY OF CONCLUSIONS AND RECOMMENDATIONS
A consulting engineer should be retained and detailed studies continued.Water flows to each manufacturing process should be metered.Suspended solids should be reduced by repairing floors and otherwiseimproving dry cleanup procedures, improving maintenance of screens, andremoving or recovering suspended matter from the relish operation.Improved screens should be installed at the lagoon influent and bettermaintenance, routines established.Erosion from the tankyard area should be reduced.Effluent from the manufacturing plant can be treated biologically.pH should be monitored in the first bay of the aerated lagoon.After establishing satisfactory biological activity it may not benecessary to add alkali continuously.Subject to further studies, nutrients (nitrogen and phosphorus) shouldbe added to insure BOD:N:P ratios of 100:5:1.Adequate aeration is essential for successful biological treatment.The existing 1agoon has sufficient detention to provide a high degreeof BOD removal for “lows significantly greater than 100,000 gal/day.Microorganisms involved in treatment of this wastewater appear to beresistant to low pH and variable chloride shock loads.Water conservation can be undertaken without fear of significant harm-ful effects to biological treatment through increased salinity withinthe range which probably will be encountered in practice.Communications with plant personnel concerning company policies andimplementation of wastewater control procedures should be enhanced.
112

APPENDIX B
COST OF PICKLE BRINE RECOVERY
Forest 0. Mixon, Research Triangle Institute
Based upon a conceptual model of pickle manufacture that delineateswaste streams, their rates, and their concentrations, costs have beenestimated for several processes for salt concentration and for organicremoval.
Based upon these estimates, reverse osmosis, butane freezing,distillation, and submerged combustion evaporation are most economicalfor salt concentration; biological oxidation is more economical for organicremoval.
OUTLINE
1.0 A CONCEPTUAL MODEL OF PICKLE MANUFACTURE
1.1 TANK-YARD PROCESSES1.2 PROCESSING ROOM PROCEDURES1.3 BRINE CONCENTRATING REQUIREMENTS
2.0 METHOD OF COST ESTIMATION
2.1 CAPITAL COST ESTIMATION2.2 OPERATING COST ESTIMATION
3.0 COST ESTIMATES FOR BRINE CONCENTRATION
4.0 COST ESTIMATES FOR ORGANIC REMOVAL
113

1.0 A CONCEPTUAL MODEL OF PICKLE MANUFACTURE
In the manufacture of cucumber pickles, a large portion of the cucum-ber harvest must be preserved for processing at a later time. This preser-vation is normally accomplished by diffusing salt into the cucumbers. Toaccomplish this, the cucumbers are normally soaked in strong brine solutions,with periodic replacement of salt to maintain sufficient driving force fordiffusion. A reasonable goal is to introduce salt into the cucumbers to thelevel of 15 percent or so, approximately 0.188 lb salt/lb of cucumbers.
Subsequently, most of this salt must be removed from the cucumbers byprocessing room: prior to packing.
1.1 TANK-YARD PROCEDURES
It is assured that salt is introduced into the pickles in the followingstaged process. First, pickles are soaked in saturated brine until equili-bration; second, a small amount of depleted brine is withdrawn to make roomfor saturated brine addition; third, equilibration proceeds; and fourth,the process is repeated.
At stage by immediately following brine addition, there are
cn lb salt/lb cucumbers within the cucumbers, and wn lb salt/lb water in
the brine. Then denoting the n-plus-first stage as that resulting afterequilibration, the salt concentration in the cucumbers will equal that inthe brine, thus,
Cn+l = Wntl= cn+wn
2
(The voidage within the cucumbers is taken as 50 percent so that thereexists, in normal processing , approximately 1 pound water/lb cucumbers).
At this point dn+1 lb of water are withdrawn to make room in the tankfor the addition of another dn +l lb of water containing salt near thesaturation point. lb of salt are withdrawn from the vessel,and Bdn+1
Blb of salt are ad ded to the vessel as nearly saturated brine,
where is the replacement brine concentration in lb salt/lb water.
After the addition of concentrated brine, the salt content withinThis expression is to be set equal
114


Per pound of salt stock, get the following:
0.411 lb H20 0.0399 lb sa l t
0.259 lb H20 0.0377 lb sa l t
0.147 lb H20 0.0250 lb sa l t
0.079 lb H20 0.0144 lb sa l t
With Totals 0.896 lb H20 0.177 lb salt
+ 1.00 lb stock 0.188 lb sa l t
0.493 lb salt
Thus, per pound of cucumbers, the draw-down from the tanks is 0.896 lbwater containing 0.177 lb salt or 0.131 lb salt/lb water. In addition,there is l-lb water remaining in the tank containing 0.188 lb salt.
Assuming that 500,000 bushels of cucumbers are processed in 100 daysduring the salting down season, and assuming furthermore 9 gal/bushelcucumbers and 4 lb/gal, the estimated weight of cucumbers is 18 x 106 lbs.At 0.896 lb water/lb cucumber, the water rate is then 16.1 million lb/l00days or approximately 19.4 thousand gal/day.
The final brine solution from which the cucumbers are withdrawn forprocessing contains 0.188 lb salt/lb water. This brine is sufficientlyconcentrated that it needs no further processing and can be saved as isuntil the next season. It is assumed that this brine is stored in thetanks until the following season at which time it is reconcentrated withsaturated brine to begin processing the new crop.
1.2 PROCESSING ROOM PROCEDURES
It is assumed that in salt removal, each lb of cucumbers containing0.188 lb salt is contacted with 2-lb of water and allowed to equilibrate.After equilibration there results l-lb of cucumbers containing 0.0626 lb
116

salt and 2-lb water containing 0.125 lb salt. This dilute brine streamconstitutes the first processing waste.
The lb of cucumbers is washed a second time with l-lb of water. Suffi-cient time for equilibration is not allowed, however; the washing processis stopped at the point at which the cucumbers contain 0.038 lb salt/lbcucumbers. The dilute water stream from this washing containing 0.025 lbsalt/lb of water is the second processing waste. [The figure 0.038 lb salt/lb cucumbers represents an average salt concentration weighted accordingto the relative production of dills and sweets. We have assumed 60 percentdills (4.7 percent salt) and 40 percent sweets (2.5 percent salt). Theweighted average gives 3.82 percent salt remaining in the pickles or 0.038lb salt/lb cucumbers.]
The rate of first processing waste, based upon an assumed 200 days ofoperation, is 21,600 gal/day containing 0.0626 lb water/lb salt. In brinerecovery, the stream must be concentrated to 3 lb water/lb salt, or 17,500gal/day of water must be removed, leaving 4,100 gal/day of brine at a saltlevel of 0.33 lb salt/lb water.
Similarly, the rate of second processing waste is 10,800 gal/day con-taining 40 lb water/lb salt. This stream must be concentrated to 3 lbwater/lb salt; thus, approximately 10,000 gal/day of salt free water mustbe removed to leave 800 gal/day of brine with concentration 0.33 lb salt/lb water.
A schematic diagram of these streams along with the flow rates andcompositions is given in Figure 1.
1.3 BRINE CONCENTRATING REQUIREMENTS
Comparing water removal rates, i.e., 12,000 gal/day from the tank yardbrines versus a total of 27,500 gal/day from processing room waste, indicatesthat equipment sized to handle the latter could easily handle the former.Thus, attention is given to the design of equipment to handle mixed pro-cessing room wastes delivered at a rate of 32,400 gal/day containing 0.092lb salt /lb water. Separating equipment must be sized to remove 27,500gal/day of water leaving 4,900 gal/day of saturated brine to be used insubsequent processing.
117
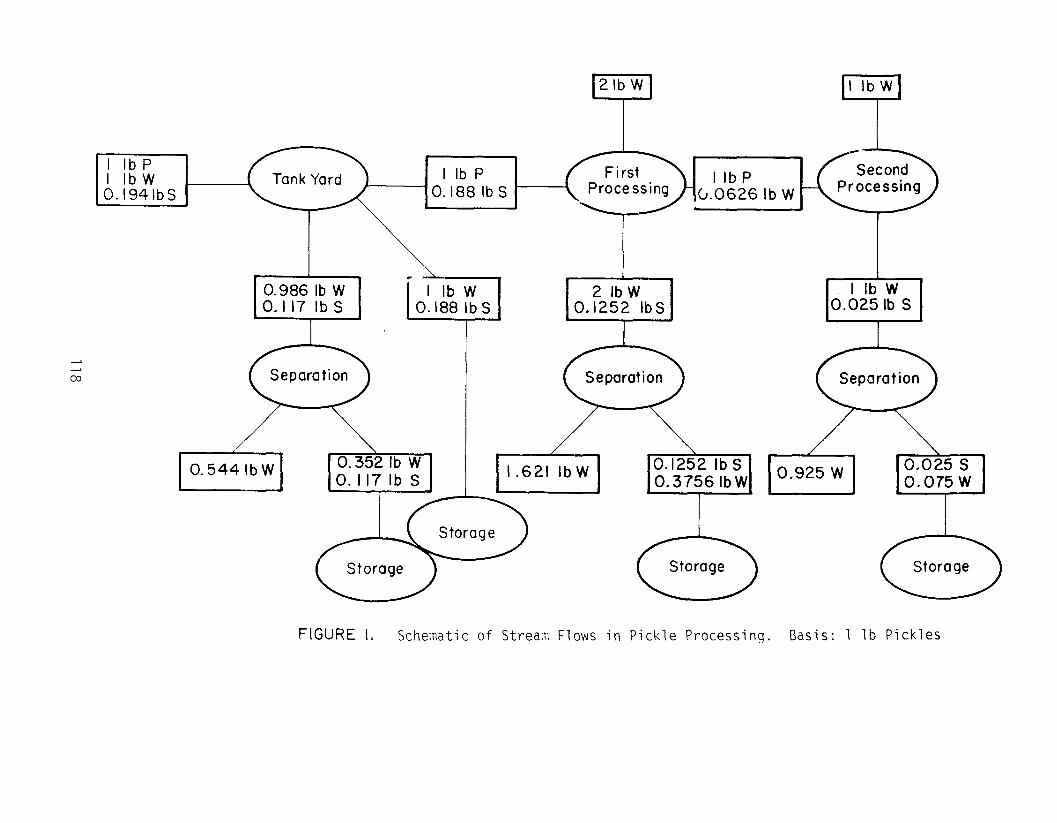

2.0 METHOD OF COST ESTIMATION
Costs have been estimated using a slight modification of a methoddeveloped by the Office of Saline Water1 in which overall process costs arebased on the costs of the major pieces of equipment. The cost of the majorpieces of equipment must be estimated from vendor quotes, from the litera-ture, or from other means of determination, and costs other than those formajor equipment are taken as fixed percentages of the major equipment costs.
Total annual operating costs of a plant are comprised of
1) Capital costs , including major equipment, other materials,construction labor, indirect labor, taxes, insurance,engineering, and interest on construction capital, and
2) Annual operating costs, including the amortized capitalcost, interim replacement, taxes, insurance, operatinglabor, and overhead. The total annual operating costs can,if desired, be expressed as the total cost per unit ofproduction. In the case of pickle brine processing, signi-ficant bases for report cost/unit of production might betotal cost per ton of pickles or total cost per ton of saltrecovered.
2.1 CAPITAL COST ESTIMATION
Capital costs are estimated as follows:
Assuming that a process schematic has been drawn and that major itemsof equipment have been specified and their size determined, costs areestimated for these major items of equipment; these costs are designatedas E.
In the construction of-the plant, other materials must also be purchased,piping, electrical wiring, small pumps, instrumentation, etc. These costsare referred to as other materials costs, M, and are taken as 40 percent ofE.
Labor must be provided for construction of the plant. Constructionlabor, L, is taken as 60 percent of E.
lJenkins, David S. et al., "A Standardized Procedure for EstimatingCosts of Saline Water Conversion", Office of Saline Water, March 1956.
119

Labor indirect charges, including payroll burden, supervision, andconstruction equipment, is 43 percent of the labor charges, or has 25.8percent of the major equipment charges.
The sum of these four costs is designated as the basic plant cost(BASC) and is equal to 2.258 times the major equipment cost.
To the basic cost must be added engineering cost, (12 percent of thebasic plant cost), and tax and overhead (12 percent of the sum of the basicplant cost plus engineering charges) to get the fixed capital investment(FCI).
Working capital and startup funds at 11 percent of the fixed capitalinvestment must also be included as must interest on the constructioncapital at 5 percent of the fixed capital investment.
The total of all these charges gives the total capital investment.A sumnary of the factors entering into the total capital investment is givenin Table 1.
2.2 OPERATING COST ESTIMATION
Annual operating costs are based, by and large, on the total capitalinvestment. First, the fixed costs (capital recovery, replacements, taxes,and insurance) as a fraction of the total capital investment are calculated.Assuming 8 percent for 15 years, the capital recovery factor is 0.117, or11.7 percent of the total capital investment must be set aside each year forcapital recovery. To this must be added insurance at 0.3 percent, stateand local taxes at 6 percent and a fund for replacements at 0.4 percent.Summing these items gives the total fixed cost at 0.184 times the totalcapital investment. To these fixed costs must be added direct operatingcosts consisting of operating labor plus maintenance labor and supplies.For pickle processing it is assumed that no supplementary charges must betaken for labor, in other words, that labor requirements can be met byexist ing staff . Maintenance labor and supplies are taken to be 4 percentof the total capital investment.
Adding plant overhead at 2 percent of the total capital investmentgives the total annual cost as 0.244 times the total capital investment.
To these costs must be added annual cost for energy, but credit canalso be taken for the value of salt recovered.
The total annual cost so estimated should include all cost centers andshould reasonably form the basis for initial estimates of process feasi-bility and of process economic attractiveness.
A sumnary of factors entering into annual operating costs is given inTable 2.
120

TABLE 1. CAPITAL COST ESTIMATION
Major Equipment Cost, E
Other Materials Cost, M
Construction Labor, L
Labor Indirect
0.4 E
0.6 E
0.43 L =
= BASC =
Engineering: 0.12 BASC = BARC =
Tax (2% BARC, OH 10% BARC) =
= FCI =
Working Capital and Startup: 11% FCI =
Interest on Construction Capital = 0.5 FCI =
TOTAL
TOTAL (FCI) =
0.258 E
2.258 E
0.2710 E
0.0325 E
2.562 E
0.282 E
0.141 E
2.985 E
3.0 E
3.0 COST ESTIMATES FOR BRINE CONCENTRATION
Costs have been estimated for the following processes for recoveringsalt from pickle brines: reverse osmosis, electrodialysis, two freezingprocesses - vapor compression and butane, solar humidification, solardistillation, the following methods of distillation; multi-stage flash,long-tube vertical, vapor reheat, and vapor compression; and submergedcombustion evaporation.
121

TABLE 2. ANNUAL OPERATING COSTS
Fixed Costs Fraction of TCI
Capital Recovery 0.117
Insurance 0.003
Taxes 0.060
Replacements 0.004
Labor - assume existing staff 0.04 TCI
Maintenance labor and supplies
Indirect Costs Fraction of TCI
Plant Overhead (Total Indirect) 0.02 TCI
TOTAL ANNUAL COST 0.244 TCI
Costs for major items of equipment for these processes have beenestimated in a previously published study2 for relatively large-scale plants.These major equipment costs were scaled to the problem in question, first,
by using the exponential rule C l/C2 = S1/S200.7 to correct for the smaller
scale associated with pickle manufacture, and second, by multiplication bythe Marshall Stevens Construction Cost Index Ratio, to convert 1965construction dollars into 1973 dollars.
2De La Rue, R. E., and Jones, J. M., "Comparative Engineering Analysisof Alternative Processes for Saline Conversion", Prepared for Office ofSaline Water, U. S. Dept. of the Interior, Washington, D. C., under ContractNo. 14-01-0001-412, May 1966.
122

These estimates have been validated by selected cross-checking.Selected types of equipment, especially evaporators, are the subject ofindependent cost correlations. These evaporators costs are calculated forprocessing and compared with evaporator contributions to the total cost ascalculated using the OSW method,ment.
These results were in substantial agree-
Cost estimates are summarized in Table 3. Reverse osmosis, butanefreezing, distillation, and submerged combustion evaporation seem to warrantfurther consideration.
4.0 COST ESTIMATES FOR ORGANIC REMOVAL
Estimates have been made of the cost of two processes for the removalof organic materials from pickle brine: submerged combustion evaporationfollowed by kiln drying, and biological oxidation.
For the submerged combustion process, it has been assumed that submergedcombustion would also be used for salt concentration, consequently theevaporator cost has been estimated as an increment to the evaporator costfor salt concentration.
Costs of biological oxidation have been estimated from published in-formation,3 assuming that BOD removal proceeds by first order kinetics andthat the costs would be identical to those for municipal waste treatmentproviding the residence time is increased to account for the higher BOD inpickle brines. Under these assumptions, the time required for oxidationof BOD at a concentration of 4000 mg/liter is 2.3 times the time requiredfor oxidation of 200 mg/liter, taken as representative of municipal sewage.Thus, the plant size should be 2.3 times 25,000 gal/day or about 63,000gal/day. Total capital investment estimates were based on this size plant.
Cost estimates for organic removal are summarized in Table 4.
3Smith, R., "A Compilation of Cost Information for Conventional and AdvancedWastewater Treatment Plants and Processes, Prepared for Federal WaterPollution Control Administration, Cincinnati, Ohio, 1967.
123