characterization and performance analysis of uhf rfid tag
TRANSCRIPT

Characterization and Performance Analysis of
UHF RFID Tag for Environmental Sensing
Applications
by
Zhen Zhong Li
A thesis
presented to the University of Waterloo
in fulfillment of the
thesis requirement for the degree of
Master of Applied Science
in
Electrical and Computer Engineering
Waterloo, Ontario, Canada, 2012
© Zhen Zhong Li 2012

ii
Author’s Declaration
I hereby declare that I am the sole author of this thesis. This is a true copy of the thesis, including any
required final revisions, as accepted by my examiners.
I understand that my thesis may be made electronically available to the public.

iii
Abstract
Passive radio frequency identification (RFID) tag has been shown efficient in item tracking and
management in the supply chain. Attracted to low weight and small size of wireless nodes, some
research work was conducted to extend the RFID advantage into environmental sensing applications.
The concept is to using tag frequencies as sensing parameters. When variation occurs in the
surrounding environment, such as temperature and humidity level, the operation frequencies of tags
would be shifted, and such shift can be used to identify the degree of variation in the environment.
One challenge of RFID tag is the distortion from other surrounding objects, the existence of obstacles
and metals can have greatly impact on the sensing performance in both accuracy and sensing range.
This thesis work conducts an investigation of the performance of a passive radio-frequency
identification (RFID) based system. The investigation systematically probed the effects of passive
RFID tag orientation and obstacles (blocking line-of-sight between a reader and a tag) as well as
reading period (the time required for successful detection) on the range of detection. In the absence of
obstacles, optimized tag orientation improved the system reliability and range of detection. At a
reading distance where tag readability became unstable, increasing the reading period led to a higher
reliability. A theoretical model was also established and was in good agreement with measurement
results, providing a simple guideline to the further experiments.
This work would also advance the knowledge understanding on wireless sensing on metal effect,
humidity and temperature.

iv
Acknowledgements
I would like to first express my sincere gratitude to my advisors, Professor Dayan Ban for all of the
supervision, patience and time dedicated throughout my research work and in writing of this thesis.
The encouragement and willing to share all of the ideas and experiences was crucial to my progress.
I would like to also express my great appreciation to Dr. Nezih Mrad and Dr. George Xiao for their
guidance and support at Nation Research Council of Canada and Defence Research and Development
of Canada. Their knowledge and skill in the research field are invaluable in accomplishing this thesis.
It was a great experience working under their supervision.
I would like to thank Professor Cui for reviewing this thesis and his valuable comments.
It was my pleasure to work with my friendly colleagues and friends, and thanks for their supports
and discussion on both academic and non-academic matters. Also, I like to give thanks to the Nation
Research Council of Canada, Defence Research and Development of Canada, University of Waterloo
and the ECE department for supporting my research.
Lastly, I am thanking my parents and family for their devotion on me through the years.

v
Dedication
To my parents for their great effort and unconditional support…
There is no doubt in my mind that without their continued support and counsel in my life I could
not have completed this process. All the care and advices are the lamp unto my feet and a light unto
my path and resided deeply in my heart and memory. It is my honor to have you as my parents and
my fortune to be your son.
Thank you!

vi
Contents
Author’s Declaration ............................................................................................................................ ii
Abstract ................................................................................................................................................. iii
Acknowledgements .............................................................................................................................. iv
Dedication .............................................................................................................................................. v
List of Figures ....................................................................................................................................... ix
List of Tables ......................................................................................................................................... x
List of Abbreviations and Acronyms ................................................................................................. xi
Chapter 1
Introduction ........................................................................................................................................... 1
1.1 RFID Technology .......................................................................................................................... 1
1.2 Problem Description and Motivation ............................................................................................ 3
1.3 Sensing Platform and Approach .................................................................................................... 4
1.4 Thesis Contribution ....................................................................................................................... 4
1.5 Thesis Organization ...................................................................................................................... 6
Chapter 2
Overview of RFID Technology ............................................................................................................ 7
2.1 Current Market of the RFID Technology ...................................................................................... 7
2.2 RFID vs. Barcode .......................................................................................................................... 8
2.3 Types of RFID............................................................................................................................. 10
2.4 Data Transmission Techniques ................................................................................................... 12

vii
2.4.1 Capacitive coupling ..................................................................................................................... 12
2.4.2 Inductive coupling ....................................................................................................................... 12
2.4.3 Backscattering Coupling ............................................................................................................. 13
2.4.4 Selection of the Sensing Technologies ........................................................................................ 14
2.5 Choices of Antennas ................................................................................................................... 15
2.6 Methods of Tag Inlay .................................................................................................................. 17
Chapter 3
Review of SAW, CNT and RFID Wireless Sensing Technology ..................................................... 18
3.1 SAW Sensing Technologies ........................................................................................................ 19
3.2 Carbon nanotube (CNT) .............................................................................................................. 21
3.3 Radio Frequency Identification (RFID) Technology .................................................................. 25
3.4 Summary ..................................................................................................................................... 26
Chapter 4
Theory and Modeling of Distance Effect of UHF RFID .................................................................. 28
4.1 Power and Distance ..................................................................................................................... 28
4.2 Reading period ............................................................................................................................ 30
4.3 Reader Modeling ......................................................................................................................... 32
4.4 Tag Modeling .............................................................................................................................. 33
Chapter 5
Distance Experiment Results of UHF RFID ..................................................................................... 35
5.1 Experiments Setup ...................................................................................................................... 35

viii
5.2 Range and sensitivity .................................................................................................................. 37
5.3 Time ............................................................................................................................................ 39
5.4 Obstacle ....................................................................................................................................... 41
Chapter 6
Humidity and Temperature Experiment Result of UHF RFID ...................................................... 43
6.1 Experiments Setup ...................................................................................................................... 43
6.2 Temperature Variation Effects .................................................................................................... 45
6.3 Humidity Variation Effects ......................................................................................................... 48
Chapter 7
Conclusion ........................................................................................................................................... 55
References ............................................................................................................................................ 57

ix
List of Figures
Figure 1: RFID Tracking System. ........................................................................................................... 2
Figure 2: Schematic diagram of RFID sensing platform ........................................................................ 5
Figure 3: modeling presentation of sensing process. .............................................................................. 5
Figure 4: Barcode and RFID Technology ............................................................................................... 9
Figure 5: RFID Tags ............................................................................................................................. 11
Figure 6: Capacitive coupling; tag is inside into the reader for communication. ................................. 12
Figure 7: Inductive coupling between the reader and the passive tag ................................................... 13
Figure 8: Signal Transmission between reader and transponder. ......................................................... 13
Figure 9: Operation principle of a backscatter transponder .................................................................. 14
Figure 10: Types of Propagation ........................................................................................................... 15
Figure 11: Helix and Crossed dipoles ................................................................................................... 16
Figure 12: Types of Inlays .................................................................................................................... 17
Figure 13: An example and schematic presentation of a SAW Sensor ................................................. 20
Figure 14: Structure of single walled carbon nanotubes (SWNTs) ...................................................... 21
Figure 15: Mapping between power and reliability of the system ........................................................ 29
Figure 16: Illustration of two reading periods, t1 and t2. ....................................................................... 31
Figure 17: Equivalent circuit model of a typical tag. ............................................................................ 33
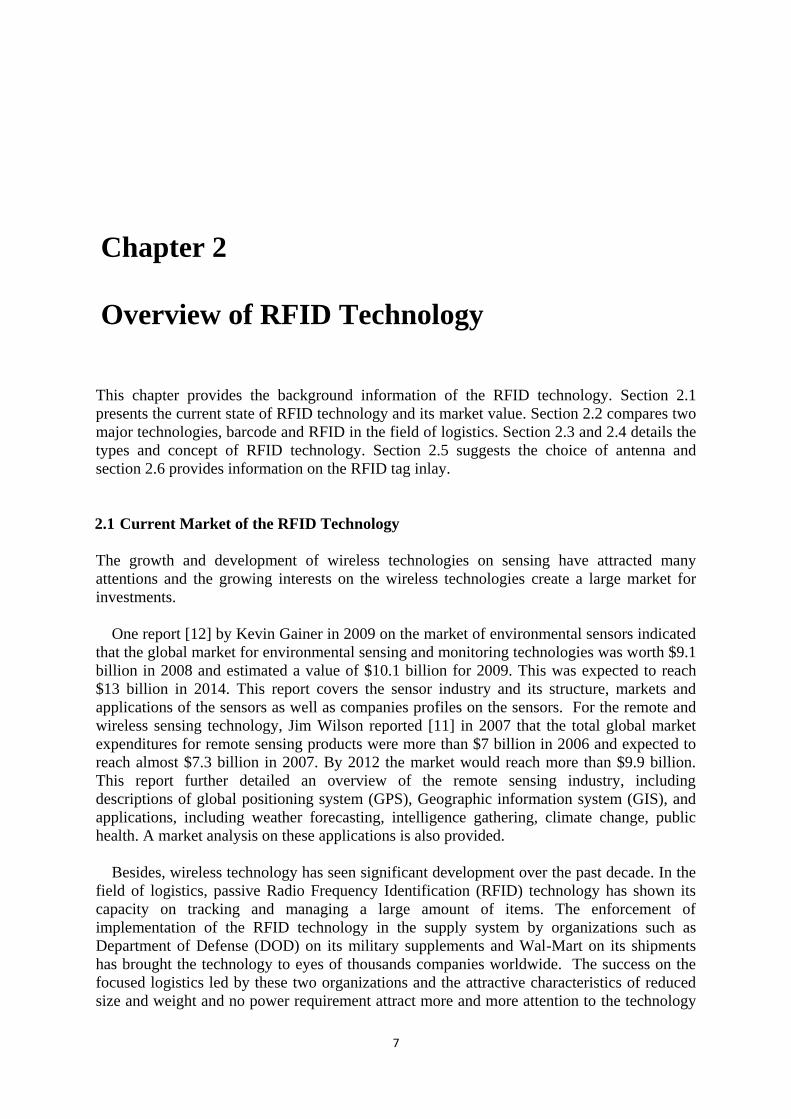
Figure 18:Schematic diagram of range, orientation and obstacle tests ................................................. 36
Figure 19: Reliability rate (%) drops as distance increases .................................................................. 38
Figure 20: Measurements and experiments result for different time period ......................................... 40
Figure 21: Obstacle thickness effect on reliability and range sensitivity. ............................................. 42
Figure 22: Illustration of experimental setup. ....................................................................................... 43
Figure 23: Frequency measurements .................................................................................................... 44
Figure 24: The resonant frequency shift as a result of temperature variation ....................................... 46
Figure 25: Resonant frequency shift due to humidity variation ............................................................ 49
Figure 26: The peak and valley frequency shift as a result of temperature variation ........................... 51
Figure 27: The impedance frequency shift as a result of humidity variation ........................................ 53

x
List of Tables
Table 1: Comparison of two logistic technologies, Barcode and RFID [15, 16] .................................... 9
Table 2: Summary of characteristics of different types of tags ............................................................ 11
Table 3: RFID frequency and characteristics [19] ................................................................................ 14
Table 4: Chemicals and monitored air particles [48] ............................................................................ 22
Table 5: Summary of research work on CNT-based chemical sensors [59]. ........................................ 24
Table 6: Potential sensing materials and candidates ............................................................................. 26
Table 7: Sensing Parameters ................................................................................................................. 26
Table 8: Effect of Distance and Orientation between Portable Reader and UHF Paper Tag. ............... 37
Table 9: Effect of Obstacles between Fixed Micro-UHF Reader and UHF Paper Tag. ....................... 41

xi
List of Abbreviations and Acronyms
CIM Chemically Interactive Material
CNT Carbon naotube
DOD Department of Defence
GIS Geographic Information System
GPS Global Positioning System
HF High Frequency
IDT Inter-digital Transducer
QMB Quartz Micro Balances
RF Radio Frequency
RFID Radio Frequency Identification
SAW Surface Acoustic Wave
TSM Thickness Shear Mode
UHF Ultra High Frequency
UPC Universal Product Code

1
Chapter 1
Introduction
Sensor technologies have long existed in the scientific field for the purpose of monitoring
subjects, and environmental sensors are the ones typically monitoring the state of their
surrounding environment, such as in-door air quality, temperature, humidity, carbon dioxide
level and many others. The environment sensor network extends mankind’s abilities on
environmental control to prevent undesired occurrence and tragedies. One typical example in
practical use of sensing technology is smoking detectors in residential houses. The
applications of environment sensors are widely spread out in many fields, including structure
monitoring for buildings and constructions, health monitoring for patients’ conditions, and
item tracking for inventory management.
The trend of sensor technologies is moving towards wireless, and wireless technology has
seen significant development over the past decade. Compared to a wired sensor network, a
wireless sensor network is more flexible in general. Adding a wireless sensor node to the
network is much more convenient without the concern on the path of wiring and the length of
wire. For example, in health monitoring for patients’ conditions, a wired device would
require patients to stay close to the monitoring device. Less weight and smaller size are the
other advantages of wireless sensors. In the applications where space is sensitive and crucial,
such as structural health monitoring on aircrafts in aerospace application, the space of an
aircraft is limited and weight is expected to be as low as possible.
1.1 RFID Technology
A basic passive RFID system, as shown in Figure 1(a), is consisted of three components: a
host (including a database) for information management and control, RFID tags which
contain the information of items that they attach to, readers to retrieve information from the
tags and transmit the information to the host where the data is stored and processed.

2
(a) (b)
Figure 1: RFID Tracking System; (a) a basic RFID system and its component [1]; (b)
warehouse implement demonstration [2].
RFID tags serve the same purpose as a bar code or a magnetic strip on the back of a credit
card or ATM card, to track, store and provide unique identification of the objects [3].
However, RFID technology can address problems that other technology cannot. People have
to scan the bar code manually each time to track the item when it moves; Ultrasound and
infrared technologies cannot penetrate materials, so it would require an open box examination
to trace what is inside; GPS, on the other hand, does not work well in an indoor environment
[4].
Beside passive tags, there are also other types of RFID tags. Generally speaking, the RFID
tags are usually categorized as passive tags, active tags and semi-passive (or semi-active) tags
based on whether the tags have their own power source, such as batteries. The general pros
and cons of the RFID technology are discussed as following.
Some of the typical advantages of RFID technology are [5]:
Robust tags that can stand extreme conditions and temperatures;
Tags are available in a great range of types, sizes and materials;
No need for physical contact between the data carrier and the communication device.
The Tags can be used repeatedly;
Relatively low manufacture and maintenance cost;
An RFID tag could identify the item and store detailed information about the item;
Benefits of RFID applications are [6]:
Total asset visibility;
Tracking for incoming and outgoing deliveries;
Full inventory history and records;
Localization of items;
Real-time security;
Common Problems with RFID:
Reader Collision – occurs in RFID systems when the coverage area of one RFID
reader overlaps with that of another reader, due to signal interference or multiple
readers of the same tag [7].
Tag collision – occurs when multiple tags are energized by the RFID tag reader
simultaneously, and reflect their respective signals back to the reader at the same time
[8].

3
Other potential issues and concerns about RFID:
Security and privacy issue – due to limited resources that can be dedicated to security
functions [9];
Health concern – due to long period exposure to the RF electromagnetic fields.
However, there are no evidences showing that there is a health risk [10].
1.2 Problem Description and Motivation
RFID technology has been proven to be successful in item tracking. Tags contain unique
identifications enable asset tracking ability. To extend the ability of RFID, it is always the
interest to provide more information on the tracked asset, not only tracking the location but
also monitoring the state.
In the field of aerospace, temperature and humidity are the initiators and promoters for
corrosion and crack on air-vehicles. They are looking for wireless solutions of detecting and
monitoring cracks and their development. Although wired solutions are available, they no
longer meet the needs of nowadays aircraft. Space and weight become critical to most air
vehicles. When aircraft is getting more and more sophisticated, wired sensors gradually
become an issue, since such aircraft may employ hundreds of wired sensors for state
monitoring which results tons of wire in weight. To more effectively and efficiently operate
aircraft, wireless solution becomes curial to reduce the weight and to improve space
efficiency.
Passive ultra high frequency (UHF) RFID tag which is designed with the feature of small
size and no power consumption satisfies the demand on wireless solution for air vehicles. An
UHF RFID based sensor would be suitable for essential requirements. The concept is to use
the UHF RFID tag as a sensing platform. On this platform, a sensitive layer is deposited. By
monitoring the frequency displacement of the tag caused by the sensitive material reacted to
humidity and temperature, the degree of the change can be determined.
Significant efforts have been devoted to develop sensors using RFID tag as the wireless node
for communication, such as RFID based surface acoustic wave (SAW) sensors and carbon
nano-tube (CNT) sensors, which is described in more detail in chapter 3. More recently, some
scientists start to implement RFID tags for sensing applications. It has been reported to use
high frequency (HF) RFID tags for chemical sensor applications. Nevertheless, UHF tags
which are commonly used for logistic and item tracking, have not seen much progress in
chemical sensing application. The main obstacles are noted following:
RF signal absorption – It is a known issue that when a UHF tag is directly attached to metal
surface, it would lose its function (both forwards and backward communication). The current
solution, or so call “metal” tag, contains a cover on the original tag to create a displacement
between the tag and the metal surface.
Path loss formulation – Path loss is always a challenge in the signal transmission. The present
of objectives in the surrounding environment would simply increase the difficulty of the
formulation. Although there are many research works on path loss formulation, there is not a
universal solution or method for it.
Signal interference – As a result of multipath generated from reflection and deflection, signal
overlapping and collision results noise in measurement accuracy.

4
1.3 Sensing Platform and Approach
The concept of this approach is using RFID tag as a sensing platform. Shown in Figure 2, a
sensing film is layered at the top of the tag. The sensing film is directly deposited on the tag
antenna. Such deposition would modify the characteristic of the original tag by changing its
impedance, which, in turn, modifies the operation frequency of the tag. The new operation
frequency and corresponding characteristics are used as the sensing baseline to sense targeted
analytes as shown in Figure 3. The added layer can be treated as a simplified R-C circuit
with a resistant value of R and a capacitor value of C, in addition to the circuit of the tag itself.
When an analyte presents, the reaction between the analyte and the sensing film would
again modify the impedance of the tag. Now the sensing circuit is presented by the circuit
with a resistor Rf and a capacitor of Cf. By comparing the status of the tag after reaction to the
baseline and measuring the changes in the sensing parameter, in other words, by comparing
the differences between R and Rf and the differences between C and Cf it is possible to
determine the type of the analyte.
This approach was first described by Radislav Potyrailo on a high frequency tag that
operates at 13.56MHz and operating frequency is the measuring parameter. His experiment
demonstrated a possibility of detecting different types of chemicals, which is detailed in
Chapter 3. We would like to apply the similar principle on the ultra high frequency tags for
chemical and corrosion detections. Our first step is to evaluate the impact of the deposition
on the tag itself before any reaction is taken in place as shown in Figure 3(a), and it is one
major objective of this thesis. To select suitable sensing films and corresponding analytes, a
literature review is also conducted and presented in the next chapter.
1.4 Thesis Contribution
The major contribution of this thesis is to propose a model to evaluate the performance of a
RFID system and validate the feasibility of the model based on the system performance
toward wireless sensor. To this end, the research objectives are defined as:
To evaluate the effect of sensing distance and path loss in the present of obstacle on
the performance of the RFID system.
To formulate a model to simulate and simplify the evaluation procedure of the
environmental effect. The model would take into account of the effects of distance
and both ideal (free space) and non-ideal conditions and predict the performance in
specific conditions when tag is attached to wood, metal and other materials.
To explore the effects of humidity and temperature on the characteristics of the RFID
system. The impact of surrounding environment condition on the RFID system must
demonstrate the sensitivity and possibility towards a temperature or humidity sensor
and to a long term goal as a corrosion sensor.
The empirical experiment results are reported and discussed to demonstrate the evaluation
process in practical use.

5
(a) (b)
Figure 2: Schematic diagram of RFID sensing platform; (a) sensing layers;
(b) sensing film deposition.
(a)
(b)
Figure 3: modeling presentation of sensing process; (a) tag exposed to air; (b) tag coated with
sensing film and then exposed to analyte.
Tag
Sensing film
Tag Antenna
Tag Substrate
Sensing film
Tag
R
C
Tag
Air
Tag
Tag
Sensing film
Analyte
Rf
Cf

6
1.5 Thesis Organization
The reminder of this thesis is organized as follows:
Chapter 2 describes the overview of RFID system and background of relevant materials. It
first introduces the current state of RFID system and its marketing potential, followed types
of RFID system as well as detail concept on our approach.
Chapter 3 presents the literature work of related to wireless sensor development and work
towards RFID sensors. The literature work mainly focus on surface acoustic wave (SAW)
and carbon nano-tube (CNT) sensors and their work towards RFID technology.
Chapter 4 provides the theoretical development and simulation proposed for the evaluation
of a RFID system. It highlights the model prediction on the behavior of radio frequency
signal in an open environment. This includes near field effect and far field effect and
classifies the region of the behavior changes.
Chapter 5 and 6 reports our experimental results from our evaluation process. Chapter 5
reports on sensing distance, obstacle and orientation effect on the performance of RFID
system, while chapter 6 reports on humidity and temperature effect. The set of experiments is
targeted to evaluate the feasibility and reliability of the system as well as to validate the
theoretical modeling.
Chapter 7 concludes the research work. It highlights research contribution and provides
recommendation on future work related research work.
7
Chapter 2
Overview of RFID Technology
This chapter provides the background information of the RFID technology. Section 2.1
presents the current state of RFID technology and its market value. Section 2.2 compares two
major technologies, barcode and RFID in the field of logistics. Section 2.3 and 2.4 details the
types and concept of RFID technology. Section 2.5 suggests the choice of antenna and
section 2.6 provides information on the RFID tag inlay.
2.1 Current Market of the RFID Technology
The growth and development of wireless technologies on sensing have attracted many
attentions and the growing interests on the wireless technologies create a large market for
investments.
One report [12] by Kevin Gainer in 2009 on the market of environmental sensors indicated
that the global market for environmental sensing and monitoring technologies was worth $9.1
billion in 2008 and estimated a value of $10.1 billion for 2009. This was expected to reach
$13 billion in 2014. This report covers the sensor industry and its structure, markets and
applications of the sensors as well as companies profiles on the sensors. For the remote and
wireless sensing technology, Jim Wilson reported [11] in 2007 that the total global market
expenditures for remote sensing products were more than $7 billion in 2006 and expected to
reach almost $7.3 billion in 2007. By 2012 the market would reach more than $9.9 billion.
This report further detailed an overview of the remote sensing industry, including
descriptions of global positioning system (GPS), Geographic information system (GIS), and
applications, including weather forecasting, intelligence gathering, climate change, public
health. A market analysis on these applications is also provided.
Besides, wireless technology has seen significant development over the past decade. In the
field of logistics, passive Radio Frequency Identification (RFID) technology has shown its
capacity on tracking and managing a large amount of items. The enforcement of
implementation of the RFID technology in the supply system by organizations such as
Department of Defense (DOD) on its military supplements and Wal-Mart on its shipments
has brought the technology to eyes of thousands companies worldwide. The success on the
focused logistics led by these two organizations and the attractive characteristics of reduced
size and weight and no power requirement attract more and more attention to the technology

8
and result an increase on the adoption of the technology. The global market value for radio
frequency identification (RFID) technologies was $6.4 billion in 2010. That value is
projected to reach $11.3 billion in 2015 in by the electronics industry market research and
knowledge network in its report “RFID: Technology, Applications, and Global Markets” [13].
Ultra high frequency passive tags are most frequently used in the warehouse. These tags
are placed on the containers of the items, such as inside the cardboard box as in Figure 1 (b).
When the box is passing through a gateway or a check point, the reader at that gateway
detects the tag embedded inside container and records the identifications of the sealed objects
and then transmits the corresponding information to the remote host for tracking and
management. Before RFID is first introduced in warehouses, the most common one is
barcode.
2.2 RFID vs. Barcode
In the field of logistic, traditional method of tracking and management of goods is done
through barcode, which requires line of sight while scanned. The RFID tag, on the other hand,
is more flexible on its position while read and can be even embedded inside the cardboard of
the box with insignificant impact on its readability, which increases the security of the tag
itself. The automatic reading system can reduce the work and time of scanning process
required by the barcode.
(a)

9
(b)
Figure 4: Barcode and RFID Technology; (a) barcode standard; (b) RFID standard [14].
In addition, the RFID tag is using digital memory for information storage rather than graphic
presentation as it is for the barcode. Figure 2 compares the typical standards of the two
technologies. For the 12 digit barcode using Universal Product Code (UPC), it has a header
digit, 6 digits to indicate manufacturer and 4 digits to identify the type of the item, with one
checking digit. It should be noted that barcode only identify the type of the item but does not
distinguish the products of the same type. For example, two bottles of milk from the same
manufacturer have the identical barcode number. On the other hand, RFID has a 2-digit
version number and 28 digits for manufacturers which are 23 digits more than the barcode. It
also has a 24 digits of product number which are 20 digits more than the barcode. In addition,
it includes a serial number to identify each individual items of same type, which means it is
able to identify each bottle of milk even though they are from the manufacturers.
With digital memory, RFID is able to carry massive data and offers more and detailed
information of the object. Thus, tracking can be more accurate and precise with RFID system.
Besides, digital memory can be rewritable, enabling reuse of the tag and modification of the
information, while for barcode, any modification requires a replacement and barcode reaches
end of its life cycle when the item is delivered to its destination. The major differences
between two logistic technologies are summarized hereby:
Table 1: Comparison of two logistic technologies, Barcode and RFID [15, 16]
Attribute Barcodes RFID Tags
Technology Optical, image technology Radio frequency, wireless
Standard ISO/IEC 15426-1 (linear)
ISO/IEC 15426-2 (2D)
ISO/IEC 18000(Item
Management) ISO/IEC 14443
(Proximity cards)
ISO/IEC 15693 (Vicinity cards )
Data capacity Up to 24 characters for linear
presentation and up to 2000
characters for two
dimensional barcode
Several thousand characters
Reading
requirements
Line of sight required Within the detection range
Durability Subject to wear/damage or
removed; cannot be read if
Can be hidden but subject to
certain environmental impact (by

10
dirty or greasy metal, liquids, etc.)
Security Data can be easily reproduced Data can be encrypted and a “kill”
feature to remove data
permanently
Read Rate One at a time, slow and
slower for two dimensional
barcode;
Multiple tags can be read
simultaneously
Read and write Read only Tags can be both read only and
rewritable
Human Capital Scanned by human in general Scan process can be automated
Convenience Barcode can be electronic
generated so it can be printed
or reproduced at any printer
via internet
Tag has to be made at manufacture
or requires a sophiscated RFID
printer.
Event Triggering Not possible with barcode Yes (door opening, alarm, etc.)
Due to the nature optical image technology, barcode is visible, with no protection against
information access and reproduction. That exposure reduces its duration and security
compared to RFID technology based tag, which can be hidden or sandwiched between layers.
Although exposure and easy reproduction scarifies the security level, it increases its
convenience. Can be printed on most printers of the world via internet access makes the
information easy to transfer. As a result, although passive RFID tags exceed barcode in
several categories, RFID is still seen as a complementary to barcode by some viewers
because of the convenience. Barcode is much easier to reproduce and can be electronic
generated. Thus, the intention now is to store basic identification on barcode and more
sensitive information on RFID tag.
2.3 Types of RFID
Readers and tags are two major components of the RFID system. Tags store identification of
the object, while readers transmit signals and retrieve it. For different types of tags, readers
are designed differently and implemented with different standards. A typical RFID reader
contains Transmitter (signal modulation), baseband processor, circulator and receiver (signal
demodulation) as well as the reader antenna. Different RFID technologies require different
modulation modules. This section will focus on the types of technologies used in RFID
system from tag aspects.
There are several ways that RFID tags can be classified depending on the criteria, such as
frequencies and protocols. Generally speaking, the RFID tags are usually categorized as
passive tags, active tags and semi-passive (or semi-active) tags based on whether the tags
have their own power source, such as batteries.

11
(a) (b) (c)
Figure 5: RFID Tags; (a) passive; (b) semi-passive/active with battery source; (c) active [17,
18].
Passive tag – has no internal power supply. When a RFID reader is approaching, the tag
retrieves power from signals emitted by the reader to operate, and then it transmits data to the
reader by inductive coupling or backscattering techniques, which are revealed in next Section
2.4. It can be flat and thin as shown in Figure 3(a).
Semi-passive/active tags – have their own power sources but just for powering the chips
but not for data transmission. Since no demand on power from the reader, all signal power
from the reader is used for data transmission, with a better response and detection range to
reader signal compared to passive tag. Both inductive coupling and backscatter coupling
technologies are seen in the data transmission for this type of tags. As illustrated in Figure
3(b), the tag contains a button cell type battery for the processor so that all received power
can be used for transmitting back the signal which is stronger than passive transducer. This
allows increasing communication distance with quit cheap solution [17].
Active tags – requires their own power sources to generate outgoing data signal. Differed
from previous two types of tags, active tags can be treated as standard-alone wireless nodes.
By having own power supply, active tags usually have better performance than passive tag,
having more memory, more power to send outgoing signal far away. Besides, most of active
tags can be programmed.
Table 2: Summary of characteristics of different types of tags
Attribute Passive Tag Active Tag Semi-passive/active Tag
Internal Power Source No Yes Yes
Response Distance Short Very long Long
Weight Light Less light Less light
Cost Cheap Expensive Less expensive
Life Cycle Long Short Long
Table 2 summarizes the major differences among the types of the tags. Because of
existence of the power source and life cycle of passive tag is generally longer. In addition,
with a much complex design, active and semi-passive/active is much expensive compared to
passive tag, and that complexity also increase on the weight of the tags. The passive nature
with less weight and longer life time proves the passive tag is a better candidate than other
two as the platform for chemical sensing.

12
2.4 Data Transmission Techniques
There three major techniques that are used in data transmission in radio frequency and its
applications: capacitive coupling, inductive coupling and backscattering. Each technique has
its advantages and disadvantages, which is presented in detail.
2.4.1 Capacitive coupling
Capacitive coupling transfer electromagnetic energy via mutual capacitance rather than
mutual inductance. When two circuits are placed close enough the circuits create a mutual
capacitance between them, acted as dielectric materials. Smart card is a typical example and
where the majority of the application involve. The reading range is generally less than 2
centimeter as defined by ISO standard 10536. A typical frequency is 125kHz.
Figure 6: Capacitive coupling; tag is inside into the reader for communication.
As shown in Figure 8 for a smart card reader and a tag from a smart card that is inserted
into the reader, capacitance is created at both above and below the tag. The capacitance is
measured by the electrical storage capacity and voltage cross them. When a signal is
generated in the reader, the signal is transferred through the changes in the across voltage and
then used to power up the tag in the same as inductive coupling. The signal is also returned
by load changing in the same way as inductive coupling. However, for mutual capacitance to
exist, the distance between two circuits are limited, within a few millimeters and less than a
few centimeters. Different from inductive coupling, which is based on magnetic field, and
whose reading range can be extended by a larger antenna area, the antenna for capacitive
coupling is not as they are replaced by electrodes. As the result, the reading range based on
capacitive coupling is usually less than other techniques.
2.4.2 Inductive coupling
There are two major types of techniques are used in RFID wireless transmission for
contactless communication, inductive coupling and backscattering coupling. Figure 5
describes the inductive coupling principles.

13
Figure 7: Inductive coupling between the reader and the passive tag [20].
On the reader side, receiver is designed with coupling effect as presented in Figure 5. A
part of the emitted field penetrates the antenna coil of the transponder by induction, which
generates a voltage in the transponder's antenna coil serving as the power supply for the
microchip. To provide such electromagnetic field, a capacitor is carefully selected in parallel
with the reader’s antenna coil to form a parallel resonant circuit, which introduces a very high
current in the antenna coil of the reader by the resonance. As energy is drawn from the reader
to the transponder, the additional power consumption can be measured as the voltage drop at
the internal resistance in the reader antenna. Here is how data is transferred from transponder.
Figure 8: Signal Transmission between reader and transponder.
There is load modulation that changes the load between two stages in the transponder.
While switching between two stages affects the voltage change at the reader's antenna as in
Figure 6, and as the switch is alternated based on the data, the reader can retrieve the data by
monitoring the voltage changes on the reader side. Due to the limitation of this technology,
the reader has to be close enough to the tag to introduce inductive coupling. As the result, the
typical reading distance ranges from a few millimeters up to one meter.
2.4.3 Backscattering Coupling
Reader
Tag
Load Modulator
Power Supply
data
S1
R1R2
AC
demodulation

14
The efficiency with which an object reflects electromagnetic waves is described by its
reflection cross-section. Thus, most antennas for active tags have a particularly large
reflection cross-section for high transmission efficiency [20].
Figure 9: Operation principle of a backscatter transponder [20]
Figure 7 illustrates the data transmission process between the reader and the transponder
using this technology. On the reader side, a directional coupler is attached in the front of
transceiver-receiver function. Power P1 is emitted from the reader's antenna to the
transponder's antenna. The power P1' is supplied to the antenna connections can be used
power for the chip, while the power P2 is the reflection power of P1’ by the antenna. The
reflection characteristics (= reflection cross-section) of the antenna can be influenced by
altering the load connected to the antenna. To transmit data, a load resistor RL connected in
parallel with the antenna is switched on and off in time with the data stream to be transmitted.
The amplitude of the power P2 reflected from the transponder can thus be modulated. A
small proportion of P2 is picked up by the reader's antenna as P2’. This "backwards" power
can be decoupled using a directional coupler and transferred to the receiver input of the
reader [20].
2.4.4 Selection of the Sensing Technologies
In previous section, types of tags and different operation principles are presented. Capacitor
coupling has a very limited range which is not suitable for wireless sensing requirement.
Inductive coupling is generally adopted by high frequency tags and backscattering is adopted
by ultra high frequency tags. Both of them have potential for wireless sensing and related
literature work is presented in Chapter 3.
Based on the frequency ban, tags can be also categorized into low frequency, high
frequency and ultra high frequency. Commonly, capacitor coupling is used in low frequency;
high frequency tags adopt inductive coupling technique; while backscattering is employed in
ultra high frequency tags. In terms of detection range, capacitor coupling is shortest while
backscattering is longest. Inductive coupling is based magnetic field induce surrounded
antenna which is applicable in the near field, while backscattering is based radar theory in the
far field. Since the energy in the signal increases as frequency increases, the approximate
reading range and data transfer rate increases when operation frequency become higher.
Some characteristics of RFID are summarized in the Table 3 based on frequency range.
Table 3: RFID frequency and characteristics [19]
Ban Low Frequency High Frequency Ultra High Frequency

15
(LF) (HF) (UHF)
Frequency 30-300kHz 3-30MHz 300 MHz-3GHz
Typical RFID
Frequencies
125-134kHz 13.56 MHz 433 MHz,
865 – 956 MHz,
2.45 GHz
Approximate
read range
Less than 0.5 meter Up to 1.5 meters 433 MHz = up to 100
metes
865-956 MHz = 0.5 to 5
meters
Typical data
transfer rate
Less than 1 kbit/s Approximately 25
kbit/s
433-956 MHz = 30 kbit/s
2.45 GHz = 100 kbit/s
Characteristic
s
Short-range, low
data transfer rate,
penetrates water but
not metal
Higher ranges,
reasonable data rate,
penetrates water but
not metal
Long ranges, high data
transfer rate, cannot
penetrate water or metals
Typical use Animal ID
Car immobilizer
Smart Labels
Contract-less cards
Access and security
Specialist animal tracking,
logistics
Based on requirement of designing wireless sensing, a longer range of detection is
preferred, and as stated in Table 3, ultra high frequency tags that adopt backscattering
technique has the longest range compared to other techniques.
2.5 Choices of Antennas
A RFID system is based on the signal transmission which has both electrical and magnetic
properties known as the electromagnetic wave [21]. Antenna is an important aspect of data
transmission which affects range of detection and direction of electromagnetic wave
propagation. There are three different types of RFID antenna structures based on the
polarization directions.
(a) (b)
Figure 10: Types of Propagation; (a) schematic of linear polarization and its direction; (b)
Dual Dipole antenna[21, 22].
Single Dipole (Linear Polarization) – As stated in the words, the electromagnetic wave
only propagates one direction in one plane as shown in Figure 8(a). As the propagation
direction is fixed, the transmission path is fixed, so it is best for the tag orientation is known
and fixed [22]. Many tags are mainly designed in this mainly due to its simple structure.
Dual Dipole – Dual dipole is an antenna with two dipoles, an implementation from single
dipole. One way to create a dual dipole is connecting the end of one single dipole antenna

16
with the end of another one to form a “V” shape antenna with an angle between two tails as
shown in Figure 8(b). This way provides the flexibility on antenna orientation as the angle
between two antennas is adjustable. The dual dipole design can greatly reduce the orientation
effect caused by single dipole antenna by providing two transmission paths [23]. In the RFID
design, the dual dipoles usually placed orthogonally to each other achieve circular
polarization.
(a) (b)
Figure 11: Helix and Crossed dipoles; (a) propagation direction; (b) types of presentation:
helix, patch and crossed dipole [21, 22]
Helix or Crossed dipoles (Circular Polarization) – The electromagnetic wave is capable of
propagating in two planes and creating a circular effect as shown in Figure 10(a). In Figure
10(b) are some typical antenna forms which could be the structure of RFID reader antenna.
Due to its continuously rotational electromagnetic field, it is able to cover any tag that is in its
path, which makes it excellent detector for tags with unknown or unfixed orientations.
However, comparing to the single dipole antenna, the circular polarization technique will
result the loss of power at least 3dB [21]. These three types of antenna structures are
commonly used in read antenna based on the application requirements.
The circular antenna can be further categorized into two families, Monostatic and Bistatic
circular polarized antenna. The monostatic antenna is the common used antenna type that
both the transmitter and receiver are collocated [24], meaning using the same antenna for
both data transmitting and data receiving, while the transmitter and receiver are separated in
bistatic antenna structure [25], meaning using separated and dedicated antennas for the
transmit and receive operations. For example, a four-port monostatic reader requires four
antennas; a four-port bistatic reader requires eight antennas [26]. Since both transmitting and
receiving signals share the same antenna in a monostatic system, this arrangement is subject
to signal reflections back into the receiver path, raising the noise floor, lowering dynamic
range, and lowering reader sensitivity. However, a monostatic system is inexpensive, simple
to deploy, and exhibits better data collection and processing efficiency over bistatic solutions
[26].
To select the best antenna is essential in the RFID design process, and it is based on the
application of the RFID. For doorway or portal tracking, a high gain antenna with circular
polarization would be a good candidate, because of limited or no control at all on the items’
orientations, while the RFID readers are generally fixed. The purpose of circular polarization
is to provide full range detecting zone of pass by RFID tags. In order to avoid or passing
through blocking substance, several circular polarized readers may be required to be installed
on the two sides and top of the doorway. On the other hand, for access cards and check out
station system, a low gain antenna with near filed design is enough, since the tag orientation
is known and direction signal transmission can be easily established.

17
In terms of antenna selection, circular polarization has a better detection range but requires
more energy, which can be used as the reader antenna. For the tag antenna, single dipole is
most common for backscattering tags to increase the reflect directivity while circular is often
applied on inductive coupling to maximize the magnetic field.
2.6 Methods of Tag Inlay
The material of the antenna is also impact and affecting the performance of data transmission
as well. A lower resistively material is usually better than a high resistively. For high
frequency tags, which oscillated within 13.56 MHz, any reasonably conductive metal would
work, such as aluminum, copper, silver [27]. However, different materials results different
specific read and write characteristics due to differences in chemical properties. A copper
antenna is slightly more expensive than aluminum or silver but is more conductive and
usually provides a longer distance read capability [28], such as for ultra high frequency. To
compose of a chip with an antenna, technologies of inlays are involved, which should be
considered in selecting tags. There are two types of RFID inlays, referred as either “dry” or
“wet”.
(a) (b)
Figure 12: Types of Inlays; (a)wet Inlay;(b)dry inlay[29,30].
Dry inlay – when chip is comprised with antenna, antenna is directly attached to the
substrate backing material [28] as in Figure 10(a), such as paper, PVC and PET. Usually,
PVC and PET are commonly in use.
Wet inlay – it is similar as a dry inlay, but adhesive is added at the back [31], shown in
Figure 10(b).
In both cases the inlay is supplied to a converter where it is inserted into a label or tag for
requirement of the application [31].

18
Chapter 3
Review of SAW, CNT and RFID Wireless
Sensing Technology
In the human history, many catastrophes have occurred, which cost tremendous loss in
people’s live, property and even result finance crisis, such as the earthquake, tsunami and
nuclear meltdown in Japan in 2011. The tsunami alone caused more than $309 billion loss in
the damage, forcing half million people away from home [32]. To reduce the impact of
disasters, people started to develop monitoring and reporting systems to have better control
over environment and preparation against disasters. For this purpose, many sensor
technologies have been deployed to alarm the sign of changes in the environment so that an
unexpected situation can be notified and possibly handled at an early stage. For example, an
in-house smoke alarm is able to indicate the sign of a fire and allows people to take proper
actions before the fire is out of control. When such change in the air quality is at molecular
level, chemical reaction based sensing technologies, or chemical sensing technologies is used.
There are different kinds of chemical sensors, capable of measuring variety of parameters
of air quality including temperature, humidity and concentration and component of the vapors.
For example, D. Hauden et al [33] in early 1980s designed a SAW temperature sensor, and
Jing Li et al [34] in 2003 designed a carbon nanotube sensor for gas and organic vapor
detection. The initial designs of many those chemical sensors are generally wire based.
However as wireless technologies grow and become mature, sensor technologies adopt the
advantage of being wireless. Reindl, L.M. [35] in 2004 developed a wireless SAW
temperature sensor, and in 2006 Calusdian, J. and Jing Li et al [36] implement their carbon
nanotube gas sensor in [34] wirelessly. Employing wireless technologies, sensors are no
longer limited by the length of the wire and gain better mobility. In addition the weight and
size of the sensors are also reduced.
One major issue of being wireless is to power the sensors. An easy and common solution is
to employ built-in power sources, such as batteries, as a part of sensor designs. However, as
batteries have limited life cycles, periodically replacement is necessitated, while that may be
neither suitable when the replacement is quite frequently and expansive nor applicable where
the replacement is not acceptable, for instance, in a sealed container. Other designs generally
adopt energy harvesting module to absorb certain type energy, such as piezoelectric based
module for vibration and thermoelectric based module for temperature differences, and these
modules generally either require directly connections to the sensors or integrated with the

19
sensors to power them. However, due to the limitation on the type of energy to harvest, these
designs are generally energy type dependent. Researches start to look at another technology,
the radio frequency (RF) after the realization of attracting energy from RF signals. The RF
technology, beside of being wireless, can also be passive, meaning no built-in power sources
or modules for the sensors. The entire energy that sensors consume would directly come from
the RF signals received by the sensors. Thus, part of the signal energy is used to power
sensors. The revolution of this technology is eliminate the concept that the power source has
to be physically connected to sensors and bring the wireless technology to next level from
wireless data transmission to wireless power transmission.
The work in both [35] and [36] employed the RF technologies to make the sensors
“powerless”. They adopted so-called radio frequency identification (RFID) tags. The RFID
tag is not only wireless and passive but also is almost costless. The cost per single tag can go
as low as between ¢10 and ¢20 in the large scale of production, reported by ODIN inc. in its
RFID report [37]. The report also indicated the growth of demand for the RFID tag in the
supply chain and other applications. One of the most notable events in driving tag demand is
the adoption of the RFID technology by Walmart. Reik Read of Robert W. Baird & Company
raised its 2010 estimate growth from 40% to over 125% just based on the announcement of
this program [37]. Besides, it also reports Alien receives $10.9 million in new funding and
announces 50% quarter over quarter growth rate over previous two quarters.
There are varies of chemical sensing technologies introduced in the past decades, widely
used in gas and liquid sensing and monitoring as well as others. One major concept of gas
sensing is to monitor the change of chemical properties through chemical reaction. By
retrieving the change in the properties, it is able to detect the existence of certain molecular in
the air or the change of the surrounding air quality. Two major technologies that adopt this
technique are Surface Acoustic Wave (SAW) and carbon nanotube technologies which are
reviewed hereby.
3.1 SAW Sensing Technologies
A typical SAW is composed of a piezoelectric crystal substrate with an inter-digital
transducer (IDT) introduced by White RM, Voltmer FW in 1965, shown in Figure 12. Such
mechanic wave only propagates at the surface of the substrate. Surface acoustic wave has
existed for quite a long time after SAW is first explained in 1885. Acoustic wave is able to
perform real-time measurement, with competitive pricing, high sensitivity and accuracy and
intrinsic reliability [38-40].
As the energy of the SAW is confined at the surface level regardless of the thickness of the
substrate, it has the potential sensitive towards any changes on the surface, such as mass
loading, viscosity and conductivity. For chemical sensing, a sensitive film that responds to a
specific gas is laid down on the propagation path [38-40].

20
Figure 13: An example and schematic presentation of a SAW Sensor [41].
When an electronic signal is applied at the input of the IDT from one side, the
measurement of the SAW is obtained at the output of the IDT on the other side. As the
sensitive film reacts to the desire chemical molecular, the characteristic of the surface
acoustic wave is modified due to the changes of the charges on the surface of the substrate,
and such change can be measured by monitoring the target chemical molecular in the
surrounding environment.
The first SAW-based sensor on solid substrate was created by Wohltjen and Dessy in 1979.
The IDT was coated with a sensitive polymer layer for gas detection [42]. Since then, varies
of SAW sensors were introduced to detect many physical and chemical parameters, including
temperature, pressure, stress, gas flow, vapor concentration, vapor desorption and diffusivity.
In Dickert’s work[43], he compared the properties of SAW resonators with QMB(quartz
micro balances) for chemical sensing, which showed SAW was forty-fold higher sensitivity
than QMB in detecting solvent vapors after both SAW and QMB were coated with a cross-
linked β-Cyclodextrin to detect m-xylene. The author also tried molecular imprinting with
both SAW and QMB. It showed that the sensor response to the vapor depended on the
percentage of cross-linkers used. SAW also provides an excellent reversibility in this case. In
the comparison with Thickness Shear Mode (TSM), according to Bodenhofer [44], the SAW
devices is able to operate with a large amount of response signals with enhanced surface
sensitivity, making it suitable for very thin layers. The SAW devices also showed advantages
on the ability of multiple transduction mechanisms as a more versatile sensor platform than
the TSM.
Other types of SAW sensors are also developed. In Susan’s work [45], she showed the dual
sensor technique with two different sensor materials was able to separate convoluted
contributions between mass and modulus to the frequency response. In the experiments with
A2 silica-coated quartz and Gas sensors exposed to methanol, when the methanol
concentration increased, the quartz exhibited a negative frequency shifted, while Gas sensor
exhibited a positive frequency shift. Shen [39] proposed a SAW sensor with coating L-
glutamic acid hydrochloride which could be a good candidate for detecting ammonia gas.
From his experiments, the sensitivity of the sensor was 0.10 ppm/ppm when ammonia
concentration was less than 2.27 ppm. The frequency shift of the SAW sensor was 0.91 ppm,
the noise level was 0.03 ppm, and the signal-to-noise ratio was 30.33. The increase of
temperature would not affect the performance of the SAW gas sensors and the L-glutamic
acid hydrochloride showed itself as reversible gas sensing material at room temperature. In
addition, Fechete [46] presented another kind of sensor, which was consisted of layered
Input
Transducer
Output
Transducer
LoadGenerator
Absorber Piezoelectric Substrate

21
SAW-based gas sensors with an InOx/SiNx/36° YX LiTaO3 structure. An intermediate layer
of SiNx was deposited by PECVD using SiH4/NH3/N2 chemistry at a low (<200 °C)
temperature. A 100 nm InOx sensing layer was then deposited by RF magnetron sputtering.
The result showed that the hydrogen adsorption into the InOx film led to an increase in its
conductivity by injecting electrons into the surface, which caused a decrease in the oscillation
frequency. When the SAW sensor was exposed to an oxidizing gas, the conductivity of the
InOx film was decreased by removing free electrons. As a result, the oscillation frequency
increased.
As demands on wireless sensing, Wen [47] introduced a RFID tag based CO2 wireless
sensor by developing a SAW integrated sensor system. The ID tag and gas sensor were
placed on the right side of the IDT, whereas the humidity sensor was located on the left side.
The reflection peaks represented the tag's ID and data. The reading system emitted EM
energy, extracting all the information from all the sensors, and recognizing environmental
conditions at each sensor location through radio-frequency identification (RFID) tag. The
reflection coefficient of the tag antenna was measured as well as the phase angle shifts of the
reflection peaks. It showed that the phase shifts were clearly observed for different CO2
concentrations. The diversity of the SAW on gas sensing can be extended if wireless
technologies such as RFID are employed as shown in Wen’s work.
Table 4 presents a summary of some earlier research work done during 1981 and 1997 on
SAW chemical sensors.
3.2 Carbon nanotube (CNT)
Beside SAW sensor, CNT based sensors are also received many attentions after the discovery
[49, 50] of cylindrical graphene shape (shown in Figure 3) multiwall carbon nanotube
(MWNT) [49] and single walled carbon nanotube (SWNT) [50] in the past two decades,
which puts forwards a new technology, with high chemical and thermal stability, high
elasticity, high tensile strength and metallic conductivity [49]. Since then many intense
investigations and researches has been ongoing on CNT and many novel applications has
occurred including scanning probes, electron field emission sources, actuators, batteries,
nanotube devices [51].
Figure 14: Structure of single walled carbon nanotubes (SWNTs) [52].
Figure 14 represents the general structure of the carbon nanotube, consisted of a cylindrical
wall and two caps. However, there are research evidences showing that the purified nanotube
with open-ends have a better electrochemical properties, as the dangling bonds is able to
further react with chemicals[53]. Moore et al [54] reported that the ends of carbon nanotube
showed excellent electrochemical properties, with reversible electrochemistry at the ends of
the tubes because of the oxide species formed from the dangling bonds of carbons. Pre-
treatment and purification are to improve the electrode performance, but to sense the
existence of the chemical is to monitor the change in the electrode. In general, the CNT-

22
based gas sensing utilizes the electrical conductance change caused by the gas adsorption as
the electrical readout.
Table 4: Chemicals and monitored air particles [48]
Measurand Substrate Chemically interactive material
(CIM)
Acetone Hydroxybutyl methyl cellulose
Methanol Hydroxybutyl methyl cellulose
H2 YZ-LiNbO3 Palladium
STX-SiO2 Palladium
Si/SiO2/ZnO Palladium
CH3CHOH Hydroxybutyl methyl cellulose
H2O STX-SiO2 Phthalocyanine (PC)
H2S YZ-LiNbO3 WO3
YZ-LiNbO3 TEA
YZ-LiNbO3 WO3
RCY-quartz WO3
Si/SiO2/ZnO WO3
CO STX-SiO2 Phthalocyanine (PC)
CO2 Phthalocyanine (PC)
CH4 STX-SiO2 Phthalocyanine (PC)
SO2 YZ-LiNbO3 Triethanolamine (TEA)
STX-SiO2 Phthalocyanine (PC)
quartz Heteropolysiloxane
NO2 YZ-LiNbO3 Lead phthalocyanine
STX-SiO2
YX-LiNbO3 Lead phthalocyanine
Quartz Copper phthalocyanine
Si/SiO2/ZnO Copper phthalocyanine
LiNbO3 none
NH3 STX-SiO2 Platinum
RCY-quartz WO3
Antigen/antibody
reactions
Z cut LiNbO3 Biologic film
SO2 Yz LiNbO3 Triethanolamine (TEA)
Toluene ZnO/AI/SixNy Poly(dimethylsiloxane)
Ethylene/vinylacetate
CH2CL2 Polycarbonate resin
Humidity STX-SiO2 Polyethynyfluoreno
Organic vapours ZnO/SiO2/Si Polymers
Vapours ZnO/Si Polymers

23
Rosen [56] applied carbon nanotubes as electrodes in gas discharge tube(GDT) in his work.
The result showed that dc breakdown voltage of the GDTs was highly depended on the gas
pressure and on the noble gas. However, the dc breakdown voltage of the nanotube coated
GDTs decreases gradually with increasing number of surges. In general, gas discharge tubes
comprising SWNT-coated electrodes had significantly improved performance in terms of dc
breakdown voltage, with lower breakdown voltage and a factor of 4–20 reduction in
breakdown voltage fluctuation. That could be attractive to Asymmetric Digital Subscriber
Line (ADSL) and High-bit-rate Digital Subscriber Line (HDSL).
Parikh[57], in 2005, described the fabrication and performance characteristics of single
walled carbon nanotube (SWNT) bundles based sensor, which was directly deposited from
aqueous surfactant supported dispersions on plastic substrates. Different types of SWNT were
used in sensing different vapors including NO2, O2, NH3. The result evidenced the change in
resistance, which was believed to be due to a work function of the tube or charge transfer
interactions, and SWNT/PET also showed better electrical responses over black/PET in his
work.
In the interest of carbon nanotube antenna, G. W. Hanson[55] did calculation on the
properties of carbon nanotube antennas via a Hallén’s-type integral equation. A carbon
nanotube antenna had inherently high impedance and relatively sharp resonances with very
low efficiencies compared to macro-scale antennas. However, carbon nanotube antennas
were found to exhibit plasmon resonances above a sufficient frequency.
In addition, Keat [58] tested a wireless gas sensor that was comprised of a gas-responsive
multiwall carbon nanotube (MWNT)—silicon dioxide (SiO2) composite layer which was
deposited on a planar inductor-capacitor resonant circuit. This sensor was able to monitor
carbon dioxide (CO2),oxygen (O2), and ammonia (NH3). The sensor response was
reversible for O2 and CO2 but irreversible for NH3. The response time was approximately
45s, 4 min and 2 min for CO2, O2, NH3. The result also showed MWNT had a lower affinity
for O2 compare to CO2. The conductivity of MWNTs shifted lower when the sensor was
exposed to CO2 or NH3. The MWNT was also humidity and temperature dependent.
Some of the research work is summarized in Table 5, including detection of
ammonia(NH3), nitrogen dioxide(NO2), hydrogen (H2) and methane (CH4), carbon monoxide
(CO), sulfur dioxide (SO2) and hydrogen sulfide (H2S), oxygen (O2).

24
Table 5: Summary of research work on CNT-based chemical sensors [59].
Analyte CNT Material/Method Detection Limit
NO2 Calculation N/A
bare CNTs 10 ppb
vertically aligned CNTs 25 ppb
metal-decorated CNTs 100 ppb
metal oxide decorated CNTs 500 ppb
Polymer-coated CNTs 100 ppt
NH3 Calculation N/A
bare CNTs 5 ppm
vertically aligned CNTs 5 ppm
CNT capacitor N/A
CNT resonant frequency
sensor
ca. 10 ppm
metal-decorated CNTs 5 ppm
metal oxide decorated CNTs 5 ppm
Polymer-coated CNTs 100 ppb
Atomically doped CNTs ca. 1%
H2 Pd-decorated CNTs 10 ppm
Pt-decorated CNTs 0.4 %
vertically aligned CNTs 100 ppm
Cryogenically cooled CNT
optical probe
4%
CH4 Calculation N/A
Metal-decorated CNTs 6 ppm
CO Calculation N/A
bare CNTs 100 ppm
metal-decorated CNTs 2500 ppm
metal oxide decorated CNTs 10 ppm
radially deformed CNTs N/A
Atomically doped CNTs N/A
CNT capacitor N/A
CNT resonant frequency
sensor
1500 ppm
Polymer-coated CNTs 167 ppm
SO2 Bare CNTs 10 ppm
H2S Metal Oxide decorated CNTs 50 ppm
O2 Calculation N/A
Bare CNTs N/A
CNT SAW sensor 1500 ppm

25
3.3 Radio Frequency Identification (RFID) Technology
Different from above technologies, Radio Frequency Identification (RFID) is entirely
wireless based. It is still a relatively new technology in chemical sensing field, evolved from
identifying and tracking technology on inventory management.
A recent work [60] done by Yang et al demonstrated the great advantage of the RFID
system. He revealed a three-level Zigbee RFID sensor network for inventory management
applications. This connectionless tracking structure employed from RFID and Zigbee
network did not require dense router, and also provided a reasonable good battery life by
employing sleep mode. Originally, RFID technology serves the same purpose as bar code
technology to provide unique identification of the object for easy locating and tracking. Bar
codes have to be manually scanned, while RFID system can be auto controlled; Ultrasound
and infrared cannot penetrate many materials, but RF signal is able to pass through many
media except conductive materials and a few others; GPS, on the other hand, is not for indoor
environment.
Another research done by Tseng also illustrated that ability. In this work [61], the author
developed a Globally Harmonized System (GHS)-based RFID system, which was able to
provide security monitoring and wireless sensing technology to collect the inventory of the
chemicals, enabling the inventory control on hazardous chemicals. The usage of all the
hazardous chemicals was recorded automatically, hence, ensuring the security of them. It also
eliminated the human operations in the system and was able to measure the varying quantities
of the chemicals in containers.
By integrating RFID technology into chemical sensing will enable the control of sensors as
well as provide wireless ability to the sensors, as mentioned earlier in Wen’s work [47] on
surface acoustic wave. Chang synthesized a new type of antenna with an RH (relative
humidity) sensing function using a modified polyimide and passive RFID. The polyimide
film had on hydrophobic element and the polyimide acid is made from diamine of
oxidianiline(ODA) and dianhydride of m-pyromellitic dianhydride in an aprotic solvent of N-
methly-2-pyrrolidone(NMP). It operates at a humidity-dependent frequency with a sensitivity
of 108kHz/%RH under 25-90%PH.
In Steinberg’s recent work [62], a pH-sensitive sol–gel thin film containing the
colorimetric indicator BCG was chosen as a model chemical interface with which to
demonstrate the feasibility of the wireless optical chemical sensor. The optoelectronic
interface of the RFID tag comprises a silicon photodiode and two light emitting diode (LED)
sources measuring the optical absorption of the pH-induced color change of the thin film at
two discrete wavelengths. The pH response curve and the pK value of the immobilized
indicator were determined using the RFID tag system and compared with the results obtained
using a standard laboratory spectrophotometer. A good correlation between the
measurements was achieved, demonstrating the viable integration of an optical absorption
based chemical sensor onto a passive RFID tag.
Potyrailo [63, 64] did research on RFID sensors and showed the possibility of such
technology on sensing toxic vapor by directly coating the sensing film onto the RFID antenna.
In his recent work, a chemical solution polystyrene sulfonate acid was coated on the surface
of a RFID sensor which was then exposed to two types of toxic vapors, acetonitrile and

26
ethanol. The results evidenced the shifts and changes of frequencies were good indicators of
the concentration of the vapors.
3.4 Summary
Based on the review in this section, Table 6 and 7 are produced as a summary of the possible
candidates for sensing film and analytes as well sensing parameters that could use as the
measurement and determination of the analytes.
Table 6 summarizes the sensing materials and corresponding vapors under the test. It
provides a guide for sensing film selection to the target vapor. Table 7 summarizes the
parameters that can be used as the indicators or the detectors corresponding to the Table 6.
Table 6: Potential sensing materials and candidates
Chemical/Material coated Vapors to be sensed
1 L-glutamic acid hydrochloride ammonia gas
2 β-Cyclodextrin m-xylene
3 A2 silica-coated quartz and Gas methanol
4 SiNx , InOx O3, H2
5 LiNbO3 CO2, humidity
6 SWNT/PET NO2
7 MWNT(pyrolysis of ferrocene and xylene)-SiO2 CO2, O2, NH3
8 SnO2 CO and NO2
9 Poly file(dimethylsiloxane) toluene
10 Polyisobutylene; polyvinyl alcohol, polyvinylpyrrolidone;
polyethylene glycol, polyethyleneimine; Nafion
HCl vapor, CO2
11 Mixture of Dicyclothexylcarbodiimide(DCC)
Dimethylsulfoxide(DMSO) Dichloromethane(DCM)
H2
12 - methane, ethane, propane
13 super continuum spectrum Carbon monoxide(CO)
14 Polystyrene sulfonate acid EtOH, CAN, H2O
15 - -
16 WO3 NOx, NH3
Table 7: Sensing Parameters

27
Parameters
1 Frequency and
frequency shift
Concentration Time
2 Frequency shift due
to mass loading
Resonant
frequency
Layer height Mass
loading
Film layer
density
3 Mass change of the
methanol
Modulus change
of the methanol
Frequency changes
of quartz and Gas
SAW
4 Time Frequency
5 Antenna S11,
reflection
coefficient
Antenna Phase
angle
6 Voltage Current Time Electric
response
∆R/R
7 Time Relative
permittivity
Conductivity Resonant
frequency
impedance
8 Current Time
9 Plate wave
Frequency shift and
frequency
Mass per unit area
on the bare plate
and chemical
sensitive film
Wave length and
optical wave length
of the laser
Intensity of
the laser
wave
10 Voltage Current Time Electric
response
∆R/R
11 Voltage Current Wavelength Transmittan
ce
12 Temperature conductance Surface Shottky
barrier height, Vs
13 Time Wavelength Voltage Correlation
amplitude
14 Antenna Resonant
frequency(f1 and
f2)
Antenna
Impedance Zp
Antenna Frequency
position fp
Vapor
pressure and
saturated
vapor
pressure
15 Antenna Resonant
frequency(f1 and
f2)
Antenna
Impedance Zp
Antenna Frequency
position fp
Vapor
pressure and
saturated
vapor
pressure
16 Operation
temperature
Annealing
temperature
Vapor
Concentration
Time

28
Chapter 4
Theory and Modeling of Distance Effect of
UHF RFID
4.1 Power and Distance
The wireless energy transmission described by Friis equation [65], with reflection coefficient
[66], , and polarization loss factor (PLF) [67], , taken into consideration, is following
(1)
Where,
From Eq. (1), it shows that the received power by the tag, , is inverse proportional to
the second power of the distance:
(2)
The inverse proportionality shows that as the distance increases, the less amount of the
power drops over the increment distance. Based on Eq. (2), the modeling of the received
power of the tag over distance for a simple RFID system that contains one reader and one tag
can be simulated as Fig. 1(a):

29
(a) (b)
Figure 15: Mapping between power and reliability of the system; (a) power levels for 100%
and 0% reliability and corresponding distances; (b) linear approximation of the model and
mapping from power to reliability.
When the received power is sufficient high (>Pi), the present of tag is always detected,
defined as 100% reliability, while when the received power becomes insufficient to power the
tag (<Pf) as the distance increases, the tag is no longer detectable, defined as 0% reliability.
When the power decreases from Pi to Pf as the distance increases, the reliability is also
decreasing from 100% to 0%. Thus, the percentage reliability can be mapped to the power for
that range, and following equation is proposed.
(3)
Where,
Thus, based on Eq. (1) and (3) the reliability in second region can be rewritten as
(4)
A simplified version can be obtained by applying linear approximation, presented as a
straight dash line connected between 100% and 0% reliability in Fig. 1(a).
(5)
Rearranging it, the relationship between power and distance is obtained.
P
Pi
Pf
di df d
100% Reliability
0% Reliability
0
Pow
er
Distance
di df
Distance (cm)
Reli
ab
ilit
y (
%)
0
100
d

30
(6)
Based on the distances, di, df, three regions can be identified. In the first region (d<di),
denoted as the stable region, the reading reliability is relatively high (100%); in the second
region (di<d<df), denoted unstable region, the reading reliability is between 0% and 100%;
and in the third region (d>df), the reliability is low and becomes zero. Depending on the range
of unstable region, following two cases have been identified.
Case 1: the unstable region is quite small
In RFID design, the operation power of tag is expected to be quite low, with relative long
reading distance, di, of the stable region. Thus, the unstable region, defined as df-di, is small
compared to stable region. Thus, for this case, the following conditions are applied.
(7)
Then, substitute into Eq. (4), the simplified version is given as following.
(8)
This is the same as linear approximation of the general case in Fig. 1(b). Thus, the linear
approximation could be quite accurate when the unstable region is small.
Case 2: the unstable region is large
When the df is getting larger, the corresponding Pf is quite small (≈0), which indicates Pf <<
Pi. Thus, Eq. (3) can be rewritten as
(9)
Then,
(10)
By modeling reliability based on the distance, it is much more convenient and easier for
performance prediction since distance is a parameter that is relatively easy to measure in the
practical sense.
4.2 Reading period
When energy is transmitted wireless to tag, it will first charge a capacitor inside the tag to
reach the operation power requirement of the tag. As the distance between tag and reader

31
increases, less energy is transmitted and consequently more time would be required to reach
the threshold power for the tag to operate. Thus, besides increasing the output power of the
reader, increasing the reading period would also extend the reading range. Other factors, such
as reflection coefficient and propagation loss factor have similar effects but already included
in the basic formula which is not evaluated hereby.
Figure 16: Illustration of two reading periods, t1 and t2. The maximum reading distance with
100% reliability are defined as d1i and d2i; the 0% reliability first occurs at d1f and d2f.
Figure 16 illustrates two reading periods, t1 and t2 respectively. d1i and d1f define the
unstable region for reading period t1 while d2i and d2f defines unstable regions for reading
period t2. By energy equation, following equation is obtained.
(11)
Substitute Eq.(1) to Eq.(11), for different time period as illustrated in Fig. 2, the
relationship between time and distance can be found for the two cases for 100% and 0%
reliability respectively.
(12)
Hence,
(13)
And,
(14)
Eq. (13) and (14) illustrate that the unstable region is proportional to the stable region for
the same tag and it is independent of time.
d1i d2i
Rel
iabilit
y(%
)
100
0
t1t2
Distance(m)
d2f d2f

32
Thus, the extended distance is following.
(15)
Similarly,
(16)
Combining Eq.(15) and (16),
(17)
Eq. (12) and (17) shows that as time, t2, increases, though the reading distance, d2i, would
increase, the unstable region defined by d2f-d2i would also increase. This allows prediction of
reading distance based on the time period. By performing one set measurement (t1, d1f), one is
able to predict the required reading period for preferred distances. It also evidences that this is
a tradeoff among reading range, power and the width of unstable region.
4.3 Reader Modeling
Many applications take the advantages of passive tags because of its relatively small size, low
cost and battery-free characteristics. However, to maintain suitable reading ranges, readers
are required to output more power to ensure the operation of passive tags.
Based on Eq. (1) which describes the power transmission between two antennas, the power
received by the tag antenna would be:
(18)
And
(19)
Where,

33
In the experiments, the reader and the tag are placed face to face, light in sight, and
then . Hence,
(20)
4.4 Tag Modeling
Figure 17: Equivalent circuit model of a typical tag.
Tag is another major component of RFID system, consisted of a transponder chip and an
antenna, a simplified tag representation in Figure 17. is referred as modulated impedance
during load modulation in backscattering process, which varies based on the stored data in
the chip and generates corresponding voltage alternations on the reader side. Such voltage
alternation is then demodulated to obtain the data at the reader side. is referred as load
resistor and is referred as charging capacitor that stores incoming energy from the reader.
For maximum power transmission in the ideal case, the antenna impedance, ZA, would match
with the chip impedance, . The reflection coefficient from transmission theory provided in
[64] then is calculated as following:
(21)
Where,
Also, based on radar theory, the power reflected or backscattered at the tag antenna would
be:
(22)
Antenna
Reader Tag
Chip

34
Where,
Then,
(23)
(24)
Where,
Substitute Eq. (6) to (3),
(25)
That would give, assuming no other losses:
(26)
Based on the geometry shape of the tag, an approximation on the equation in [65] for the
maximum cross section area of a rectangular flat plate is adopted:
(27)
Where
Therefore, Eq. (3) can be rewritten as:
(28)

35
Chapter 5
Distance Experiment Results of UHF RFID
5.1 Experiments Setup
Experiments were conducted in an open space. Five types of Ultra-High-Frequency (UHF)
metal tags and two types of ultra-high-frequency paper tags were used. One handheld RFID
reader with linear polarized antenna (MC9000G, Symbol Technologies), which is similar to
that used at the checkout points in glossary stores, and one fixed reader (MICRO-UHF with
portable antennas, Tagsense Inc. ) were used in the experiments. The output power for
handheld reader is 4 watt, while the output power for the fixed reader is 50 milliwatt. Two
portable antennas, 6dbi dipole antenna and 8dbi flat antenna, were used for MICRO-UHF
reader.
In the range sensitivity test, the reader was fixed while the RFID tag is displaced
perpendicularly to its out of plane axis (vertical position) away from the reader by
incremental distances such as d1 and d2. For each incremental distance, tag presence or lack
of was recorded. The maximum reading distance, df , is determined as the distance where the
tag are no longer detectable and identifiable.
In the orientation sensitivity tests, tags were orientated either vertically or horizontally, at
which the vertical orientation refers to the case of zero degree angle (see Figure 18(a)) and
the horizontal orientation refers to θ=90º (see Figure 18(b)). The range sensitivity test is
repeated as the tags are placed along the horizontal orientation.
The range sensitivity tests were conducted to assess the performance of the RFID system in
the presence of “obstacles” that were placed between the reader and the tag or right behind
the tag (Figure 18(c)). Materials such as paper, cardboard, foam, metal and graphite
composites were employed in the obstacle structures.
For above tests, there were 10 trials for each experiment which was then repeated three
times or more. In this paper, data summarized in the table and figures were the average values
based on 10 trials. Two criteria in the evaluation of RFID system performances were tag
sensitivity and reliability.
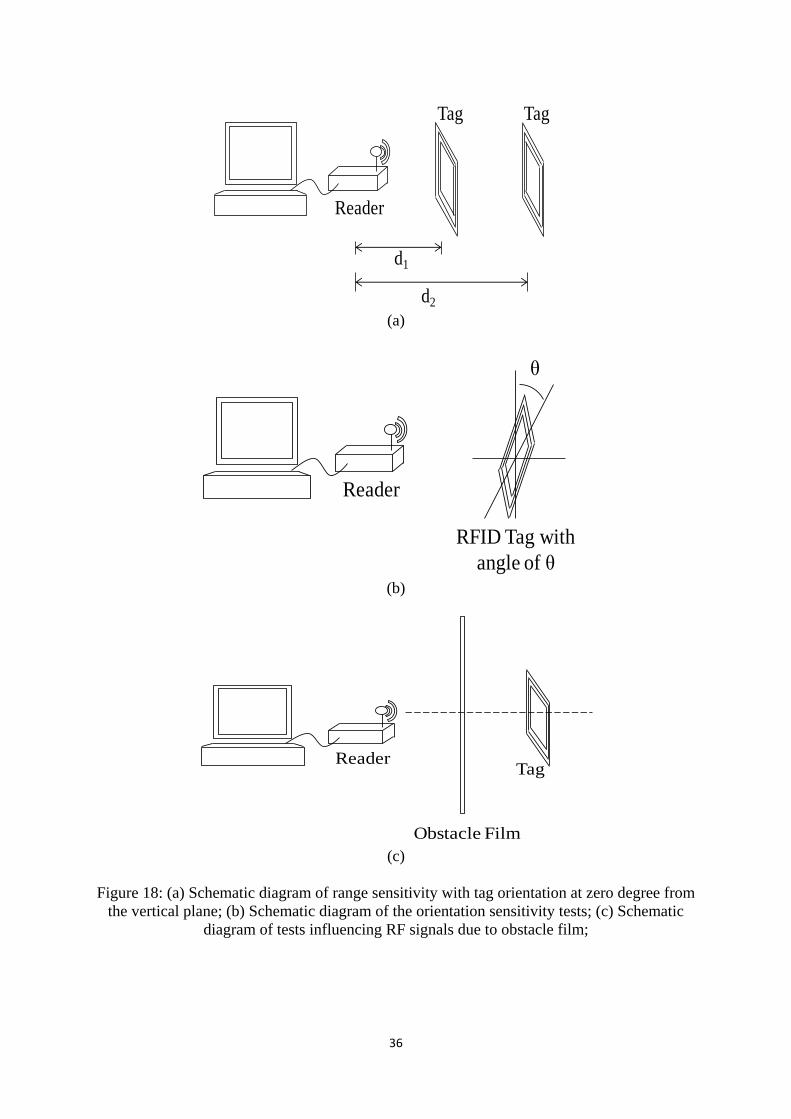
36
(a)
(b)
(c)
Figure 18: (a) Schematic diagram of range sensitivity with tag orientation at zero degree from
the vertical plane; (b) Schematic diagram of the orientation sensitivity tests; (c) Schematic
diagram of tests influencing RF signals due to obstacle film;
d1
d2
Reader
Tag Tag
θ
Reader
RFID Tag with
angle of θ
ReaderTag
Obstacle Film

37
5.2 Range and sensitivity
It is observed that the range sensitivity spectrum can be divided into three regions. In the first
region, denoted as the stable region, the reading reliability is relatively high (100%); in the
second region, denoted as unstable, the reading reliability is between 0% and 100%; and in
the third region, the reliability is low and eventually becomes zero. Fig. 5 illustrates these
three regions for different tag orientations (vertical and horizontal). It is further noted that the
presented data is the average of 10 readings conducted at 10 sec duration each. Readings at 2
sec were also conducted leading to lower reliability and sensitivity ranges, hence not reported
here. In fact for the 2 sec detection response the stable sensitivity range was less than 50 cm;
however, when the response time was set to 10 seconds, stable sensitivity range was doubled
to 100 cm.
Table 7 shows the results for range and orientation sensitivity and reliability, using the
portable RFID reader with linear polarized 6 dBi gain antenna and 915MHz UHF RFID paper
tag. The processes described in Fig. 3(a) and (b) were conducted to produce this table.
Table 8: Effect of Distance and Orientation between Portable Reader and UHF Paper Tag.
Range Sensitivity d
(cm)
Tag Detection Rate (Reliability, %)
Reader ┴ to Tag
(Horizontal 90o)
Reader ┴ to Tag
(Vertical 0o)
100 100 100
110 100 87
120 100 43
130 100 13
140 97 10
150 100 0
160 83 0
170 67 0
180 53 0
190 33 0
200 26 0
210 0 0
Figure 19 represents the percentage power loss in this studied region, for a horizontal tag
orientation. The received power at distance 150 cm was considered as the reference power
and other power was denoted as a percentage of the reference power. This power loss
percentage is based on the theoretical Eq. (1) and (3), while the reliability is obtained from
experimental data. The demonstration of the similarity between power and tag reliability
confirmed that as the reading range increases, the reliability decreases along with the power.
Above a high threshold point (the power received at a distance of 150 cm), the RFID tag can
reliably be detected, below a lower threshold point (the power received at and after a distance
of 200 cm), the RFID tag can’t be detected at all. The measured reliability is proportional to
the received power.

38
(a)
(b)
Figure 19: Reliability rate (%) drops as distance increases in the unstable region at 0o phase
shift and 90o phase shift; (a) Horizontal measurement, 0
o; (b) Vertical Measurement, 90
o.
0%
20%
40%
60%
80%
100%
120%
100 120 140 160 180 200 220 240
Reliabilit
y (
%)
Distance (cm)
Horizontal Measurement
Linear Modeling
Quad Modeling
0%
20%
40%
60%
80%
100%
120%
80 100 120 140 160
Rel
iab
ilit
y (
%)
Distance (cm)
Vertical Measurement
Linear Modeling
Quad Modeling

39
The prediction by the ratio is quite similar to reliability measurement. The prediction errors
are approximately 7.1% for linear modeling based on Eq.(8) and 13.6% for quadratic
modeling based on Eq.(10) for horizontal measurement as in Fig. 4(a). For vertical
measurement, the errors are 13.9% and 15.9% for linear and quadratic modeling respectively.
Linear modeling shows a better result for this tag. This also confirms that when the stable
region is larger, quadratic modeling is getting more accurate, while it is opposite for linear
modeling, also shown in Fig. 5. In addition, by knowing the region boundary of the transition
region, the reliability of the tag in the region can be predicted directly based on the distance
of the boundaries. The corresponding power can also be found based on modeling equation.
Then the measurement of power loss are only required at the boundary of the transition
region to obtain the full spectrum of the region.
It also notices that the measurement of the transition region is approximately 50% of the
stable region for both horizontal and vertical cases. It evidences that the transition region is
also proportional to the stable region by a ratio, which is also confirmed by the model and
Equation (13) and (14).
5.3 Time
It is further noted that the presented data in Fig. 5 is the average of 10 readings conducted at
10 sec duration each. Readings at 2 sec were also conducted leading to lower reliability and
sensitivity ranges.
Figure 20 shows the comparison between 2 second measurement and 10 second
measurement. The prediction errors are approximately 11.4% for linear modeling and 28.0%
for quadratic modeling in the 2 second measurement. For the 10 second measurement, the
errors are 16.5% and 14.2% for linear and quadratic modeling respectively, which confirms
the finding that as stable region grows quadratic modeling is more appropriate. In addition,
the widths of the unstable region are 70 centimeters and 100 centimeters.

40
(a)
(c)
Figure 20: Measurements and experiments result for different time period which shows linear
modeling has a better coherence. (a) 2 second reading period; (b) 10 second reading period.
0
0.2
0.4
0.6
0.8
1
1.2
0 50 100 150 200
Reliabilit
y (
%)
Distance (cm)
2 second
Linear Modeling
Quad Modeling
0
0.2
0.4
0.6
0.8
1
1.2
0 50 100 150 200 250
Reliabilit
y (
%)
Distance (cm)
10 second
Linear Modeling
Quad Modeling

41
5.4 Obstacle
In the obstacle experiment, the fixed MICRO-UHF reader, with 8 dBi gain flat patch antenna,
and the 915MHz paper tag were used. A stack of paper, of different thickness was used as the
obstacles. As presented in Table 8, using the flat patch antenna, the stable sensitivity range or
stable region (defined as 100% reliability) was 70 cm. This is due the difference between the
output powers of the two readers and the gains associated with readers’ antennae.
A reliability of 100% was obtained for detection range within 12 cm for all ranges of paper
thicknesses. At 100 cm, the reliability has completely degraded. It is observed that as the
paper thickness increases linearly, the range sensitivity decreases exponentially. Figure 21(b)
illustrates this characteristic. Additionally, as the reliability decreases, the curve shifts from
left (100% reliability) to right (0% reliability). Figure 21(a) demonstrates the relationship of
the percent reliability to the paper stack thickness. The solid lines represent experimental data
at different distances; from top to bottom are distances 15 cm, 20 cm and 25 cm, respectively.
It is observed that the reliability declined as the paper stack thickness increased; the higher
the thickness, the faster the decline rate is. At a range of 20 cm, a linear relationship between
the reliability and the obstacle thickness is established (dotted linear line). Such linearity
provides predictive ability to assess the reliably in the presence of such obstacle.
Table 9: Effect of Obstacles between Fixed Micro-UHF Reader and UHF Paper Tag.
Sensitivity Range
d (cm)
Tag Detection Rate
(average successful trails out of 10 trails)
No obstacle Papers
(15mm)
Papers
(35mm)
Papers
(65mm)
10 10 10 10 10
12 10 10 10 10
13 10 10 10 9.7
14 10 10 10 2.3
15 10 10 9.3 2
16 10 10 8.3 0
18 10 9.5 4.3 0
20 10 8.7 3.7 0
22 10 2.3 2 0
24 10 1 0 0
25 10 0 0 0
70 10 0 0 0
80 9.7 0 0 0
90 6 0 0 0
100 3 0 0 0
110 0 0 0 0
It is noted that similar trends were observed for other non-metallic obstacles; however, for
metallic obstacles (e.g. aluminum alloy film), a 0% reliability was obtained for all sensitivity
ranges. This was expected, since the incident electromagnetic wave was reflected by the
metallic surface with a 180º phase shift [66, 67].

42
(a)
(b)
Figure 21: (a)Obstacle thickness effect on reliability; (b) Obstacle thickness effect on range sensitivity.
-20%
0%
20%
40%
60%
80%
100%
120%
0 10 20 30 40 50 60 70
Rel
iabil
ity
(%
)
Thickness of the Paper Stack (mm)
20 cm
15 cm
25 cm
0
20
40
60
80
100
120
0 10 20 30 40 50 60 70
Sen
siti
vit
y R
ang
e (c
m)
Thickness of the Paper Stack (mm)
100% reliability
0% reliability

43
Chapter 6
Humidity and Temperature Experiment Result
of UHF RFID
6.1 Experiments Setup
One thin (paper like) 915 MHz UHF tag (98.2 x 12.3 mm) and one 840~960 MHz flat
antenna (220 x 220 x 30 mm) were used in this experimental assessment. An ESPEC (ESX-
3CA) environmental chamber was used for humidity and temperature control, and an Anristu
network analyzer (VNA-MS2026C) was used for data collection and analysis as in Figure
22(a). Inside the environmental chamber shown in Figure 22(b), the antenna was placed at a
fixed 10 cm away from the tag. The antenna was connected to the network analyzer which
was placed outside the environmental chamber. The environmental chamber’s operating
conditions are shown in Fig.2.
Figure 22: Illustration of experimental setup; (a) environmental chamber and network
analyzer; (b) tag and antenna.
(a) (b)
VNA
Chamber
Antenna
Tag

44
(a)
(b)
(c)
Figure 23: Frequency measurements; (a) tag’s resonant frequency; (b) valley and peak
frequency of the imaginary impedance measurement; (c) peak frequency of the real
impedance measurement.

45
In this performance assessment work the tag-antenna system was subjected to a varying
temperature and humidity environment. In the temperature variation experiment, the relative
humidity (RH) was fixed, independently, at 50% and 80%, while the temperature increased
from 20oC to 80oC at increments of 10oC. Similarly, at the same humidity levels, the
temperature was ramped down at the same increments of 10oC from 80oC to 20oC. To
assess the repeatability of the results the tests were repeated twice. In the humidity variation
experiment, the temperature was fixed, independently, at 50oC and 80oC, while the RH
varied from 20% to 80% and from 80% to 20% at increments of 10%. Similar to the
temperature experiments, and to assess the repeatability of the results the tests were repeated
twice.
In both humidity and temperature tests, the environmental chamber was considered as an
enclosure having metal sidewalls. The adverse effects of metal on radio frequency
propagation are well known and are presented in the open literature. To discern the metal
effect and to project a more realistic environment, additional data was taken with the
environmental chamber door open, at the above presented conditions. The door was kept
open for few seconds at each test point. For example, after taking data at 50oC and 50% RH,
the door of the chamber was opened, for few seconds, to allow for signal propagation and
data collection for the particular condition. This process reduces the interaction of the
conductive enclosure on the RF signal propagation.
In this investigation, analysis has mainly focused on the passive UHF RFID tags’ resonant
frequency variation as a result of environmental changes. Selected tag’s frequency
characteristics (Figure 23) were monitored. These characteristics include resonant frequency,
imaginary impedance valley and peak frequency and real impedance peak frequency. The
resonant frequency is denoted by fo (Fig. 21(a)), the valley and peak frequencies of the
imaginary impedance are denoted by F1 valley and F1 peak (Fig. 21(b)); whereas, the peak
frequency of the real impedance measurement is denoted by F2 peak.
6.2 Temperature Variation Effects
In varying the temperature while holding the RH constant, a change in the resonant frequency
of the RFID tag was observed, as shown in Fig. 4. In both cases where the environmental
chamber door was open and closed, and at 80% RH, a linear relationship was obtained
between the resonant frequency and the temperature.
In the experimental setup where the door of the environmental chamber was closed, and at
80% RH, the frequency decreased from 912.727 MHz to 909.425 MHz with a rate (slope of
the trend line) of 55.05 kHz/oC while the temperature increased from 20
oC to 80
oC (Figure
24(a)); when the door was open, the decrease of frequency was more pronounced and varied
from 912.927 MHz to 907.524 MHz with a rate of 90.05 kHz/oC (Figure 24(b)). The rate of
frequency decrease is higher when the chamber door was open. This is a result of the effect
of the metal enclosure on the UHF response. Although the heat transfer from the chamber to
its outside, when the door was opened, might have certain effect on the frequency shift, the
heat loss would result in lower temperature indicative of lesser resonant frequency shift.
Additionally, the rate of decrease between the temperature ramp up and down for both closed
and open chamber door, is found to be 57.1 kHz/oC and 82.8 kHz/
oC respectively. This
difference between temperature ramps up and down is believed to be due humidity variation.
46
909
909.5
910
910.5
911
911.5
912
912.5
913
913.5
10 30 50 70 90
Fre
qu
en
cy
(M
Hz)
Temperature (oC)
Up
Down
Trend line (Up)
Trend Line (Down)
(a)
907
908
909
910
911
912
913
914
10 30 50 70 90
Fre
qu
ency
(M
Hz)
Temperature (oC)
UpDownTrend line (Up)Trend Line (Down)
(b)
Figure 24: The resonant frequency shift as a result of temperature variation; (a) chamber door
closed (at 80% RH); (b) chamber door open (at 80% RH); (c) comparison between 50% RH
and 80% RH.
(c)

47
Figure 24: The resonant frequency shift as a result of temperature variation; (a) chamber door
closed (at 80% RH); (b) chamber door open (at 80% RH); (c) comparison between 50% RH
and 80% RH.
905
906
907
908
909
910
911
912
913
914
1020
3040
5060
7080
90
Frequency (MHz)
Tem
pera
ture
(o C
)
RH
-50
open
RH
-50
clos
eR
H-8
0 op
enR
H-8
0 cl
ose
open
clos
e

48
This difference is practically insignificant in the open door case. It is noted that the rates
of increase or decrease are obtained as an averages between the ramps up and ramp down.
At 50% RH, similar frequency decreases were also observed (Figure 24(c)). A rate of
decrease of 25.5 kHz/oC for closed chamber door and of 25.8 kHz/
oC for open chamber door,
were obtained, respectively. Similar to the 80% RH case, the higher rate of decrease is
associated with the open door configuration, indicating the similar effects of the metallic
enclosure on the RF signal propagation. Additionally, at this lower level of humidity, the rate
of change was slower than at higher humidity levels. Such higher frequency variation at
higher humidity level is also observed in the humidity experiment (next section). This change
can be attributed to the change of antenna properties, including both resistance and
capacitance. Larger variation on temperature may result higher change on the antenna
resistance and capacitance, which could alter the resonant frequency further away from its
nominal value.
6.3 Humidity Variation Effects
In varying the humidity while holding the temperature constant, a change in the resonant
frequency of the RFID tag was observed, as shown in Fig. 5. In both cases where the
environmental chamber door was open and closed, and at 80oC, a linear relationship was
obtained between the resonant frequency and relative humidity. In this experiment, both the
humidity ramp up and down are provided at 80oC but only the ramp up was recorded at 50
oC,
unlike the case of temperature variation where both temperature ramp up and down were
provided for both cases in Figure 25.
In the experimental setup where the door of the environmental chamber was closed, and at
80oC, the frequency increased from 906.529MHz to 908.279MHz, for variations in humidity
from 20% RH to 80%RH at intervals of 10% RH (Fig. 5(a)), with a variation rate of 12.1
kHz/RH. Whereas, in the case of open chamber door, the variation of frequency was
increased from 907.126MHz to 908.627MHz (Fig. 5(a)) with a variation rate of 0.08 kHz/RH.
The rate of frequency increase is higher when the chamber door was closed. This is a result
of the effect of the metal enclosure on the UHF response as well as heat transfer. This
difference is practically insignificant in the open door case believed to be due to reflection
and deflection of water vapor at higher relative humidity level beside the metal effect caused
by the chamber itself. The added reflection and deflection generally introduces phase shift to
the original signal, and such phase shift can be both positive and negative, which could cause
the resonant frequency shift either way. As a result, more frequency variation was observed
when the chamber was closed. The gap between the two trend lines may be explained by heat
transfer loss, identified earlier. The higher the humidity level, the more humidity and
frequency loss would be expected when the door is open. Given the fact, the trend lines R2
values are low for both closed and open door cases, 0.106 and 0.00001 respectively, these
trend lines are not conclusive.

49
900
901
902
903
904
905
906
907
908
909
910
10 30 50 70 90
Frq
uen
cy
(M
Hz)
Relative Humidity (%)
open
close
Trend line (open)
Trend Line (close)
(a)
905
905.5
906
906.5
907
907.5
908
908.5
909
909.5
910
10 20 30 40 50 60 70 80 90
Frq
uen
cy (M
Hz)
Relative Humidity (%)
T-80 open T-80 closeT-50 open T-50 closeT-80 open T-80 closeT-50 open T-50 close
(b)
Figure 25: Resonant frequency shift due to humidity variation; (a) comparison between two
cases (open and close) at 80oC; (b) comparison between 50
oC and 80
oC.

50
At 50oC, similar frequency behavior was also observed in Figure 26(b). A rate of increase
of 12.2 kHz/oC for closed chamber door and a rate of decrease of 9.7 kHz/
oC for open
chamber door, were obtained, respectively. Similar to the 80oC, the similar rate of increase is
associated with the open door configuration, indicating the similar effects of the metallic
enclosure and humidity impact on the RF signal propagation and showing the repeatability of
the experiment. Additionally, the constant displacement of approximately 0.88 MHz also
confirmed the frequency shift due to temperature variation (previous section). Although
based on Figure 26(a), the expectation of the displacement would be about 1.5 MHz, such
difference could be caused by humidity variation, which is 2.75MHz. It is observed that, at
both 50oC and 80
oC, the change in frequency shift between the closed and open door
configurations, increased as the humidity increased. This increase took place at similar rates
but opposite direction. If the average of the frequency shift for both open and closed
configurations, for both 50oC and 80
oC, is obtained, no change of the frequency shift would
be observed with increase in humidity.
In addition to the use of the UHF RFID resonant frequency, for the assessment of the
impact of temperature and humidity variations on the tags response, characteristics such as
impedance valley and peak frequency were also used. Figure 27 and Figure 28 present the
valley frequency (F1 valley), peak frequency (F1 peak) of imaginary impedance and peak
frequency (F2 peak) for real impedance at different temperature and humidity variations,
respectively. These experimental conditions, for obtaining the variations in frequency, are
identical to those employed in the above two sections.
Figure 27 illustrates distinctively the rate of increase of F1 valley, F1 peak and F2 peak
frequencies as function of temperature increase in both, open and close door configurations
and for both high and low humidity, 80% RH and 50% RH, respectively. It is observed that
the rate of increase, with temperature increase was lower for open door configuration for both
cases of RH. However, as seen in Fig 4.c, a higher rate of decrease was observed for the open
door configuration. At this stage of the research, it is not clear why as the temperature
increased the resonant frequency shifts decreased, while the F1 valley, F1 peak and F2 peak
frequencies increased. The difference between the frequencies at 80% RH and 50% RH was
not as pronounced in Figure 27 as was in Figure 25(c). Additionally, Figure 27 illustrates an
insignificant change in F1 valley, F1 peak and F2 peak frequencies as the relative humidity
increased from 20% to 80% for both open and closed door configuration and for both 80oC
and 50oC. If the average of open and closed door configurations is taken in the case of Figure
25, similar conclusions can be drawn about the insignificance change in the resonant
frequency shifts.

51
(a)
(b)
Figure 26: The peak and valley frequency shift as a result of temperature variation; (a) close
case at 80% RH; (b) open case at 80% RH; (c) close case at 50% RH; (d) open case at 50%
RH
694
695
696
697
698
699
700
701
10 30 50 70 90
Fre
qu
en
cy
(M
Hz)
Temperature (oC)
F1 Valley
F1 Peak
F2 Peak
688
690
692
694
696
698
700
702
704
0 20 40 60 80 100
Fre
qu
en
cy
(M
Hz)
Temperature (oC)
F1 Valley
F1 Peak
F2 Peak

52
(c)
(d)
Figure 26: The peak and valley frequency shift as a result of temperature variation; (a) close
case at 80% RH; (b) open case at 80% RH; (c) close case at 50% RH; (d) open case at 50%
RH
694
695
696
697
698
699
700
701
702
0 20 40 60 80 100
Fre
qu
en
cy
(M
Hz)
Temperature (oC)
F1 Valley
F1 Peak
F2 Peak
690
692
694
696
698
700
702
704
10 30 50 70 90
Freq
uen
cy
(M
Hz)
Temperature (oC)
F1 Valley
F1 Peak
F2 Peak

53
(a)
(b)
Figure 27: The impedance frequency shift as a result of humidity variation; (a) close case at
80oC; (b) open case at 80
oC; (c) close case at 50
oC; (d) open case at 50
oC
690
692
694
696
698
700
702
10 30 50 70 90
Fre
quency (
MH
z)
Relative Humidity (%)
F1 Valley
F1 Peak
Real Peak
680
685
690
695
700
705
10 30 50 70 90
Freq
uen
cy
(M
Hz)
Relative Humidity (%)
F1 Valley
F1 Peak
F2 Peak

54
(c)
(d)
Figure 27: The impedance frequency shift as a result of humidity variation; (a) close case at
80oC; (b) open case at 80
oC; (c) close case at 50
oC; (d) open case at 50
oC
685
687
689
691
693
695
697
699
701
10 30 50 70 90
Freq
uen
cy
(M
Hz)
Relative Humidity (%)
F1 Valley
F1 Peak
F2 Peak
680
685
690
695
700
705
10 30 50 70 90
Freq
uen
cy
(M
Hz)
Relative Humidity (%)
F1 Valley
F1 Peak
F2 Peak

55
Chapter 7
Conclusion
Our experimental studies investigate the characteristics of different tags in different
environment. The tag performance data is important in tag selection for practical applications
and future optimization.
The range detection sensitivity, the tag orientation sensitivity, as well as the RFID system
reliability to obstacles presence have been evaluated. In the absence of obstacles, tag
orientation has improved the system reliability and range of detection. Employing a higher
gain antenna, the sensitivity range is improved by half of the original range, for the same
reliability level. By increasing the response time, the readability increases in the unstable
zone. In the presence of non-metallic obstacles, it appears the reliability and range sensitivity
has not been affected by the thickness of the obstacle used. The range detection sensitivity,
the tag orientation sensitivity, as well as the RFID system reliability to obstacles presence
have been evaluated and matches with theoretical model. In the absence of obstacles, tag
orientation has improved the system reliability and range of detection. Our experimental
studies investigate the characteristics of different tags in different environment. The tag
performance data is important in tag selection for practical applications and future
optimization. The study on the temperatures shows that temperature has linear relationship
with resonant frequency.
By knowing the region boundary distance of the transition region, the power loss in the
region can be predicted directly based on the ratio of the two boundaries, and the
measurement of power loss are only required at the boundary of the transition region to
obtain the full spectrum of the region with 10.6% error. In addition, the linearity between
time and power in the transition region can be used to predict the transition region of other
reading periods by knowing one reading periods with 14% error. This could greatly simply
the calculation required for three regions predictions, stable, transition and unstable regions.
An investigation on the impact of temperature and humidity variations on a passive UHF
RFID system response was also conducted. UHF RFID characteristics such as resonant
frequency and impedance frequency were used to assess such impact at different
temperatures (20oC to 80
oC) and relative humidity (20% to 80%) in closed and open
environments.

56
Experimental results demonstrate a linear relationships between passive UHF RFID tags’
frequency (resonant and impedance) and temperature at different level of humidity.
Additionally, as the relative humidity increased, at different levels of temperature, an
insignificant change in frequency (resonant and impedance) is observed, indicating the lack
of influence of humidity on the tag’s response. The linear relationship between frequency and
temperature could be used as a temperature indicator On the other hand, for future work on
the RFID tags, only temperature compensation is required. . Further investigations will focus
on understanding the mechanism behind the decrease of resonant frequency and the increase
of impedance frequency as function of temperature.

57
References
1. Peter Jones, Colin Clarke-Hill, Peter Shears, Daphne Comfort, David Hillier, Radio frequency
identification in the UK: opportunities and challenges, [Online document], [Accessed 2012
Jan 24], Available HTTP: http://www.emeraldinsight.com/journals.htm?issn=0959-
0552&volume=32&issue=3&articleid=857463&show=html&view=print&nolog=188313&P
HPSESSID=pcctg38c1o3auuthom7ui57eq1
2. Images of RFID Tags,, [Online document] [Accessed 2012 Jan 24], Available HTTP:
http://www.spychips.com/devices/tag_images.html
3. Technovelgy.com, “What is RFID?” [Online document], [Accessed on April 14, 2012],
Available HTTP: http://www.technovelgy.com/ct/Technology-Article.asp?ArtNum=1
4. Mark Roberti, “Why RFID—and Why Now?” [Online document], [Accessed on April 14,
2012], Available HTTP: http://www.rfidjournal.com/article/view/7662/1
5. DataBrokers.net, “Why RFID”, [Online document], [Accessed on July 15, 2010], Available
HTTP: http://www.databrokers.net/why_rfid.html
6. ornl.gov, “Total Asset Visibility”, [Accessed on April 14, 2012], Available HTTP:
http://www.ornl.gov/sci/rf-micro/projects/totalvis.htm
7. Technovelgy.com, “RFID Reader Collision” [Online document], [Accessed on April 14,
2012], Available HTTP: http://www.technovelgy.com/ct/Technology-
Article.asp?ArtNum=58
8. Technovelgy.com, “RFID Tag Collision” [Online document], [Accessed on April 14, 2012],
Available HTTP: http://www.technovelgy.com/ct/Technology-Article.asp?ArtNum=57
9. Yanjun Zuo, Survivable RFID Systems: Issues, Challenges, and Techniques, July 2010,
Systems, Man, and Cybernetics, Part C: Applications and Reviews, IEEE Transactions on,
Volume 40, Issue 4, page: 406 – 418.
10. Corefield.com, “RFID & Public Health: A Cause For Concern?”, [Accessed on April 14,
2012], Available HTTP:
http://www.corerfid.com/technology/TechnologyIssues/IssuesHealth.aspx
11. Jim Wilson, “Remote Sensing Technologies and Global Markets ”, February 2007, [Online
document] [Accessed on April 14, 2012], Available HTTP:
http://www.bccresearch.com/report/IAS022A.html,
12. Kevin Gainer, “Environmental Sensing and Monitoring Technologies: Global Markets,
February 2007, [Online document] [Accessed on April 14, 2012], Available HTTP:
http://www.bccresearch.com/report/IAS022A.html,
13. The electronics industry market research and knowledge network , RFID: Technology,
Applications, and Global Markets, ISBN/SKU #: GB-IAS020B, and
http://www.corerfid.com/Files/White%20Papers/033%20Health%20Fact%20Sheet.pdf
14. David C. Wyld, (2006),"RFID 101: the next big thing for management", Management
Research News, Vol. 29, Iss: 4 pp. 154 - 173
15. Supply Chain Digest, “Understanding Differences Between Bar Code and RFID”, [Online document], [Accessed on April 14, 2012], Available HTTP:
http://www.scdigest.com/assets/On_Target/10-06-23-1.php?cid=3544
16. Alameed Computer Company, “RFID vs. Barcode”, [Online document], [Accessed on April
14, 2012], Available HTTP: http://alameedtech.com/rfid-vs-barcode.html
17. Harland Simon Company, “RFID Tagging Technology”[Online document], [Accessed on
July 15, 2010], Available HTTP: http://www.harlandsimon.co.uk/RF_Tags.php
18. UNEEDRFID.com, “How does RFID tag technology works” ”[Online document], [Accessed
on April 14, 2012], Available HTTP: http://www.scienceprog.com/how-does-rfid-tag-
technology-works/
19. Spirit Data Capture Ltm, “RFID Technology”[Online document], [Accessed on April 30,
2012], Availble HTTP: http://www.spiritdatacapture.co.uk/rfid.asp
20. rifid-handbook.com, “Types of RFID” [Online document], Nov 14 2009, [Accessed on April
14, 2012], Available HTTP: http://www.rfid-handbook.de/rfid/types_of_rfid.html

58
21. SkyRFID Inc. , “RFID Reader Antenna Tutorial - What you need to know”, [Online
document], [Accessed on April 14, 2012], Available HTTP:
http://www.skyrfid.com/RFID_Antenna_Tutorial.php
22. Dealnay.com, “Palm Size High Power Wireless 802.11 N/G 300Mbps MIMO USB WLAN
Network Adapter with 2 high gain antennas $27.95”, [Online document], [Accessed on April
14, 2012], Available HTTP: http://dealnay.com/208471/bat-palm-high-power-500mw-
802.11bgn-wireless-usb-adapter-with-2-antennas.html
23. RFID Tribe, “Dual dipole antenna” , [Online document], [Accessed on April 14, 2012],
Available HTTP:
http://www.rfidtribe.com/index.php?option=com_content&view=article&id=169:dual-dipole-
antenna&catid=27:d&Itemid=99
24. Wikipedia.org, “Monostatic radar”, Online document], [Accessed on April 14, 2012],
Available HTTP: http://en.wikipedia.org/wiki/Monostatic_radar
25. Wikipedia.org, “Bistatic radar”, [Online document], [Accessed on April 14, 2012], Available
HTTP: http://en.wikipedia.org/wiki/Bistatic_radar#Specific_classes_of_bistatic_radar
26. Impinj company, “About RFID”, [Online document], [Accessed on April 14, 2012],
Available HTTP: http://www.impinj.com/About_RFID/About_RFID.aspx
27. BARCAMP ABIDJAN company, “HOW DO I MAKE A RFID READER ANTENNA FOR
13.56MHZ AND HOW DO I TUNE IT? WHAT WOULD BE THE BEST MATERIAL FOR
IT?” [ Online document], [Accessed on July 23, 2010], Available HTTP:
http://www.barcampabidjan.info/how-do-i-make-a-rfid-reader-antenna-for-13-56mhz-and-
how-do-i-tune-itwhat-would-be-the-best-material-for-it.html
28. AVERY DENNISON company, “RFID FAQs, What is the difference between an inlay and a
label?”, [ Online document], [ Accessed 2010 July 23], Available HTTP:
http://www.rfid.averydennison.com/faq.php
29. PCMAG.com, “RFID Inlay”, [Online document], [Accessed on April 14, 2012], Available
HTTP: http://www.pcmag.com/encyclopedia_term/0,2542,t=RFID+inlay&i=56950,00.asp
30. Alibaba.com, “RFID Dry Inlay”, [Online document], [Accessed on April 14, 2012], Available
HTTP: http://xingeshan.en.alibaba.com/product/328589816-
209717227/RFID_dry_inlay.html?tracelog=cgsotherproduct1
31. skyRFID.com, “RFID Tag Inlays”, [Online document], [Accessed on April 14, 2012],
Available HTTP: http://www.skyrfid.com/RFID_Tag_Inlays.php
32. Voice of American, Japan Tsunami Damage Cost Could Top $300 Billion, March 25, 2011,
[Online document], [Accessed on April 14, 2012], Available HTTP:
http://www.voanews.com/english/news/asia/east-pacific/Japan-Tsunami-Estimated-Costliest-
Ever-Disaster-118644489.html
33. Hauden, D., Jaillet, G., Coquerel, R., Temperature Sensor Using SAW Delay Line,
Ultrasonics Symposium, pages 148 – 151, 1981
34. Jing Li, Yijiang Lu, Qi Ye, Martin Cinke, Jie Han, and M. Meyyappan, Carbon Nanotube
Sensors for Gas and Organic Vapor Detection, Nano Letters, 2003, 3 (7), pp 929–933
35. Reindl, L.M, Shrena, I.M., Wireless measurement of temperature using surface acoustic
waves sensors, Ultrasonics, Ferroelectrics and Frequency Control, IEEE Transactions on,
Volume: 51 Issue:11, page 1457 – 1463, Nov. 2004
36. Calusdian, J., Xiaoping Yun, Jing Li, Yijiang Lu, Meyyappan, M., Design and Testing of a
Wireless Portable Carbon Nanotube-Based Chemical Sensor System, Nanotechnology, 2006.
IEEE-NANO 2006. Sixth IEEE Conference on, page(s): 794 – 797, June 2006
37. ODIN inc. RFID pricing guide
38. Chi-Yen Shen, Chun-Pu Huang, Wang-Tsung Huang, “The detection properties of ammonia
SAW gas sensors based on L-glutamic acid hydrochloride”, Ultrasonics, Ferroelectrics and
Frequency Control, Oct. 2005, Volume 52 Issue 10, page 1877 – 1880
39. J. Hlavay and G. G. Guilbault, “Detection of ammonia in ambient air with coated
piezoelectric crystal detector,” Anal. Chem.,vol. 50, pp. 1044–1046, 1978
40. C. S. I. Lai, G. L. Moody, and J. D. R. Thomas, “Piezoelectric quartz crystal detection of
ammonia,” Anal. Proc., vol. 22, pp.11–13, 1985.

59
41. Bill Drafts, Microsensor Systems Inc, “Acoustic Wave Technology Sensors“, Oct. 1, 2000,
[Online document], [Accessed on April 14, 2012], Available HTTP:
http://www.sensorsmag.com/sensors/acoustic-ultrasound/acoustic-wave-technology-sensors-
936
42. White RM, Voltmer FW (1965) Appl Phys Lett 7:314–316
43. F. L. Dickert, P. Forth, W. E. Bulst, G. Fischerauer, U. Knauer, “SAW and QMB for
chemical sensing”, Frequency Control Symposium, 1997, Proceedings of the 1997 IEEE
International, page 120 – 123
44. K.Bodenhöfer, A. Hierlemann,* G. Noetzel, U. Weimar, and W. Göpel, “Performances of
Mass-Sensitive Devices for Gas Sensing: Thickness Shear Mode and Surface Acoustic Wave
Transducers”, Anal. Chem., 1996, 68 (13), pp 2210–2218
45. Susan l. Hietala, Vincent M. Hietala, C. Jeffrey brinker, “Dual SAW sensor technique for
determining mass and modulus changes”, Ultrasonics, Ferroelectrics and Frequency Control,
IEEE Transactions on, Volume 48 Issue1, page 262 – 267
46. A.C. Fechete, W. Wlodarski, K. Kalantar-Zadeh, A.S. Holland, J. Antoszewski, S. Kaciulis,
L.Pandolfi, “SAW-based gas sensors with rf sputtered InOx and PECVD SiNx films:
Response to H2 and O3 gases”, Sensors and Actuators B: Chemical, Volume 118, Issues 1-2,
25 October 2006, Pages 362-367,
47. Wen Wang, “Wireless surface acoustic wave chemical sensor for simultaneous measurement
of CO2 and humidity”, J. Micro/Nanolith. MEMS MOEMS, Vol. 8, 031306 (2009);
doi:10.1117/1.3158610
48. C Caliendoy, P Verardiy, E Veronay, A D’Amicoz, C Di Natalez, G Saggioz, M Serafiniz, R
Paolessex and S E Huqk, “Advances in SAW-based gas sensors”, Smart Mater. Struct. 6
(1997) 689–699.
49. S. Iijima, Nature 354 (1991) 56.
50. S. Iijima, T. Ichihashi, Nature 363 (1993) 603.
51. N. Li, J. Wang, M. Li, Rev. Anal. Chem. 2003, 22, 19.
52. Andrew R. Barron,, “ Carbon Nanomaterials”, [Online document], [Accessed on April 14,
2012], Available HTTP: http://cnx.org/content/m22580/latest/
A. Koshio, M. Yudasaka, M. Zhang, S. Iijima, Nano Lett. 1 (2001) 361.
53. R.R. Moore, C.E. Banks, R.G. Compton, Anal. Chem. 76 (2004) 2677.
54. Hanson, G.W., “Fundamental transmitting properties of carbon nanotube antennas”, Antennas
and Propagation, Nov. 2005, Volume : 53 , Issue:11 , page(s): 3426 – 3435
55. R. Rosen, W. Simendinger, C. Debbault, H. Shimoda, L. Fleming, B. Stoner, and O. Zhou,”
Application of carbon nanotubes as electrodes in gas discharge tubes”, Appl. Phys. Lett. 76,
1668 (2000); doi:10.1063/1.126130 (3 pages)
56. Kunjal Parikh, Kyle Cattanach, Rashmi Rao, Dong-Seok Suh, Aimei Wu and Sanjeev K.
Manohar , “Flexible vapour sensors using single walled carbon nanotubes”, Sensors and
Actuators B: Chemical, Volume 113, Issue 1, 17 January 2006, Pages 55-63
57. Keat Ghee Ong; Kefeng Zeng; Grimes, C.A., “A wireless, passive carbon nanotube-based gas
sensor”, Sensors Journal, IEEE, 2002 Apr, Volume 2 Issue 2, page 82 – 88
58. Huanjia Yang; Shuang-Hua Yang; ,“Connectionless indoor inventory tracking in Zigbee
RFID sensor network”, Industrial Electronics, 2009. IECON '09. 35th Annual Conference of
IEEE, 2009 Nov., page 2618 – 2623
59. Douglas R. Kauffman and Alexander Star, “Carbon Nanotube Gas and Vapor Sensors”,
Angew. Chem. Int. Ed. 2008, 47, 6550 – 6570
60. Tseng, S.P.; KuoYuan Hwa; I-Fan Chang; Wenlung Li; ,“An automatic RFID and
wireless sensing system on a GHS-based Hazardous Chemicals Management platform”,
Embedded and Multimedia Computing, 2009, page 1 - 6
61. Ivana Murkovic Steinberg, Matthew D. Steinberg, “Radio-frequency tag with optoelectronic
interface for distributed wireless chemical and biological sensor applications”, Sensors and
Actuators B: Chemical, Volume 138, Issue 1, 24 April 2009, Pages 120-125
62. Radislav A. Potyrailo, "Development of radio-frequency identification sensors based on
organic electronic sensing materials for selective detection of toxic vapors", J. Appl. Phys.
106, 124902 (2009); doi:10.1063/1.3247069

60
63. Radislav A. Potyrailo, Henri Mouquin, William G.Morris, “Position-independent chemical
quantitation with passive 13.56MHz radio frequency identification(RFID) sensors”, Talanta
Volume 75, Issue 3, 15 May 2008, Pages 624-628
64. Jari-Pascal Curty. Michel Declercy, Catherine Dehollain, Norbert joehl, “Design and
optimization of passive UHF RFID systems”, page 43,Springer, 2007, ISBN 0-387-35274-0
65. Christophe Caloz and Tatsuo Ithoh, “Electromagnetic metamaterials: transmission line theory
and microwave applications: the engineering approach” , John Wiley and Sons Inc, 2006,
ISBN: 978-0-471-66985-2, Page 114
66. John S. Seybold, “Introduction to RF propagation”, John Wiley and Sons, 2005, ISBN 978-0-
471-65596-1, Page 58 and Page 180
67. Christophe Caloz and Tatsuo Ithoh, “Electromagnetic metamaterials: transmission line theory
and microwave applications: the engineering approach” , John Wiley and Sons Inc, 2006,
ISBN: 978-0-471-66985-2, Page 114
68. J. W. CRISPIN, JR., AND A. L. MAFFETT, “Radar Cross-Section Estimation for Simple
Shapes”, Proceedings of the IEEE, Volume 53 Issue:8, Aug. 1965, Page 833 – 848
69. Lingfei Mo, Hongjian Zhang, “RFID Antenna Near the Surface of Metal,” IEEE International
Symposium on Microwave, Antenna, Propagation, and EMC Technologies For Wireless
Communications, pp. 803–806, August 2007.
70. Leena Ukkonen, Lauri Sydänheimo, Markku Kivikoski, “Effects of Metallic Plate Size on the
Performance of Microstrip Patch-Type Tag Antennas for Passive RFID,” Antennas and
Wireless Propagation Letters, vol. 4, pp. 410–413, 2005.