characterization and evaluation of the probiotic
TRANSCRIPT

University of Nebraska - LincolnDigitalCommons@University of Nebraska - LincolnDissertations, Theses, & Student Research in FoodScience and Technology Food Science and Technology Department
5-2019
Characterization and Evaluation of the ProbioticProperties of the Sporeforming Bacteria, Bacilluscoagulans Unique IS-2Amy GarrisonUniversity of Nebraska-Lincoln, [email protected]
Follow this and additional works at: https://digitalcommons.unl.edu/foodscidiss
Part of the Dietetics and Clinical Nutrition Commons, Food Microbiology Commons, and theOther Food Science Commons
This Article is brought to you for free and open access by the Food Science and Technology Department at DigitalCommons@University of Nebraska -Lincoln. It has been accepted for inclusion in Dissertations, Theses, & Student Research in Food Science and Technology by an authorizedadministrator of DigitalCommons@University of Nebraska - Lincoln.
Garrison, Amy, "Characterization and Evaluation of the Probiotic Properties of the Sporeforming Bacteria, Bacillus coagulans UniqueIS-2" (2019). Dissertations, Theses, & Student Research in Food Science and Technology. 99.https://digitalcommons.unl.edu/foodscidiss/99
Characterization and Evaluation of the Probiotic Properties of the Sporeforming Bacteria,
Bacillus coagulans Unique IS-2
By
Amy Garrison
A THESIS
Presented to the Faculty of
The Graduate College at the University of Nebraska
In Partial Fulfillment of Requirements
For the Degree of Master of Science
Major: Food Science and Technology
Under the Supervision of Professor Andreia Bianchini
Lincoln, Nebraska
May, 2019

Characterization and Evaluation of the Probiotic Properties of the Sporeforming Bacteria,
Bacillus coagulans Unique IS-2
Amy Garrison, M.S.
University of Nebraska, 2019
Advisor: Andreia Bianchini
Probiotics are live organisms, that when consumed in adequate amounts, confer a health
benefit to the host. To achieve probiotic status, each potential strain’s functional
properties and their safety to the consumer must be comprehensively evaluated.
Probiotic effects have been observed to be strain specific, therefore each new strain of
interest must be characterized according to their phenotypic and genetic characteristics.
There is a list of characteristics that potential probiotic strains should have to be
considered as a probiotic. Potential probiotic strains should be evaluated for their acid
and bile salt resistance, antimicrobial activity and adherence and colonization to intestinal
cells in the lower gastrointestinal tract. Additionally, those that may be used as additives
to food products should be evaluated for their survival during processing and storage of
those products.
The most common, and most researched, probiotic strains belong to the Lactobacillus and
Bifidobacterium genera. However, there have been many reports of low viability of these
strains in the delivery product by the end of the shelf life. This can cause problems as
there is a desired level of probiotics that needs to be consumed to promote health benefits
on the host. This problem has led the probiotic industry to research the probiotic
properties of sporeforming organisms. Spores are dormant structures that are more

resistant to heat, cold, acidity and desiccation. This inherent protection could help
improve the survival of the organism in the product and through transit of the
gastrointestinal tract.
Bacillus coagulans is a Gram positive, lactic acid producing, facultative anaerobe and
sporeforming bacteria strain that is drawing the attention of the probiotic industry. While
research is still limited on this organism, there have been studies showing improvement
of irritable bowel syndrome, Clostridium difficile induced colitis, rheumatoid arthritis and
major depressive disorders associated with irritable bowel syndrome. Additionally,
reports have shown the ability of Bacillus spores to reach and germinate in the gut, which
is an important characteristic of potential probiotic strains. The purpose of this research
is to evaluate the probiotic properties of the commercial Bacillus coagulans Unique IS-2,
for its potential inclusion in food products.

iv
To my cat, Pebbles, who entered my life the day before I started graduate school and was
there every morning to wake me up when I didn’t want to get out of bed and who was
always right on the other side of the door to greet me when I came home. All my love.

v
ACKNOWLEDGEMENTS
I would like to thank my advisor, Dr. Andreia Bianchini, and my co-advisor, Dr. Jayne
Stratton, as well as my final committee member, Dr. Robert Hutkins for all of their
thoughts, advice and support while working through my project. I appreciate all the time
you all set aside to help me succeed in this program.
I would also like to thank all my lab mates for helping me solve problems, supporting me
in my project, and sharing laughs while working long hours in the lab. I would like to
show my appreciate to my funding source, the Midwest Dairy Association, for their
economic support.
Finally, I would like to give all my thanks to my parents, Marilee and John Garrison, as
well as my brother, Kenny, for their continuous support throughout my entire program. I
would not have been able to get through this without their love and support.

vi
TABLE OF CONTENTS LIST OF TABLES ....................................................................................................... viii LIST OF FIGURES ....................................................................................................... ix CHAPTER 1: LITERATURE REVIEW ......................................................................... 1
1.1. Probiotics ................................................................................................. 2 1.2. Microorganisms Used as Probiotics .......................................................... 3 1.3. Sporeforming Bacteria Used as Probiotics ................................................ 5
1.3.1. Lactobacillus sporogenes .............................................................. 9 1.3.2. Bacillus coagulans Used as Probiotics ........................................ 10
1.4. Probiotic Properties ................................................................................ 11 1.4.1. Acid and Bile Tolerance ............................................................ 13 1.4.2. Germination in the Gut ............................................................... 14 1.4.3. Thermal Resistance During Processing ....................................... 16 1.4.4. Survival/Stability During Shelf Life ........................................... 16
1.5. Products That Contain Bacillus coagulans ............................................. 17 1.6. References ............................................................................................. 18
CHAPTER 2: CHARACTERIZATION OF BACILLUS COAGULANS Unique IS-2 ..... 27
2.1. Introduction ........................................................................................... 28 2.2. Materials and Methods ........................................................................... 31
2.2.1. Preparation of Frozen Stocks ...................................................... 31 2.2.2. Catalase Test .............................................................................. 32 2.2.3. Oxidase Test ............................................................................... 32 2.2.4. Indole Test ................................................................................. 32 2.2.5. Gelatin Hydrolysis ...................................................................... 33 2.2.6. Gram Stain ................................................................................. 33 2.2.7. API 50CH................................................................................... 33 2.2.8. Phylogenetic Tree ....................................................................... 34 2.2.9. Thermal D-Values ...................................................................... 34 2.2.10. Statistical Analysis ..................................................................... 35
2.3. Results and Discussion ........................................................................... 36 2.3.1. Biochemical Tests ...................................................................... 36 2.3.2. Thermal D-Values ...................................................................... 42
2.4. Conclusion ............................................................................................. 49 2.5. References ............................................................................................. 51
CHAPTER 3: SURVIVAL AND GERMINATION OF BACILLUS COAGULANS UNIQUE IS-2 IN THE GASTROINTESTINAL TRACT ............................................. 56
3.1. Introduction ........................................................................................... 57 3.2. Materials and Methods ........................................................................... 60
3.2.1. Bacterial Cultures ....................................................................... 60 3.2.2. In vitro Stomach pH and Bile Salts Stability ............................... 60 3.2.3. In vitro Digestion........................................................................ 61 3.2.4. Statistical Analysis ..................................................................... 64
3.3. Results and Discussion ........................................................................... 64

vii
3.3.1. In vitro Stomach pH and Bile Salts Stability ............................... 64 3.3.2. In vitro Digestion........................................................................ 67
3.4. Conclusion ............................................................................................. 70 3.5. References ............................................................................................. 71
CHAPTER 4: EVALUATION OF STABILITY OF BACILLUS COAGULANS UNIQUE IS-2 IN FOOD PRODUCTS ......................................................................................... 77
4.1. Introduction ........................................................................................... 78 4.2. Materials and Methods ........................................................................... 81
4.2.1. Bacterial Cultures ....................................................................... 81 4.2.2. Viability of B. coagulans During Storage at Different pHs ......... 82 4.2.3. Viability of B. coagulans Spores and Product Stability During
Product Shelf Life ...................................................................... 83 4.2.4. Statistical Analysis ..................................................................... 85
4.3. Results and Discussion ........................................................................... 85 4.3.1. Viability of B. coagulans Unique IS-2 during storage at 4˚C in
broth at different pH levels ......................................................... 85 4.3.2. Viability of B. coagulans Unique IS-2 Storage at 25˚C in broths at
different pH Levels ..................................................................... 88 4.3.3. Quality Evaluation of Products Added with Bacillus coagulans
Unique IS-2 ................................................................................ 90 4.3.3.1. Milk ............................................................................ 91 4.3.3.2. Buttermilk ................................................................... 94 4.3.3.3. Ensure® Protein Shake ............................................... 96 4.3.3.4. Drinkable Yogurt ........................................................ 98
4.4. Conclusion ........................................................................................... 100 4.5. References ........................................................................................... 103
Appendix A................................................................................................................. 110

viii
LIST OF TABLES
CHAPTER 2.
Table 1. Biochemical Test Results for Bacillus coagulans Unique IS-2 ......................... 38
Table 2. API 50CH Results for Bacillus coagulans Unique IS-2 .................................... 41
Table 3. Summary of D-Values for each Temperature/Matrix Combination and Linear
Regression Lines with R2 Values ................................................................................... 48
CHAPTER 3.
Table 4. Summary of Bacillus coagulans Unique IS-2 Survival in Acid and Bile Salts .. 66
Table 5. Percentage of Bacillus coagulans Unique IS-2 spore germination in each of the
fecal slurries under evaluation ....................................................................................... 69
CHAPTER 4.
Table 6. Quality characteristics of milk added with B. coagulans Unique IS-2 evaluated
over a 21-day shelf life at 4˚C ....................................................................................... 94
Table 7. Quality characteristics of buttermilk added with B. coagulans Unique IS-2
evaluated over a 30-day shelf life at 4˚C ........................................................................ 96
Table 8. Quality characteristics of Ensure® protein shake added with B. coagulans
Unique IS-2 evaluated over a 90-day shelf life at 4˚C .................................................... 98
Table 9. Quality characteristics of drinkable yogurt added with B. coagulans Unique IS-2
evaluated over a 90-day shelf life at 4˚C ...................................................................... 100

ix
LIST OF FIGURES
CHAPTER 1.
Figure 1. Spore formation process. Adapted from Henriques & Moran, Jr. (2007) ........... 6
Figure 2. Outline of a Bacillus spore. Adapted from Setlow (2014) ................................. 7
CHAPTER 2.
Figure 3. Phylogenetic tree using the maximum likelihood method of analysis for 16S
sequences ...................................................................................................................... 37
Figure 4. Gram Stains of Bacillus coagulans Unique IS-2 ............................................. 39
Figure 5. Survival Curves for Bacillus coagulans Unique IS-2 spores in Phosphate
Buffered Solution when treated at 90, 110, and 125˚C ................................................... 45
Figure 6. Survival Curves for Bacillus coagulans Unique IS-2 spores in Skim Milk when
treated at 90, 110, and 125˚C ......................................................................................... 45
Figure 7. Survival Curves for Bacillus coagulans Unique IS-2 spores in Whole Milk
when treated at 90, 110, and 125˚C ............................................................................... 46
Figure 8. Survival Curves for Bacillus coagulans Unique IS-2 spores in Drinkable Yogurt
when treated at 90, 110, and 125˚C ............................................................................... 46
Figure 9. Thermal Death Curves .................................................................................... 48
CHAPTER 3.
Figure 10. Diagram describing the experiments used to determine the amount of B.
coagulans Unique IS-2 that may germinate under colonic conditions ............................ 63

x
Figure 11. Acid and Bile Salts Tolerance of Bacillus coagulans Unique IS-2 spores over
4 hours at 37˚C .............................................................................................................. 65
Figure 12. Bacillus coagulans Unique IS-2 survival in in vitro gut environment ............ 68
CHAPTER 4.
Figure 13. Stability of Bacillus coagulans Unique IS-2 in broth with pH adjusted to pH
5.0 with LA at 4˚C for 4 months of storage ................................................................... 86
Figure 14. Stability of Bacillus coagulans Unique IS-2 in broth with pH adjusted to pH
5.0 with LA at 25˚C for 30 days of storage .................................................................... 88
Figure 15. Stability of Bacillus coagulans Unique IS-2 in milk at 4˚C for 21 days of
storage .......................................................................................................................... 92
Figure 16. Stability of Bacillus coagulans Unique IS-2 in buttermilk at 4˚C for 30 days of
storage .......................................................................................................................... 95
Figure 17. Stability of Bacillus coagulans Unique IS-2 in Ensure® protein shake at 4˚C
for 90 days of storage .................................................................................................... 97
Figure 18. Stability of Bacillus coagulans Unique IS-2 in drinkable yogurt at 4˚C for 90
days of storage .............................................................................................................. 99
APPENDIX A.
Figure 19. Stability of Bacillus coagulans Unique IS-2 in broth with pH adjusted to pH
3.0 with HCl at 4˚C for 120 days of storage ................................................................. 111
Figure 20. Stability of Bacillus coagulans Unique IS-2 in broth with pH adjusted to pH
3.5 with HCl at 4˚C for 120 days of storage ................................................................. 111

xi
Figure 21. Stability of Bacillus coagulans Unique IS-2 in broth with pH adjusted to pH
4.0 with HCl at 4˚C for 120 days of storage ................................................................. 112
Figure 22. Stability of Bacillus coagulans Unique IS-2 in broth with pH adjusted to pH
4.5 with HCl at 4˚C for 120 days of storage ................................................................. 112
Figure 23. Stability of Bacillus coagulans Unique IS-2 in broth with pH adjusted to pH
5.0 with HCl at 4˚C for 120 days of storage ................................................................. 113
Figure 24. Stability of Bacillus coagulans Unique IS-2 in broth with pH adjusted to pH
5.5 with HCl at 4˚C for 120 days of storage ................................................................. 113
Figure 25. Stability of Bacillus coagulans Unique IS-2 in broth with pH adjusted to pH
6.0 with HCl at 4˚C for 120 days of storage ................................................................. 114
Figure 26. Stability of Bacillus coagulans Unique IS-2 in broth with pH adjusted to pH
6.5 with HCl at 4˚C for 120 days of storage ................................................................. 114
Figure 27. Stability of Bacillus coagulans Unique IS-2 in broth with pH adjusted to pH
8.0 with NaOH at 4˚C for 120 days of storage ............................................................. 115
Figure 28. Stability of Bacillus coagulans Unique IS-2 in broth with pH adjusted to pH
3.0 with LA at 4˚C for 4 months of storage ................................................................. 115
Figure 29. Stability of Bacillus coagulans Unique IS-2 in broth with pH adjusted to pH
3.5 with LA at 4˚C for 4 months of storage ................................................................. 116
Figure 30. Stability of Bacillus coagulans Unique IS-2 in broth with pH adjusted to pH
4.0 with LA at 4˚C for 4 months of storage ................................................................. 116
Figure 31. Stability of Bacillus coagulans Unique IS-2 in broth with pH adjusted to pH
4.5 with LA at 4˚C for 4 months of storage ................................................................. 117

xii
Figure 32. Stability of Bacillus coagulans Unique IS-2 in broth with pH adjusted to pH
5.0 with LA at 4˚C for 4 months of storage ................................................................. 117
Figure 33. Stability of Bacillus coagulans Unique IS-2 in broth with pH adjusted to pH
5.5 with LA at 4˚C for 4 months of storage ................................................................. 118
Figure 34. Stability of Bacillus coagulans Unique IS-2 in broth with pH adjusted to pH
6.0 with LA at 4˚C for 4 months of storage ................................................................. 118
Figure 35. Stability of Bacillus coagulans Unique IS-2 in broth with pH adjusted to pH
6.5 with LA at 4˚C for 4 months of storage ................................................................. 119
Figure 36. Stability of Bacillus coagulans Unique IS-2 in broth with pH adjusted to pH
3.0 with AA at 4˚C for 4 months of storage ................................................................. 119
Figure 37. Stability of Bacillus coagulans Unique IS-2 in broth with pH adjusted to pH
3.5 with AA at 4˚C for 4 months of storage ................................................................. 120
Figure 38. Stability of Bacillus coagulans Unique IS-2 in broth with pH adjusted to pH
4.0 with AA at 4˚C for 4 months of storage ................................................................. 120
Figure 39. Stability of Bacillus coagulans Unique IS-2 in broth with pH adjusted to pH
4.5 with AA at 4˚C for 4 months of storage ................................................................. 121
Figure 40. Stability of Bacillus coagulans Unique IS-2 in broth with pH adjusted to pH
5.0 with AA at 4˚C for 4 months of storage ................................................................. 121
Figure 41. Stability of Bacillus coagulans Unique IS-2 in broth with pH adjusted to pH
5.5 with AA at 4˚C for 4 months of storage ................................................................. 122
Figure 42. Stability of Bacillus coagulans Unique IS-2 in broth with pH adjusted to pH
6.0 with AA at 4˚C for 4 months of storage ................................................................. 122
xiii
Figure 43. Stability of Bacillus coagulans Unique IS-2 in broth with pH adjusted to pH
6.5 with AA at 4˚C for 4 months of storage ................................................................. 123
Figure 44. Stability of Bacillus coagulans Unique IS-2 in broth with pH adjusted to pH
3.0 with CA at 4˚C for 4 months of storage ................................................................. 123
Figure 45. Stability of Bacillus coagulans Unique IS-2 in broth with pH adjusted to pH
3.5 with CA at 4˚C for 4 months of storage ................................................................. 124
Figure 46. Stability of Bacillus coagulans Unique IS-2 in broth with pH adjusted to pH
4.0 with CA at 4˚C for 4 months of storage ................................................................. 124
Figure 47. Stability of Bacillus coagulans Unique IS-2 in broth with pH adjusted to pH
4.5 with CA at 4˚C for 4 months of storage ................................................................. 125
Figure 48. Stability of Bacillus coagulans Unique IS-2 in broth with pH adjusted to pH
5.0 with CA at 4˚C for 4 months of storage ................................................................. 125
Figure 49. Stability of Bacillus coagulans Unique IS-2 in broth with pH adjusted to pH
5.5 with CA at 4˚C for 4 months of storage ................................................................. 126
Figure 50. Stability of Bacillus coagulans Unique IS-2 in broth with pH adjusted to pH
6.0 with CA at 4˚C for 4 months of storage ................................................................. 126
Figure 51. Stability of Bacillus coagulans Unique IS-2 in broth with pH adjusted to pH
6.5 with CA at 4˚C for 4 months of storage ................................................................. 127
Figure 52. Stability of Bacillus coagulans Unique IS-2 in broth with pH adjusted to pH
3.0 with HCl at 25˚C for 30 days of storage ................................................................. 127
Figure 53. Stability of Bacillus coagulans Unique IS-2 in broth with pH adjusted to pH
3.5 with HCl at 25˚C for 30 days of storage ................................................................. 128

xiv
Figure 54. Stability of Bacillus coagulans Unique IS-2 in broth with pH adjusted to pH
4.0 with HCl at 25˚C for 30 days of storage ................................................................. 128
Figure 55. Stability of Bacillus coagulans Unique IS-2 in broth with pH adjusted to pH
4.5 with HCl at 25˚C for 30 days of storage ................................................................. 129
Figure 56. Stability of Bacillus coagulans Unique IS-2 in broth with pH adjusted to pH
5.0 with HCl at 25˚C for 30 days of storage ................................................................. 129
Figure 57. Stability of Bacillus coagulans Unique IS-2 in broth with pH adjusted to pH
5.5 with HCl at 25˚C for 30 days of storage ................................................................. 130
Figure 58. Stability of Bacillus coagulans Unique IS-2 in broth with pH adjusted to pH
6.0 with HCl at 25˚C for 30 days of storage ................................................................. 130
Figure 59. Stability of Bacillus coagulans Unique IS-2 in broth with pH adjusted to pH
6.5 with HCl at 25˚C for 30 days of storage ................................................................. 131
Figure 60. Stability of Bacillus coagulans Unique IS-2 in broth with pH adjusted to pH
8.0 with NaOH at 25˚C for 30 days of storage ............................................................. 131
Figure 61. Stability of Bacillus coagulans Unique IS-2 in broth with pH adjusted to pH
3.0 with LA at 25˚C for 30 days of storage .................................................................. 132
Figure 62. Stability of Bacillus coagulans Unique IS-2 in broth with pH adjusted to pH
3.5 with LA at 25˚C for 30 days of storage .................................................................. 132
Figure 63. Stability of Bacillus coagulans Unique IS-2 in broth with pH adjusted to pH
4.0 with LA at 25˚C for 30 days of storage .................................................................. 133
Figure 64. Stability of Bacillus coagulans Unique IS-2 in broth with pH adjusted to pH
4.5 with LA at 25˚C for 30 days of storage .................................................................. 133

xv
Figure 65. Stability of Bacillus coagulans Unique IS-2 in broth with pH adjusted to pH
5.0 with LA at 25˚C for 30 days of storage .................................................................. 134
Figure 66. Stability of Bacillus coagulans Unique IS-2 in broth with pH adjusted to pH
5.5 with LA at 25˚C for 30 days of storage .................................................................. 134
Figure 67. Stability of Bacillus coagulans Unique IS-2 in broth with pH adjusted to pH
6.0 with LA at 25˚C for 30 days of storage .................................................................. 135
Figure 68. Stability of Bacillus coagulans Unique IS-2 in broth with pH adjusted to pH
6.5 with LA at 25˚C for 30 days of storage .................................................................. 135
Figure 69. Stability of Bacillus coagulans Unique IS-2 in broth with pH adjusted to pH
3.0 with AA at 25˚C for 30 days of storage ................................................................. 136
Figure 70. Stability of Bacillus coagulans Unique IS-2 in broth with pH adjusted to pH
3.5 with AA at 25˚C for 30 days of storage ................................................................. 136
Figure 71. Stability of Bacillus coagulans Unique IS-2 in broth with pH adjusted to pH
4.0 with AA at 25˚C for 30 days of storage ................................................................. 137
Figure 72. Stability of Bacillus coagulans Unique IS-2 in broth with pH adjusted to pH
4.5 with AA at 25˚C for 30 days of storage ................................................................. 137
Figure 73. Stability of Bacillus coagulans Unique IS-2 in broth with pH adjusted to pH
5.0 with AA at 25˚C for 30 days of storage ................................................................. 138
Figure 74. Stability of Bacillus coagulans Unique IS-2 in broth with pH adjusted to pH
5.5 with AA at 25˚C for 30 days of storage ................................................................. 138
Figure 75. Stability of Bacillus coagulans Unique IS-2 in broth with pH adjusted to pH
6.0 with AA at 25˚C for 30 days of storage ................................................................. 139

xvi
Figure 76. Stability of Bacillus coagulans Unique IS-2 in broth with pH adjusted to pH
6.5 with AA at 25˚C for 30 days of storage ................................................................. 139
Figure 77. Stability of Bacillus coagulans Unique IS-2 in broth with pH adjusted to pH
3.0 with CA at 25˚C for 30 days of storage .................................................................. 140
Figure 78. Stability of Bacillus coagulans Unique IS-2 in broth with pH adjusted to pH
3.5 with CA at 25˚C for 30 days of storage .................................................................. 140
Figure 79. Stability of Bacillus coagulans Unique IS-2 in broth with pH adjusted to pH
4.0 with CA at 25˚C for 30 days of storage .................................................................. 141
Figure 80. Stability of Bacillus coagulans Unique IS-2 in broth with pH adjusted to pH
4.5 with CA at 25˚C for 30 days of storage .................................................................. 141
Figure 81. Stability of Bacillus coagulans Unique IS-2 in broth with pH adjusted to pH
5.0 with CA at 25˚C for 30 days of storage .................................................................. 142
Figure 82. Stability of Bacillus coagulans Unique IS-2 in broth with pH adjusted to pH
5.5 with CA at 25˚C for 30 days of storage .................................................................. 142
Figure 83. Stability of Bacillus coagulans Unique IS-2 in broth with pH adjusted to pH
6.0 with CA at 25˚C for 30 days of storage .................................................................. 143
Figure 84. Stability of Bacillus coagulans Unique IS-2 in broth with pH adjusted to pH
6.5 with CA at 25˚C for 30 days of storage .................................................................. 143

1
CHAPTER 1: LITERATURE REVIEW

2
1.1. Probiotics
Throughout the past century, food market trends have been driven by consumers desire
for healthier foods. This had led to the exponential increase in new products on the shelf
boasting health benefits to the consumer. The concept of health benefiting foods has
been coined functional foods. These are foods consumed as part of the everyday diet that
provides beneficial effects on human health, such as reducing cholesterol or high blood
pressure (Charalampopoulos, Wang, Pandiella, & Webb, 2002). Foods can be found
under the umbrella term, known as functional foods, through the addition of synthesized
food ingredients, naturally occurring bioactive substances, or added bioactive substances
(Grajek, Olejnik, & Sip, 2005). Probiotics are among the most commonly added
substances to produce functional foods. This has led to a significant increase in research
on probiotic organisms and their effects on the human body. Currently probiotics are
being sold as dietary supplements, as inclusions into food products and as skin creams.
While dietary supplements and skin creams are popular uses of probiotics, this report
focuses on probiotics as inclusions into food products.
The idea of probiotics originated from over 100 years ago when Döderlein and
Metchnikoff claimed lactic acid producing bacteria would produce health benefits when
consumed (De Vecchi & Drago, 2006). This discovery motivated scientists to conduct
further research on the health promoting properties of microorganisms after consumption.
This led to an industry that has flourished for probiotics through increasing market share
every year. In 2017, the probiotic market was over $1.8 billion USD and the food and
beverage sector, as the largest sector, was greater than $125 million USD (Ahuja & Deb,
3
2018). By 2024, the food and beverage sector is expected to increase by 6.5% (Ahuja &
Deb, 2018).
Currently, the most widely used definition of probiotics is “live microorganisms that,
when administered in adequate amounts, confer a health benefit on the host” (Hill et al.,
2014). While there is no official intake level for foods, it is generally accepted that
probiotics should be consumed at a level between 107-109 CFU/g of product to ensure the
health benefits (Ashraf & Shah, 2011; Konuray & Erginkaya, 2018). Dietary probiotic
health benefits are achieved by the arrival of the probiotic to the gut, where they
positively impact the natural gut microbiota by increasing the growth of good bacteria
and hindering the growth of undesirable or pathogenic bacteria (Sanders, 2003). Thus,
potential probiotic strains must be evaluated for specific characteristics before their use in
functional foods. Orally consumed probiotics therefore must survive transit through the
digestive tract until they reach the colon, which is the target organ. For a strain to be
considered a probiotic, it should be proven safe for human consumption. must survive
reaching the target organ by having acid and bile tolerance, and be able to grow and
colonize in the gut to promote health benefits (Gotcheva et al., 2002).
1.2. Microorganisms Used as Probiotics
The most common microorganisms used as probiotics are Lactic Acid Bacteria (LAB),
with the majority belonging to the Lactobacillus or Bifidobacterium genera. Less
commonly used probiotics belong to the genera of Lactococcus, Pediococcus,
Leuconostoc, and Streptococcus. More recently, there are also non-lactic acid bacteria

4
being used as probiotics from the genera Bacillus, Saccharomyces, Clostridium and even
from the Gram negative Escherichia coli (Foligné, Daniel, & Pot, 2013).
Traditionally, LAB strains are Gram positive rods, anaerobe or facultative, catalase
negative, non-motile and non sporeforming (Song, Ibrahim, & Hayek, 2012). These
strains also produce health benefiting substances such as lactic acid, hydrogen peroxide,
antimicrobials and/or other bacteriocins in order to be competitive and interact with the
host microbiota (Holzapfel, Haberer, Geisen, & Schillinger, 2001). For functional food
products, Lactobacillus and Bifidobacterium are included in refrigerated products such as
yogurt, milk, and cheeses. Refrigerated products are commonly used to deliver the
probiotic cultures due to the limited viability of these strains to survive in other products
and environments. Indeed, reports have shown that by the end of the shelf life, there is a
significantly decreased amount of viable probiotic cells left in a product compared to the
concentration expected to be present (Jayamanne & Adams, 2006; Shah, 2000).
The live and active nature of probiotic bacteria have led to issues of viability throughout
the shelf life of the product and passage through the digestive tract in high enough
numbers to reach the gut of the consumer. While probiotic strains are selected based on
their acid and bile tolerance, one of the solutions to increase the viability of cells is a
microencapsulation process. In an effort to extend the stability and shelf life of these
probiotics, encapsulation or freeze-drying processes have been used to protect the
bacteria during manufacturing, storage, and survival through the digestive tract until
arrival in the gut (Weinbreck, Bodnár, & Marco, 2010). The encapsulation process,

5
which is the most efficient method, uses food grade biopolymers to coat the probiotic
cells and has been proved to increase the viability of probiotics in some dairy products,
such as yogurt, ice cream and cheese (Annan, Borza, & Hansen, 2008; Kailasapathy,
2002; Martín, Lara-Villoslada, Ruiz, & Morales, 2015; Weinbreck et al., 2010).
Microencapsulated Lactobacillus acidophilus and Bifidobacterium spp survived better in
yogurt than free cells (Godward, 2000). Additionally, microencapsulated Lactobacilli,
Bifidobacterium bifidum, and Bifidobacterium infantis were observed to improve survival
by at least 40% in the freezing of ice milk for frozen desserts (Godward, 2000;
Kailasapathy, 2002). However, another study observed no significant difference between
the survival of microencapsulated Lactobacillus acidophilus, Bifidobacterium spp and the
free cells in ice cream during storage for 6 months at -20˚C (Godward, 2000). While
there has been improved viability, there is still much to be researched on new
technologies to improve the overall process (Martín et al., 2015). Therefore, having a
probiotic that already possesses the ability to survive processing conditions and transit
through the body, could help producers avoid an extra processing step and reduce their
production costs.
1.3. Sporeforming Bacteria Used as Probiotics
Spores are found universally in soils or water samples across multiple temperature
environments, have been associated with insects and animals and these spores associated
with insects or animals have been shown to germinate, grow and then sporulate inside the
host animal (Cutting, Simon M., Ricca, 2014). Due to their presence in the environment,
it was generally determined that spores can be found in the gastrointestinal tract of insects

6
and animals due to the consumption of water, soil, air or food that contains the spores.
However, recent work has led to the theory that sporeforming bacteria may be able to
grow and interact within the gastrointestinal tract (Fakhry, Sorrentini, Ricca, De Felice, &
Baccigalupi, 2008).
Spores are formed as a survival response to harmful environments that vegetative cells
would not survive in. Sporeforming bacteria have the ability to sense their environment
and when unfavorable conditions are sensed, they can switch their metabolism over to the
formation of spores (Errington, 2003). The model organism for spore formation is
Bacillus subtilis, as it was the first reported genome of a spore forming organisms and
research has shown that the spore formation process is similar among all spore formers.
Sporulation begins with an asymmetric cell division where the smaller portion will
become the spore. The larger portion, called the mother cell, then engulfs the smaller
part and creates the outer protective layers of the spore (Figure 1).
Figure 1. Spore formation process starts with the asymmetric division between the mother cell (MS) and the forespore (FS). The MS then engulfs the forespore which is
when the formation of the spore layers can begin. Adapted from Henriques & Moran, Jr. (2007).
The main components of the spore (from the inside) are the core (condensed
chromosome), cortex layer (peptidoglycan), undercoat region and the protein rich inner
and the outer coat layers (Figure 2) (Cutting, 2011; Henriques & Moran, Jr., 2007).

7
Figure 2. Diagram of a Bacillus Spore. Sizes of the spore layers are not drawn to scale.
Adapted from Setlow (2014).
The spore is still a live cell, just in a dormant state, with almost no detectable metabolic
activity, and increased protection against extreme temperatures, UV radiation, oxidation,
and low water environments (Nicholson et al., 2003). Even in the low metabolic state,
the spore is constantly monitoring their environment for favorable growth conditions and
will respond by germinating when favorable growth conditions are detected. While the
process of germination is not completely understood, a germination factor, such as a
specific nutrient, may be needed to penetrate the spore coat in order to activate
germination receptors, which begins the process of increasing metabolic activity to shed
the spore coat and become vegetative cells again (Moir, 2006). These germination
factors vary between species and strains however, they are commonly amino acids,
sugars or purine nucleosides. For example, L-valine and L-alanine are germination
triggers for Bacillus subtilis (Atluri, Ragkousi, Cortezzo, & Setlow, 2006).

8
With the viability issues of traditional probiotic strains, there has been an increased
interest in the probiotic properties of Bacillus strains. Bacillus strains have created an
interest in the probiotic community due to their inherent ability to form spores, their
ability to produce antimicrobials, their normal prevalence in food products, and their
greater chance of survival through the gastrointestinal tract (Sorokulova, 2013). When in
their spore form, they are more resistant to extremes such as heat, cold, acidity, and
dryness, and can survive as a spore for a long time. The bacteria will stay as a spore until
it reaches an environment that is suitable for growth with adequate moisture, pH,
temperature and nutrients. Once the bacteria reaches a suitable environment the spore
will take in water and begin the germination process back to a more active vegetative
state (Setlow, 2014).
Bacillus species’ ability to form spores is a desirable trait to the probiotic industry as the
bacteria would have its own inherent protection. The spore is still a live culture and
when included in a product as a spore, the bacteria would be able to withstand harsh
processing environments and remain stable in the product as a spore throughout the shelf
life when held under the proper conditions. This could potentially extend the shelf life of
products as the probiotic level would stay at the desired content for a longer time
compared to traditional probiotics.
Sporeforming probiotics would therefore be consumed in the spore form, which would
help protect the bacteria during transit through the gastrointestinal tract prior to reaching
the gut. The spore would be resistant to the low pH of the stomach and bile salts of the

9
small intestine (Elshaghabee, Rokana, Gulhane, Sharma, & Panwar, 2017; Hyronimus,
Le Marrec, Sassi, & Deschamps, 2000; Spinosa et al., 2000). Thus, the spore would have
high survivability on its route to the gut where it would find a suitable environment and
begin the germination process (Cutting, 2011; Fakhry et al., 2008). A molecular method
observed Bacillus spores germinated in the jejunum of mice (Casula & Cutting, 2002).
Additionally, Bacillus clausii spores have been observed to survive and persist in the
human gut, with feces containing the spores for up to 12 days after consumption
(Ghelardi et al., 2015).
1.3.1. Lactobacillus sporogenes
Lactobacillus sporogenes was discovered by Horowitz-Wlassowa and Nowotelnow in
1933 (De Vecchi & Drago, 2006). Due to the environment in which it was found and its
properties, it closely resembled the Lactobacillus genus and was thus named
Lactobacillus sporogenes. As science progressed and identification of microorganisms
were improved upon, it was determined this microorganism was misclassified. Bergey’s
Manual of Determinative Bacteriology 8th edition, stated that any spore bearing rods that
produce lactic acid, are catalase positive, and are facultative anaerobes should be
classified as Bacillus (De Vecchi & Drago, 2006). Therefore, this species, due to its
spore forming capabilities, could not belong to the Lactobacillus genus and was then
reclassified as Bacillus sporogenes. More recently, it was discovered that B. sporogenes
had substantial similarity with B. coagulans and was reclassified as such.

10
1.3.2. Bacillus coagulans Used as Probiotics
Bacillus coagulans was first described in 1915 as a spoilage organism in canned milk and
was determined to be tolerant to acid and thermal conditions (De Clerck et al., 2004). It
is Gram positive, rod-shaped (singularly or in short chains), motile and can grow between
30-55˚C, with an optimal pH growth between 5.5 – 6.5. Bacillus coagulans has the
ability to form spores and is a facultative anaerobe (De Vecchi & Drago, 2006). It is also
one strain that has drawn the attention of the probiotic industry due to its sporeforming
abilities and potential probiotic properties.
Bacillus coagulans strains have been showed to have heterogeneous physiological
characteristics, leading to different names for similar strains, that sometimes requires
DNA analysis to discern how closely related they are (De Vecchi & Drago, 2006).
However, B. coagulans is the scientifically correct and accepted name though many
people are still misclassifying the organism as Lactobacillus sporogenes. One reason is
that Lactobacillus probiotics are natural residents of the gastrointestinal tract and have a
history of safe use, while Bacillus strains have not been as closely studied for safety.
Therefore, using the Lactobacillus name may help the probiotic industry reap the benefit
from the known safety of Lactobacillus strains to avoid questions around the lesser
studied safety of Bacillus coagulans, even though that is the scientifically correctly
identified name (De Vecchi & Drago, 2006; Drago & De Vecchi, 2009).
Bacillus coagulans has been evaluated for its probiotic properties in in vitro and in vivo
models. Studies have been used to observe its anti-inflammatory and immune-
11
modulating effects. Bacillus coagulans reduced inflammation by inhibited ROS
formation and reducing PMN cell migration in in vitro experiments (Jensen, Benson,
Carter, & Endres, 2010). Additionally, B. coagulans was used to treat Clostridium
difficile in mice and it was found to improve stool consistency by improving the gut
mucosa barrier (Fitzpatrick, Small, Greene, Karpa, & Keller, 2011). Some strains of
Bacillus coagulans have been granted Generally Recognized as Safe (GRAS) status by
the U.S. Food and Drug Administration for its application in dairy products (Konuray &
Erginkaya, 2018). The protein rich spore coat helps protect B. coagulans from harsh
conditions, such as heat, cold, or dryness during processing conditions and the harsh acid
and bile conditions found in the upper digestive system during digestion (Hyronimus et
al., 2000). Then upon entry into the colon environment, conditions are much less harsh,
allowing for the spore to germinate and vegetative cells start to reproduce themselves
while initiating, which can interact with the gut microbiota (Song et al., 2012).
1.4. Probiotic Properties
As mentioned previously, the definition of probiotics is “live microorganisms that when
consumed in adequate amounts, confer a health benefit to the host” (Hill et al., 2014).
This definition is very broad to encompass the multiple strains of microorganisms used as
probiotics. Due to the broad definition, groups and industry have agreed upon a list of
properties that organisms should possess to be effective as a probiotic. In a joint meeting,
the Food and Agriculture Organization of the United Nations (FAO) and the World
Health Organization (WHO) outlined that probiotic effects have been found to be strain
specific, therefore each individual strain must be identified with the genus and species
12
and be tested for these effects to justify the claim of the health benefit associated with
them (Araya et al., 2002). In addition to the genus and species, the probiotic organism
must be completely characterized by studying toxin production, virulence factors,
antibiotic resistance and production and adherence or colonization of the gut (Anadón,
Rosa Martínez-Larrañaga, & Aranzazu Martínez, 2006; Gotcheva et al., 2002).
Health benefits arise by the arrival of the probiotic to the gut, where they positively
impact the natural gut microbiota by increasing the growth of good bacteria and
hindering the growth of undesirable or pathogenic bacteria (Sanders, 2003). Therefore,
potential probiotic strains must be evaluated for specific health benefits through in vitro
testing and then corroborated with in vivo animals and human studies (Araya et al.,
2002). Most probiotics are consumed orally therefore they must survive transit through
the digestive tract until they reach the colon. To confer a health benefit, probiotics
should be considered safe for human consumption and should be tested for their acid and
bile tolerance, adherence to intestinal cells, and potential antimicrobial activity to reduce
pathogenic bacteria (Araya et al., 2002; Drago & De Vecchi, 2009; Gotcheva et al.,
2002).
Probiotics strains that possess the above qualities in vitro should then be tested for their
safe consumption through in vivo testing in animal and human studies to determine if
they are able to produce a health benefit on the host (Araya et al., 2002). Additionally,
probiotic strains should be able to survive processing and remain stable during the shelf
life of the product.

13
1.4.1. Acid and Bile Tolerance
Bora et. al. (2009) evaluated the physiochemical properties of B. coagulans and found
that the pH of aqueous media affected the stability of the spores. Evaluation of the spores
between pH 1.2 and 8.0, showed there was close to a 20% decrease in viability of the B.
coagulans spores at the extreme acidic (pH 1.2) and alkaline (pH 8.0) conditions, with
the optimum stability at pH 6.8 (Bora et al., 2009). Majeed et al. (2016) evaluated
resistance to gastric acid of a different strain of B. coagulans and saw similar results in
the acidic region. There was no significant difference found between pH 3.0 to pH 8.0 in
spore count over 4 hours, conversely, the most acidic condition, pH 1.5, had a loss of 2.1
logs after 4 hours (Majeed, Nagabhushanam, Natarajan, Sivakumar, Eshuis-de Ruiter, et
al., 2016). Both of these studies show some decreased viability of B. coagulans spores at
low pH conditions, which may be similar to the stomach environment. However, in vivo
and in vitro experiments have shown that Bacillus spores can survive passage through the
upper gastrointestinal tract and germinate in the colon environment (Casula & Cutting,
2002; Maathuis, Keller, & Farmer, 2010). Casula and Cutting (2002) fed mice Bacillus
spores with a genetically engineered gene, ftsH-lacZ, that is expressed in vegetative cells.
After consumption of the spores, 2 logs of vegetative cells were detected in the jejunum
and ileum of the small intestine. As only spores were fed, the detection of vegetative
cells must have been a result of the spores germinating in the intestine of the mice
(Casula & Cutting, 2002). Additionally, Ganeden observed around a 10% germination of
their B. coagulans strain, GanedenBC30, in a TIM-1 model of the stomach and small
intestine, indicating germination in the gut is possible (Maathuis et al., 2010).

14
While in vivo methods would be the best for evaluating the survival and stability of
probiotic bacteria in the human digestive tract, these methods are expensive and labor
intensive. Therefore, in vitro methods are most commonly used to evaluate the acidic
and bile salt resistance of probiotic and potentially probiotic strains, typically through
adjusted broth media for 4 hours (Hyronimus et al., 2000; Lee, Park, Choi, & Cho, 2012;
Maathuis et al., 2010). During these studies, Bacillus species have shown the ability to
survive acidic conditions with pH as low as 2.0 to varying degrees, depending on the
strain. While pH 2.0 showed greater loss of viability, some strains of Bacillus had greater
than 49% viability remaining after 2 hours at pH 3.0 (Lee et al., 2012). However,
Maathuis et al. (2010) observed a 70% survival of B. coagulans spores through a TIM-1
dynamic model of the stomach, where the stomach pH dropped from pH 6.5-2.0 over 2
hours. Additionally, for most strains of Bacillus evaluated, survival of the strains were
even better in the presence of bile salts (Hyronimus et al., 2000; Lee et al., 2012;
Maathuis et al., 2010). As these strains were tested as vegetative cells, it is expected that
spores would have a similar or greater survival at acidic and bile conditions.
1.4.2. Germination in the Gut
After surviving the upper gastrointestinal tract, conditions in the lower gastrointestinal
tract could be suitable for the spores to germinate and start producing more vegetative
cells, which can interact with the gut microbiota upon reaching the colon (Song et al.,
2012). In 2010, in an in vitro model of the stomach and small intestine, survival of the B.
coagulans strain GanedenBC30 had 70% spore survival but germination of the spores was
<10% (Maathuis et al., 2010). The survival through the stomach was promising, but the

15
gemination of the spores in the small intestinal was very low. In 2019, the germination of
GanedenBC30 was studied again using a computer controlled in vitro model of the
gastrointestinal tract, simulating an adult human (Keller, Verbruggen, Cash, Farmer, &
Venema, 2019). The difference was that in this study the probiotic was introduced to the
model with a calculated meal that would help provide germination triggers that would be
present during normal consumption. During this study they found that >90% of spores
had germinated in the in vitro model of the gastrointestinal tract in the presence of the
meal (Keller et al., 2019).
Animals studies have shown that animals fed Bacillus coagulans had an increased
population of LAB in the gut microbiota. Additionally, other animal studies showed B.
coagulans helped remedy hypercholesterolemia, had antidiarrheal affects, and improved
some symptoms of Clostridium difficile induced colitis (Aminlari et al., 2018; Bomko et
al., 2017; Fitzpatrick et al., 2011; Majeed, Natarajan, et al., 2016; Wu et al., 2018) .
However, after consumption of spores in rats, B. coagulans was determined to only be a
transitory member of the intestine and passed quickly to be eliminated in the feces
(Abhari et al., 2015).
Additionally, probiotic B. coagulans has been found safe for consumption and successful
in human clinical studies as a treatment for irritable bowel syndrome, reduction of
cholesterol, a therapy for rheumatoid arthritis, as an anti-diarrheal and secondary
treatment to antibiotic therapy (Endres et al., 2009, 2011; Majeed, Natarajan, et al., 2016;
16
Majeed & Nagabhushanam, 2016; Mandel, Eichas, & Holmes, 2010). Additionally, it
may increase immune response against some respiratory infections (Baron, 2009).
1.4.3. Thermal Resistance During Processing
Some Lactobacillus and Bifidobacterium strains have been evaluated in fruit juice
supplements and it was observed that the pH, pasteurization time and temperature
affected the viability of the probiotic bacteria (Sheehan, Ross, & Firzgerald, 2007).
Acidic environments were for the most part tolerated by a majority of strains tested, but
thermal processing had a greater effect on the inactivation of the probiotics. However, B.
coagulans has not been studied as much. In one of the few studies available, the
inactivation of B. coagulans specifically, was found to be affected by the composition of
the food matrix, processing temperature and product pH (Palop, Raso, Pagán, Condón, &
Sala, 1999). The D-value of B. coagulans in buffer was found to decrease to less than a
third when the pH changes from pH 7.0 to pH 4.0. Additionally, the D-value decreased
even more, about one sixth, with the same change in pH when included in tomato or
asparagus food matrices (Palop et al., 1999). Therefore, these factors should always be
evaluated when determining the product application of the B. coagulans probiotic strain.
1.4.4. Survival/Stability During Shelf Life
While the most important property of a probiotic is that it can promote a health benefit on
the host, it must also survive and remain stable in the delivery product until the host is
able to ingest the probiotic. Thus, the probiotic must remain viable during the shelf life
of the product so that the concentration of probiotic is equal to or higher than what is

17
required to obtain the health benefit imparted by the bacteria. Therefore, the composition
of the food will play an important role in the viability of the probiotic during shelf life.
Important product characteristics that may affect the viability would be pH, water
activity, nutrients, oxygen and temperature of storage (Song et al., 2012). It is also
important for the spore to not germinate during the shelf life so that it is in the protective
spore coat upon consumption. Additionally, the addition of probiotics should not change
the quality of the final product. Therefore, organoleptic properties should be monitored
to ensure the added spores do not affect the product throughout the shelf life. Sensory of
the probiotic developed product should be similar to commercial products without
probiotics (Song et al., 2012).
1.5. Products that Contain Bacillus coagulans
The most widely used probiotics are from the Lactobacillus and Bifidobacterium genera
and are mostly included in dairy products. However, they are not resistant to heat.
Probiotics that are resistant to heat would be expected to potentially be included in a wide
range of products (Konuray & Erginkaya, 2018). Bacillus coagulans had gained interest
due to its heat resistant spore form. While this species has not been widely studied for
viability, there are some products that contain B. coagulans as a probiotic. These
products include yogurts, fermented beverages, fruit juices, sausages, pasta, muffins and
cereal based function foods (Cutting, 2011; Fares et al., 2015; Jafari et al., 2017; Konuray
& Erginkaya, 2018).

18
1.6. References
Abhari, K., Shekarforoush, S. S., Sajedianfard, J., Hosseinzadeh, S., & Nazifi, S. (2015).
The effects of probiotic, prebiotic and synbiotic diets containing Bacillus coagulans
and inulin on rat intestinal microbiota. Iranian Journal of Veterinary Research,
16(3), 267–273.
Ahuja, K., & Deb, S. (2018). Global Market Insights. Retrieved February 20, 2019, from
https://www.gminsights.com/industry-analysis/probiotics-market
Aminlari, L., Shekarforoush, S. S., Hosseinzadeh, S., Nazifi, S., & Sajedianfard, J.
(2018). Effect of Probiotics Bacillus coagulans and Lactobacillus plantarum on
Lipid Profile and Feces Bacteria of Rats Fed Cholesterol-Enriched Diet.
https://doi.org/10.1007/s12602-018-9480-1
Anadón, A., Rosa Martínez-Larrañaga, M., & Aranzazu Martínez, M. (2006). Probiotics
for animal nutrition in the European Union. Regulation and safety assessment.
Regulatory Toxicology and Pharmacology, 45(1), 91–95.
https://doi.org/10.1016/j.yrtph.2006.02.004
Annan, N. T., Borza, A. D., & Hansen, L. T. (2008). Encapsulation in alginate-coated
gelatin microspheres improves survival of the probiotic Bifidobacterium
adolescentis 15703T during exposure to simulated gastro-intestinal conditions. Food
Research International, 41(2), 184–193.
https://doi.org/10.1016/j.foodres.2007.11.001
Araya, M., Morelli, L., Reid, G., Sanders, M. E., Stanton, C., Pineiro, M., & Ben
Embarek, P. (2002). Guidelines for the Evaluation of Probiotics in Food. Joint
FAO/WHO Working Group Report on Drafting Guidelines for the Evaluation of

19
Probiotics in Food, 1–11. https://doi.org/10.1111/j.1469-0691.2012.03873
Ashraf, R., & Shah, N. P. (2011). Selective and differential enumerations of
Lactobacillus delbrueckii subsp. bulgaricus, Streptococcus thermophilus,
Lactobacillus acidophilus, Lactobacillus casei and Bifidobacterium spp. in yoghurt -
A review. International Journal of Food Microbiology, 149(3), 94–208.
https://doi.org/10.1016/j.ijfoodmicro.2011.07.008
Atluri, S., Ragkousi, K., Cortezzo, D. E., & Setlow, P. (2006). Cooperativity Between
Different Nutrient Receptors in Germination of Spores of Bacillus subtilis and
reduction of this cooperativity by alterations in the GerB Receptor. Journal of
Bacteriology, 188(1), 28–36. https://doi.org/10.1128/JB.188.1.28
Baron, M. (2009). A patented strain of Bacillus coagulans increased immune response to
viral challenge. Postgraduate Medicine, 121(2), 114–118.
https://doi.org/10.3810/pgm.2009.03.1971
Bomko, T. V., Nosalskaya, T. N., Kabluchko, T. V., Lisnyak, Y. V., & Martynov, A. V.
(2017). Immunotropic aspect of the Bacillus coagulans probiotic action. Journal of
Pharmacy and Pharmacology, 69(8), 1033–1040.
https://doi.org/10.1111/jphp.12726
Bora, P. S., Puri, V., & Bansal, A. K. (2009). Physicochemical Properties and Excipient
Compatibility studies of Probiotic Bacillus coagulans Spores. Scientia
Pharmaceutica, 77, 625–637. https://doi.org/10.3797/scipharm.0904-01
Casula, G., & Cutting, S. M. (2002). Probiotics: Spore Germination in the
Gastrointestinal Tract. Society, 68(5), 2344–2352.
https://doi.org/10.1128/AEM.68.5.2344

20
Charalampopoulos, D., Wang, R., Pandiella, S. S., & Webb, C. (2002). Application of
cereal and cereal components in functional foods: a review. International Journal of
Food Microbiology, 79(1–2), 131–141.
Cutting, Simon M., Ricca, E. (2014). Bacterial spore-formers: friends and foes. FEMS
Microbiology Letters, 358, 107–109. https://doi.org/10.1111/1574-6968.12572
Cutting, S. M. (2011). Bacillus probiotics. Food Microbiology, 28, 214–220.
https://doi.org/10.1016/j.fm.2010.03.007
De Clerck, E., Rodriguez-Diaz, M., Forsyth, G., Lebbe, L., Logan, N. A., & DeVos, P.
(2004). Polyphasic Characterization of Bacillus coagulans Strains, Illustrating
Heterogeneity within this Species, and Emended Description of the Species.
Systematic and Applied Microbiology, 27(1), 50–60. https://doi.org/10.1078/0723-
2020-00250
De Vecchi, E., & Drago, L. (2006). Lactobacillus sporogenes or Bacillus coagulans:
misidentification or mislabelling? International Journal of Probiotics and
Prebiotics, 1(1), 3–10.
Drago, L., & De Vecchi, E. (2009). Should Lactobacillus sporogenes and Bacillus
coagulans Have a future? Journal of Chemotherapy, 21(4), 371–377.
https://doi.org/10.1179/joc.2009.21.4.371
Elshaghabee, F. M. F., Rokana, N., Gulhane, R. D., Sharma, C., & Panwar, H. (2017).
Bacillus as potential probiotics: Status, concerns, and future perspectives. Frontiers
in Microbiology, 8(AUG), 1–15. https://doi.org/10.3389/fmicb.2017.01490
Endres, J. R., Clewell, A., Jade, K. A., Farber, T., Hauswirth, J., & Schauss, A. G.
(2009). Safety assessment of a proprietary preparation of a novel Probiotic, Bacillus

21
coagulans, as a food ingredient. Food and Chemical Toxicology, 47(6), 1231–1238.
https://doi.org/10.1016/j.fct.2009.02.018
Endres, J. R., Qureshi, I., Farber, T., Hauswirth, J., Hirka, G., Pasics, I., & Schauss, A. G.
(2011). One-year chronic oral toxicity with combined reproduction toxicity study of
a novel probiotic, Bacillus coagulans, as a food ingredient. Food and Chemical
Toxicology, 49(5), 1174–1182. https://doi.org/10.1016/j.fct.2011.02.012
Errington, J. (2003). Regulation of endospore formation in Bacillus subtilis. Nature
Reviews Microbiology, 1(2), 117–126. https://doi.org/10.1038/nrmicro750
Fakhry, S., Sorrentini, I., Ricca, E., De Felice, M., & Baccigalupi, L. (2008).
Characterization of spore forming Bacilli isolated from the human gastrointestinal
tract. Journal of Applied Microbiology, 105(6), 2178–2186.
https://doi.org/10.1111/j.1365-2672.2008.03934.x
Fares, C., Menga, V., Martina, A., Pellegrini, N., Scazzina, F., & Torriani, S. (2015).
Nutritional profile and cooking quality of a new functional pasta naturally enriched
in phenolic acids, added with β-glucan and Bacillus coagulans GBI-30, 6086.
Journal of Cereal Science, 65, 260–266. https://doi.org/10.1016/j.jcs.2015.07.017
Fitzpatrick, L. R., Small, J. S., Greene, W. H., Karpa, K. D., & Keller, D. (2011).
Bacillus Coagulans GBI-30 (BC30) improves indices of Clostridium difficile-
Induced colitis in mice. Gut Pathogens, 3(1), 16. https://doi.org/10.1186/1757-4749-
3-16
Foligné, B., Daniel, C., & Pot, B. (2013). Probiotics from research to market: The
possibilities, risks and challenges. Current Opinion in Microbiology, 16(3), 284–
292. https://doi.org/10.1016/j.mib.2013.06.008

22
Ghelardi, E., Celandroni, F., Salvetti, S., Gueye, S. A., Lupetti, A., & Senesi, S. (2015).
Survival and persistence of Bacillus clausii in the human gastrointestinal tract
following oral administration as spore-based probiotic formulation. Journal of
Applied Microbiology, 119(2), 552–559. https://doi.org/10.1111/jam.12848
Godward, G. N. (2000). Studies on enhancing the viability and survival of probiotic
bactiera in dairy foods through strain selection and microencapsulation. University
of Western Sydney.
Gotcheva, V., Hristozova, E., Hristozova, T., Guo, M., Roshkova, Z., & Angelov, A.
(2002). Assessment of Potential Probiotic Properties of Lactic Acid Bacteria and
Yeast Strains. Food Biotechnology, 16(3), 211–225. https://doi.org/10.1081/FBT-
120016668
Grajek, W., Olejnik, A., & Sip, A. (2005). Probiotics, prebiotics and antioxidants as
functional foods. Acta Biochimica Polonica, 52(3), 665–671.
https://doi.org/10.1093/brain/awt108
Henriques, A. O., & Moran, Jr., C. P. (2007). Structure, Assembly, and Function of the
Spore Surface Layers. Annual Review of Microbiology, 61(1), 555–588.
https://doi.org/10.1146/annurev.micro.61.080706.093224
Hill, C., Guarner, F., Reid, G., Gibson, G. R., Merenstein, D. J., Pot, B., Morelli, L.,
Canani, R. B., Flint, H. J., Salminen, S., Calder, P. C., & Sanders, M. E. (2014). The
International Scientific Association for probiotics and prebiotics consensus
statement on the scope and appropriate use of the term probiotic. National Review
Gastroenterol Hepatol, 11(11), 506–514. https://doi.org/10.1038/nrgastro.2014.66
Holzapfel, W. H., Haberer, P., Geisen, R., & Schillinger, U. (2001). Taxonomy and

23
important features of probiotic microorganisms in physiologic properties of lactic
acid bacteria. American Journal of Clinical Nutrition, 73(2), 365S.
https://doi.org/10.1093/ajcn/73.2.365s
Hyronimus, B., Le Marrec, C., Sassi, A. H., & Deschamps, A. (2000). Acid and bile
tolerance of spore-forming lactic acid bacteria. International Journal of Food
Microbiology, 61, 193–197.
Jafari, M., Mortazavian, A. M., Hosseini, H., Safaei, F., Mousavi Khaneghah, A., &
Sant’Ana, A. S. (2017). Probiotic Bacillus: Fate during sausage processing and
storage and influence of different culturing conditions on recovery of their spores.
Food Research International, 95, 46–51.
https://doi.org/10.1016/j.foodres.2017.03.001
Jayamanne, V. S., & Adams, M. R. (2006). Determination of survival, identity and stress
resistance of probiotic bifidobacteria in bio-yoghurts. Letters in Applied
Microbiology, 42(3), 189–194. https://doi.org/10.1111/j.1472-765X.2006.01843.x
Jensen, G. S., Benson, K. F., Carter, S. G., & Endres, J. R. (2010). GanedenBC30 cell
wall and metabolites: Anti-Inflammatory and Immune Modulating Effects in Vitro.
BMC Immunology, 11.
Kailasapathy, K. (2002). Microencapsulation of probiotic bacteria: technology and
potential applications. Current Issues Intestinal Microbiology, 3, 39–48.
Keller, D., Verbruggen, S., Cash, H., Farmer, S., & Venema, K. (2019). Spores of
Bacillus coagulans GBI-30, 6086 show high germination, survival and enzyme
activity in a dynamic, computer-controlled in vitro model of the gastrointestinal
tract. Beneficial Microbes, 10(1), 77–87. https://doi.org/10.3920/BM2018.0037

24
Konuray, G., & Erginkaya, Z. (2018). Potential Use of Bacillus coagulans in the Food
Industry. Foods, 7(6), 92. https://doi.org/10.3390/foods7060092
Lee, J., Park, I., Choi, Y., & Cho, J. (2012). Bacillus strains as feed additives: In vitro
evaluation of its potential probiotic properties, 577–585.
Maathuis, A. J. H., Keller, D., & Farmer, S. (2010). Survival and metabolic activity of the
GanedenBC30 strain of Bacillus coagulans in a dynamic in vitro model of the
stomach and small intestine. Beneficial Microbes, 1(1), 31–36.
https://doi.org/10.3920/BM2009.0009
Majeed, M., & Nagabhushanam, K. (2016). A Double-Blind, Placebo-Controlled,
Parallel Study Evaluating the Safety of Bacillus coagulans MTCC 5856 in Healthy
Individuals. Journal of Clinical Toxicology, 06(01), 1–9.
https://doi.org/10.4172/2161-0495.1000283
Majeed, M., Nagabhushanam, K., Natarajan, S., Sivakumar, A., Ali, F., Pande, A.,
Majeed, S., & Karri, S. K. (2016). Bacillus coagulans MTCC 5856 supplementation
in the management of diarrhea predominant Irritable Bowel Syndrome: a double
blind randomized placebo controlled pilot clinical study. Nutrition Journal, 15(1),
21. https://doi.org/10.1186/s12937-016-0140-6
Majeed, M., Nagabhushanam, K., Natarajan, S., Sivakumar, A., Eshuis-de Ruiter, T.,
Booij-Veurink, J., de Vries, Y. P., & Ali, F. (2016). Evaluation of genetic and
phenotypic consistency of Bacillus coagulans MTCC 5856: a commercial probiotic
strain. World Journal of Microbiology and Biotechnology, 32(4), 1–12.
https://doi.org/10.1007/s11274-016-2027-2
Majeed, M., Natarajan, S., Sivakumar, A., Ali, F., Pande, A., Majeed, S., & Karri, S. K.

25
(2016). Evaluation of Anti-Diarrhoeal Activity of Bacillus coagulans MTCC 5856
and its Effect on Gastrointestinal Motility in Wistat Rats. International Journal of
Pharma and Bio Sciences, 7(1), 311–316.
Mandel, D. R., Eichas, K., & Holmes, J. (2010). Bacillus coagulans: a viable adjunct
therapy for relieving symptoms of rheumatoid arthritis according to a randomized,
controlled trial. BMC Complementary and Alternative Medicine, 10, 1–7.
Martín, M. J., Lara-Villoslada, F., Ruiz, M. A., & Morales, M. E. (2015).
Microencapsulation of bacteria: A review of different technologies and their impact
on the probiotic effects. Innovative Food Science and Emerging Technologies, 27,
15–25. https://doi.org/10.1016/j.ifset.2014.09.010
Moir, A. (2006). How do spores germinate? Journal of Applied Microbiology, 101(3),
526–530. https://doi.org/10.1111/j.1365-2672.2006.02885.x
Nicholson, W. L., Munakata, N., Horneck, G., Setlow, P., Melosh, H. J., & Setlow, P.
(2003). Resistance of Bacillus Endospores to Extreme Terrestrial and Extraterrestrial
Environments. Microbiology and Molecular Biology Reviews, 64(3), 548–572.
https://doi.org/10.1128/mmbr.64.3.548-572.2000
Palop, A., Raso, J., Pagán, R., Condón, S., & Sala, F. J. (1999). Influence of pH on heat
resistance of spores of Bacillus coagulans in buffer and homogenized foods.
International Journal of Food Microbiology, 46(3), 243–249.
https://doi.org/10.1016/S0168-1605(98)00199-8
Sanders, M. E. (2003). Probiotics: Considerations for human health. Nutrition Reviews,
61(3), 91–99.
Setlow, P. (2014). Germination of spores of Bacillus species: What we know and do not

26
know. Journal of Bacteriology, 196(7), 1297–1305.
https://doi.org/10.1128/JB.01455-13
Shah, N. P. (2000). Probiotic Bacteria: Selective Enumeration and Survival in Dairy
Foods. Journal of Dairy Science, 83(4), 894–907. https://doi.org/10.3168/jds.S0022-
0302(00)74953-8
Sheehan, V. M., Ross, P., & Firzgerald, G. F. (2007). Assessing the acid tolerance and
the technological robustness of probiotic cultures for fortification in fruit juices.
Innovative Food Science and Emerging Technologies, 8, 279–284.
Song, D., Ibrahim, S., & Hayek, S. (2012). Recent Application of Probiotics in Food and
Agricultural Science. Intech Open, 2, 3–36. https://doi.org/10.5772/32009
Sorokulova, I. (2013). Modern Status and Perspectives of Bacillus Bacteria as Probiotics.
Journal of Probiotics & Health, 1(4), 1–5. https://doi.org/10.4172/2329-
8901.1000e106
Spinosa, M. R., Braccini, T., Ricca, E., De Felice, M., Morelli, L., Pozzi, G., & Oggioni,
M. R. (2000). On the fate of ingested Bacillus spores. Research in Microbiology,
151(5), 361–368. https://doi.org/10.1016/S0923-2508(00)00159-5
Weinbreck, F., Bodnár, I., & Marco, M. L. (2010). Can encapsulation lengthen the shelf-
life of probiotic bacteria in dry products? International Journal of Food
Microbiology, 136(3), 364–367. https://doi.org/10.1016/j.ijfoodmicro.2009.11.004
Wu, T., Zhang, Y., Lv, Y., Li, P., Yi, D., Wang, L., Zhao, D., Chen, H., Gong, J., & Hou,
Y. (2018). Beneficial impact and molecular mechanism of Bacillus coagulans on
piglets’ intestine. International Journal of Molecular Sciences, 19(7), 1–17.
https://doi.org/10.3390/ijms19072084

27
CHAPTER 2: CHARACTERIZATION OF BACILLUS COAGULANS UNIQUE IS-2

28
2.1. Introduction
Bacillus coagulans is a Gram-positive rod, facultative, lactic acid producing and
sporeforming bacteria. Due to its sporeforming abilities, B. coagulans has two different
paths for its lifecycle. The vegetative one is the traditional life cycle of replicating,
growing and proliferating in an environment rich with nutrients and capable of supporting
life. When nutrients start to deplete or the environment changes to undesirable
conditions, the cell can detect these and switch over to the life cycle that results in the
production of endospores (Nicholson et al., 2003). The endospore is a protein rich
protective layer that surrounds a dehydrated core that contains the chromosome (Fakhry
et al., 2008). The spore is in a dormant state that can be transported by wind, water, or
animal vectors and can survive for years. During this dormant spore state, the cell is
continually monitoring the environment for desirable conditions. When conditions are
favorable, the spore can begin to germinate and switch once again to the vegetative life
cycle.
Bacillus coagulans’ sporeforming ability provides this species with inherent protection
against heat, cold, dryness, and acidic conditions (Nicholson et al., 2003). This spore
protection is a main reason why B. coagulans has gained interest in the probiotic
industry. Some strains of B. coagulans have already achieved GRAS status and have
been shown to survive mild heat treatments (Orrù et al., 2014). A probiotic is defined as
“live microorganisms that, when administered in adequate amounts, confer a health
benefit on the host” (Hill et al., 2014). This is a very broad definition that describes the
various microorganisms used as probiotics. However, a WHO/FAO working group has
29
defined more specific guidelines that lists the characteristics a microorganism should
have in order to be considered as a probiotic. One of these is that all probiotics must be
identified with genus, species and strain, as probiotic characteristics have been found to
be strain specific (Araya et al., 2002). While it has been widely thought that health
benefits are strain specific, there has been evidence that there are certain sub-species,
species or genus specific health benefits (Sanders et al., 2018). For example, species
from the genus Bifidobacterium are known for their production of short chain fatty acids,
which have been shown to have beneficial effects on the gastrointestinal tract (Sanders et
al., 2018). Therefore, there cannot be complete assumptions of probiotic ability among
all strains of a genus or even species, and each individual strain should still be
characterized and evaluated for its probiotic properties. It is also recommended that
identity of the strain be evaluated phenotypically and genetically (Araya et al., 2002).
Bacillus coagulans has been documented as a diverse species of bacteria with varying
abilities among different strains (De Clerck et al., 2004). Although the morphology may
be similar, biochemical properties may differ among different strains. Therefore, when
evaluating a strain for probiotic properties it is also important to characterize them with
regard to their morphology and biochemical processes. It can also be important to
sequence the DNA of the strain under evaluation to fully characterize the organism
genetically.
When evaluating the phenotype of a strain, in addition to its morphology and chemical
properties, another important property to characterize for potential probiotic strains is

30
their ability to survive processes usually applied in food manufacturing. Both stability
and loss of viability have been observed when evaluating products added with probiotics
during processing and shelf life (Ashraf & Shah, 2011; Bora et al., 2009). Therefore, it’s
important to evaluate the stability and survivability of a strain during food processing
when considering it as a potential probiotic. One of the important processing steps used
by the food industry is the use of heat. Thus, the thermal resistance of probiotic strains is
an important factor to be considered when evaluating their potential applications in the
food industry.
Bacterial thermal resistance is dependent upon the species, heating matrix, and intrinsic
and extrinsic factors in the environment such as temperature and pH (Desai & Varadaraj,
2010; Haberbeck, Alberto da Silva Riehl, de Cássia Martins Salomão, & Falcão de
Aragão, 2012). Most traditional probiotic strains, such as Lactobacillus and
Bifidobacterium, are chosen for their acid tolerance so they can survive the acidic
conditions of the stomach, but they are generally not heat resistant (Gotcheva et al.,
2002). This requires them to be added after any thermal processing step that is part of the
manufacturing of the product, otherwise they would die during that process and never
reach the gut of the consumer. Therefore, the food industry has an interest in finding
probiotic strains that are heat resistant and could survive during thermal treatments
usually applied during processing. This would allow the addition of probiotic strains to
take place at the beginning of the process, avoiding any potential post processing
contamination.

31
The heat resistance of microorganisms is usually evaluated by determining the thermal
death time required for one decimal reduction of the population, or D-value, of the
organism at a specific temperature. The D-Value is the time (usually in minutes)
required to reduce the bacterial population by 90%, or 1 log, at a specific temperature.
The higher the D-value, the more resistant to heat the microorganism will be. This
information can be useful in determining if it can survive thermal processing or how
much must be added to the product formulation to compensate for any loss during
processing and ensure the final product has the desired bacterial concentration.
Additionally, thermal resistance data is not always collected at high temperatures, rather a
Z-value is used to estimate how resistant a microorganism would be over a range of
temperatures (Palop et al., 1999). Therefore, if the D-values at high temperatures would
be experimentally determined, it would provide more accurate information associated to
the thermal resistance of organisms of interest. The purpose of this research is to
characterize the Bacillus coagulans strain Unique IS-2 using biochemical tests and to
determine its thermal resistance by establishing its D-values at different temperatures and
in different food matrices.
2.2. Materials and Methods
2.2.1. Preparation of Frozen Stocks
A lyophilized powder containing spores of Bacillus coagulans Unique IS-2 was obtained
from Nebraska Cultures, LLC, which is now UAS Laboratories, LLC (Wausau, WI). The
spores were grown aerobically in Tryptic Soy Broth (TSB) at 55˚C for 24 hours.
Overnight cultures were transferred twice to fresh TSB, to ensure healthy growth. The

32
final culture was mixed with 15% (v/v) glycerol and dispensed into 1 ml aliquots and
were stored into sterile 1.5 ml centrifuge tubes for storage at -80˚C. Working stocks for
biochemical tests were prepared by streaking frozen stocks onto Tryptic Soy Agar (TSA)
and incubating at 55˚C for 24 hours. Cultures were transferred to fresh TSA plates twice
to ensure healthy growth after frozen storage.
2.2.2. Catalase Test
One drop of 3% hydrogen peroxide was placed on a glass slide. A sterile loop was used
to transfer one colony of B. coagulans into the hydrogen peroxide drop. A positive
reaction resulted in immediate bubbling.
2.2.3. Oxidase Test
Filter paper was placed inside a sterile petri plate and soaked with oxidase reagent
solution. Immediately after adding the oxidase reagent, a sterile loop was used to transfer
one colony of B. coagulans onto the filter paper. A positive reaction resulted in a color
change of pink to dark purple within 10-30 seconds.
2.2.4. Indole Test
5 ml sterile 1% tryptone broth was dispensed into sterile test tubes. A sterile loop was
used to inoculate one colony of B. coagulans into the tryptone broth. The inoculated
media was incubated at 35˚C for 24 hours. After 24 hours, 5 drops of Kovac’s Reagent
was added to the tryptone broth tubes. A positive reaction was a dark red color formation
on the surface layer of the broth.

33
2.2.5. Gelatin Hydrolysis
A sterile loop was used to stab inoculate a heavy load of multiple B. coagulans colonies
into nutrient gelatin media tubes (Becton, Dickinson and company, Sparks, MD).
Inoculated media tubes and control tubes were incubated at the optimal growth
temperature of 55˚C for up to 14 days, checking every 24 hours for liquification. Every
24 hours, control and inoculated tubes were placed in an ice bath until control tube
became solid (media liquefies over 28˚C). Inoculated tubes were then tilted to check for
gelatin hydrolysis. If gelatin was hydrolyzed, inoculated tubes would remain liquid after
ice bath.
2.2.6. Gram Stain
The Gram staining procedure outlined in the U.S. Food and Drug Administration BAM
R32 method was followed (FDA, 2017a). If cells were stained purple, they were labeled
Gram positive. If cells were stained pink/red, they were labeled Gram negative.
Morphology was also evaluated under the microscope after Gram staining procedure.
2.2.7. API 50CH
The procedure outlined in API 50 CH test strips manual were followed (BioMérieux,
2019). A positive result was indicated by a color change from red to yellow in the tubes.
For the esculin test, the color change was from red to black.

34
2.2.8. Phylogenetic Tree
A phylogenetic tree was created using the Mega7 software (Kumar, Stecher, & Tamura,
2016). Analysis was done with maximum likelihood method based on the Tamura-Nei
model (Tamura & Nei, 1993). The draft genome sequence for Bacillus coagulans
Unique IS-2 was deposited at DDBJ/ENA/GenBank with the accession number
JZDH00000000 (Upadrasta, Pitta, & Madempudi, 2016). The 16S strain for Bacillus
coagulans Unique IS-2 was found within this whole genome sequence. A phylogenetic
tree was created to compare how B. coagulans Unique IS-2 relates to other strains of B.
coagulans and other common strains of Bacillus, Lactobacillus and Bifidobacterium used
as probiotics. Paenibacillus dendritiforis was used to root the tree. All 16S sequences
for comparison were retrieved from NCBI.
2.2.9. Thermal D-Values
A spore suspension was prepared by adding lyophilized spores of Bacillus coagulans
Unique IS-2 (~2.0 x 10¹¹ CFU/g) into phosphate-buffered saline (PBS) (FDA, 2017b) for
a target bacterial population of 1.0 x 10⁸ CFU/ml. The spore suspension was heat treated
at 80˚C for 12 minutes and immediately cooled in an ice bath to ensure only spores were
present. Once cooled, 0.15 ml of the spore suspension were transferred to sterile
capillary tubes and then sealed with heat.
One capillary tube was sealed with a calibrated Omega model TJ36-CPSS-116G-6
thermocouple placed through the top of the capillary tube. This thermocouple was used
to accurately monitor temperature with the help of the Omega Logging Software for

35
Windows release 5.20.6 (Picto Technology LTD, England, GB) program. Temperature
recordings were done every second, in order to create temperature vs. time plots.
Thermal death time of B. coagulans Unique IS-2 spores were evaluated at 90˚C, 110˚C,
and 125˚C. At each temperature, thermal death time was evaluated in PBS, skim milk,
whole milk and drinkable yogurt. All temperature and matrix combination were done in
triplicate. A silicon oil bath was used as the heating medium. Heat sealed capillary
tubes, along with the temperature monitoring capillary tube, were placed simultaneously
into the oil bath. A capillary tube was pulled at designated intervals, which varied with
the temperature being tested, and was immediately placed into an ice bath to cool
suspension down quickly. Designated intervals did not begin until the desired
temperature was reached inside the temperature monitoring ampule. Surviving spores
were enumerated after ampules were cooled down to room temperature. Enumeration
was done by serial dilutions in Butterfield’s phosphate-buffered dilution water and then
spread-plated on TSA. TSA plates were incubated aerobically at 55˚C for 48 hours.
Results were used to create survival curves for each temperature and from these curves
D-values were determined.
2.2.10. Statistical Analysis
Analysis of Variance was used to compare the D-values of each matrix at each
temperature at the 5% level of significance. Statistics analysis was conducted using SAS
9.4 (SAS, INC, Cary, NC).

36
2.3. Results and Discussion
2.3.1. Biochemical Tests
Strain identification and characterization is important for two main reasons. First, not all
probiotic properties are specific to a species of bacteria, as some are strain specific.
Some research has shown evidence that there are certain sub-species, species or genus
specific health benefits (Sanders et al., 2018). For example, species from the genus
Bifidobacterium are known for their production of short chain fatty acids, which have
been shown to have beneficial effects on the gastrointestinal tract (Sanders et al., 2018).
However, it is recommended that each probiotic strain needs to be tested and
characterized (Araya et al., 2002). Second, characterization tests can be used as a quicker
method to differentiate species. Some tests may be unique to certain species and can
differentiate them from others. Bacillus coagulans has been known to be a species with
variation among different strains (De Clerck et al., 2004). Therefore, careful
characterization of the strain of interest is even more important when evaluating its
probiotic potential. 16S sequences were retrieved from NCBI to observe how B.
coagualans Unique IS-2 is related to other Bacillus species regarded as potential
probiotics and other popular bacteria strains used as probiotics from the Lactobacillus
and Bifidobacterium genera (Figure 3).

37
Figure 3. Phylogenetic tree using the maximum likelihood method of analysis for 16S sequences. Tree is drawn to scale. Paenibacillus dendritiformis was used to root the tree.
The biochemical test results for Bacillus coagulans Unique IS-2 are summarized in Table
1. This strain had a positive result during the catalase and oxidase test. Therefore, B.
coagulans Unique IS-2 contains the catalase enzyme to neutralize hydrogen peroxide and
possesses cytochrome C in its respiratory chain. However, negative results occurred
during the indole and gelatin hydrolysis tests, indicating B. coagulans is unable to
breakdown tryptophan to form indole and hydrolyze gelatin. These results compare with
other strains of B. coagulans in the literature (Endres et al., 2011; Keller, Farmer,
McCartney, & Gibson, 2010; Ratna Sudha, Chauhan, Dixit, Babu, & Jamil, 2010).
Lactobacillus rhamnosus
Lactobacillus casei
Lactobacillus plantarum
Lactobacillus acidophilus
Bifidobacterium longum
Bifidobacterium breve
Bacillus cereus
Bacillus indicus
Bacillus subtilis
Bacillus licheniformis
Bacillus coagulans Unique IS-2
Bacillus coagulans NBRC 12583
Bacillus coagulans JCM2257
Bacillus coagulans BJQ-Z6
Bacillus clausii
Paenibacillus dendritiformis
100
9948
90
10096
100
99
61
6750
41
46
0.050

38
Table 1. Biochemical Test Results for B. coagulans Unique IS-2 Test Result
Catalase Positive Oxidase Positive Indole Negative
Gelatin Hydrolysis Negative
B. coagulans is different from traditional probiotic strains because it is oxidase positive.
Most probiotic strains are oxidase negative because they are anaerobic microorganisms.
However, oxidase positive bacteria are able to utilize oxygen in their respiratory chain,
which clarify them as facultative or aerobic species. B. coagulans is known as a
facultative organism but grows best in the presence of oxygen, which could cause
problems during germination in the gut as a probiotic due to the lack of oxygen in that
environment.
Gram staining showed that B. coagulans Unique IS-2 are Gram positive rods typically by
themselves or in short chains. The average length of the vegetative cell rods is 4.33 µm,
which was measured using a light microscope (Figure 4). Additionally, the endospores
are subterminally located, which is different than some other Bacillus species that are
central or terminally located. However, this compares to other strains of B. coagulans
(De Clerck et al., 2004). Endospores are important to this organism as it provides a built-
in defense mechanism against harsh environments, such as heat, cold, acid, and
desiccation.

39
Figure 4. Gram staining of Bacillus coagulans Unique IS-2 showing Gram positive rods with lengths varying from 4.00 µm to 4.58 µm (top) and subterminally located
endospores (bottom). Bacillus coagulans is known to have physiological differences between strains (De
Clerck et al., 2004; Majeed, Nagabhushanam, Natarajan, Sivakumar, Eshuis-de Ruiter, et
al., 2016). Therefore, the API 50 CH test was used to determine which carbohydrates
that B. coagulans strain Unique IS-2 is able to utilize. This strain was able to use 25
carbohydrates and was variable on 9 more (Table 2). These utilized carbohydrates were
different than other strains of B. coagulans in the literature; L-arabinose, D-Ribose, D-

40
xylose, D-mannitol, Methyl-alphaD-glucopyranoside, amygdalin, arbutin, esculin,
salicin, D-celiobiose, D-Lactose, D-saccharose, gentiobiose, D-tagatose, potassium
gluconate, potassium 2-KetoGluconate, and potassium 5-ketogluconate. This data can be
related to De Clerck et al. (2004) where they characterized 31 strains of B. coagulans
with the intent to evaluate the diversity among them. In their research, 85% of the tested
strains were also able to produce acid from D-galactose, D-fructose, D-glucose, glycerol,
maltose, D-mannose, D-melibiose, N-acetylglucosamine and D-trehalose (De Clerck et
al., 2004). However, there were also differences among the strains they tested and the
Unique IS-2 strain reported here. Further emphasizing diversity among strains of this
species and importance of proper strain characterization.

41
Table 2. API 50CH Results for Bacillus coagulans Unique IS-2 No. Carbohydrates Unique IS-2
0 Control - 1 GLY Glycerol + 2 ERY Erythritol V 3 DARA D-Arabinose V 4 LARA L-Arabinose + 5 RIB D-Ribose + 6 DXYL D-Xylose + 7 LXYL L-Xylose - 8 ADO D-Adonitol - 9 MDX Methyl-βD-Xylopyranoside -
10 GAL D-Galactose V 11 GLU D-Glucose + 12 FRU D-Fructose + 13 MNE D-Mannose + 14 SBE L-Sorbose - 15 RHA L-Rhamnose V 16 DUL Dulcitol - 17 INO Inositol - 18 MAN D-Mannitol + 19 SOR D-Sorbitol - 20 MDM Methyl-⍺D-Mannopyranoside - 21 MDG Methyl-⍺D-Glucoopyranoside + 22 NAG N-AcetylGlucosamine + 23 AMY Amygdalin + 24 ARB Arbutin +
No. Carbohydrates Unique IS-2 25 ESC Esculin + 26 SAL Salicin + 27 CEL D-Celiobiose + 28 MAL D-Maltose + 29 LAC D-Lactose (bovine origin) + 30 MEL D-Melibiose + 31 SAC D-Saccharose (sucrose) + 32 TRE D-Trehalose + 33 INU Inulin - 34 MLZ D-Melezitose - 35 RAF D-Raffinose V 36 AMD Amidon (starch) V 37 GLYG Glycogen V 38 XLT Xylitol - 39 GEN Gentiobiose + 40 TUR D-Turanose V 41 LYX D-Lyxose V 42 TAG D-Tagatose + 43 DFUC D-Fucose - 44 LFUC L-Fucose - 45 DARL D-Arabitol - 46 LARL L-Arabitol - 47 GNT Potassium Gluconate + 48 2KG Potassium 2-KetoGluconate + 49 5KG Potassium 5-Ketogluconate +
*V = Variable results among replications

42
4 1
2.3.3. Thermal D-Values
Thermal death times of Bacillus coagulans Unique IS-2 spores were observed at three
different temperatures in four different matrices. One matrix was a buffer to observe the
behavior of the spores in response to temperature alone as a control, while three food
matrices were chosen to evaluate how different products with different fat and pH levels
may affect the thermal death time of the organism of interest. Previous research indicates
that thermal death times may be affected by the content of fat in the matrix due to a
protective effect (Fain et al., 1991; Murphy, Osaili, Duncan, & Marcy, 2004). In this
research, skim milk with no notable fat content, and whole milk with 3% fat content were
evaluated. In addition, yogurt was also used as a matrix for determination of D-values.
Milk has a neutral pH while yogurt has a pH of 4.6. Based on information available in
the literature, a higher fat content may protect the spores and extend the thermal death
times, while the lower pH is thought to shorten the thermal death time.
Survival curves for Bacillus coagulans IS-2 in the phosphate buffered solution (PBS),
skim milk, whole milk and yogurt are shown in Figures 5 – 8, respectively. For all
matrices tested, the greater the temperature the lower the D-value was, which was
expected. The D-Values for B. coagulans at 90˚C were calculated as 29.9, 35.7, 39.9 and
7.7 minutes in PBS, skim milk, whole milk and yogurt respectively. At the lowest
temperature tested, B. coagulans Unique IS-2 had the longest D-value in whole milk,
followed by skim milk, showing slightly lower values. This indicated that during a
pasteurization time/temperature combination of 60˚C for 30 minutes used for fluid milk
the strain under evaluation could survive well (Desai & Varadaraj, 2010). Additionally,

43
4 1
the high temperature short time pasteurization of milk is 72˚C for 15 seconds, which the
strain under evaluation could also survive well in (U.S. Department of Health and Human
Services, Public Health Service, & Food and Drug Administration, 2017). Under these
circumstances, this strain could be added before the pasteurization processing step and it
would still be viable in the final product.
The biggest difference in D-values at 90˚C was in the yogurt matrix. The D-value of
yogurt was statistically different from the D-value of whole milk (p<0.05), but not
statistically different from the D-values of PBS or skim milk. The low D-value observed
in this product can be attributed to its low pH. The acidic conditions contribute as a
stress factor on the spore in addition to the thermal treatment, therefore the spores are
inactivated faster. Palop et al., (1999) also found that heat resistance was lowered with a
lower pH, and additionally they observed that the pH effect was greater at lower
temperatures. This agrees with the observations reported here, because the greatest D-
value difference among matrices was recorded at the lowest temperature tested. This
would be an important note for manufacturers wishing to use this strain as a probiotic
associated with a low pH product. They may have to account for these losses during
processing by adjusting their product formulation.
The D-values calculated where the thermal treatment was conducted at 110˚C were 0.63,
1.25, 1.96, and 0.48 minutes in PBS, skim milk, whole milk and yogurt respectively.
With a 20 degree increase in temperature, the survival of B. coagulans Unique IS-2
spores were significantly lower. The buffer system had the largest decrease in D-values,

44
4 1
dropping 47 times lower compared to the D-value at 90˚C. The rest of the D-values were
28 times, 20 times, and 16 times lower at 110˚C than 90˚C for skim milk, whole milk and
yogurt, respectively. This trend is similar to the research done by Palop et al., (1999),
where they saw that increased temperature lowered the D-values, and they observed
greater differences in D-values in more neutral pH ranges. At 110˚C, the highest D-value
for the spores was in whole milk, while the yogurt had the lowest D-value similar to what
was seen at 90˚C. However, at 110˚C there is no significant difference between the D-
values of PBS, skim milk, whole milk and yogurt (p<0.05).
At 125˚C the calculated D-values were 0.23, 0.54, 0.31 and 0.23 minutes in PBS, skim
milk, whole milk and yogurt respectively. These D-values were lowered by 2 times in
PBS, skim milk and yogurt from the D-value at 110˚C, while the D-value of whole milk
had been lowered 6 times compared to the D-value at 110˚C. At the highest temperature
tested, PBS and yogurt had the lowest D-value, while skim milk had the highest D-value.
However, at 125˚C there was no significant difference between the D-values of PBS,
skim milk, whole milk and yogurt (p<0.05). Some of this variation could be due to the
higher standard deviation between replications at this temperature. These differences
could be partially due to the close proximity between time points needed to establish the
thermal death curve. Overall, the trend is similar to 110˚C, where the D-value was again
shortened but it did not decrease as much as the decrease between 90˚C and 110˚C.
The regulated parameters for ultra-pasteurization for milk is a heat treatment at 138˚C for
2 seconds (U.S. Department of Health and Human Services et al., 2017). This
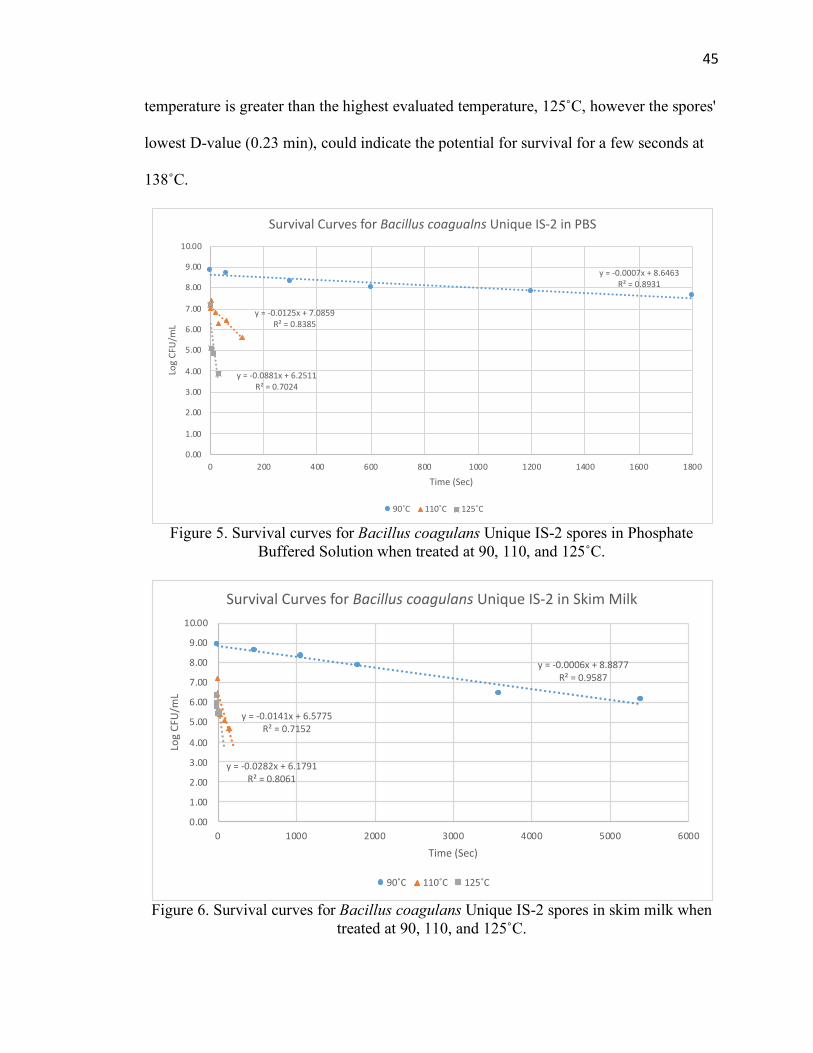
45
4 1
temperature is greater than the highest evaluated temperature, 125˚C, however the spores'
lowest D-value (0.23 min), could indicate the potential for survival for a few seconds at
138˚C.
Figure 5. Survival curves for Bacillus coagulans Unique IS-2 spores in Phosphate Buffered Solution when treated at 90, 110, and 125˚C.
Figure 6. Survival curves for Bacillus coagulans Unique IS-2 spores in skim milk when treated at 90, 110, and 125˚C.
y = -0.0007x + 8.6463R² = 0.8931
y = -0.0125x + 7.0859R² = 0.8385
y = -0.0881x + 6.2511R² = 0.7024
0.00
1.00
2.00
3.00
4.00
5.00
6.00
7.00
8.00
9.00
10.00
0 200 400 600 800 1000 1200 1400 1600 1800
Log
CFU
/mL
Time (Sec)
Survival Curves for Bacillus coagualns Unique IS-2 in PBS
90˚C 110˚C 125˚C
y = -0.0006x + 8.8877R² = 0.9587
y = -0.0141x + 6.5775R² = 0.7152
y = -0.0282x + 6.1791R² = 0.8061
0.00
1.00
2.00
3.00
4.00
5.00
6.00
7.00
8.00
9.00
10.00
0 1000 2000 3000 4000 5000 6000
Log
CFU
/mL
Time (Sec)
Survival Curves for Bacillus coagulans Unique IS-2 in Skim Milk
90˚C 110˚C 125˚C

46
4 1
Figure 7. Survival Curves for Bacillus coagulans Unique IS-2 spores in whole milk when treated at 90, 110, and 125˚C.
Figure 8. Survival Curves for Bacillus coagulans Unique IS-2 spores in drinkable yogurt when treated at 90, 110, and 125˚C.
y = -0.0006x + 8.8534R² = 0.9704
y = -0.0108x + 7.4732R² = 0.9594
y = -0.0989x + 7.6744R² = 0.7734
0.00
1.00
2.00
3.00
4.00
5.00
6.00
7.00
8.00
9.00
10.00
0 1000 2000 3000 4000 5000 6000
Log
CFU
/mL
Time (Sec)
Survival Curvres for Bacillus coagulans Unique IS-2 in Whole Milk
90˚C 110˚C 125˚C
y = -0.0021x + 8.185R² = 0.9436
y = -0.0315x + 6.4913R² = 0.7834
y = -0.0382x + 4.5099R² = 0.8537
0.00
1.00
2.00
3.00
4.00
5.00
6.00
7.00
8.00
9.00
0 200 400 600 800 1000 1200 1400 1600 1800 2000
Log
CFU
/mL
Time (Sec)
Survival Curves for Bacillus coagulans Unique IS-2 in Yogurt
90˚C 110˚C 125˚C

47
4 1
The D-values observed for B. coagulans Unique IS-2 spores in this research can be
compared to other information available for Bacillus spores. B. cereus spores have been
found to have D-values of 19.45 minutes and 4.4 minutes at 85˚C and 95˚C respectively
(Desai & Varadaraj, 2010). Another B. coagulans strain was found to have calculated D-
values in milk D95 = 4 minutes and D110 = 0.20 (Janštová & Lukášová, 2001). These
calculated D-values are lower than those obtained in this research. Additionally, Janštová
and Lukášová, (2001) evaluated different Bacillus spores. Among those studied, B.
licheniformis had the greatest heat resistance with D-values of 4.51, 0.68 and 0.18
minutes at 95˚C, 110˚C and 120˚C respectively. In general, based on information
available in the literature, the B. coagulans Unique IS-2, appears to have higher thermal
resistance than other Bacillus spores.
From the survival curves of B. coagulans Unique IS-2 in the four matrices, D-values
were able to be determined. Those D-values were then plotted against time (Figure 9) in
order to predict D-values at different temperatures than those tested here. For whole
milk, the R2 value was 0.9969 (Table 3), which indicates a strong correlation between D-
value and temperature. This will allow for the estimation of D-values at different
temperatures, within those tested here, with confidence. For all other matrices evaluated,
the R2 value was equal to or lower than 0.9429, indicating that the association between D-
values and temperature was not linear within the interval evaluated. If the interval is
reduced to included data for the thermal death between 90˚C and 110˚C then the
correlation seems to be linear. The leveling of the curve beyond 110˚C may reflect
intrinsic characteristics associated with the spores, indicating that higher temperatures do

48
4 1
not further contribute to thermal death. However, without further experiments in this
temperature range, conclusions could not be made. In further work, additional testing of
temperatures should be considered between 90˚C and 110˚C and between 110˚C and
125˚C to improve the confidence on this data.
Figure 9. Thermal death curves
Table 3. Summary of D-Values for each temperature/matrix combination and linear regression lines with R2 values. D-Value (Min)
1
Product 90˚C
110˚C 125˚C Linear Regression Line R² Value
PBS 29.94a,b
0.63 0.23 y=-0.0617x+6.8946 0.9416
Skim Milk 35.74a,b
1.25 0.54 y=-0.0531x+6.2183 0.9383
Whole Milk 39.91a
1.96 0.31 y=-0.0606x+7.0219 0.9969
Yogurt 7.70b
0.48 0.23 y=-0.0445x+4.7938 0.9429
1Treatments with different letters within the same column are significantly different (p<0.05)
0.10
1.00
10.00
100.00
80 85 90 95 100 105 110 115 120 125 130
D-Va
lue
(Min
)
Temperature (˚C)
Thermal Death Curves
PBS Skim Milk Whole Milk Yogurt

49
4 1
2.4. Conclusion
Bacillus coagulans is a very diverse species with varying characteristics among strains
(De Clerck et al., 2004). This reason reveals the importance of evaluating the
biochemical tests of each strain of interest when evaluating probiotic properties. In this
research, B. coagulans Unique IS-2 was determined to be a Gram-positive rod, spore-
former, catalase positive, oxidase positive, indole negative and gelatin hydrolysis
negative. These results are similar to other B. coagulans strains in the literature, though
the evaluation of biochemical test is also important for potential probiotic strains (Araya
et al., 2002; De Clerck et al., 2004; Keller et al., 2010; Ratna Sudha et al., 2010).
According to these experiments, Bacillus coagulans Unique IS-2 spores have high
thermal resistance. At neutral pH, spores have a D-value of at least 29 minutes at 90˚C,
which is significantly greater than parameters usually used for pasteurization in the food
industry. These D-values are of great importance to industry as they help indicate which
products could have B. coagulans Unique IS-2 incorporated into their formulation with
the potential probiotic strain surviving the thermal processing. The D-values are also
useful in the determination of any formulation adjustment that may be necessary to
ensure probiotic levels in the final product, based on the processing parameters of thermal
treatments. Another important piece of information obtained from these experiments was
the effect of pH on the D-value of B. coagulans Unique IS-2 spores. Extra care should be
taken with acidified products as the lower the pH, the faster the spores are inactivated.
To ensure desired bacterial levels in the final product, the product formulation would
have to account for the loss due to any heat treatment process applied to the product.

50
4 1
These experiments evaluated three temperatures and four different matrices. Therefore,
the D-values calculated here may only be applied to these specific conditions. Further
work should incorporate more temperatures within the range of 90-125˚C for skim milk
and yogurt, as well as other food matrices. One factor to consider would be to test food
matrices with a higher variation of fat content. Results showed there was no significant
difference in D-values between the 3% fat difference of skim milk and whole milk. It
may be beneficial to evaluate the effect of fat content levels varying between 10% - 20%
, or higher, for the potential inclusion of B. coagulans spores into more products (Fain et
al., 1991; Murphy et al., 2004). The information associated with thermal inactivation of
spores of B. coagulans Unique IS-2 reported here is a good indication of its thermal
resistance and that it could be a potential probiotic of choice for products that must go
through a thermal process.

51
4 1
2.5. References
Araya, M., Morelli, L., Reid, G., Sanders, M. E., Stanton, C., Pineiro, M., & Ben
Embarek, P. (2002). Guidelines for the Evaluation of Probiotics in Food. Joint
FAO/WHO Working Group Report on Drafting Guidelines for the Evaluation of
Probiotics in Food, 1–11. https://doi.org/10.1111/j.1469-0691.2012.03873
Ashraf, R., & Shah, N. P. (2011). Selective and differential enumerations of
Lactobacillus delbrueckii subsp. bulgaricus, Streptococcus thermophilus,
Lactobacillus acidophilus, Lactobacillus casei and Bifidobacterium spp. in yoghurt -
A review. International Journal of Food Microbiology, 149(3), 94–208.
https://doi.org/10.1016/j.ijfoodmicro.2011.07.008
BioMérieux. (2019). API50CH Manual. Retrieved from https://www.biomerieux.com
Bora, P. S., Puri, V., & Bansal, A. K. (2009). Physicochemical Properties and Excipient
Compatibility studies of Probiotic Bacillus coagulans Spores. Scientia
Pharmaceutica, 77, 625–637. https://doi.org/10.3797/scipharm.0904-01
De Clerck, E., Rodriguez-Diaz, M., Forsyth, G., Lebbe, L., Logan, N. A., & DeVos, P.
(2004). Polyphasic Characterization of Bacillus coagulans Strains, Illustrating
Heterogeneity within this Species, and Emended Description of the Species.
Systematic and Applied Microbiology, 27(1), 50–60. https://doi.org/10.1078/0723-
2020-00250
Desai, S. V., & Varadaraj, M. C. (2010). Behavioural pattern of vegetative cells and
spores of Bacillus cereus as affected by time-temperature combinations used in
processing of Indian traditional foods. Journal of Food Science and Technology,
47(5), 549–556. https://doi.org/10.1007/s13197-010-0099-9

52
4 1
Endres, J. R., Qureshi, I., Farber, T., Hauswirth, J., Hirka, G., Pasics, I., & Schauss, A. G.
(2011). One-year chronic oral toxicity with combined reproduction toxicity study of
a novel probiotic, Bacillus coagulans, as a food ingredient. Food and Chemical
Toxicology, 49(5), 1174–1182. https://doi.org/10.1016/j.fct.2011.02.012
Fain, A. R., Line, E. J., Moran, A. B., Martin, M. L., Lechowich, R. V., Carosella, J. M.,
& Brown, W. L. (1991). Lethality of Heat to Listeria monocytogenes Scott A: D-
Value and Z-Value Determinations in Ground Beef and Turkey. Journal of Food
Protection, 54(10), 756–761. https://doi.org/10.4315/0362-028x-54.10.756
Fakhry, S., Sorrentini, I., Ricca, E., De Felice, M., & Baccigalupi, L. (2008).
Characterization of spore forming Bacilli isolated from the human gastrointestinal
tract. Journal of Applied Microbiology, 105(6), 2178–2186.
https://doi.org/10.1111/j.1365-2672.2008.03934.x
FDA. (2017a). BAM R32: Gram Stain. Retrieved from
https://www.fda.gov/Food/FoodScienceResearch/LaboratoryMethods/ucm062229.ht
m
FDA. (2017b). BAM R59: Phosphate-Buffered Saline (PBS), pH 7.4. Retrieved from
https://www.fda.gov/Food/FoodScienceResearch/LaboratoryMethods/ucm062268.ht
m
Gotcheva, V., Hristozova, E., Hristozova, T., Guo, M., Roshkova, Z., & Angelov, A.
(2002). Assessment of Potential Probiotic Properties of Lactic Acid Bacteria and
Yeast Strains. Food Biotechnology, 16(3), 211–225. https://doi.org/10.1081/FBT-
120016668
Haberbeck, L. U., Alberto da Silva Riehl, C., de Cássia Martins Salomão, B., & Falcão

53
4 1
de Aragão, G. M. (2012). Bacillus coagulans spore inactivation through the
application of oregano essential oil and heat. LWT - Food Science and Technology,
46(1), 267–273. https://doi.org/10.1016/j.lwt.2011.09.021
Hill, C., Guarner, F., Reid, G., Gibson, G. R., Merenstein, D. J., Pot, B., Morelli, L.,
Canani, R. B., Flint, H. J., Salminen, S., Calder, P. C., & Sanders, M. E. (2014). The
International Scientific Association for probiotics and prebiotics consensus
statement on the scope and appropriate use of the term probiotic. National Review
Gastroenterol Hepatol, 11(11), 506–514. https://doi.org/10.1038/nrgastro.2014.66
Janštová, B., & Lukášová, J. (2001). Heat resistance of bacillus spp. spores isolated from
cow’s milk and farm environment. Acta Veterinaria Brno, 70(2), 179–184.
Keller, D., Farmer, S., McCartney, A., & Gibson, G. (2010). Bacillus coagulans as a
probiotic. Food Science and Technology Bulletin: Functional Foods, 7, 103–109.
https://doi.org/10.1616/1476-2137.16015.
Kumar, S., Stecher, G., & Tamura, K. (2016). MEGA7: Molecular Evolutionary Genetics
Analysis version 7.0 for bigger datasets. Molecular Biology and Evolution, 33,
1870–1874.
Majeed, M., Nagabhushanam, K., Natarajan, S., Sivakumar, A., Eshuis-de Ruiter, T.,
Booij-Veurink, J., de Vries, Y. P., & Ali, F. (2016). Evaluation of genetic and
phenotypic consistency of Bacillus coagulans MTCC 5856: a commercial probiotic
strain. World Journal of Microbiology and Biotechnology, 32(4), 1–12.
https://doi.org/10.1007/s11274-016-2027-2
Murphy, R. Y., Osaili, T., Duncan, L. K., & Marcy, J. A. (2004). Effect of Sodium
Lactate on Thermal Inactivation of Listeria monocytogenes and Salmonella in

54
4 1
Ground Chicken Thigh and Leg Meat. Poultry Science, 83, 1218–1225.
https://doi.org/10.4315/0362-028x-67.7.1403
Nicholson, W. L., Munakata, N., Horneck, G., Setlow, P., Melosh, H. J., & Setlow, P.
(2003). Resistance of Bacillus Endospores to Extreme Terrestrial and Extraterrestrial
Environments. Microbiology and Molecular Biology Reviews, 64(3), 548–572.
https://doi.org/10.1128/mmbr.64.3.548-572.2000
Orrù, L., Salvetti, E., Cattivelli, L., Lamontanara, A., Michelotti, V., Capozzi, V., Spano,
G., Keller, D., Cash, H., Martina, A., Torriani, S., & Felis, G. E. (2014). Draft
Genome Sequence of Bacillus coagulans GBI-30, 6086, a Widely Used Spore-
Forming Probiotic Strain. Genome Announcement, 2(6), 6–7.
https://doi.org/10.1128/genomeA.01080-14.Copyright
Palop, A., Raso, J., Pagán, R., Condón, S., & Sala, F. J. (1999). Influence of pH on heat
resistance of spores of Bacillus coagulans in buffer and homogenized foods.
International Journal of Food Microbiology, 46(3), 243–249.
https://doi.org/10.1016/S0168-1605(98)00199-8
Ratna Sudha, M., Chauhan, P., Dixit, K., Babu, S., & Jamil, K. (2010). Molecular typing
and probiotic attributes of a new strain of Bacillus coagulans - Unique IS-2: A
potential biotherapeutic agent. Genetic Engineering and Biotechnology Journal,
2010(1986), 1–20.
Sanders, M. E., Benson, A., Lebeer, S., Merenstein, D. J., & Klaenhammer, T. R. (2018).
Shared mechanisms among probiotic taxa: implications for general probiotic claims.
Current Opinion in Biotechnology, 49(Figure 1), 207–216.
https://doi.org/10.1016/j.copbio.2017.09.007

55
4 1
Tamura, K., & Nei, M. (1993). Estimation of the number of necleotide substitutions in
the control region of mitrochondrial DNA in humans and chimpanzees. Molecular
Biology and Evolution, 10, 512–526.
U.S. Department of Health and Human Services, Public Health Service, & Food and
Drug Administration. (2017). Grade “A” Pasteurized Milk Ordinance (Includes
provisions from the Grade “A” Condensed and Dry Milk Products and Condensed
and Dry Whey-Supplement I to the Grade “A” PMO) 2017 Revision. Retrieved
from
https://www.fda.gov/downloads/Food/GuidanceRegulation/GuidanceDocumentsReg
ulatoryInformation/Milk/UCM612027.pdf
Upadrasta, A., Pitta, S., & Madempudi, R. S. (2016). Draft Genome Sequence of the
Spore-Forming Probiotic Strain Bacillus coagulans Unique IS-2 . Genome
Announcements, 4(2), 7–8. https://doi.org/10.1128/genomea.00225-16

56
4 1
CHAPTER 3: SURVIVAL AND GERMINATION OF BACILLUS COAGULANS
UNIQUE IS-2 IN THE GASTROINTESTINAL TRACT

57
4 1
3.1. Introduction
Probiotics are defined as “live microorganisms that, when administered in adequate
amounts, confer a health benefit on the host” (Hill et al., 2014). While there is no official
intake level of probiotics for inclusion in food, it is generally accepted that probiotic
foods should be formulated to contain between 107 – 109 CFU/g of a product (Ashraf &
Shah, 2011; Konuray & Erginkaya, 2018). At these levels, probiotics are able to confer
health benefits upon reaching the colon by increasing the growth of good bacteria and
hindering the growth of undesirable pathogenic bacteria (Sanders, 2000). As probiotics
are becoming more popular for inclusion into both animal and human food products, to
improve gut health, probiotic research has increased. The main properties researchers are
focusing on are the microorganisms’ tolerance to acid and bile conditions, growth and
propagation in the gut, and the viability during processing and storage (Kerry et al.,
2018).
Tolerance to acidic and bile conditions are important properties of a probiotic
microorganism. For probiotics consumed orally, the target organ is the gut, which is
where they will grow and proliferate to provide a health benefit. After consumption of
the probiotic organism, it will travel through the gastrointestinal tract encountering
adverse conditions that may prevent it from reaching the gut, such as the acidic
conditions of the stomach and the presence of bile in the small intestine. While the
consumption of food can lower the acidity of the stomach, its pH is most commonly
between pH 2.5 – 3.5; however it can be between pH 1.5 – 6.0 at its extremes (Holzapfel,
Haberer, Snel, Schillinger, & Huis In’T Veld, 1998; Huang & Adams, 2004). These are

58
4 1
potentially harmful conditions to microorganisms and the tolerance to these conditions is
characteristic of probiotic strains. Popular probiotics strains from the Lactobacillus and
Bifidobacterium genera have been chosen because of their higher tolerance to acid and
bile conditions (Dunne et al., 2001). However, research has shown that some lactic acid
bacteria have a significant decrease in populations at pH 2.0, which means they may
survive but could benefit from some protection during transit through the stomach
(Gotcheva et al., 2002). Typically, their percent survival has been observed anywhere
from 1-15%, which is relatively low (Keller et al., 2019).
Due to the variable survivability of common probiotics, a more recent trend in the
probiotic industry is the use of sporeforming bacteria as probiotics. Spores are dormant
life forms that are resistant to a number of harsh environments, such as heat, cold, acid,
and dryness (Nicholson et al., 2003). During the vegetative life cycle, the cell is
continually monitoring the environment for unfavorable conditions. When nutrients start
to deplete or the environment changes to undesirable conditions, the cells can detect these
and switch to the production of endospores (Nicholson et al., 2003). When this happens,
the mother cell creates a protein rich coat, that surrounds a dehydrated chromosome as
protection (Cutting, 2011; Henriques & Moran, Jr., 2007). This spore is then almost
completely metabolically inactive, but can survive for years in this dormant state. Then
upon reaching a suitable environment, the spore can germinate to produce vegetative
cells again (Moir, 2006).

59
4 1
One popular sporeformer being considered for its probiotic properties is Bacillus
coagulans. This organism is Gram-positive, facultative, rod-shaped, lactic acid
producing, motile and sporeforming bacteria (Payot, Chemaly, & Fick, 1999). Therefore,
the spore form of B. coagulans should be a more resistant structure than its vegetative
cell and would theoretically provide further protection against acid conditions and bile
presence. Some strains of Bacillus vegetative cells have been observed to have resistance
to low pH environments and bile presence (Lee et al., 2012). After survival through the
upper gastrointestinal tract, B. coagulans spores will be expected to reach the gut and
then begin to germinate.
There have been studies done showing that B. coagulans spores have increased growth
performance effects in chickens and promote growth of healthy microorganisms in the
gut of chickens and pigs (Hung et al., 2012; Wu et al., 2018; Zhou, Wang, Gu, & Li,
2010). Bacillus coagulans is also capable of producing lactic acid and coagulin, an
antibacterial substance, which has been shown to inhibit the growth of Listeria,
Enterococcus and Leuconostoc (Hyronimus, Le Marrec, & Urdaci, 1998). Baron (2009)
also observed that the consumption of B. coagulans led to an increase in T-cell
production of TNF-alpha, a type of messenger protein, when exposed to adenovirus and
influenza A (Baron, 2009). More specifically associated with the requirements for
probiotic cultures, Tam and colleagues were able to use a molecular approach to observe
germination, growth and resporulation of Bacillus subtilis spores using a mouse model
(Tam et al., 2006). Because B. subtilis shares some similar characteristics with B.
60
4 1
coagulans, the results by Tam et al. (2006) may indicate an ability by B. coagulans to
also germinate, grow and resporulate in the gut.
Therefore, the purpose of this research was to evaluate the acid and bile tolerance of the
spores of B. coagulans Unique IS-2 in a simulated stomach environment and the
germination of these spores in an in vitro gut environment. These are both important
properties that an organism used as a probiotic should have.
3.2. Materials and Methods
3.2.1. Bacterial Culture
A lyophilized powder containing spores of Bacillus coagulans Unique IS-2 was obtained
from Nebraska Cultures, LLC, which is now UAS Laboratories, LLC (Wausau, WI).
Lyophilized culture was stored in 4˚C until use.
3.2.2. In vitro Stomach pH and Bile Salts Stability
A modified version of Hyronimus et al. (2000) was used for pH and bile salts stability
studies. Tubes of 10 ml Tryptic Soy Broth (TSB) were adjusted to pH 2.0, 2.5, and 3.0
using 3M HCl. The 10 ml TSB tubes containing 0.3% bile salts were also prepared along
with control tubes, which included 10 ml of TSB without the addition of acid or bile salts.
A spore suspension was prepared by adding lyophilized spores of Bacillus coagulans
Unique IS-2, concentration of ~2.0 x 10¹¹ CFU/g, into phosphate-buffered saline to
achieve a concentration of 1010 CFU/ml. The spore suspension was heat treated at 80˚C

61
4 1
for 12 minutes and was then immediately chilled in an ice bath. A 10 µL aliquot of spore
suspension was inoculated into each modified TSB tube to achieve a bacterial suspension
of approximately 1 x 10⁸ CFU/ml.
Modified TSB tubes were incubated at 37˚C and pulled for enumeration at 0, 0.5, 1, 2 and
4 hours. Samples were serially diluted using Butterfield’s phosphate-buffered dilution
water. Dilutions were spread-plated on Tryptic Soy Agar (TSA) in duplicate and
incubated aerobically at 55˚C for 48 hours. Survival curves and survival rates (percent of
initial concentration recovered after 4 hours) were calculated and compared to control.
3.2.3. In vitro Digestion
To determine germination of B. coagulans Unique IS-2 in vitro, a fecal slurry was used to
simulate the gut environment. Preparation of the fecal slurry followed a modified version
of the experiment outlined in Hartzell et al. (2013). Fecal samples were obtained from
adult volunteers within the Department of Food Science and Technology at the
University of Nebraska-Lincoln (IRB # 20171017517EP). Volunteers did not take
probiotics regularly and had not been recently ill. Fecal samples were collected using
specimen collection kits. Upon receipt of fecal sample, all processing of the sample was
done in the anaerobic chamber. Ten g of the fecal sample was added to 90 ml of
phosphate-buffered saline plus 10% glycerol. The mixture was hand blended until
completely mixed, then filtered through 4 layers of cheese cloth. Filtered fecal slurry was
then stored in sterile conical tubes at -80˚C until use.

62
4 1
Fermentation broth was prepared by mixing 1 g peptone, 1 g yeast extract, 0.05 g NaCl,
0.25 g cysteine HCl, 0.25 g bile salts, 1 mL tween 80, 5 µL vitamin K (added after
autoclaving), 2 mL 0.025% (w/v) resazurin solution, 0.5 mL MgSO4•7H2O (10 mg/ml),
0.5 mL CaCl2•2H2O (10 mg/ml), 0.5 mL hemin (5 mg/ml) dissolved in Dimethyl
sulfoxide (DMSO), 0.04g K2HPO4, and 1 g NaHCO3 into 400 ml of distilled water. The
pH of the broth was adjusted to pH 7 using 3M HCl, then the volume was adjusted to 500
mL with additional distilled water followed by autoclaving for sterility.
A spore suspension was prepared by adding 1 g of lyophilized spores of Bacillus
coagulans Unique IS-2, concentration of ~2.0 x 10¹¹ CFU/g, into 99 ml of phosphate-
buffered saline. To keep conditions anaerobic, the preparation of the experiment was
done in an anaerobic chamber. To create the gut environment, the fermentation broth
was mixed with the filtered fecal slurry in a 6:3 ratio. The fecal slurry provided by each
volunteer served as experimental replicates. The fermentation broth and fecal slurry
mixture was then split in half to provide one portion as control and another in which the
spore suspension was added to achieve a bacterial concentration of 108 CFU/ml.
Both the inoculated and control fecal slurry was further split into sterile conical tubes (at
least 5) to allow for sampling over time. For each fecal slurry, one control and inoculated
samples were set aside to be enumerated for spores at time zero while the remaining
samples were anaerobically incubated at 37˚C in a MaxQ 4000 benchtop incubator shaker
(Thermo Scientific, Marietta, OH), shaking at 130 rpm. From each volunteer, inoculated
and control samples were split into four sealed containers added with an anaeropack
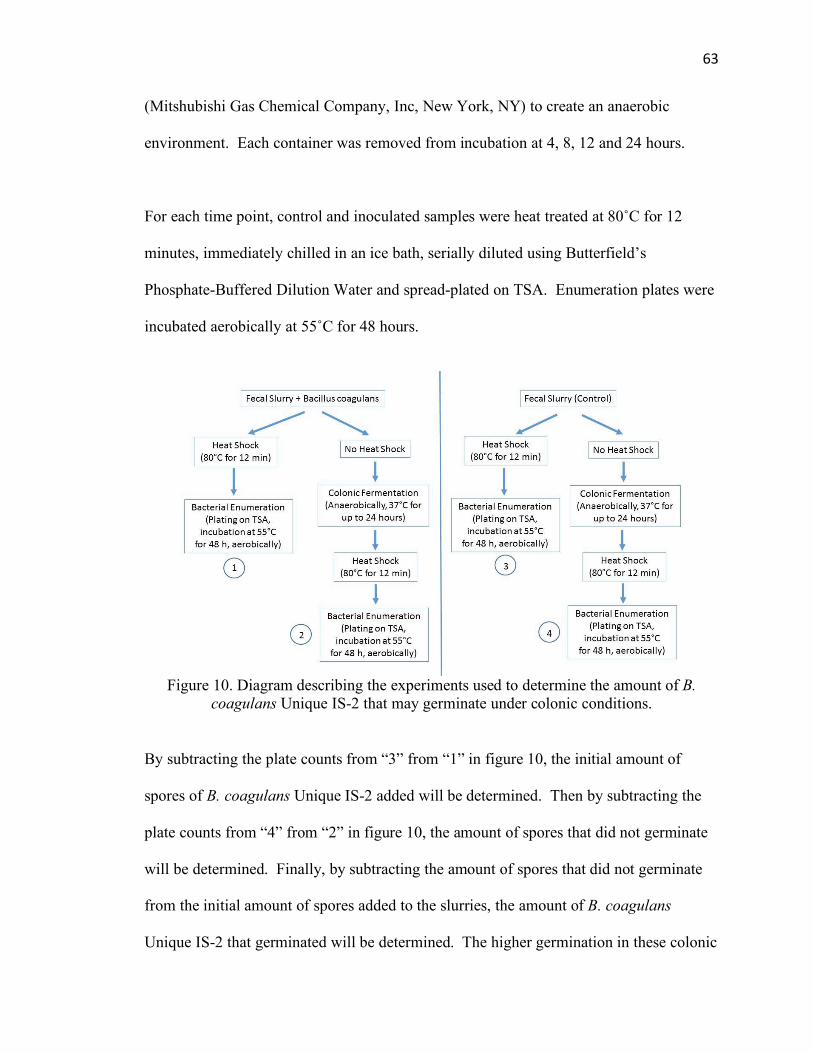
63
4 1
(Mitshubishi Gas Chemical Company, Inc, New York, NY) to create an anaerobic
environment. Each container was removed from incubation at 4, 8, 12 and 24 hours.
For each time point, control and inoculated samples were heat treated at 80˚C for 12
minutes, immediately chilled in an ice bath, serially diluted using Butterfield’s
Phosphate-Buffered Dilution Water and spread-plated on TSA. Enumeration plates were
incubated aerobically at 55˚C for 48 hours.
Figure 10. Diagram describing the experiments used to determine the amount of B. coagulans Unique IS-2 that may germinate under colonic conditions.
By subtracting the plate counts from “3” from “1” in figure 10, the initial amount of
spores of B. coagulans Unique IS-2 added will be determined. Then by subtracting the
plate counts from “4” from “2” in figure 10, the amount of spores that did not germinate
will be determined. Finally, by subtracting the amount of spores that did not germinate
from the initial amount of spores added to the slurries, the amount of B. coagulans
Unique IS-2 that germinated will be determined. The higher germination in these colonic
64
4 1
conditions that is observed is the desired outcome. Germination percentage was
determined by subtracting the B. coagulans Unique IS-2 spore counts at the time point 24
hours from the initial amount of added B. coagulans Unique IS-2 spore count at time 0,
divided by the initial counts of B. coagulans Unique IS-2 and multiplied by 100.
3.2.4. Statistical Analysis
Analysis of variance was used to compare the results obtained from the different
treatments in the acid and bile salts tolerance experiment and to compare germination
over time in the in vitro gut environment. Statistics were run on the survival percentage
for the acid and bile salts tolerance and on the average counts per time for the in vitro gut
environment at the 5% level of significance. Statistical analysis was conducted using
SAS 9.4 (SAS, INC, Cary, NC).
3.3. Results and Discussion
3.3.1 In vitro Stomach pH and Bile Salts Stability
For a probiotic organism to provide health benefits, it first must reach the area in the
gastrointestinal tract that will be colonized. Therefore, it must first survive transit
through the stomach and small intestine. Throughout transit, the organism will encounter
the acidic condition of the stomach and the bile salts in the small intestine. A good
probiotic organism will be able to withstand these adverse conditions and will reach the
lower intestine where its positive impact would be accomplished. Thus, evaluating the
stability of B. coagulans spores in the presence of simulated gastric acid conditions and
bile salt becomes an essential part of characterizing this strain as a probiotic organism.

65
4 1
The survivability of B. coagulans Unique IS-2 in these adverse conditions was evaluated
in a broth for up to 4 hours. Survival curves for each treatment are shown in figure 11.
The average percent survival for each treatment was calculated and compared to the
control (Table 4).
Figure 11. Acid and Bile Salts Tolerance of Bacillus coagulans Unique IS-2 spores over 4 hours at 37˚C.
B. coagulans spores were able to survive in all conditions tested with only slight
reductions in counts for up to 4 hours. The average survival ranged from 91.7% to 98.1%
in 0.3% bile salts to pH 3.0, respectively. As expected, lower survivability of spores was
observed in the lower pH conditions and in the presence of bile salts. Previous research
with the same strain Unique IS-2 has showed similar acid and bile resistance results
where, at pH 2.0, pH 3.0 and 1% bile salts, there was only a 1 log reduction over 3 hours
(Ratna Sudha et al., 2010). These results are comparable to Hyronimus et al. (2000),
0.00
1.00
2.00
3.00
4.00
5.00
6.00
7.00
8.00
0 0.5 1 1.5 2 2.5 3 3.5 4 4.5
B. co
agul
ans U
niqu
e IS
-2 (L
og C
FU/m
L)
Time (h)
B. coagulans Unique IS-2 Acid/Bile Salt Resistance
pH 2.0 pH 2.5 pH 3.0 0.3% Bile Salts Control

66
4 1
where B. coagulans showed a strong resistance to bile presence. Majeed and colleagues,
also observed a 2 log reduction at pH 1 after 4 hours and growth of B. coagulans in the
presence of 0.3% and 0.5% bile presence (Majeed, Nagabhushanam, Natarajan,
Sivakumar, Eshuis-de Ruiter, et al., 2016). Le Duc and colleagues, studied the survival
of Bacillus subtilis spores in a simulated gastrointestinal tract environment and observed
97% and 94% survival of B. subtilis spores in a pH 2.0 environment and in the presence
of bile salts, respectively, which is comparable to the survival percentages for B.
coagulans spores observed here (Le Duc et al., 2004).
Ganeden Biotech used an in vitro model of the stomach and small intestine, called a TIM-
1, to observe a 70% survival of their B. coagulans probiotic strain, GanedenBC30, in
simulated stomach conditions (Maathuis et al., 2010). Based on the results reported here
and by others in the scientific literature, there is strong evidence that B. coagulans is
resistant to low pH and bile conditions, which indicates it would be able to survive transit
through the upper gastrointestinal tract as expected of a good probiotic strain.
Table 4. Summary of Bacillus coagulans Unique IS-2 Survival in Acid and Bile Salts
Treatment
Average Survival
(% ± SD)1
Control 96.28 ± 3.01a,b
pH 2.0 91.87 ± 2.16b
pH 2.5 91.98 ± 3.90b
pH 3.0 98.06 ± 2.18a
0.3% Bile Salts 91.65 ± 0.29b
1Treatments with different letters within the same column are significantly different (p<0.05)

67
4 1
3.3.2. In Vitro Digestion
The most important probiotic property of an organism is its ability to grow in the lower
gastrointestinal tract because this is where it will confer the health benefit to the host.
Therefore, fecal samples were used to simulate the gut environment in order to observe
the ability of Bacillus coagulans Unique IS-2 spores to germinate. Seven volunteers
provided fecal samples to this experiment and the concentration of spores that were able
to germinate in the sample during incubation simulating conditions encountered in the gut
at each time point can be seen in Figure 12. There was no significant difference in
germination among time points (p<0.05).
Each individual had a slightly different effect on the germination of added spores. The
percentage of germination was variable with the highest at 19.85% and lowest at -3.95%
for samples A and D, respectively (Table 5). Of the seven slurry samples, three had a
negative germination percentage. This outcome could be a result of some of the spores
germinating and replicating as vegetative cells, but then resporulating throughout the
experimental period (24 hours). This behavior has been observed in previous research
where Bacillus subtilis spores were observed to germinate, grow and resporulate in the
gut (Tam et al., 2006). This could also be an explanation for the increasing trend of
germination within the first 8 hours and followed by a decrease after 8 hours.

68
4 1
Figure 12. Bacillus coagulans Unique IS-2 survival in in vitro gut environment. Each volunteer is designated with a letter A-G. There is no significance between population of
spores at each time point (p<0.05).
Variation among fecal slurries result from the differences in the resident microbiota of
the intestinal tract of the volunteers participating in the study. Due to these differences,
microorganisms that are introduced into this environment may be more or less able to
compete with the resident microbiota in order to establish themselves. The results
presented here show a germination percentage range of -3.95% to 19.9% with an average
of 6.32% (Table 5) for B. coagulans Unique IS-2 in the gut environment. This may be
considered a very low percentage of germination. However, in 2010, Maathuis et al,
using an in vitro stomach and small intestine model (TIM-1), also observed a 10%
germination for the B. coagulans GanedenBC30. More recently, Keller et al. (2019) used
a dynamic, computer-controlled model of the adult human gastrointestinal tract to
reevaluate germination rates for GanedenBC30 in the gut. In this new system a meal was
-1.50
-1.00
-0.50
0.00
0.50
1.00
1.50
2.00
2.50
3.00
0 5 10 15 20 25
B. co
agul
ans G
erm
inat
ion
(Log
CFU
/mL)
Time (Hours)
Bacillus coagulans Unique IS-2 Germination in in vitro Gut Environment
A B C D E F G

69
4 1
added along with the probiotic organism while evaluating its germination (Keller et al.,
2019). According to the authors, due to the added meal factor in this study, there were
more germination triggers which increased the observed germination of B. coagulans
spores to greater than 90%.
Table 5. Percentage of Bacillus coagulans Unique IS-2 spore germination in each of the fecal slurries under evaluation.
Sample A B C D E F G Average
Germination (%) 19.85
2.20 -0.77 -3.95 10.28 13.75 -0.47 6.32
The results from this experiment showed that within an in vitro gut environment only a
small percentage of B. coagulans spores germinated. The germination observed here was
on average 6%, however, there is no research available on how much germination is
actually required to promote a health benefit. However, there is research showing that
while the consumption of probiotics may help alleviate certain health issues, the removal
of the probiotic treatment also showed a relapse of that health issue (Tamboli,
Caucheteux, Cortot, Colombel, & Desreumaux, 2003). Therefore, the beneficial
organisms may not need to colonize the gut long term, but instead be able to temporarily
display the resident microbiota. Further, there are multiple human clinical studies
describing that oral intake of B. coagulans has increased resident populations of
beneficial bacteria in the elderly, lowered cholesterol and has improved symptoms of
rheumatoid arthritis, irritable bowel syndrome, major depressive disorder associated with
irritable bowel syndrome and intestinal gas symptoms (Hun, 2009; Kalman et al., 2009;
Majeed, Majeed, et al., 2018; Majeed, Nagabhushanam, Natarajan, Sivakumar, Ali, et al.,
2016; Majeed, Nagabhushanam, Arumugam, Majeed, & Ali, 2018; Mandel et al., 2010;
Nyangale, Farmer, Keller, Chernoff, & Gibson, 2014). These clinical studies, in addition

70
4 1
to other available research and the results reported in this study, low germination of B.
coagulans between 6-10% may be enough to provide the desired effect. Further research
is needed to evaluate what level of germination may truly be required to observe the
desired health benefits.
3.4. Conclusion
Bacillus coagulans Unique IS-2 displayed strong survivability through simulated
stomach and small intestine conditions. Even at the lowest pH level tested and in the
presence of bile salts, B. coagulans Unique IS-2 spores had greater than 91%
survivability. These results indicate its ability to survive the adverse conditions
encountered in the upper gastrointestinal tract of humans. However, the germination of
spores in simulated gut conditions was, on average 6% germination, with the fecal
slurries of some individuals showing a negative overall germination. This indicates that
although the spores can survive travel to reach the gut, only a small percentage of the
spores will be able to germinate.
Therefore, further clinical testing in humans and animals is needed to evaluate more
conclusively what happens to the B. coagulans spores once they reach the gut. This
research has shown that B. coagulans Unique IS-2 is capable of germinating in an in vitro
gut environment but more research is needed to validate the actual effect of this
germination, specifically regarding any potential health benefit that may be experienced
by the host.

71
4 1
3.5. References
Ashraf, R., & Shah, N. P. (2011). Selective and differential enumerations of
Lactobacillus delbrueckii subsp. bulgaricus, Streptococcus thermophilus,
Lactobacillus acidophilus, Lactobacillus casei and Bifidobacterium spp. in yoghurt -
A review. International Journal of Food Microbiology, 149(3), 94–208.
https://doi.org/10.1016/j.ijfoodmicro.2011.07.008
Baron, M. (2009). A patented strain of Bacillus coagulans increased immune response to
viral challenge. Postgraduate Medicine, 121(2), 114–118.
https://doi.org/10.3810/pgm.2009.03.1971
Cutting, S. M. (2011). Bacillus probiotics. Food Microbiology, 28, 214–220.
https://doi.org/10.1016/j.fm.2010.03.007
Dunne, C., O’Mahony, L., Murphy, L., Thornton, G., Morrissey, D., O’Halloran, S.,
Feeney, M., Flynn, S., Fitzgerald, G., Daly, C., Kiely, B., O’Sullivan, G. C.,
Shanahan, F., & Collins, J. K. (2001). In vitro selection criteria for probiotic bacteria
of human origin : correlation with in vivo findings 1 – 4, 73, 386–392.
Gotcheva, V., Hristozova, E., Hristozova, T., Guo, M., Roshkova, Z., & Angelov, A.
(2002). Assessment of Potential Probiotic Properties of Lactic Acid Bacteria and
Yeast Strains. Food Biotechnology, 16(3), 211–225. https://doi.org/10.1081/FBT-
120016668
Hartzell, A. L., Maldonado-Gómez, M. X., Hutkins, R. W., & Rose, D. J. (2013).
Synthesis and in vitro digestion and fermentation of acylated inulin. Bioactive
Carbohydrates and Dietary Fibre, 1(1), 81–88.
https://doi.org/10.1016/j.bcdf.2013.01.004

72
4 1
Henriques, A. O., & Moran, Jr., C. P. (2007). Structure, Assembly, and Function of the
Spore Surface Layers. Annual Review of Microbiology, 61(1), 555–588.
https://doi.org/10.1146/annurev.micro.61.080706.093224
Hill, C., Guarner, F., Reid, G., Gibson, G. R., Merenstein, D. J., Pot, B., Morelli, L.,
Canani, R. B., Flint, H. J., Salminen, S., Calder, P. C., & Sanders, M. E. (2014). The
International Scientific Association for probiotics and prebiotics consensus
statement on the scope and appropriate use of the term probiotic. National Review
Gastroenterol Hepatol, 11(11), 506–514. https://doi.org/10.1038/nrgastro.2014.66
Holzapfel, W. H., Haberer, P., Snel, J., Schillinger, U., & Huis In’T Veld, J. H. J. (1998).
Overview of gut flora and probiotics. International Journal of Food Microbiology,
41(2), 85–101. https://doi.org/10.1016/S0168-1605(98)00044-0
Huang, Y., & Adams, M. C. (2004). In vitro assessment of the upper gastrointestinal
tolerance of potential probiotic dairy propionibacteria. International Journal of Food
Microbiology, 91(3), 253–260. https://doi.org/10.1016/j.ijfoodmicro.2003.07.001
Hun, L. (2009). Original Research: Bacillus coagulans Significantly Improved
Abdominal Pain and Bloating in Patients with IBS. Postgraduate Medicine, 121(2),
119–124. https://doi.org/10.3810/pgm.2009.03.1984
Hung, A. T., Lin, S.-Y., Yang, T.-Y., Chou, C.-K., Liu, H.-C., Lu, J.-J., Wang, B., Chen,
S, -Y., & Lien, T.-F. (2012). Effects of Bacillus coagulans ATCC 7050 on growth
performance, intestinal morphology, and microflora composition in broiler chickens.
Animal Production Science, 52(9), 874–879. https://doi.org/10.1071/an11332
Hyronimus, B., Le Marrec, C., Sassi, A. H., & Deschamps, A. (2000). Acid and bile
tolerance of spore-forming lactic acid bacteria. International Journal of Food

73
4 1
Microbiology, 61, 193–197.
Hyronimus, B., Le Marrec, C., & Urdaci, M. C. (1998). Coagulin, a bacteriocin-like-
inhibitory substance produced by Bacillus coagulans I. Journal of Applied
Microbiology, 85(1), 42–50.
Kalman, D. S., Schwartz, H. I., Alvarez, P., Feldman, S., Pezzullo, J. C., & Krieger, D. R.
(2009). A prospective, randomized, double-blind, placebo-controlled parallel-group
dual site trial to evaluate the effects of a Bacillus coagulans-based product on
functional intestinal gas symptoms. BMC Gastroenterology, 9(1), 85.
https://doi.org/10.1186/1471-230X-9-85
Keller, D., Verbruggen, S., Cash, H., Farmer, S., & Venema, K. (2019). Spores of
Bacillus coagulans GBI-30, 6086 show high germination, survival and enzyme
activity in a dynamic, computer-controlled in vitro model of the gastrointestinal
tract. Beneficial Microbes, 10(1), 77–87. https://doi.org/10.3920/BM2018.0037
Kerry, R. G., Patra, J. K., Gouda, S., Park, Y., Shin, H. S., & Das, G. (2018). Benefaction
of probiotics for human health: A review. Journal of Food and Drug Analysis,
26(3), 927–939. https://doi.org/10.1016/j.jfda.2018.01.002
Konuray, G., & Erginkaya, Z. (2018). Potential Use of Bacillus coagulans in the Food
Industry. Foods, 7(6), 92. https://doi.org/10.3390/foods7060092
Le Duc, H., Hong, H. a, Barbosa, T. M., Henriques, A. O., & Cutting, S. M. (2004).
Characterization of Bacillus Probiotics Available for Human Use Characterization
of Bacillus Probiotics Available for Human Use. Applied and Environmental
Microbiology, 70(4), 2161–2171. https://doi.org/10.1128/AEM.70.4.2161
Lee, J., Park, I., Choi, Y., & Cho, J. (2012). Bacillus strains as feed additives: In vitro

74
4 1
evaluation of its potential probiotic properties, 577–585.
Maathuis, A. J. H., Keller, D., & Farmer, S. (2010). Survival and metabolic activity of the
GanedenBC30 strain of Bacillus coagulans in a dynamic in vitro model of the
stomach and small intestine. Beneficial Microbes, 1(1), 31–36.
https://doi.org/10.3920/BM2009.0009
Majeed, M., Majeed, S., Nagabhushanam, K., Arumugam, S., Beede, K., & Ali, F.
(2018). Evaluation of the in vitro cholesterol-lowering activity of the probiotic strain
Bacillus coagulans MTCC 5856. International Journal of Food Science and
Technology, 212–220. https://doi.org/10.1111/ijfs.13926
Majeed, M., Nagabhushanam, K., Arumugam, S., Majeed, S., & Ali, F. (2018). Bacillus
coagulans MTCC 5856 for the management of major depression with irritable
bowel syndrome: A randomised, double-blind, placebo controlled, multi-centre,
pilot clinical study. Food and Nutrition Research, 62, 1–15.
https://doi.org/10.29219/fnr.v62.1218
Majeed, M., Nagabhushanam, K., Natarajan, S., Sivakumar, A., Ali, F., Pande, A.,
Majeed, S., & Karri, S. K. (2016). Bacillus coagulans MTCC 5856 supplementation
in the management of diarrhea predominant Irritable Bowel Syndrome: a double
blind randomized placebo controlled pilot clinical study. Nutrition Journal, 15(1),
21. https://doi.org/10.1186/s12937-016-0140-6
Majeed, M., Nagabhushanam, K., Natarajan, S., Sivakumar, A., Eshuis-de Ruiter, T.,
Booij-Veurink, J., de Vries, & Ali, F. (2016). Evaluation of genetic and phenotypic
consistency of Bacillus coagulans MTCC 5856: a commercial probiotic strain.
World Journal of Microbiology and Biotechnology, 32(4), 1–12.
75
4 1
https://doi.org/10.1007/s11274-016-2027-2
Mandel, D. R., Eichas, K., & Holmes, J. (2010). Bacillus coagulans: a viable adjunct
therapy for relieving symptoms of rheumatoid arthritis according to a randomized,
controlled trial. BMC Complementary and Alternative Medicine, 10, 1–7.
Moir, A. (2006). How do spores germinate? Journal of Applied Microbiology, 101(3),
526–530. https://doi.org/10.1111/j.1365-2672.2006.02885.x
Nicholson, W. L., Munakata, N., Horneck, G., Setlow, P., Melosh, H. J., & Setlow, P.
(2003). Resistance of Bacillus Endospores to Extreme Terrestrial and Extraterrestrial
Environments. Microbiology and Molecular Biology Reviews, 64(3), 548–572.
https://doi.org/10.1128/mmbr.64.3.548-572.2000
Nyangale, E. P., Farmer, S., Keller, D., Chernoff, D., & Gibson, G. R. (2014). Effect of
prebiotics on the fecal microbiota of elderly volunteers after dietary supplementation
of Bacillus coagulans GBI-30, 6086. Anaerobe, 30, 75–81.
https://doi.org/10.1016/j.anaerobe.2014.09.002
Payot, T., Chemaly, Z., & Fick, M. (1999). Lactic acid production by Bacillus
coagulans—kinetic studies and optimization of culture medium for batch and
continuous fermentations. Enzyme and Microbial Technology, 24(3–4), 191–199.
https://doi.org/10.1016/S0141-0229(98)00098-2
Ratna Sudha, M., Chauhan, P., Dixit, K., Babu, S., & Jamil, K. (2010). Molecular typing
and probiotic attributes of a new strain of Bacillus coagulans - Unique IS-2: A
potential biotherapeutic agent. Genetic Engineering and Biotechnology Journal,
2010(1986), 1–20.
Sanders, M. E. (2000). Considerations for Use of Probiotic Bacteria to Modulate Human

76
4 1
Health. Journal of Nutrition, 384–390.
Tam, N. K. M., Uyen, N. Q., Hong, H. A., Duc, L. H., Hoa, T. T., Claudia, R., Henriques,
A. O., & Cutting, S. M. (2006). The Intestinal Life Cycle of Bacillus subtilis and
Close Relatives †. Journal of Bacteriology, 188(7), 2692–2700.
https://doi.org/10.1128/JB.188.7.2692
Tamboli, C. P., Caucheteux, C., Cortot, A., Colombel, J. F., & Desreumaux, P. (2003).
Probiotics in inflammatory bowel disease: A critical review. Bailliere’s Best
Practice and Research in Clinical Gastroenterology, 17(5), 805–820.
https://doi.org/10.1016/S1521-6918(03)00076-3
Wu, T., Zhang, Y., Lv, Y., Li, P., Yi, D., Wang, L., Zhao, D., Chen, H., Gong, J., & Hou,
Y. (2018). Beneficial impact and molecular mechanism of Bacillus coagulans on
piglets’ intestine. International Journal of Molecular Sciences, 19(7), 1–17.
https://doi.org/10.3390/ijms19072084
Zhou, X., Wang, Y., Gu, Q., & Li, W. (2010). Effect of dietary probiotic, Bacillus
coagulans, on growth performance, chemical composition, and meat quality of
Guangxi Yellow chicken. Poultry Science, 89(3), 588–593.
https://doi.org/10.3382/ps.2009-00319

77
4 1
CHAPTER 4: EVALUATION OF STABILITY OF BACILLUS COAGULANS UNIQUE
IS-2 IN FOOD PRODUCTS
78
4 1
4.1. Introduction
There has been an increasing trend among consumers preferences for healthier and more
beneficial foods. Consumers are interested in eating foods that have no additives and
preservatives; as well as foods that are health promoting in order to achieve a healthier
lifestyle. This trend has led the food industry create the concept of functional foods.
These are foods that are consumed as part of an everyday diet that provides beneficial
effects on human health, such as reducing cholesterol or high blood pressure
(Charalampopoulos et al., 2002). Foods that fall under the umbrella term, functional
foods, are ones that have added synthesized food ingredients, naturally occurring
bioactive substances or added bioactive substances (Grajek et al., 2005). Among the
most commonly added ingredients are probiotics, which are microorganisms, that when
consumed in adequate amounts, confer a health benefit on the host (Hill et al., 2014).
The idea of health promoting organisms has been around for over 100 years when
Döderlein and Metchnikoff observed health benefits after the consumption of lactic acid
producing bacteria (De Vecchi & Drago, 2006). Now, as of 2017, the probiotic market is
over $1.8 billion USD and the food and beverage sector, as the largest sector in this
market, was greater than $125 million USD (Ahuja & Deb, 2018). As this market
continues to grow, so does the amount of research conducted on probiotics to evaluate
their viability in products and product application for new probiotic cultures and
alternative ways to expand the use of probiotics in food products.

79
4 1
The most commonly used probiotics are members from the Lactobacillus and
Bifidobacterium genera and they are most frequently included in refrigerated products,
such as milk, cheese, and yogurt among others. Currently, there are no industry
requirements associated with the amount of probiotic organisms needed for a health
benefit, however it is generally accepted that it should be 107-109 CFU/g of the product
(Ashraf & Shah, 2011; Konuray & Erginkaya, 2018). However, reports in the literature
have shown loss of viability of these organisms during the shelf life of the products.
During testing of yogurts, some were found to have viable probiotic counts that slowly
decreased throughout the shelf life of the product, with some containing less than the
levels claimed by the label by the last day of shelf life (Jayamanne & Adams, 2006). This
is an issue because there has to be a consumption of adequate amounts of probiotic
organisms for the host to receive health benefits. To address this problem, the probiotic
industry has invested in micro-encapsulation of probiotics, such as Lactobacillus
rhamnosus, L. acidophilus and Bifidobacterium lactis, to help protect the organism
during the shelf life of the product (Weinbreck et al., 2010). However, even micro-
encapsulation has its limitations and there is still much to be researched on new
technologies to improve the overall process (Martín et al., 2015).
A solution to viability issues has been the use of sporeforming bacteria as potential
probiotics. Namely, Bacillus coagulans is one sporeforming bacteria that has received
interest from the probiotic industry. Bacillus coagulans is a Gram positive, facultative,
rod and is capable of producing lactic acid and spores. This organism has optimum
temperature growth between 30-55˚C and an optimal pH growth between 5.5 – 6.5 (De

80
4 1
Vecchi & Drago, 2006). The sporeforming properties of B. coagulans is of interest to the
probiotic industry as the spore is a natural protection to extreme environments, such as
heat, cold, dryness and acid (Nicholson et al., 2003). The resistant nature of the spore
could be a benefit to the industry as it may allow the organism to survive harsh
processing and storage conditions better than vegetative cells.
The health promoting benefits of B. coagulans have been studied by researchers.
Animals studies have shown that ingestion of B. coagulans had antidiarrheal affects,
helped remedy hypercholesterolemia, improved some symptoms of Clostridium difficile
induced colitis and increased the population of lactic acid bacteria in the gut (Aminlari et
al., 2018; Bomko et al., 2017; Fitzpatrick et al., 2011; Majeed, Natarajan, et al., 2016;
Wu et al., 2018). In addition, this organism is considered safe for human consumption
and has found success in human clinical studies as an anti-diarrheal and secondary
treatment to antibiotic therapy (Endres et al., 2011; Majeed, Nagabhushanam, Natarajan,
Sivakumar, Ali, et al., 2016; Majeed & Nagabhushanam, 2016). It has also shown
positive results as a treatment for high cholesterol, irritable bowel syndrome and
rheumatoid arthritis (Majeed, Majeed, et al., 2018; Majeed, Natarajan, et al., 2016;
Mandel et al., 2010). Others have described it as potentially able to increase the immune
response against some respiratory infections (Baron, 2009).
None the less, B. coagulans will only be able to provide these health benefits if it can
survive processing and remain stable in the product during shelf life until consumption by
the host. As a sporeforming probiotic, B. coagulans must not germinate in the product

81
4 1
during the shelf life so that the protective spore coat is still present upon consumption.
Thus, the viability of the probiotic must extend through the shelf life of the product and
remain at a concentration that is equal to or higher than what is generally accepted as
required in order for the host to obtain any health benefit. The viability of the probiotic
will mostly depend on the composition of the food product being used as the carrier for
the organism. Some product characteristics that may affect the viability of probiotic
organisms are water activity, nutrient profile, pH, oxygen presence and the temperature
of storage (Song et al., 2012). It is also important that added spores do not negatively
affect the quality of the final product. Therefore, organoleptic properties of the product
should be monitored with the attributes of the product with probiotics being similar to
commercial products without probiotics (Song et al., 2012).
The goal of this research was to evaluate the viability of B. coagulans Unique-IS 2 spores
over time at different pH levels, while evaluating the effect of different acids normally
used by the food industry for product formulation. In addition, the viability of B.
coagulans Unique-IS 2 spores and product stability were also evaluated when the
probiotic culture was added to commercial products.
4.2. Materials and Methods
4.2.1. Bacterial Cultures
A lyophilized powder containing spores of Bacillus coagulans Unique IS-2 was obtained
from Nebraska Cultures, LLC, which is now UAS Laboratories, LLC (Wausau, WI).
Lyophilized culture was stored at 4˚C until use.

82
4 1
4.2.2. Viability of B. coagulans During Storage at Different pHs
Tryptic Soy Broth (TSB) was prepared in flasks. Individual flasks of TSB had their pH
adjusted to pH levels 3.0, 3.5, 4.0, 4.5, 5.0, 5.5, 6.0, and 6.5. To adjust the pH of the
broth four different acids were used: 3.0M hydrochloric acid (HCl), 85% (w/w) lactic
acid (LA), 99.8% acetic acid (AA), and 1.0M citric acid (CA). Additionally, a TSB flask
with a pH level of 8.0 was also prepared by adjusting its pH with 0.1N sodium hydroxide
(NaOH). Once the pH of the TSB flasks was adjusted, they were autoclaved for sterility.
A spore suspension was prepared by adding lyophilized B. coagulans spores into
Butterfields Phosphate-Buffered dilution water to achieve a concentration of 1010
CFU/ml. The spore suspension was heat treated at 80˚C for 12 minutes and then
immediately chilled in an ice bath. The spore suspension was used to inoculate each pH
adjusted TSB flask to achieve a bacterial concentration of 108 CFU/ml. The inoculated
pH adjusted TSB was then separated into sterile conical tubes (10 ml/tube) with enough
tubes prepared to allow testing for each time point of interest, which varied depending on
the temperature of storage.
Sterile conical tubes were stored at both 4˚C and 25˚C, for at least 120 and 30 days,
respectively. Time points used for evaluation of samples stored at 4˚C were 0, 1, 2, 3,
and 4 months. Time points for samples stored at 25˚C were 0, 0.5, 1, 2, 3, 6, 9, 12, 18,
27, and 30 days when the acids and bases used for pH adjustment were HCl, LA and
NaOH. For samples where the pH was adjusted using CA and AA, the time points for
samples stored at 25˚C were 0, 0.5, 1, 2, 3, 5, 10, 15, 20, 25, and 30 days. At each time

83
4 1
point, a sample was removed from storage and divided into three parts for total plate
counts, spore counts and a pH measurement. The sub-sample to be used for spore count
was heat treated at 80˚C for 12 minutes to inactivate any vegetative cells present. The
sub-sample for total plate count received no additional treatment. For enumeration of
total plate counts and heat-treated spore counts, samples were serially diluted using
Butterfield’s Phosphate-Buffered dilution water. Dilutions were spread-plated on Tryptic
Soy Agar (TSA) and plates were incubated aerobically at 55˚C for 48 hours. The pH of
the samples was evaluated at each time point using a pH meter (Accument AE150, Fisher
Scientific, NH) to observe if any changes occurred during storage. Graphs showing the
total plate counts, spore counts and pH at each time point were created for each pH level
of each acid.
4.2.3. Viability of B. coagulans Spores and Product Stability During
Product Shelf Life
Four dairy products, milk, buttermilk, Ensure® protein shake and drinkable yogurt, were
evaluated for quality during their shelf life after the addition of B. coagulans Unique IS-
2. Each product was laboratory pasteurized at 80˚C for 12 minutes to eliminate any
background microorganisms. After pasteurization, lyophilized powder of B. coagulans
Unique IS-2 was added to each product for a bacterial concentration of about 107
CFU/ml. Products were then divided into sterile conical tubes and stored at 4˚C for the
life of the product. Product evaluation was done at time points that were determined
based on the normal shelf life of the product: time points for the drinkable yogurt and
Ensure® protein shake was 0, 16, 30, 45, 60, and 90 days; time points for buttermilk

84
4 1
were 0, 3, 10, 16, 20, 25, and 30 days; and time points for milk were 0, 3, 6, 9, 12, 17,
and 21 days.
Throughout storage, the quality of the product was evaluated by testing pH, color,
acidity, and rancidity. The pH measurement was done using a pH meter (Accument
AE150, Fisher Scientific, NH). Color was evaluated using the L, a, b color score with a
colorimeter (CR-300 Chroma Meter, Konica Minolta, NJ). Acidity tests was conducted
according to Wehr and Frank (2004). Rancidity was evaluated with peroxide value and
thiobarbituric acid reactive substances (TBARS). The TBA tests were done according to
AOCS Method DC 19-90. The peroxide value tests were done according to
(“Spectrophotometric determination of lamb tissue peroxide value,” 2001). The fat was
extracted with 2:1 chloroform: methanol (v:v).
In addition to quality tests, the stability of the probiotic B. coagulans Unique IS-2 to
remain in the product in its spore form throughout the shelf life was also evaluated.
Samples were removed at each time point and divided into two portions for total plate
counts and spore counts. The sub-sample to be used for spore count was heat treated at
80˚C for 12 minutes to inactivate any vegetative cells present. The sub-sample for total
plate count received no additional treatment. For enumeration of total plate counts and
heat-treated spore counts, samples were serially diluted using Butterfield’s Phosphate-
Buffered dilution water. Dilutions were spread-plated on Tryptic Soy Agar (TSA) and
plates were incubated aerobically at 55˚C for 48 hours.

85
4 1
4.2.4. Statistical Analysis
Analysis of Variance was used to compare how the pH adjusted tryptic soy broths and
products changed over the storage time. Parameters under evaluation included the
viability of B. coagulans spores in different pH levels, product, and the quality of
products with B. coagulans spores. Statistical analysis was done on the total plates
counts, spore counts and pH for the experiments evaluating viability of B. coagulans
spores in different pH levels. For those experiments involving food products, the total
counts, spores counts, pH, titratable acidity, and LAB color scores were used to evaluate
product quality in the presence of B. coagulans spores. All statistical tests were done at
the 5% level of significance. Statistical analysis was conducted using SAS 9.4 (SAS,
INC, Cary, NC).
4.3. Results and Discussion
4.3.1 Viability of B. coagulans Unique IS-2 during storage at 4˚C in broth
at different pH levels
When determining probiotic product formulations, it is important to ensure the viability
of the organism throughout the shelf life of the product. This is to guarantee that the
desired amount of probiotic is able to reach the gut of the host to confer health benefits
(Bora et al., 2009). Bacillus species, when added to food products, have been observed to
be more stable during processing and shelf life of products compared to other probiotics
that have only a vegetative life cycle (Elshaghabee et al., 2017). Therefore, the
survivability of B. coagulans Unique IS-2 spores was evaluated in different pH ranges at
two different temperatures. Hydrochloric acid (HCl), lactic acid (LA), acetic acid (AA)

86
4 1
and citric acid (CA) were the four acids used to adjust the pH of the broth used for this
study. The survivability of B. coagulans was evaluated at pH 3.0, 3.5, 4.0, 4.5, 5.0, 5.5,
6.0 and 6.5. These acids were chosen because they are commonly used in the food
industry. Additionally, sodium hydroxide (NaOH) was used to evaluate the survivability
of the spores at pH 8.0.
For each of the pH conditions, similar trends for the viability of B. coagulans were seen
during storage at 4˚C for a total of 4 months. In general, no significant differences
(p<0.05) on spore counts over 4 months at each of the pH values evaluated regardless of
the acid or base used for the pH adjustment. These results indicate that the spores of B.
coagulans Unique IS-2 are very stable at 4˚C in different pHs ranging from 3.0 – 8.0.
Figure 13 shows the results observed for broths, with pH adjusted to 5.0 with LA as an
example of B. coagulans Unique IS-2 survivability during 4 months of storage at 4˚C.
Additional data for other pHs and acids/base can be found in appendix A.
Figure 13. Stability of Bacillus coagulans Unique IS-2 in broth with pH adjusted to pH 5.0 with LA as denoted by total and spore counts. Stability tests were done during storage
at 4˚C with the pH of the broth monitored throughout 4 months of storage.
a a aa
aa
aa a
a
4.70
4.75
4.80
4.85
4.90
4.95
5.00
0.00
1.00
2.00
3.00
4.00
5.00
6.00
7.00
8.00
0 1 2 3 4
pH
B. co
agul
ans L
og C
FU/m
l
Time (Months)
Broth Adjusted to pH 5.0 with LA - 4°C Storage
Total Count Spore Count pH

87
4 1
For the total counts, there was some variability across the storage time which led to
statistically significant differences among the time points (p<0.05). However, since the
inclusion of this probiotic into products, and viability over product shelf life, should be
related to its spore form, a decrease in total counts would not compromise the efficacy of
the product. Additionally, as long as any increase in total cells do not contribute to
spoilage of the product, it also would not be of concern.
During the storage time, the pH of the broths was also monitored and results showed
some variation during the 4 months of storage. Specifically, the broths where the pH was
adjusted with LA, no differences were observed. For the other acids, the pH levels varied
by less than 0.10, 0.22, and 0.14 pH units for HCl, AA and CA, respectively. The biggest
change in the pH level of the broth was observed for pH 8.0, which decreased over the
storage period by 0.35 pH units. However, the true significance of these differences
would be best evaluated by manufacturers using this probiotic strain based on the
specifications and characteristics of their products.
Overall, the results of these experiments show that the spores of B. coagulans Unique IS-
2 are resilient during storage at 4˚C in a range of pHs from 3.0 – 8.0, regardless of the
acid or base used to adjust the pH. Other probiotic cultures, such as Lactobacillus
plantarum have also shown ability to survive at low pH values. More specifically L.
plantarum survived well in juices with pH ranging from 2.5 – 4.0, showing only a
decrease of 1.1 log CFU/ml at the lowest pH, after storage at 4˚C for 6 weeks
(Nualkaekul & Charalampopoulos, 2011).

88
4 1
4.3.2. Viability of B. coagulans Unique IS-2 storage at 25˚C in broths at
different pH levels
The same acids (HCl, LA, AA, CA) and base (NaOH) previously used to evaluate the
effect of pH on the survivability of B. coagulans Unique IS-2 when stored at 4˚C were
also used for studies conducted at 25˚C. Once again broths had their pH adjusted to 3.0,
3.5, 4.0, 4.5, 5.0, 5.5, 6.0, 6.5, and 8.0. During storage at 25˚C, similar trends were
observed among the acids tested; however, the results showed greater variation than those
observed at 4˚C. Figure 14 shows the results observed for broths, with pH adjusted to 5.0
with LA as an example, of B. coagulans Unique IS-2 survivability during 30 days of
storage at 25˚C. Additional data for other pHs and acids/base can be found in appendix
A.
Figure 14. Stability of Bacillus coagulans Unique IS-2 in broth with pH adjusted to pH 5.0 with LA as denoted by total and spore counts. Stability tests were done during storage
at 25˚C with the pH of the broth monitored throughout 30 days of storage.

89
4 1
In general, no significant differences (p<0.05) on spore counts were observed over 30
days for each of the pHs tested, regardless of the acid or base used for pH adjustment.
However, the total counts, showed significant differences (p<0.05) over the storage
period, especially for those broths with pH adjusted to values of 5.0 or higher. These
variations in total counts could indicate germination of the spores in pH levels greater
than pH 5.0, during storage at 25˚C. The optimum temperature for growth of B.
coagulans is between 40-47˚C, but they can grow at temperature as low as 30˚C and
some strains have been found to grow in acidic conditions, at pH levels as low as 4.0 (De
Clerck et al., 2004; Haberbeck et al., 2012; Keller et al., 2010). This potential
germination of B. coagulans Unique IS-2 could explain the observed reduction in pH
levels during storage of those broths initially adjusted to 5.0 or higher. The germination
of B. coagulans spores lead to vegetative cells that produce acids, which may explain the
aforementioned reduction in pH of the broths (Figure 14). In these experiments, the
change in pH can most likely be attributed to the activity of vegetative cells of B.
coagulans Unique IS-2 as the pH of all non-inoculated broths (control) remained stable
for the entirety of the shelf life.
In general, for the pH levels below pH 4.0, the pH of the broth remained stable during
storage with less than 0.13, 0.24, 0.08 and 0.11 variability in pH units for LA, HCl, CA,
and AA, respectively. These results are similar to those observed during storage at 4˚C,
where there were no changes in spore or total counts over the storage period and slight
variations in pH level. For these situations, the significance of the pH variation would
once again be dependent upon the product specifications and characteristics.
90
4 1
However, the results from those broths with pH adjusted to levels higher than 5.0
indicated that B. coagulans Unique IS-2 may not be as stable under these conditions.
Potential germination leading to production of acids by the probiotic strain caused
considerable variation in the pH of the broth. This would be detrimental to the quality of
the products that fit this profile (pH > 5.0; storage at 25˚C) and are added with B.
coagulans Unique IS-2. Therefore, this strain of B. coagulans may potentially be used as
a probiotic organism in products that are stored at 25˚C and have pH lower than 5.0, but
it would not be a good option for those with higher pH levels.
4.3.3. Quality Evaluation of Products Added with Bacillus coagulans
Unique IS-2
To meet the definition of a probiotic, the organism must provide a health benefit on the
host. However, to reach the location in the host’s body where the health benefit may be
achieved, it must survive in the delivery product for the duration of its shelf life. It also
should not cause undesirable changes in the quality of the delivery product. Dairy
products, such as milk, yogurt, cheeses, and ice cream, are desirable delivery products for
probiotics for their composition and storage conditions (Canning, Bandyopadhyay,
Biswas, & Aslund, 2012). Since these products are stored and held under refrigeration,
the cold chain helps preserve probiotic organisms that may be associated with these
products. For inclusion of probiotic organisms into a product, several factors must be
evaluated to ensure a good final product. Product composition, processing temperature,
process duration, and post processing can have an effect on the probiotic viability
(Foligné et al., 2013). Additionally, product should be observed for the viability of the

91
4 1
probiotic organism, while physical and organoleptic properties should not change during
the shelf life of the product. Essentially, the sensory attributes of the probiotic product
should be similar to commercial products without probiotics (Canning et al., 2012; Song
et al., 2012).
The survival of probiotic organisms during food processing, during the storage of the
product, and during its transit to the lower gastrointestinal tract are the most important
factors for functional foods included with probiotics (Jafari et al., 2017; Keller et al.,
2010; Konuray & Erginkaya, 2018). Pasteurization processes are commonly used by the
food industry to kill vegetative cells and increase the shelf life of products. Because
Bacillus species spores are known to be heat resistant and survive these processes, it is
expected that they would be an adequate probiotic culture to be used in products that
require pasteurization if the inclusion of the probiotic was to occur before the thermal
treatment (Desai & Varadaraj, 2010). Indeed, the Ganeden strain, Bacillus coagulans
GanedenBC30, is already being included in products that undergo heat treatments during
their processing (Cutting, 2011). In this study, the ability of B. coagulans Unique IS-2 in
surviving pasteurization and its effects on product quality during their storage was
evaluated.
4.3.3.1. Milk
Milk with added B. coagulans Unique IS-2 was evaluated over a 21-day period, which is
the expected normal shelf life for this product. Over the 21 days, there was no significant
difference (p<0.05) in spore counts, with only the last time period showing a decrease

92
4 1
compared to the initial levels (Figure 15). However, this decrease was only 0.60 Log
CFU/ml, which may not adversely affect the ability of the product to provide a probiotic
effect. However, the pH of the product towards the end of the storage period was also
significantly different from those levels measured initially, with an increase from pH 6.64
to pH 6.93.
Figure 15. Stability of B. coagulans Unique IS-2 in milk as denoted by total and spore counts. Stability test were done during storage at 4˚C with the pH of the product
monitored throughout 21 days of storage.
For the quality evaluation, color, percent acidity, and rancidity were measured. When
compared to the commercial milk, the milk with added B. coagulans was slightly darker,
and after probiotic addition the spores settled to the bottom of the container due to their
powder composition (visual observation). However, throughout the evaluated shelf life,
there was no significant changed in the values of L, a, and b color scores, which means
that after the initial change in color caused by the added spores, the color remained
stable. Additionally, the acidity of the product did not change over the entire shelf life
and remained stable at an average value of 0.15 (Table 6).

93
4 1
The rancidity of the product was determined by peroxide value and thiobarbituric acid
reactive substances (TBARS). The peroxide value represents the active oxygen in lipids
that can oxidize potassium iodine, which these values increase during the propagation
phase and then decrease during the termination phase of lipid oxidation as it reads the
primary oxidation products (Laguerre, Lecomte, & Villeneuve, 2007). Thus, TBARS are
used in conjunction with peroxide values because it is able to use thiobarbituric acid’s
reaction with secondary oxidation products to observe further oxidation of the product
(Laguerre et al., 2007). Lipid oxidation is a common chemical reaction in food products
and it usually results in undesirable flavors (O’Connor & O’Brien, 2006). Table 6 also
shows the peroxide and TBARS value during storage. The initial peroxide values were
reduced by day 3 of storage followed by an increase up to day 12 of the shelf life of the
product before decreasing. The TBARS values continuously decreased during storage
until the 21st day. The literature reports increasing trend in peroxide values over the shelf
life of milk and cheeses (Mortensen, Sørensen, & Stapelfeldt, 2002; Park, 2001; Zygoura
et al., 2004). The peroxide values follow their natural trend of slowing increasing until
they reach a peak and then declining (O’Connor & O’Brien, 2006). As oxidation
becomes advanced, the primary oxidation products will decrease to more secondary
oxidation products, which could be indicated by the low stability of TBARS throughout
the shelf life until the last time point evaluated. By the end of the shelf life of milk, the
secondary oxidation products are starting to increase, which would show a more
advanced stage of rancidity. Therefore, the rancidity values reported here show an
increase towards the end of the natural shelf life, thus B. coagulans Unique IS-2 may not
contribute a noticeable effect on the rancidity of the product.

94
4 1
Table 6. Quality characteristics of milk with B. coagulans Unique IS-2 evaluated over a 21-day shelf life at 4°C1
Color Rancidity
Time (days) % Acidity L a b
Peroxide Value
(mmol iodine equiv./kg sample)
TBARS (uM
TBARS/g sample)
0 0.14 ± 0.01a 80.46 ± 6.19a -2.65 ± 0.49a -0.50 ± 3.33a 4.60 ± 0.95 3.00 ± 0.10
3 0.15 ± 0.01a 84.60 ± 0.37a -3.21 ± 0.06a 1.23 ± 0.66a 1.51 ± 0.19 1.40 ± 0.90
6 0.14 ± 0.03a 80.89 ± 1.58a -2.71 ± 0.32a -1.24 ± 0.75a 2.82 ± 0.33 1.40 ± 0.30
9 0.15 ± 0.00a 83.68 ± 0.10a -3.19 ± 0.06a 1.58 ± 0.29a 7.54 ± 0.19 1.00 ± 0.20
12 0.16 ± 0.01a 84.00 ± 0.73a -4.08 ± 0.15a 1.98 ± 0.21a 8.30 ± 1.22 1.00 ± 0.30
17 0.15 ± 0.01a 83.86 ± 0.31a -4.14 ± 0.03a 1.45 ± 0.34a 4.44 ± 0.41 1.00 ± 0.10
21 0.15 ± 0.01a 83.64 ± 0.66a -4.16 ± 0.04a 1.03 ± 0.62a 5.70 ± 0.54 1.50 ± 0.20
1Tests with different letters within the same column are significantly different (p<0.05).
4.3.3.2 Buttermilk
In fermented milks, acidity, pH, redox potential and added flavorings have been found to
affect the viability of probiotic organisms (Canning et al., 2012). Therefore, buttermilk
added with B. coagulans Unique IS-2 was evaluated over a period of 30 days, in
alignment with the normal shelf life of this type of product. Results shown in Figure 16
indicate that the total and spore counts in buttermilk had no significant changes at any
time point during its shelf life. The pH of the buttermilk showed a slight variability of
0.2 pH units during the evaluated period.

95
4 1
Figure 16. Stability of B. coagulans Unique IS-2 in buttermilk as denoted by total and spore counts. Stability test were done during storage at 4˚C with the pH of the product
monitored throughout 30 days of storage.
When compared to the commercial buttermilk product, the one sample with added B.
coagulans Unique IS-2 spores was darker in color (visual observation). However, there
were no further changes in the L and b color over the length of the shelf life period (Table
7). The a color score showed a significant difference between the first two time points
and the other ones. This indicates that the color moved farther along the green scale after
the first 3 days of storage. The acidity of the product did not change during the period
evaluated, with an average value of 0.86 (Table 7). The evaluation of product rancidity
showed some changes over the storage period (Table 7). The peroxide values increased
from the 3rd day until the 20th day, and decreased for the remainder of the storage time.
The TBARS values remained somewhat stable while the peroxide values increased until
the 25 days of storage when values started to increase. Compared to the milk, the
peroxide values in buttermilk reached a much higher peak before decreasing. There are
many factors that affect the lipid oxidation of milk and milk products. Some of these

96
4 1
factors are light, oxygen, metals, antioxidants, enzymes, ascorbic acid, storage conditions
and water activity (O’Connor & O’Brien, 2006). However, both milk and buttermilk,
reached their peroxide value peak over halfway through their shelf life, with the TBARS
value only increasing near the very end of the shelf life, which was expected.
Table 7. Quality characteristics of buttermilk with B. coagulans Unique IS-2 evaluated over a 30-day shelf life at 4°C1
Color Rancidity
Time (days) % Acidity L a b
Peroxide Value (mmol iodine
equiv./kg sample)
TBARS (uM
TBARS/g sample)
0 0.87 ± 0.00a 79.19 ± 3.54a -2.30 ± 0.33a 2.88 ± 1.27a 4.41 ± 0.73 1.40 ± 0.10 3 0.89 ± 0.01a 81.72 ± 3.54a -2.38 ± 0.30a 5.05 ± 1.44a 1.64 ± 0.80 0.90 ± 0.20
10 0.87 ± 0.03a 80.67 ± 3.26a -3.52 ± 0.34b 5.32 ± 0.22a 8.80 ± 1.73 0.70 ± 0.10 16 0.88 ± 0.02a 81.49 ± 3.04a -3.51 ± 0.23b 4.99 ± 0.23a 20.28 ± 2.77 1.00 ± 0.10 20 0.84 ± 0.06a 81.90 ± 2.00a -3.71 ± 0.13b 4.43 ± 0.18a 24.62 ± 0.11 1.00 ± 0.20 25 0.84 ± 0.04a 81.64 ± 1.17a -3.50 ± 0.36b 4.55 ± 0.30a 2.53 ± 0.48 5.00 ± 0.10 30 0.83 ± 0.01a 81.69 ± 1.59a -3.32 ± 0.14b 5.06 ± 1.42a 3.00 ± 0.28 9.00 ± 0.11
1Tests with different letters within the same column are significantly different (p<0.05). 4.3.3.3. Ensure® Protein Shake
Ensure® protein shake with added B. coagulans Unique IS-2 was evaluated over 3
months. Figure 17 shows the results obtained for the stability of the probiotic strain
during product storage. In general, no significant differences were observed in total and
spore counts during the period evaluated. The pH of the product varied by only 0.13 pH
units over the shelf life, indicating no microbial activity over 3 months of storage.

97
4 1
Figure 17. Stability of B. coagulans Unique IS-2 in Ensure® protein shake as denoted by total and spore counts. Stability test were done during storage at 4˚C with the pH of the
product monitored throughout 90 days of storage.
When compared to the commercial Ensure® product, the sample with added B.
coagulans Unique IS-2 spores was darker in color and added spores settled to the bottom
of the container (visual observation). Throughout storage, there were some differences in
the color profile of the protein shake added with B. coagulans Unique IS-2 (Table 8).
The product turned slightly lighter and moved farther along the yellow scale as the
product aged. This, however, was not perceived by visual observation. Therefore, it may
not lead to a significant impact on consumer’s acceptance of the product. The acidity of
the product remained stable, with an average value of 0.17, during the whole shelf life,
with no significant differences observed (Table 8). The peroxide and TBARS values
generally increased throughout the shelf life of this product (Table 8). Both the peroxide
and TBARS value for Ensure® followed a different trend than was observed in the milk
or buttermilk products. There is a lack of information in the literature about the natural
rancidity profile of this product. From the values reported here, it is shown that the

98
4 1
peroxide value is generally increasing throughout the evaluated shelf life. As these
values will hit a peak and start decreasing, these results could indicate that this product is
still in the beginning stages of lipid oxidation. Additionally, the TBARS may increase
slightly, but they are relatively stable, which may indicate this product has a naturally
high TBARS value before it increases when secondary oxidation products start becoming
formed. Additional studies evaluating a longer shelf life may make these results clearer.
Table 8. Quality characteristics of Ensure protein shake with B. coagulans Unique IS-2 evaluated over a 90-day shelf life at 4°C1
Color Rancidity
Time (days) % Acidity L a b
Peroxide Value
(mmol iodine equiv./kg sample)
TBARS (uM
TBARS/g sample)
0 0.15 ± 0.01a 74.20 ± 1.33b 0.26 ± 0.34a 14.04 ± 0.37b 7.17 ± 2.03 7.70 ± 0.20 16 0.16 ± 0.10a 75.01 ± 0.13a,b 0.42 ± 0.47a 15.34 ± 0.47a 3.10 ± 0.99 9.80 ± 0.02 30 0.18 ± 0.02a 75.57 ± 0.09a,b 0.71 ± 0.45a 15.93 ± 0.09a 9.97 ± 0.77 12.00 ± 0.30 45 0.18 ± 0.03a 75.35 ± 0.05a,b 0.74 ± 0.53a 15.96 ± 0.32a 10.32 ± 1.16 11.83 ± 0.46 60 0.20 ± 0.03a 75.71 ± 0.17a,b 0.86 ± 0.06a 16.13 ± 0.18a 16.49 ± 8.74 9.04 ± 1.17 90 0.16 ± 0.08a 76.22 ± 0.26a 0.53 ± 0.57a 16.10 ± 0.74a 17.19 ± 1.65 11.44 ± 2.52
1Tests with different letters within the same column are significantly different (p<0.05). 4.3.3.4. Drinkable Yogurt
Yogurt is one of the most popular food products used as a vehicle for probiotic
organisms, with the ones usually included in this product being Lactobacillus acidophilus
and Bifidobacterium species (Ashraf & Shah, 2011). However, studies have shown a
decrease in viability in the probiotic organisms by the time of product consumption,
which emphasizes the importance of evaluating probiotic viability over the shelf life of
products (Ashraf & Shah, 2011; Shah, 2000). The viability of these organisms can be
affected by product pH, acidity, dissolved oxygen, buffering capacity of the media and
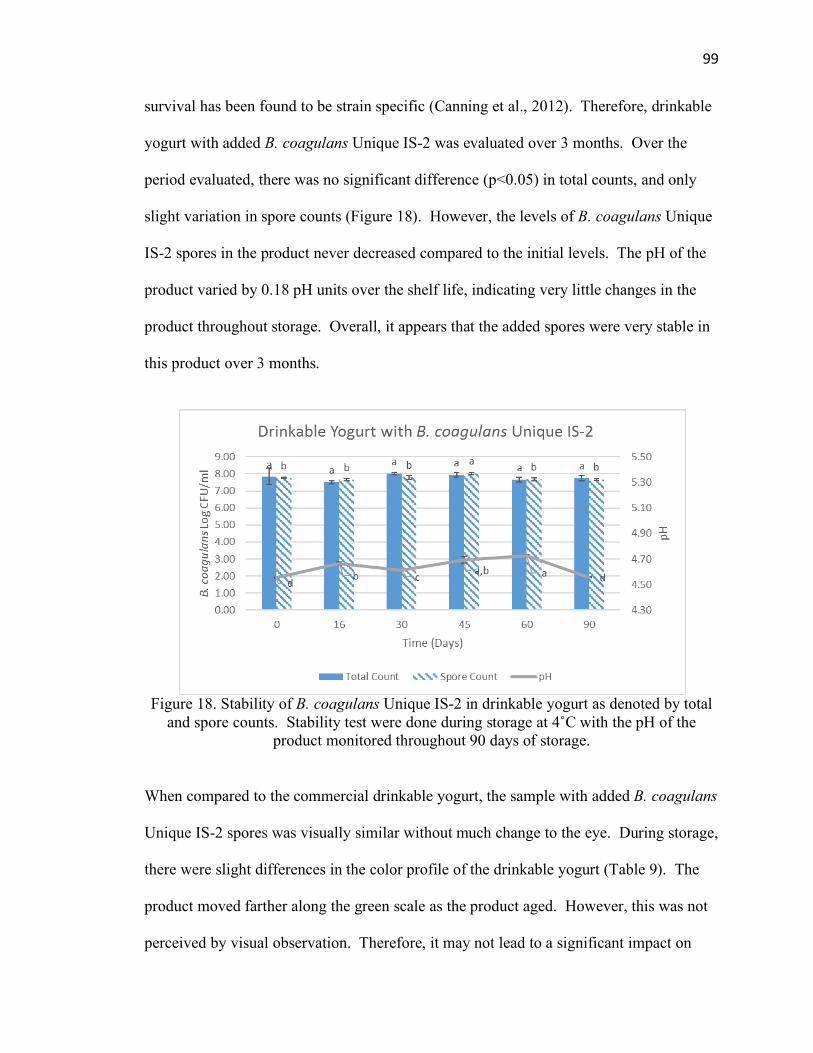
99
4 1
survival has been found to be strain specific (Canning et al., 2012). Therefore, drinkable
yogurt with added B. coagulans Unique IS-2 was evaluated over 3 months. Over the
period evaluated, there was no significant difference (p<0.05) in total counts, and only
slight variation in spore counts (Figure 18). However, the levels of B. coagulans Unique
IS-2 spores in the product never decreased compared to the initial levels. The pH of the
product varied by 0.18 pH units over the shelf life, indicating very little changes in the
product throughout storage. Overall, it appears that the added spores were very stable in
this product over 3 months.
Figure 18. Stability of B. coagulans Unique IS-2 in drinkable yogurt as denoted by total and spore counts. Stability test were done during storage at 4˚C with the pH of the
product monitored throughout 90 days of storage.
When compared to the commercial drinkable yogurt, the sample with added B. coagulans
Unique IS-2 spores was visually similar without much change to the eye. During storage,
there were slight differences in the color profile of the drinkable yogurt (Table 9). The
product moved farther along the green scale as the product aged. However, this was not
perceived by visual observation. Therefore, it may not lead to a significant impact on

100
4 1
consumer’s acceptance of the product. Similar to the other products tested, the acidity of
the product remained stable, with an average value of 0.80, during its shelf life, with no
significant differences observed (Table 9). The peroxide and TBARS values for the
drinkable yogurt varied throughout the shelf life of this product (Table 9). These values
follow the same trend observed with the Ensure® product, where there were variations
among the evaluated shelf life. However, other research in the literature has reported
peroxide values increasing over the shelf life of a yogurt product, which is the common
result of peroxide values (O’Sullivan et al., 2016). With the variability of both peroxide
and TBARS values over the evaluated shelf life, this could indicate an early stage of
rancidity or low rancidity of this product.
Table 9. Quality characteristics of drinkable yogurt with B. coagulans Unique IS-2 evaluated over a 90-day shelf life at 4°C1
Color Rancidity
Time (days) % Acidity L a b
Peroxide Value (mmol iodine
equiv./kg sample)
TBARS (uM
TBARS/g sample)
0 0.81 ± 0.03a 86.69 ± 1.22a -2.41 ± 0.18a 5.03 ± 0.44a 5.63 ± 1.08 2.60 ± 0.90 16 0.79 ± 0.02a 86.07 ± 0.52a -3.41 ± 0.21b 5.52 ± 0.54a 4.80 ± 0.91 1.70 ± 0.40 30 0.79 ± 0.02a 87.23 ± 0.53a -3.30 ± 0.26b 6.51 ± 0.19a 8.30 ± 1.22 4.70 ± 1.20 45 0.77 ± 0.04a 85.56 ± 2.00a -3.35 ± 0.28b 5.02 ± 1.82a 4.24 ± 0.12 2.50 ± 0.50 60 0.80 ± 0.02a 86.60 ± 0.23a -3.36 ± 0.28b 6.20 ± 0.64a 5.90 ± 0.16 2.33 ± 0.32 90 0.81 ± 0.05a 86.87 ± 0.71a -3.14 ± 0.30b 6.16 ± 0.60a 6.56 ± 0.57 4.03 ± 0.73
1Tests with different letters within the same column are significantly different (p<0.05).
4.4. Conclusion
The purpose of this research was to evaluate the viability of the spores of B. coagulans
Unique IS-2 in broths adjusted to different pHs levels when stored at 4˚C and 25˚C.
Overall, the spores of B. coagulans were stable when stored at 4˚C in broths with pH 3.0
101
4 1
– 8.0 for up to 4 months. The losses in counts observed over the shelf life could be
overcome by adding extra spores to probiotic products. However, the viability of the
spores was not as promising when samples were stored at 25˚C. When the pH of the
broth was 4.5 or greater, the spores appeared to have germinated during storage. This
germination lead to a significant pH drop in some samples during storage, which would
be an undesirable change in commercial products. Based on the results reported here,
shelf stable products with a pH of 4.0 or lower, could have B. coagulans Unique IS-2
added to them, as under these conditions the spores were stable during storage for up to
30 days.
Additionally, the viability of B. coagulans Unique IS-2 when added to commercial
products and their quality throughout storage were also evaluated. In general, B.
coagulans showed good viability and stability in the commercial products tested.
Overall, spore counts remained stable in the products over their shelf life without
negatively changing the acidity or pH of the products. Another quality factor evaluated
was the color of the product. While the color was not altered significantly during the
shelf life of the products, the initial addition of B. coagulans Unique IS-2 caused the
products to display a darker color. This was most likely due to the color of the
lyophilized probiotic which was a brown hue. Additionally, it is worth mentioning that in
some products the added spores settled to the bottom of the product containers. With the
milk and buttermilk products, the rancidity values showed a natural trend of an increasing
peroxide value to a peak before decreasing, and then a subsequent increase in TBARS
after the peak, which shows the change from primary to secondary oxidation products.

102
4 1
However, the Ensure® protein shake and yogurt rancidity values did not follow that
trend. There is a lack of conclusive information in the literature about true acceptability
values of rancidity compared to the acceptability of the product. Additional research on
acceptability of measured rancidity values in dairy products and comparison of control
products would strengthen the results reported here. In addition to the tests done here,
additional evaluation with a sensory panel could provide additional valuable information
about the acceptability of inclusion of B. coagulans Unique IS-2 to food products as a
probiotic culture.

103
4 1
4.5. References
Abhari, K., Shekarforoush, S. S., Sajedianfard, J., Hosseinzadeh, S., & Nazifi, S. (2015).
The effects of probiotic, prebiotic and synbiotic diets containing Bacillus coagulans
and inulin on rat intestinal microbiota. Iranian Journal of Veterinary Research,
16(3), 267–273.
Ahuja, K., & Deb, S. (2018). Global Market Insights. Retrieved February 20, 2019, from
https://www.gminsights.com/industry-analysis/probiotics-market
Aminlari, L., Shekarforoush, S. S., Hosseinzadeh, S., Nazifi, S., & Sajedianfard, J.
(2018). Effect of Probiotics Bacillus coagulans and Lactobacillus plantarum on
Lipid Profile and Feces Bacteria of Rats Fed Cholesterol-Enriched Diet.
https://doi.org/10.1007/s12602-018-9480-1
Ashraf, R., & Shah, N. P. (2011). Selective and differential enumerations of
Lactobacillus delbrueckii subsp. bulgaricus, Streptococcus thermophilus,
Lactobacillus acidophilus, Lactobacillus casei and Bifidobacterium spp. in yoghurt -
A review. International Journal of Food Microbiology, 149(3), 94–208.
https://doi.org/10.1016/j.ijfoodmicro.2011.07.008
Baron, M. (2009). A patented strain of Bacillus coagulans increased immune response to
viral challenge. Postgraduate Medicine, 121(2), 114–118.
https://doi.org/10.3810/pgm.2009.03.1971
Bomko, T. V., Nosalskaya, T. N., Kabluchko, T. V., Lisnyak, Y. V., & Martynov, A. V.
(2017). Immunotropic aspect of the Bacillus coagulans probiotic action. Journal of
Pharmacy and Pharmacology, 69(8), 1033–1040.
https://doi.org/10.1111/jphp.12726
104
4 1
Bora, P. S., Puri, V., & Bansal, A. K. (2009). Physicochemical Properties and Excipient
Compatibility studies of Probiotic Bacillus coagulans Spores. Scientia
Pharmaceutica, 77, 625–637. https://doi.org/10.3797/scipharm.0904-01
Canning, J., Bandyopadhyay, S., Biswas, P., & Aslund, M. (2012). Recent Application of
Probiotics in Food and Agricultural Science. Intech. https://doi.org/10.5772/50570
Charalampopoulos, D., Wang, R., Pandiella, S. S., & Webb, C. (2002). Application of
cereal and cereal components in functional foods: a review. International Journal of
Food Microbiology, 79(1–2), 131–141.
Cutting, S. M. (2011). Bacillus probiotics. Food Microbiology, 28, 214–220.
https://doi.org/10.1016/j.fm.2010.03.007
De Clerck, E., Rodriguez-Diaz, M., Forsyth, G., Lebbe, L., Logan, N. A., & DeVos, P.
(2004). Polyphasic Characterization of Bacillus coagulans Strains, Illustrating
Heterogeneity within this Species, and Emended Description of the Species.
Systematic and Applied Microbiology, 27(1), 50–60. https://doi.org/10.1078/0723-
2020-00250
De Vecchi, E., & Drago, L. (2006). Lactobacillus sporogenes or Bacillus coagulans:
misidentification or mislabelling? International Journal of Probiotics and
Prebiotics, 1(1), 3–10.
Desai, S. V., & Varadaraj, M. C. (2010). Behavioural pattern of vegetative cells and
spores of Bacillus cereus as affected by time-temperature combinations used in
processing of Indian traditional foods. Journal of Food Science and Technology,
47(5), 549–556. https://doi.org/10.1007/s13197-010-0099-9
Elshaghabee, F. M. F., Rokana, N., Gulhane, R. D., Sharma, C., & Panwar, H. (2017).

105
4 1
Bacillus as potential probiotics: Status, concerns, and future perspectives. Frontiers
in Microbiology, 8(AUG), 1–15. https://doi.org/10.3389/fmicb.2017.01490
Endres, J. R., Qureshi, I., Farber, T., Hauswirth, J., Hirka, G., Pasics, I., & Schauss, A. G.
(2011). One-year chronic oral toxicity with combined reproduction toxicity study of
a novel probiotic, Bacillus coagulans, as a food ingredient. Food and Chemical
Toxicology, 49(5), 1174–1182. https://doi.org/10.1016/j.fct.2011.02.012
Fitzpatrick, L. R., Small, J. S., Greene, W. H., Karpa, K. D., & Keller, D. (2011).
Bacillus Coagulans GBI-30 (BC30) improves indices of Clostridium difficile-
Induced colitis in mice. Gut Pathogens, 3(1), 16. https://doi.org/10.1186/1757-4749-
3-16
Foligné, B., Daniel, C., & Pot, B. (2013). Probiotics from research to market: The
possibilities, risks and challenges. Current Opinion in Microbiology, 16(3), 284–
292. https://doi.org/10.1016/j.mib.2013.06.008
Grajek, W., Olejnik, A., & Sip, A. (2005). Probiotics, prebiotics and antioxidants as
functional foods. Acta Biochimica Polonica, 52(3), 665–671.
https://doi.org/10.1093/brain/awt108
Haberbeck, L. U., Alberto da Silva Riehl, C., de Cássia Martins Salomão, B., & Falcão
de Aragão, G. M. (2012). Bacillus coagulans spore inactivation through the
application of oregano essential oil and heat. LWT - Food Science and Technology,
46(1), 267–273. https://doi.org/10.1016/j.lwt.2011.09.021
Hill, C., Guarner, F., Reid, G., Gibson, G. R., Merenstein, D. J., Pot, B., Morelli, L.,
Canani, R. B., Flint, H. J., Salminen, S., Calder, P. C., & Sanders, M. E. (2014). The
International Scientific Association for probiotics and prebiotics consensus

106
4 1
statement on the scope and appropriate use of the term probiotic. National Review
Gastroenterol Hepatol, 11(11), 506–514. https://doi.org/10.1038/nrgastro.2014.66
Jafari, M., Mortazavian, A. M., Hosseini, H., Safaei, F., Mousavi Khaneghah, A., &
Sant’Ana, A. S. (2017). Probiotic Bacillus: Fate during sausage processing and
storage and influence of different culturing conditions on recovery of their spores.
Food Research International, 95, 46–51.
https://doi.org/10.1016/j.foodres.2017.03.001
Jayamanne, V. S., & Adams, M. R. (2006). Determination of survival, identity and stress
resistance of probiotic bifidobacteria in bio-yoghurts. Letters in Applied
Microbiology, 42(3), 189–194. https://doi.org/10.1111/j.1472-765X.2006.01843.x
Keller, D., Farmer, S., McCartney, A., & Gibson, G. (2010). Bacillus coagulans as a
probiotic. Food Science and Technology Bulletin: Functional Foods, 7, 103–109.
https://doi.org/10.1616/1476-2137.16015.
Konuray, G., & Erginkaya, Z. (2018). Potential Use of Bacillus coagulans in the Food
Industry. Foods, 7(6), 92. https://doi.org/10.3390/foods7060092
Laguerre, M., Lecomte, J., & Villeneuve, P. (2007). Evaluation of the ability of
antioxidants to counteract lipid oxidation: existing methods. new trends and
challenges. Progress in Lipid Research, (46), 244–282.
Majeed, M., Majeed, S., Nagabhushanam, K., Arumugam, S., Beede, K., & Ali, F.
(2018). Evaluation of the in vitro cholesterol-lowering activity of the probiotic strain
Bacillus coagulans MTCC 5856. International Journal of Food Science and
Technology, 212–220. https://doi.org/10.1111/ijfs.13926
Majeed, M., & Nagabhushanam, K. (2016). A Double-Blind, Placebo-Controlled,

107
4 1
Parallel Study Evaluating the Safety of Bacillus coagulans MTCC 5856 in Healthy
Individuals. Journal of Clinical Toxicology, 06(01), 1–9.
https://doi.org/10.4172/2161-0495.1000283
Majeed, M., Nagabhushanam, K., Natarajan, S., Sivakumar, A., Ali, F., Pande, A.,
Majeed, S., & Karri, S. K. (2016). Bacillus coagulans MTCC 5856 supplementation
in the management of diarrhea predominant Irritable Bowel Syndrome: a double
blind randomized placebo controlled pilot clinical study. Nutrition Journal, 15(1),
21. https://doi.org/10.1186/s12937-016-0140-6
Majeed, M., Natarajan, S., Sivakumar, A., Ali, F., Pande, A., Majeed, S., & Karri, S. K.
(2016). Evaluation of Anti-Diarrhoeal Activity of Bacillus coagulans MTCC 5856
and its Effect on Gastrointestinal Motility in Wistat Rats. International Journal of
Pharma and Bio Sciences, 7(1), 311–316.
Mandel, D. R., Eichas, K., & Holmes, J. (2010). Bacillus coagulans: a viable adjunct
therapy for relieving symptoms of rheumatoid arthritis according to a randomized,
controlled trial. BMC Complementary and Alternative Medicine, 10, 1–7.
Martín, M. J., Lara-Villoslada, F., Ruiz, M. A., & Morales, M. E. (2015).
Microencapsulation of bacteria: A review of different technologies and their impact
on the probiotic effects. Innovative Food Science and Emerging Technologies, 27,
15–25. https://doi.org/10.1016/j.ifset.2014.09.010
Mortensen, G., Sørensen, J., & Stapelfeldt, H. (2002). Light-induced oxidation in
semihard cheeses. Evaluation of methods used to determine levels of oxidation.
Journal of Agricultural and Food Chemistry, 50(15), 4364–4370.
https://doi.org/10.1021/jf025513z

108
4 1
Nicholson, W. L., Munakata, N., Horneck, G., Setlow, P., Melosh, H. J., & Setlow, P.
(2003). Resistance of Bacillus Endospores to Extreme Terrestrial and Extraterrestrial
Environments. Microbiology and Molecular Biology Reviews, 64(3), 548–572.
https://doi.org/10.1128/mmbr.64.3.548-572.2000
Nualkaekul, S., & Charalampopoulos, D. (2011). Survival of Lactobacillus plantarum in
model solutions and fruit juices. International Journal of Food Microbiology,
146(2), 111–117. https://doi.org/10.1016/j.ijfoodmicro.2011.01.040
O’Connor, T. P., & O’Brien, N. M. (2006). Lipid Oxidation. Advanced Dairy Chemistry
(Vol. 2). https://doi.org/10.1016/0163-7827(80)90006-5
O’Sullivan, A. M., O’Grady, M. N., O’Callaghan, Y. C., Smyth, T. J., O’Brien, N. M., &
Kerry, J. P. (2016). Seaweed extracts as potential functional ingredients in yogurt.
Innovative Food Science and Emerging Technologies, 37(PB), 293–299.
https://doi.org/10.1016/j.ifset.2016.07.031
Park, Y. W. (2001). Proteolysis and Lipolysis of Goat Milk Cheese. Journal of Dairy
Science, 84, 84–92.
Shah, N. P. (2000). Probiotic Bacteria: Selective Enumeration and Survival in Dairy
Foods. Journal of Dairy Science, 83(4), 894–907. https://doi.org/10.3168/jds.S0022-
0302(00)74953-8
Song, D., Ibrahim, S., & Hayek, S. (2012). Recent Application of Probiotics in Food and
Agricultural Science. Intech Open, 2, 3–36. https://doi.org/10.5772/32009
Spectrophotometric determination of lamb tissue peroxide value. (2001). Ohio State
University Research Bulletin. Retreived from
http:ohiolin.osu.edu/sc183/sc1836.hyml

109
4 1
Wehr, H. M., & Frank, J. F. (2004). Standard Methods for the Examination of Dairy
Products (17th Edition).
Weinbreck, F., Bodnár, I., & Marco, M. L. (2010). Can encapsulation lengthen the shelf-
life of probiotic bacteria in dry products? International Journal of Food
Microbiology, 136(3), 364–367. https://doi.org/10.1016/j.ijfoodmicro.2009.11.004
Wu, T., Zhang, Y., Lv, Y., Li, P., Yi, D., Wang, L., Zhao, D., Chen, H., Gong, J., & Hou,
Y. (2018). Beneficial impact and molecular mechanism of Bacillus coagulans on
piglets’ intestine. International Journal of Molecular Sciences, 19(7), 1–17.
https://doi.org/10.3390/ijms19072084
Zygoura, P., Moyssiadi, T., Badeka, A., Kondyli, E., Savvaidis, I., & Kontominas, M. G.
(2004). Shelf life of whole pasteurized milk in Greece: Effect of packaging material.
Food Chemistry, 87(1), 1–9. https://doi.org/10.1016/j.foodchem.2003.10.009

110
4 1
APPENDIX A. GRAPHS FOR THE STABILITY OF BACILLUS COAGULANS
UNIQUE IS-2 IN pH ADJUSTED BROTHS

111
4 1
Figure 19. Stability of Bacillus coagulans Unique IS-2 in broth with pH adjusted to pH 3.0 with HCl as denoted by total and spore counts. Stability tests were done during storage at 4˚C with the pH of the broth monitored throughout 120 days of storage.
Figure 20. Stability of Bacillus coagulans Unique IS-2 in broth with pH adjusted to pH 3.5 with HCl as denoted by total and spore counts. Stability tests were done during storage at 4˚C with the pH of the broth monitored throughout 120 days of storage.
a,b a b a a,b ac
aa a a a a a
2.50
3.00
3.50
4.00
4.50
5.00
0.001.002.00
3.004.00
5.006.007.00
8.00
0 15 30 45 60 90 120
pH
B. co
agul
ans L
og C
FU/m
l
Time (Days)
Broth Adjusted to pH 3.0 with HCl - 4°C Storage
Total Count Spore Count pH
a a,b a,b a b a,b a,b
a a a aa a a
3.40
3.60
3.80
4.00
4.20
4.40
0.00
1.002.00
3.00
4.00
5.00
6.007.00
8.00
9.00
0 15 30 45 60 90 120
pH
B. co
agul
ans L
og C
FU/m
l
Time (Days)
Broth Adjusted to pH 3.5 with HCl - 4°C Storage
Total Count Spore Count pH

112
4 1
Figure 21. Stability of Bacillus coagulans Unique IS-2 in broth with pH adjusted to pH 4.0 with HCl as denoted by total and spore counts. Stability tests were done during storage at 4˚C with the pH of the broth monitored throughout 120 days of storage.
Figure 22. Stability of Bacillus coagulans Unique IS-2 in broth with pH adjusted to pH 4.5 with HCl as denoted by total and spore counts. Stability tests were done during storage at 4˚C with the pH of the broth monitored throughout 120 days of storage.
a a a a a a aa a a a
aa a
3.90
4.00
4.10
4.20
4.30
4.40
4.50
4.60
0.00
1.00
2.00
3.00
4.00
5.00
6.00
7.00
8.00
0 15 30 45 60 90 120
pH
B. co
agul
ans L
og C
FU/m
l
Time (Days)
Broth Adjusted to pH 4.0 with HCl - 4°C Storage
Total Count Spore Count pH
aa,b a,b a,b
b a,b a,ba a a a a a a
4.404.504.604.704.804.905.005.105.205.305.40
0.00
1.00
2.00
3.00
4.00
5.00
6.00
7.00
8.00
0 15 30 45 60 90 120
pH
B. co
agul
ans L
og C
FU/m
l
Time (Days)
Broth Adjusted to pH 4.5 with HCl - 4°C Storage
Total Count Spore Count pH

113
4 1
Figure 23. Stability of Bacillus coagulans Unique IS-2 in broth with pH adjusted to pH 5.0 with HCl as denoted by total and spore counts. Stability tests were done during storage at 4˚C with the pH of the broth monitored throughout 120 days of storage.
Figure 24. Stability of Bacillus coagulans Unique IS-2 in broth with pH adjusted to pH 5.5 with HCl as denoted by total and spore counts. Stability tests were done during storage at 4˚C with the pH of the broth monitored throughout 120 days of storage.
a aa,b a,b a a,b
ba a a a a a a
4.905.005.105.205.305.405.505.605.705.805.90
0.00
1.00
2.00
3.00
4.00
5.00
6.00
7.00
8.00
0 15 30 45 60 90 120
pH
B. co
agul
ans L
og C
FU/m
l
Time (Days)
Broth Adjusted to pH 5.0 with HCl - 4°C Storage
Total Count Spore Count pH
a a,b a,b,c a,b,cc b,c
a,b,ca a a a a a a
5.305.405.505.605.705.805.906.006.106.206.30
0.001.00
2.003.00
4.005.006.00
7.008.00
0 15 30 45 60 90 120
pH
B. co
agul
ans L
og C
FU/m
l
Time (Days)
Broth Adjusted to pH 5.5 with HCl - 4°C Storage
Total Count Spore Count pH

114
4 1
Figure 25. Stability of Bacillus coagulans Unique IS-2 in broth with pH adjusted to pH 6.0 with HCl as denoted by total and spore counts. Stability tests were done during storage at 4˚C with the pH of the broth monitored throughout 120 days of storage.
Figure 26. Stability of Bacillus coagulans Unique IS-2 in broth with pH adjusted to pH 6.5 with HCl as denoted by total and spore counts. Stability tests were done during storage at 4˚C with the pH of the broth monitored throughout 120 days of storage.
a aa,b a,b a,b a,b
ba a a a a a a
5.705.805.906.006.106.206.306.406.506.606.70
0.00
1.00
2.00
3.00
4.00
5.00
6.00
7.00
8.00
0 15 30 45 60 90 120
pH
B. co
agul
ans L
og C
FU/m
l
Time (Days)
Broth Adjusted to pH 6.0 with HCl - 4°C Storage
Total Count Spore Count pH
a a a aa a aa a a a a a a
6.30
6.40
6.50
6.60
6.70
6.80
6.90
7.00
0.00
1.00
2.00
3.00
4.00
5.00
6.00
7.00
8.00
0 15 30 45 60 90 120
pH
B. co
agul
ans L
og C
FU/m
l
Time (Days)
Broth Adjusted to pH 6.5 with HCl - 4°C Storage
Total Count Spore Count pH

115
4 1
Figure 27. Stability of Bacillus coagulans Unique IS-2 in broth with pH adjusted to pH 8.0 with NaOH as denoted by total and spore counts. Stability tests were done during
storage at 4˚C with the pH of the broth monitored throughout 120 days of storage.
Figure 28. Stability of Bacillus coagulans Unique IS-2 in broth with pH adjusted to pH 3.0 with LA as denoted by total and spore counts. Stability tests were done during storage
at 4˚C with the pH of the broth monitored throughout 4 months of storage.
a a a a a a aa a a aa a a
7.40
7.60
7.80
8.00
8.20
8.40
8.60
8.80
0.00
1.00
2.00
3.00
4.00
5.00
6.00
7.00
8.00
0 15 30 45 60 90 120
pH
B. co
agul
ans L
og
CFU
/ml
Time (Days)
Broth Adjusted to pH 8.0 with NaOH - 4°C
Storage
Total Count Spore Count pH
b b b ba
a a a a a
2.90
3.10
3.30
3.50
3.70
3.90
0.001.002.003.004.005.006.007.008.009.00
0 1 2 3 4
pH
B. co
agul
ans L
og C
FU/m
l
Time (Months)
Broth Adjusted to pH 3.0 with LA - 4°C Storage
Total Count Spore Count pH

116
4 1
Figure 29. Stability of Bacillus coagulans Unique IS-2 in broth with pH adjusted to pH 3.5 with LA as denoted by total and spore counts. Stability tests were done during storage
at 4˚C with the pH of the broth monitored throughout 4 months of storage.
Figure 30. Stability of Bacillus coagulans Unique IS-2 in broth with pH adjusted to pH 4.0 with LA as denoted by total and spore counts. Stability tests were done during storage
at 4˚C with the pH of the broth monitored throughout 4 months of storage.
b b b ba
aa a
a a
3.40
3.50
3.60
3.70
3.80
3.90
4.00
0.00
1.002.00
3.004.005.00
6.007.008.00
0 1 2 3 4
pH
B. co
agul
ans L
og C
FU/m
l
Time (Months)
Broth Adjusted to pH 3.5 with LA - 4°C Storage
Spore Count Total Count pH
a,b a,b b ba
a a aa
a
3.90
3.954.004.05
4.104.15
4.204.254.30
0.00
1.002.003.00
4.005.00
6.007.008.00
0 1 2 3 4
pH
B. co
agul
ans L
og C
FU/m
l
Time (Months)
Broth Adjusted to pH 4.0 with LA - 4°C Storage
Total Count Spore Count pH

117
4 1
Figure 31. Stability of Bacillus coagulans Unique IS-2 in broth with pH adjusted to pH 4.5 with LA as denoted by total and spore counts. Stability tests were done during storage
at 4˚C with the pH of the broth monitored throughout 4 months of storage.
Figure 32. Stability of Bacillus coagulans Unique IS-2 in broth with pH adjusted to pH 5.0 with LA as denoted by total and spore counts. Stability tests were done during storage
at 4˚C with the pH of the broth monitored throughout 4 months of storage.
a,b a,b b ba
a a a aa
4.304.354.404.454.504.554.604.654.704.754.80
0.001.002.003.004.005.006.007.008.009.00
0 1 2 3 4
pH
B. co
agul
ans L
og C
FU/m
l
Time (Months)
Broth Adjusted to pH 4.5 with LA - 4°C Storage
Total Count Spore Count pH
a a aa
aa
aa a
a
4.70
4.75
4.80
4.85
4.90
4.95
5.00
0.00
1.00
2.00
3.00
4.00
5.00
6.00
7.00
8.00
0 1 2 3 4
pH
B. co
agul
ans L
og C
FU/m
l
Time (Months)
Broth Adjusted to pH 5.0 with LA - 4°C Storage
Total Count Spore Count pH

118
4 1
Figure 33. Stability of Bacillus coagulans Unique IS-2 in broth with pH adjusted to pH 5.5 with LA as denoted by total and spore counts. Stability tests were done during storage
at 4˚C with the pH of the broth monitored throughout 4 months of storage.
Figure 34. Stability of Bacillus coagulans Unique IS-2 in broth with pH adjusted to pH 6.0 with LA as denoted by total and spore counts. Stability tests were done during storage
at 4˚C with the pH of the broth monitored throughout 4 months of storage.
a a a aa
a a a aa
5.10
5.15
5.20
5.25
5.30
5.35
5.40
5.45
5.50
0.00
1.00
2.00
3.00
4.00
5.00
6.00
7.00
8.00
0 1 2 3 4
pH
B. co
agul
ans L
og C
FU/m
l
Time (Months)
Broth Adjusted to pH 5.5 with LA - 4°C Storage
Total Count Spore Count pH
a a a aa
a a a aa
5.505.605.705.805.906.006.106.206.306.406.50
0.00
1.00
2.003.00
4.00
5.00
6.00
7.008.00
9.00
0 1 2 3 4
pH
B. co
agul
ans L
og C
FU/m
l
Time (Months)
Broth Adjusted to pH 6.0 with LA - 4°C Storage
Total Count Spore Count pH

119
4 1
Figure 35. Stability of Bacillus coagulans Unique IS-2 in broth with pH adjusted to pH 6.5 with LA as denoted by total and spore counts. Stability tests were done during storage
at 4˚C with the pH of the broth monitored throughout 4 months of storage.
Figure 36. Stability of Bacillus coagulans Unique IS-2 in broth with pH adjusted to pH 3.0 with AA as denoted by total and spore counts. Stability tests were done during storage at 4˚C with the pH of the broth monitored throughout 4 months of storage.
a a aa
aa a a a
a
6.006.106.206.306.406.506.606.706.806.907.00
0.00
1.00
2.00
3.00
4.00
5.00
6.00
7.00
8.00
0 1 2 3 4
pH
B. co
agul
ans L
og C
FU/m
l
Time (Months)
Broth Adjusted to pH 6.5 with LA - 4°C Storage
Total Count Spore Count pH
a a a aa
a a a
a
a
2.90
3.00
3.10
3.20
3.30
3.40
3.50
0.00
1.00
2.00
3.00
4.00
5.00
6.00
7.00
8.00
0 1 2 3 4
pH
B. co
agul
ans L
og C
FU/m
l
Time (Months)
Broth Adjusted to pH 3.0 with AA - 4°C Storage
Total Count Spore Count pH

120
4 1
Figure 37. Stability of Bacillus coagulans Unique IS-2 in broth with pH adjusted to pH 3.5 with AA as denoted by total and spore counts. Stability tests were done during storage at 4˚C with the pH of the broth monitored throughout 4 months of storage.
Figure 38. Stability of Bacillus coagulans Unique IS-2 in broth with pH adjusted to pH 4.0 with AA as denoted by total and spore counts. Stability tests were done during storage at 4˚C with the pH of the broth monitored throughout 4 months of storage.
a,b a,b b ba
a a aa
a
3.30
3.40
3.50
3.60
3.70
3.80
3.90
4.00
0.001.00
2.003.004.00
5.006.00
7.008.00
0 1 2 3 4
pH
B. co
agul
ans L
og C
FU/m
l
Time (Months)
Broth Adjusted to pH 3.5 with AA - 4°C Storage
Total Count Spore Count pH
a,b a,b b a,b aa a a
a a
3.90
4.00
4.10
4.20
4.30
4.40
4.50
0.001.00
2.003.004.00
5.006.00
7.008.00
0 1 2 3 4
pH
B. co
agul
ans L
og C
FU/m
l
Time (Months)
Broth Adjusted to pH 4.0 with AA - 4°C Storage
Total Count Spore Count pH

121
4 1
Figure 39. Stability of Bacillus coagulans Unique IS-2 in broth with pH adjusted to pH 4.5 with AA as denoted by total and spore counts. Stability tests were done during storage at 4˚C with the pH of the broth monitored throughout 4 months of storage.
Figure 40. Stability of Bacillus coagulans Unique IS-2 in broth with pH adjusted to pH 5.0 with AA as denoted by total and spore counts. Stability tests were done during storage at 4˚C with the pH of the broth monitored throughout 4 months of storage.
a,b a,bb a,b
aa a a
a a
4.40
4.50
4.60
4.70
4.80
4.90
5.00
0.00
1.002.003.00
4.005.00
6.007.008.00
0 1 2 3 4
pH
B. co
agul
ans L
og C
FU/m
l
Time (Months)
Broth Adjusted to pH 4.5 with AA - 4°C Storage
Total Count Spore Count pH
a aa a
aa a a a
a
4.804.854.904.955.005.055.105.155.205.255.30
0.00
1.00
2.00
3.00
4.00
5.00
6.00
7.00
8.00
0 1 2 3 4
pH
B. co
agul
ans L
og C
FU/m
l
Time (Months)
Broth Adjusted to pH 5.0 with AA - 4°C Storage
Total Count Spore Count pH
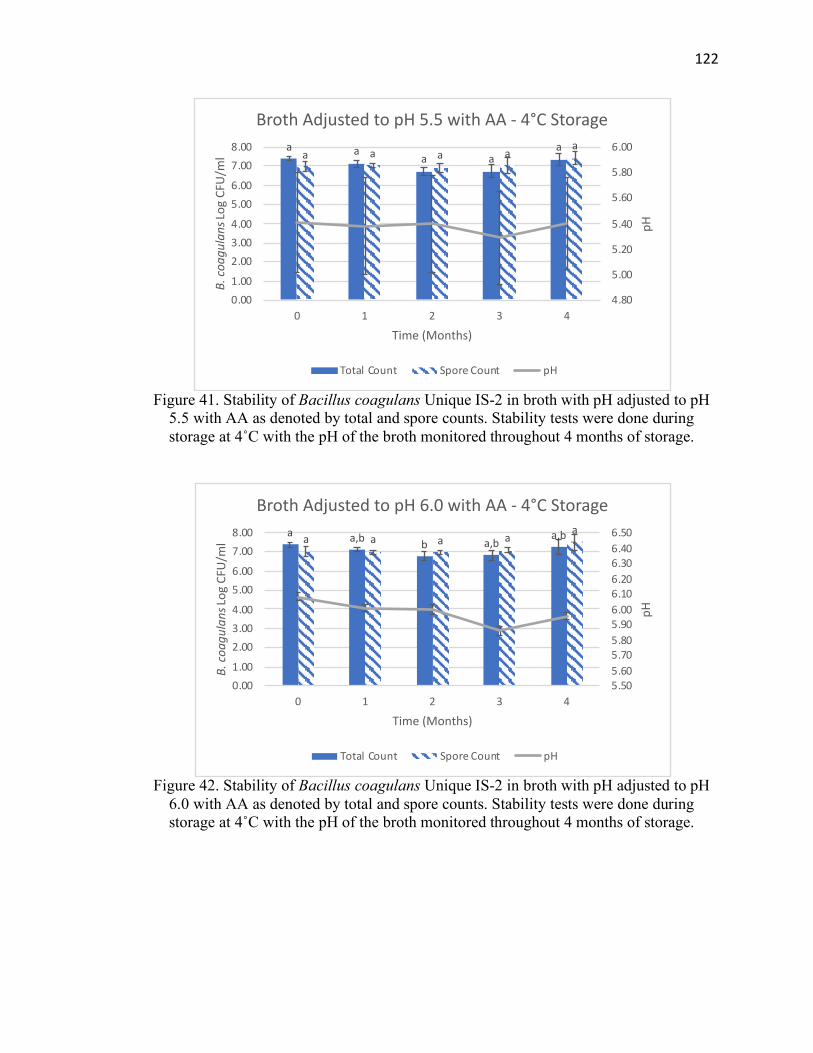
122
4 1
Figure 41. Stability of Bacillus coagulans Unique IS-2 in broth with pH adjusted to pH
5.5 with AA as denoted by total and spore counts. Stability tests were done during storage at 4˚C with the pH of the broth monitored throughout 4 months of storage.
Figure 42. Stability of Bacillus coagulans Unique IS-2 in broth with pH adjusted to pH
6.0 with AA as denoted by total and spore counts. Stability tests were done during storage at 4˚C with the pH of the broth monitored throughout 4 months of storage.
a aa a
aa a a a
a
4.80
5.00
5.20
5.40
5.60
5.80
6.00
0.00
1.00
2.00
3.00
4.00
5.00
6.00
7.00
8.00
0 1 2 3 4
pH
B. co
agul
ans L
og C
FU/m
l
Time (Months)
Broth Adjusted to pH 5.5 with AA - 4°C Storage
Total Count Spore Count pH
a a,b b a,ba,ba a a a
a
5.505.605.705.805.906.006.106.206.306.406.50
0.001.00
2.003.004.00
5.006.00
7.008.00
0 1 2 3 4
pH
B. co
agul
ans L
og C
FU/m
l
Time (Months)
Broth Adjusted to pH 6.0 with AA - 4°C Storage
Total Count Spore Count pH

123
4 1
Figure 43. Stability of Bacillus coagulans Unique IS-2 in broth with pH adjusted to pH
6.5 with AA as denoted by total and spore counts. Stability tests were done during storage at 4˚C with the pH of the broth monitored throughout 4 months of storage.
Figure 44. Stability of Bacillus coagulans Unique IS-2 in broth with pH adjusted to pH
3.0 with CA as denoted by total and spore counts. Stability tests were done during storage at 4˚C with the pH of the broth monitored throughout 4 months of storage.
a aa a
aa a a a
a
6.006.106.206.306.406.506.606.706.806.907.00
0.00
1.00
2.00
3.00
4.00
5.00
6.00
7.00
8.00
0 1 2 3 4
pH
B. co
agul
ans L
og C
FU/m
l
Time (Months)
Broth Adjusted to pH 6.5 with AA - 4°C Storage
Total Count Spore Count pH
a,b a a,bb
a
a a aa a
2.90
3.00
3.10
3.20
3.30
3.40
3.50
0.001.00
2.003.004.00
5.006.00
7.008.00
0 1 2 3 4
pH
B. co
agul
ans L
og C
FU/m
l
Time (Months)
Broth Adjusted to pH 3.0 with CA - 4°C Storage
Total Count Spore Count pH

124
4 1
Figure 45. Stability of Bacillus coagulans Unique IS-2 in broth with pH adjusted to pH
3.5 with CA as denoted by total and spore counts. Stability tests were done during storage at 4˚C with the pH of the broth monitored throughout 4 months of storage.
Figure 46. Stability of Bacillus coagulans Unique IS-2 in broth with pH adjusted to pH
4.0 with CA as denoted by total and spore counts. Stability tests were done during storage at 4˚C with the pH of the broth monitored throughout 4 months of storage.
a,b a,b a,b ba
a a aa a
3.40
3.50
3.60
3.70
3.80
3.90
4.00
0.001.002.00
3.004.00
5.006.007.00
8.00
0 1 2 3 4
pH
B. co
agul
ans L
og C
FU/m
l
Time (Months)
Broth Adjusted to pH 3.5 with CA - 4°C Storage
Total Count Spore Count pH
a,b a,b a,b ba
a a a a a
3.90
4.00
4.10
4.20
4.30
4.40
4.50
0.001.00
2.003.00
4.005.006.00
7.008.00
0 1 2 3 4
pH
B. co
agul
ans L
og C
FU/m
l
Time (Months)
Broth Adjusted to pH 4.0 with CA - 4°C Storage
Total Count Spore Count pH

125
4 1
Figure 47. Stability of Bacillus coagulans Unique IS-2 in broth with pH adjusted to pH
4.5 with CA as denoted by total and spore counts. Stability tests were done during storage at 4˚C with the pH of the broth monitored throughout 4 months of storage.
Figure 48. Stability of Bacillus coagulans Unique IS-2 in broth with pH adjusted to pH
5.0 with CA as denoted by total and spore counts. Stability tests were done during storage at 4˚C with the pH of the broth monitored throughout 4 months of storage.
a,b a,b b,c ca
a a a a a
4.30
4.40
4.50
4.60
4.70
4.80
4.90
5.00
0.00
1.002.00
3.004.005.00
6.007.008.00
0 1 2 3 4
pH
B. co
agul
ans L
og C
FU/m
l
Time (Months)
Broth Adjusted to pH 4.5 with CA - 4°C Storage
Total Count Spore Count pH
a a,b a,b ba
b a,b b ba
4.704.804.90
5.005.10
5.205.305.40
5.50
0.001.002.00
3.004.00
5.006.007.00
8.00
0 1 2 3 4
pH
B. co
agul
ans L
og C
FU/m
l
Time (Months)
Broth Adjusted to pH 5.0 with CA - 4°C Storage
Total Count Spore Count pH
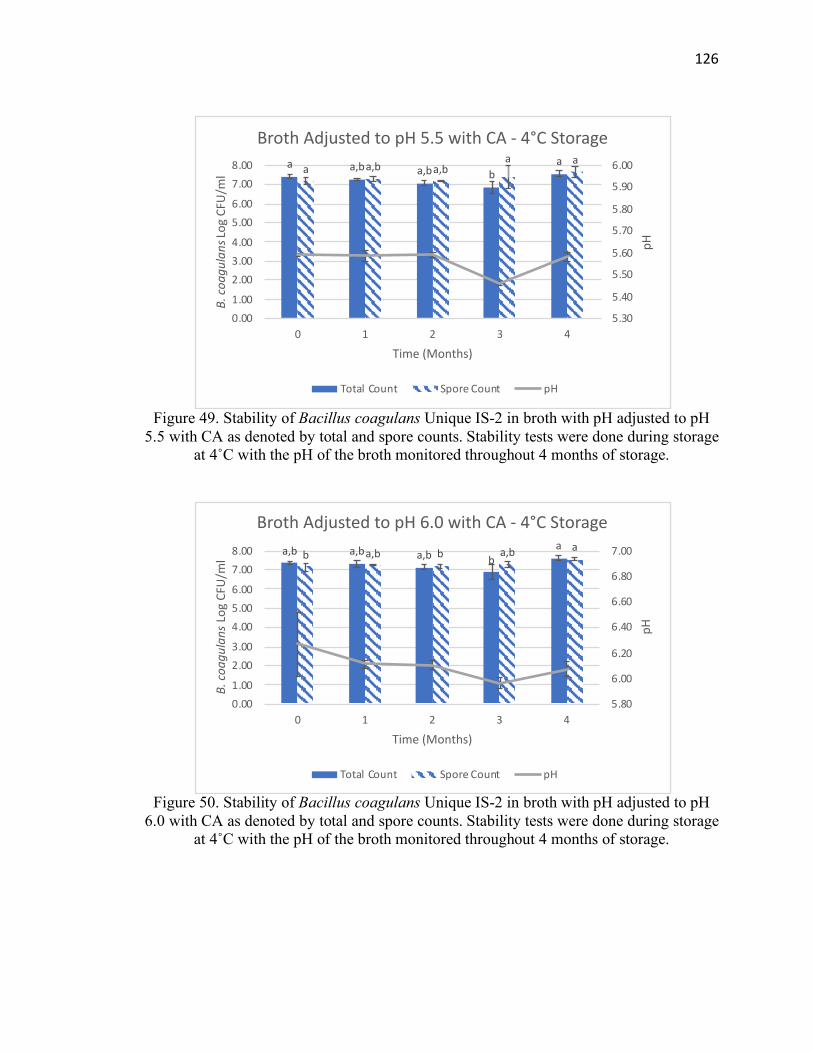
126
4 1
Figure 49. Stability of Bacillus coagulans Unique IS-2 in broth with pH adjusted to pH
5.5 with CA as denoted by total and spore counts. Stability tests were done during storage at 4˚C with the pH of the broth monitored throughout 4 months of storage.
Figure 50. Stability of Bacillus coagulans Unique IS-2 in broth with pH adjusted to pH
6.0 with CA as denoted by total and spore counts. Stability tests were done during storage at 4˚C with the pH of the broth monitored throughout 4 months of storage.
a a,b a,b ba
a a,b a,ba a
5.30
5.40
5.50
5.60
5.70
5.80
5.90
6.00
0.001.00
2.003.004.00
5.006.00
7.008.00
0 1 2 3 4
pH
B. co
agul
ans L
og C
FU/m
l
Time (Months)
Broth Adjusted to pH 5.5 with CA - 4°C Storage
Total Count Spore Count pH
a,b a,b a,b ba
b a,b b a,b a
5.80
6.00
6.20
6.40
6.60
6.80
7.00
0.001.00
2.003.00
4.005.006.00
7.008.00
0 1 2 3 4
pH
B. co
agul
ans L
og C
FU/m
l
Time (Months)
Broth Adjusted to pH 6.0 with CA - 4°C Storage
Total Count Spore Count pH

127
4 1
Figure 51. Stability of Bacillus coagulans Unique IS-2 in broth with pH adjusted to pH
6.5 with CA as denoted by total and spore counts. Stability tests were done during storage at 4˚C with the pH of the broth monitored throughout 4 months of storage.
Figure 52. Stability of Bacillus coagulans Unique IS-2 in broth with pH adjusted to pH 3.0 with HCl as denoted by total and spore counts. Stability tests were done during storage at 25˚C with the pH of the broth monitored throughout 30 days of storage.
a a,b b baa a a a a
6.10
6.30
6.50
6.70
6.90
7.10
7.30
7.50
0.001.002.00
3.004.00
5.006.007.00
8.00
0 1 2 3 4
pH
B. co
agul
ans L
og C
FU/m
l
Time (Months)
Broth Adjusted to pH 6.5 with CA - 4°C Storage
Total Count Spore Count pH

128
4 1
Figure 53. Stability of Bacillus coagulans Unique IS-2 in broth with pH adjusted to pH 3.5 with HCl as denoted by total and spore counts. Stability tests were done during storage at 25˚C with the pH of the broth monitored throughout 30 days of storage.
Figure 54. Stability of Bacillus coagulans Unique IS-2 in broth with pH adjusted to pH 4.0 with HCl as denoted by total and spore counts. Stability tests were done during storage at 25˚C with the pH of the broth monitored throughout 30 days of storage.

129
4 1
Figure 55. Stability of Bacillus coagulans Unique IS-2 in broth with pH adjusted to pH 4.5 with HCl as denoted by total and spore counts. Stability tests were done during storage at 25˚C with the pH of the broth monitored throughout 30 days of storage.
Figure 56. Stability of Bacillus coagulans Unique IS-2 in broth with pH adjusted to pH 5.0 with HCl as denoted by total and spore counts. Stability tests were done during storage at 25˚C with the pH of the broth monitored throughout 30 days of storage.

130
4 1
Figure 57. Stability of Bacillus coagulans Unique IS-2 in broth with pH adjusted to pH 5.5 with HCl as denoted by total and spore counts. Stability tests were done during storage at 25˚C with the pH of the broth monitored throughout 30 days of storage.
Figure 58. Stability of Bacillus coagulans Unique IS-2 in broth with pH adjusted to pH 6.0 with HCl as denoted by total and spore counts. Stability tests were done during storage at 25˚C with the pH of the broth monitored throughout 30 days of storage.

131
4 1
Figure 59. Stability of Bacillus coagulans Unique IS-2 in broth with pH adjusted to pH 6.5 with HCl as denoted by total and spore counts. Stability tests were done during storage at 25˚C with the pH of the broth monitored throughout 30 days of storage.
Figure 60. Stability of Bacillus coagulans Unique IS-2 in broth with pH adjusted to pH 8.0 with NaOH as denoted by total and spore counts. Stability tests were done during
storage at 25˚C with the pH of the broth monitored throughout 30 days of storage.

132
4 1
Figure 61. Stability of Bacillus coagulans Unique IS-2 in broth with pH adjusted to pH 3.0 with LA as denoted by total and spore counts. Stability tests were done during storage
at 25˚C with the pH of the broth monitored throughout 30 days of storage.
Figure 62. Stability of Bacillus coagulans Unique IS-2 in broth with pH adjusted to pH 3.5 with LA as denoted by total and spore counts. Stability tests were done during storage
at 25˚C with the pH of the broth monitored throughout 30 days of storage.

133
4 1
Figure 63. Stability of Bacillus coagulans Unique IS-2 in broth with pH adjusted to pH 4.0 with LA as denoted by total and spore counts. Stability tests were done during storage
at 25˚C with the pH of the broth monitored throughout 30 days of storage.
Figure 64. Stability of Bacillus coagulans Unique IS-2 in broth with pH adjusted to pH 4.5 with LA as denoted by total and spore counts. Stability tests were done during storage
at 25˚C with the pH of the broth monitored throughout 30 days of storage.

134
4 1
Figure 65. Stability of Bacillus coagulans Unique IS-2 in broth with pH adjusted to pH 5.0 with LA as denoted by total and spore counts. Stability tests were done during storage
at 25˚C with the pH of the broth monitored throughout 30 days of storage.
Figure 66. Stability of Bacillus coagulans Unique IS-2 in broth with pH adjusted to pH 5.5 with LA as denoted by total and spore counts. Stability tests were done during storage
at 25˚C with the pH of the broth monitored throughout 30 days of storage.

135
4 1
Figure 67. Stability of Bacillus coagulans Unique IS-2 in broth with pH adjusted to pH 6.0 with LA as denoted by total and spore counts. Stability tests were done during storage
at 25˚C with the pH of the broth monitored throughout 30 days of storage.
Figure 68. Stability of Bacillus coagulans Unique IS-2 in broth with pH adjusted to pH 6.5 with LA as denoted by total and spore counts. Stability tests were done during storage
at 25˚C with the pH of the broth monitored throughout 30 days of storage.

136
4 1
Figure 69. Stability of Bacillus coagulans Unique IS-2 in broth with pH adjusted to pH 3.0 with AA as denoted by total and spore counts. Stability tests were done during storage at 25˚C with the pH of the broth monitored throughout 30 days of storage.
Figure 70. Stability of Bacillus coagulans Unique IS-2 in broth with pH adjusted to pH 3.5 with AA as denoted by total and spore counts. Stability tests were done during storage at 25˚C with the pH of the broth monitored throughout 30 days of storage.
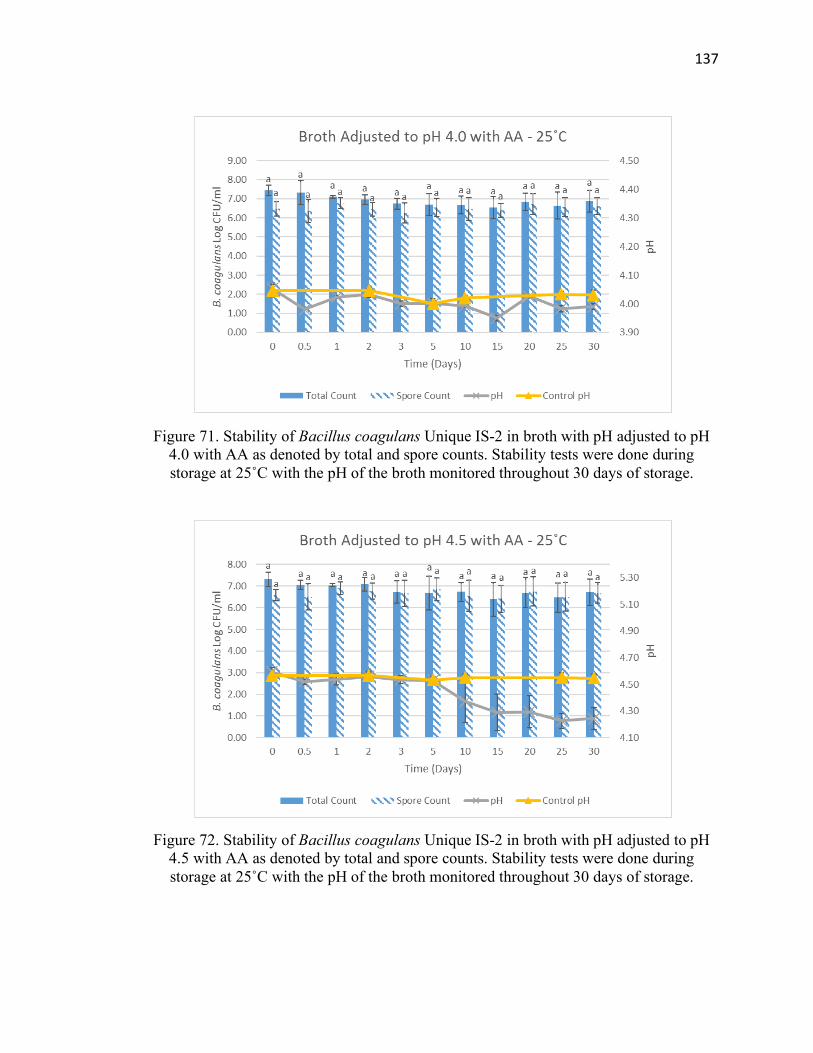
137
4 1
Figure 71. Stability of Bacillus coagulans Unique IS-2 in broth with pH adjusted to pH 4.0 with AA as denoted by total and spore counts. Stability tests were done during storage at 25˚C with the pH of the broth monitored throughout 30 days of storage.
Figure 72. Stability of Bacillus coagulans Unique IS-2 in broth with pH adjusted to pH 4.5 with AA as denoted by total and spore counts. Stability tests were done during storage at 25˚C with the pH of the broth monitored throughout 30 days of storage.

138
4 1
Figure 73. Stability of Bacillus coagulans Unique IS-2 in broth with pH adjusted to pH 5.0 with AA as denoted by total and spore counts. Stability tests were done during storage at 25˚C with the pH of the broth monitored throughout 30 days of storage.
Figure 74. Stability of Bacillus coagulans Unique IS-2 in broth with pH adjusted to pH 5.5 with AA as denoted by total and spore counts. Stability tests were done during storage at 25˚C with the pH of the broth monitored throughout 30 days of storage.

139
4 1
Figure 75. Stability of Bacillus coagulans Unique IS-2 in broth with pH adjusted to pH 6.0 with AA as denoted by total and spore counts. Stability tests were done during storage at 25˚C with the pH of the broth monitored throughout 30 days of storage.
Figure 76. Stability of Bacillus coagulans Unique IS-2 in broth with pH adjusted to pH 6.5 with AA as denoted by total and spore counts. Stability tests were done during storage at 25˚C with the pH of the broth monitored throughout 30 days of storage.

140
4 1
Figure 77. Stability of Bacillus coagulans Unique IS-2 in broth with pH adjusted to pH 3.0 with CA as denoted by total and spore counts. Stability tests were done during storage
at 25˚C with the pH of the broth monitored throughout 30 days of storage.
Figure 78. Stability of Bacillus coagulans Unique IS-2 in broth with pH adjusted to pH 3.5 with CA as denoted by total and spore counts. Stability tests were done during storage
at 25˚C with the pH of the broth monitored throughout 30 days of storage.

141
4 1
Figure 79. Stability of Bacillus coagulans Unique IS-2 in broth with pH adjusted to pH 4.0 with CA as denoted by total and spore counts. Stability tests were done during storage
at 25˚C with the pH of the broth monitored throughout 30 days of storage.
Figure 80. Stability of Bacillus coagulans Unique IS-2 in broth with pH adjusted to pH 4.5 with CA as denoted by total and spore counts. Stability tests were done during storage
at 25˚C with the pH of the broth monitored throughout 30 days of storage.

142
4 1
Figure 81. Stability of Bacillus coagulans Unique IS-2 in broth with pH adjusted to pH 5.0 with CA as denoted by total and spore counts. Stability tests were done during storage
at 25˚C with the pH of the broth monitored throughout 30 days of storage.
Figure 82. Stability of Bacillus coagulans Unique IS-2 in broth with pH adjusted to pH 5.5 with CA as denoted by total and spore counts. Stability tests were done during storage
at 25˚C with the pH of the broth monitored throughout 30 days of storage.

143
4 1
Figure 83. Stability of Bacillus coagulans Unique IS-2 in broth with pH adjusted to pH 6.0 with CA as denoted by total and spore counts. Stability tests were done during storage
at 25˚C with the pH of the broth monitored throughout 30 days of storage.
Figure 84. Stability of Bacillus coagulans Unique IS-2 in broth with pH adjusted to pH 6.0 with CA as denoted by total and spore counts. Stability tests were done during storage
at 25˚C with the pH of the broth monitored throughout 30 days of storage.