characteristics of the industrial distributor's … - characteristics of...
TRANSCRIPT

J PROD INNOV kiANAG 227 lYXX:5:227-2JO
Characteristics of the Industrial Distributor's Innovation Activities An Exploratory Study
Eunsang Yoon and Gary L. Lilien
Recent trends in industrial distribution suggest that distributors may perform an important role in various stages of product innovation from idea generation, through product design, to product launch and subsequent marketing. In this article, Eunsang Yoon and Gary Lilien review the litera- ture and discuss the potential role of the indus- trial distributor as an innovation participant. An exploratory study with an Australian data base suggests that the industrial distributor performs tasks associated with market-driven product in- novation (reformulation and imitative new prod- ucts in particular) as eflectiuely as the industrial manufacturer.
Address correspondence to Eunsang Yoan. Department of Mar- keting. University of l.awrll. I University Pivenue. Lowell. MA 01854.
B 1988 Elsevier Science Pubilshing C o . . inc 52 Vandribiit Ave.. New Yoik. N Y 10017
Introduction Market coverage and customer contact are the primary functions of an industrial distributor. Re- cent trends in distribution, however, suggest that the industrial distributor may become an efficient participant not only in generating and screening ideas, but also in designing products and testing them in the market. The potential advantages for the industrial distributor are expected to be great- est in market-driven product innovations.
In the next section we discuss the changing distribution environment in the United States. Following that, we explore the potential role of the industrial distributor as an active participant in product innovation. Using a data base of 135 industrial firms, we then examine the innovation activities of Australian manufacturers and distri- butors. We describe a comparative analysis be- tween the traditional manufacturer and distri- butor and the distributor owning manufacturing facilities and the manufacturer performing distri- bution functions. Finally, we discuss the implica- tions of our empirical results and future research directions.
Trends in Industrial Distribution Innovation Functions of the Industrial Distributor
The industrial distributor is a full-service interme- diary who performs a broad range of marketing channel functions between industrial manufac-
07?7-6iX218X~$I.SO

228 J PROD INNOV M A N A G E. Y O O N A N D C. L. L l L l E N IQ88~:5:127-21(1
BIOGRAPHICAL SKETCHES
Eunung Yoon is Assisiant Professor of Markclmg and Research Director of the lnstiluro tbr ihc Study of Business Markeir. Applica-
tion Gmup, at Univrnily of Lowell. He received a 8..4, in ecunomics from Seoul Narsonal University. Korea. and M.R.A. from ihr Univer- viiy of Georgia and a Ph.D. from Pen" Stale Unlvcrrlly. Prlur to
joining University of Lowell. he srrvcd nr u ierrilrch asacii~tc ibr the Institute for the Study of Business Markets ac Pen" Slate and Vrsghl at
Aublnrn Un iver~ i ty His work has been published in Aliuczrrc rr ir, &,rr-
rrrrr Merkrlitte. 1,xrrifi~c.s. Tlrr J,,rrroiii i,l'Pnuiii< r O,nouuiii,rr ~Marr -
oxcazc,,!, and Rrclierriic cr Applicoli,rr?.v I.,, Msdrr,ttr. Hi \ re\e;trch inlrrertr include pmduct innovattun. prbcing m d bilrinen m;trkcting. Gary L. Lelirn is Research Professui of M;~n;bi.emenl Science ;,nd
Research Director of rhrr insl~tukc for rhr Sludy of Bu,ine\\ M:likci\
;st Pen" Sfate University. He prevsourly taught at she Sloan Schlnil uf Manegemen1 at MLT. He holds a 6,s.. iind M.S. and a D.E.S. from Columbia School of Engineering. H e has published widely in the ;area> of new product planning. business marketing. mlt mnni6gement rci- cnce application in marketing. He is author or corulhoioifuur books
including Mcirkre,r(r Drri?iorr Melhz,~: A M a ~ k i B<iiitli,!s Appcixs h (Harper and Raw. 1983) and Mtvkrrinn Mcir,rri.<~rtrrrr,: A,rnii,ric L w r -
i i . v n iwirh L,,rar 1-2-3 (The Scienbifrc Pierr. IYXXI. Cle was Depiin-
mcnl Editor. Matketing. for M~otrt,vrmco, Sci',ncc. \erver on the edi-
tonal board of the Jo~nnrol o / Meilrritrp ;~nd ,r Wilor-in-Chief of
/>z'ed;,c',.s.
turers and industrial end-users. The distributor contacts customers, makes the product available by providing the necessary supporting services (such as delivery, credit, technical advice, repair service and sometimes assembly or light manu- facturing) and participates in promoting the product.
The industrial distributor has traditionally been chosen by the manufacturer and, for marketing new products, has been seen as less effective than the manufacturer's salesforce [30]. Craw- ford [6] suggests, however, that the industrial dis- tributor could be a suitable channel member for a product that (1) has a large potential customer base, (2) is a stockable item, (3) is sold in small quantities, (4) is a low-involvement item for the customer or (5 ) requires rapid delivery and ser- vice. Webster [31] also suggests that in certain situations a better product development program can be devised by the distributor or through a closer relationship between the manufacturer and the distributor. These propositi0n.i are based on the reasoning that, because the industrial distri- butor is more customer-oriented than supplier- oriented, it can develop market-driven innova- tions more effectively.
Recent Trends in US Industrial Distribution
Distributors are the most important force in in- dustrial distribution channels. A survey by Indus- trial Distribution [14] reports that in 1982 the number of industrial distributors in the United States was about 12,000, and the total sales vol- ume was about $43 billion. Distributors are typi- cally small and working-capital intensive. They serve a small geographic area, although those few with over 100 branches approach the "supermar- ket" status 171. A typical firm's sales were $2.1 million, the number of employees was 12.1 and the salesforce was 3.85. The order size of an aver- age customer was small, $150 to $200, and net profits are relatively low (2.5% of sales and 7.0% return on investment). The assets of a typical dis- tributor are broken down into 57.4% for inven- tory, 32.2% for receivables, 4% for cash and 6.4% for other items.
In recent years, however, several important trends in industrial distribution have been ob- served in the United States and are summarized in Exhibit 1. Larger, more sophisticated distri- butors have emerged [22], and chains of distri- butor outlets that are owned and managed by large corporations exhibit strong market power and customer loyalty [20].
The industrial distributor has begun performing more functions for both the manufacturer and the end-user [12]. In surveying electronics distri- butors, Narus and Anderson [24] found that man- agers believe that a greater proportion of certain selling tasks will be reallocated from manufac- turers to industrial distributors. The distributor's salesforce would take a greater role in pros- pecting, specifying products, problem solving and maintaining sound relations with end-users. In particular, outside salespersons would take greater responsibility for identifying potential customers, determining their requirements, and recommending the kinds of products and services that the distributor should offer. The evolution of the distributor's function has been driven by the increases in manufacturers' selling costs [23] and the technical complexity of the many industrial products that require more customer service [24], and has resulted in the increase of the proportion of industrial products sold through distributors - [ a .
The industrial distributor has developed more

INDUSTRIAL DISTRIBUTOR'S INNOVATION J PROD I N N O V MANAC: 729 isnx:i:??7-2~11
control over marketing channels [25] on the basis of its increased market power and marketing functions. In certain situations, the manufacturer relinquishes control over the marketing mix in favor of the distributor's choices on product pol- icy, pricing and communications [6]. The evolu- tionary shift of power from the manufacturer to the distributor bas been supported by ( I ) the com- puterization of the distributor's operation [5, 271 and (2) the concentration of the distributor's ef- forts on restricted product lines [13]. All of these factors positively affect the distributor's capabil- ity and involvement in product innovation ac- tivities.
Potential Roles of the Distributor in Product Innovation The industrial distributor may figure in the manu- facturer's innovation program as a channel mem- ber. Understanding market needs and serving the target market more effectively with new products depends on cooperation between the manu- facturer and the distributor. In a traditional, independent manufacturer-distributor system, however, the distributor may not be part of the new product introduction team because the distri- butor wants to act as a "purchasing agent to its customers" as well as a partner with the manu- facturer. The relationship between the manufac- turer and the distributor may be characterized by conflict or coercion based on the power of each channel member [26, 9, 101. Confrontations be- tween manufacturer and distributor are often in- herent in the product, pricing and promotion strategies [6].
One way to involve the distributor more fully is to have it act as an active member of the manu- facturer's new product project team. The manu- facturer may be able to recruit distributors as team members in the overall product innovation program from an early stage of product develop- ment. Trust is an essential element in such a channel working relationship [ I , 21. The distri- butor, however, may greatly affect the manufac- turer's innovation activities. Even when firms have achieved a cooperative, productive partner- ship, one usually controls the other 161. The dis- tributor may be strong enough to handle various marketing functions, including product develop- ment. An innovation-oriented distributor may ac-
Exhibit 1. Recent Trends in Industrial Distribution
I . Market power has strengthened. Larger, more sophisticated distributors emerge 1221. ~--' Chains of distributor outlets owned by large cor- orations exhibit strone market Dower 1201. - . .
2. Marketing function has expanded. Distributors are beginning to perform more func- tions for both the manuPdcturers and the end- users [121. Managers believe that certain selling tasks are re- allocated from manufacturers to distributors 1241. Higher selling costs of manufacturers increase the importance of distributors 1231. Technical complexity of many industrial products requires distributors' involvement in product de- velopment 1241. The proportion of industrial products sold through distributors increases iS1.
channels [25]. In certain situations, manufacturers relinquish control over the marketing-mix in favor of the dis- tributor's choice on product policy, pricing and communication 161. Distributors concentrate their efforts on restricted product lines, increasing the distributor's exper- tise and control [HI. Introduction of computers and innovative tele- communications equipment enable distributors to access information rapidly, increasing the distri- butor's capability of channel control i5. 271.
tively identify new market opportunities, gener- ate and evaluate new product ideas through its distribution network, develop product specifi- cations and contact manufacturers to produce to specifications. Strong distributors may obtain control over a new product developed by a fi- nancially weak or inexperienced manufacturer.
A second possible role is for the industrial dis- tributor and manufacturer to combine into a sin- gle corporate system. A vertical integration of the marketing system may achieve economies in de- veloping and marketing new products that cannot be realized through the use of the conventional marketing channel [21]. Under the corporate ver- tical marketing system [16], successive stages of production and distribution are owned through forward and backward integration by a single en- tity. Examples are Sherwin-Williams. which

230 I PROD INNOV MANAG E. YOON A N D G . L. LlLiEN 1988:5:227-240
owns and operates 2,000 retail outlets, and Hart, Shaffner & Marx, which operates 275 stores. Singer, International Harvester, Goodyear and Sohio are other examples of forward integration of retailers by manufacturers. Another is the ac- quisition of Conoco Inc. by Dupont in 1981 131. An example of backward integration by the in- dustrial distributor is an electrical distributor with seven manufacturing facilities [28]. Vertical mar- keting systems have become the dominant model of distribution in consumer marketing, serving as much as 64% of the total market [161, and are expected to account for over 85% of the total retail sales in the 1980s 1151. Similar trends may be developed in industrial marketing and distri- bution.
A third role is for the industrial distributor to be a partner or a team member in product innova- tion for the end-user firms. The end-user manu- facturer may need the market expertise of the industrial distributor to develop a new product. Component distributors in the electronic industry are frequently asked to participate in designing and developing a new component for the end- user's product [29]. In certain circumstances, the industrial distributor may even perform part of the assembly or manufacturing function of his customer firm.
Considering the trend discussed in the previous section, we expect industrial distributors would pursue all three of the roles outlined here. The empirical analysis below focuses on the second role, which is the integration of manufacturing and distribution functions for a positive synergy in the product innovation activities and perfor- mance. We are interested in two propositions: (1) because the distributor is typically customer- oriented, its contribution is expected to be great- est for market-driven product innovations; and (2) because the distributor is typically small, its role as an innovation participant is likely to be achieved more effectively through interactions with manufacturers rather than through indepen- dent in-house product develooment.
the Chisholm Institute of Technology in 1986. The survey sought (I) a general description of the firins, (2) motives for being innovative, (3) idea sources, (4) market testing methods, (5) innova- tion performance and (6) the perceived reasons for success. A total of 135 completed question- naires was received from 11 1 manufacturers, 20 distributors and 4 service suppliers that are active in product development and distribution. The fre- quency distribution of these firms across industry sector and sales volume is seen in Table l,A and B. Manufacturers were sampled more in engi- neering, chemical and construction industries, whereas distributors were sampled more in elec- tric/electronics and engineering industries, re- flecting the policy emphasis and innovation inten- sity in Australia. The sales volume of the manufacturer is distributed over a range of less than $1 million to over $200 million with a median of $22.6 million; that of distributor ranges from $1 million to $100 million with a median of $17.5 million. Exploratory studies' by Link [I91 and Gauvin, Lilien and Link 11 11 report that the data base represents a good cross-section of Austra- lia's leading industrial companies.
Manufacturing-Distribution Categorization
On the basis of the firm's primary function, we differentiated the industrial firms in the data base by manufacturer and distributor. Then we di- vided them into four categories. Category MM includes the manufacturer firms that manufacture 100% of their new products in their own plants. Category MD includes those manufacturers for whom outside suppliers manufacture some new products. Category DM includes the distributor firms that manufacture some of their new prod- ucts in their own plants. Category DD includes those distributors whose new products are manu- factured entirely by other firms. Thus, in terms of the, corporate marketing system we discussed
I Link (191 investigated success and failure determinants of new industrial products with this data base. He found that the companies
Innovation Activities of Australian with more innovative new product programs have significantly dif-
Industrial Firms The Data Base
ferent success and failure hctors at work than their less innovative counlerparts.
Gauvin, Lilien and Link 11 11 observed that, with respect to prod- uct innovation, the industrial firms in Auskrzlia arc similar t o those
A survey of the innovation activities of lead- in North America 14. IS1 and Europe I321 in failure rate, motives and idea source, but differ in screening research procedure and overall
ing industrial firms in Australia was conducted by competit~veness.

I N D U S T R I A L DISTRIBIITOR'S INNOVATION J PROD I N N O V M A N A G 23 1 19Xx:5:Zi7-~40
Table 1. Description of the Australian Data Base A. By Industry Sector
Composition (%)
Service Manufacturer Distributor supplier Total
Industry sector (n = 111) (n = 20) (n = 4) (n = 135)
Minerals, metals, fuels 4 10 - 4 Chemicals, paints, plastics 18 5 - 16 Food components, machinery 9 5 - 8 Engineering equipment 26 20 25 25 Transportation equipment 5 10 - 6 Building products 14 - - 11 Eiectricielectronic equipment 5 30 - 9 Office equipment, supplies 4 5 - 4 Packing materialsiequipment I I - 25 10 Industrial services I - 50 3 Industrial supplies 3 15 - 4
B. By Company Sales
Composition ('3%)
Annual sales Service ($million) Manufacturer Distributor supplier Total
Under 1.0 1 0 0 1 1- 4.9 10 15 50 12 5- 9.9 11 20 0 12
10- 24.9 34 35 25 34 25- 49.9 16 15 0 16 50- 99.9 17 10 0 16
100-149.9 4 5 0 4 150-199.9 4 0 0 3 200 or over 4 0 25 4 Median ($million) 22.6 17.5 10.0 21.4
previously, the Category MD firm is the manufac- turer who has vertically integrated the distribu- tion function forward, and the Category DM firm is the distributor who has vertically integrated the manufacturing function backward. Table 2 shows the number of firms for each group: 55 manufac- turers in Category MM, 45 manufacturers in Cat- egory MD, 11 distributors in Category DM, and 9 distributors in Category DD. Table 3 summarizes the industry sector and sales statistics for each of these four categories.
the manufacturers' (Category MM and MD firms) and the distributors' (Category DD and DM firms) innovation strategies, idea generation and evaluation methods and success rates and deter- minants.
With respect to the overall innovation strategy (Table 4A), we found that:
1.' New products accounted for about 30% of to- tal sales for both manufacturers and distri- butors.
2. The distributor had launched and planned to launch more new products than the manufac-
Results of Comparative Analysis turer, reflecting the typical market structure in Manufacturer versus distributor. Table 4 sum- which distributors are networked to manufac-
marizes the results of a comparative analysis of turers.

232 l PROD INNOV M A N A G E. YOON A N D G . C. LILIES IY8X:5:127-240
Table 2. Manufacturer-Distributor Categorization
Number of firms by company's primary function
Manufacturing- distribution mix Manufacturing Distribution
100% of the Category MM: 55 products were manufactured in its own plants
Some of the Category MD: 45" products were manufactured by outside suppliers
Some of the Category DM: 1 l h products were manufactured in its own plants
100% of the Category DD: 9 products were manufactured by outside suppliers
Total 100' 20
'The average propoflion of the new products manufactured by outside suppliers was 53.2%
bThe average proportion of the new products manufactured in the distributor's own plants was 57.8%
I I out of i l l manufacturer firms did not provide the informa- tion required for this categorization.
3. Reformulations (or line extensions) accounted for more than 50% of the new products for both manufacturers and distributors. For other products, the distributor was more imi- tation-oriented and less original product- oriented than the manufacturer.
4. Motives for product innovation were similar for manufactuers and distributors. Major mo- tives were (a) to meet financial goals, (b) to meet changes in customer needs and (c) to be seen as innovative.
With respect to the source of idea generation and the method of project evaluation (Table 4B), we found that:
1. Both manufacturers and distributors relied on market research, customer requests, sales or marketing teams and overseas technology. Among these sources, however, market re- search was parttculariy important to the manu-
facturer; overseas technology seemed more important to the distributor.
2. The two project evaluation techniques that were most widely used were strategy determi- nation and customer trailing. Both were used by 50% to 70% of the manufacturers and distri- butors. Manufacturers also employed "con- cept testing," but distributors relied more on "test marketing."
And with respect to the success rate and the success factor of the product innovation (Table 4C), we found that:
1. Both the manufacturer and the distributor re- ported that about 50% of the new products launched in the past two years had been "clear-cut successes." "Clear-cut failures" accounted for 11% to 13% and the rest, 36% to 38% were "too early to tell" or "don't know."
2. Both the manufacturer and the distributor re- ported that the major factors of new product success were (a) synergy between the new product and the current products, (b) user ben- efit and quality of the new product and (c) ap- propriateness of marketing mix instruments. In addition, the efficiency of project manage- ment and the availability of stock were re- ported by the manufacturer as important fac- tors of new product success.
In order to examine the impact of forward and backward integration on the innovation strategy and performance, we performed the two-group mean tests for the two categories of the manufac- tueres (MD and MM firms) and for those of the distributors (DM and DD firms). We summarize the results of these comparative analyses (Table 51, focusing on the heterogeneous characteristics between categories.
MD manufacturer versus MM manufac- turer. Category MD manufacturer (or the rnanu- facturer, some of whose new products were man- ufactured by outside suppliers) and Category MM manufacturer (or the manufacturer, 100% of whose new products were manufactured in its own plants) were virtually homogeneous in their innovation strategy, idea source and project eval- uation method and success rate and success fac- tors (the first versus the second columns in Table 5, A to C). Some minor differences were that:

INDUSTRIAL I)ISTRIBUTOR'S I N N O V A T I O N J PROD INNOV M A N A G 233 I')XX:S:3Zi-240
Table 3. Industry and Sales for Each Category
Number of firms by manufactureridistrihulo~- c;~tefory.'
Sector and sales MM(55) MD(45) DM(II) DD(9)
Industry sector Minerals, metals, fuels 1 I - 2 Chemicals, paints, plastics 10 7 1 - Food components and machinery 8 2 - 1 Engineering equipment 13 15 2 2 Transportation equipment 3 2 1 I Building products 7 7 - - Electricalielectronic equipment 2 3 5 I Office equipment, supplies 3 - - 1 Packing materialsiequipment 6 5 - - Industrial services 1 1 - - Industrial supplies 1 2 2 1 Total 55 45 I1 9
Company's annual saies Under 1.0
1- 4.9 5- 9.9
10- 24.9 25- 49.9 50- 99.9
100-149.9 150-199.9 200 or over
Median annual sales ($million)
.' Bilsed on the c;~regol-iz;ction in T:,hlu 1
1. The MD manufacturer reported that new prod- ucts accounted for a smaller percentage of its firm's sales.
2. The MD manufacturer was more motivated to innovate in order to "cope with the slow growth of current products," while the Mhf manufacturer was more motivated to innovate in order to "meet changing customers' needs," and "to be seen as innovative."
3. The R&D/engineering and production staffs generated many of the new product ideas for the MM manufacturers; competitors and sup- pliers tended to be important sources of new ideas for the MD manufacturers.
DM distributor versus DD distributor. The DM distributor (or the distributor, some of whose new products were manufactured in its own plants) and the DD distributor (or the distributor, 100% of whose new products were manufactured by outside suppliers) were homogeneous in sev-
eral aspects of their innovation strategy and per- formance, but heterogeneous in other aspects (the third versus the fourth columns of Table 5 , A to C). Major differences between these groups are that:
1. The DM distributor reported fewer sales of new products than did the DD distributor.
2. The DM distributor was more likely to de- velop new products in response to "changes in customer needs and technology" and to "cope with the slow growth of current products."
3. The DM distributor generated more new prod- . . uct ideas "from overseas technology" and through "sales and marketing teams" and "R&Diengineering and production staffs."
4. "Test marketing" was not widely used by the DD distributor.
5. The DD distributor reported that "the appro- priateness of the distribution channel" and "stock management" were important for the

J PROD INNOV MANAG l988:5:?27-290
E. YOON ANDG. I.. LILIEN
Table 4. Manufacturer Versus Distributor A. Innovation Strategy (LevellFocus/Motive)
Two-group Manufacturers Distributors mean test
Innovation strategy measures (n = 101) fn = 20) statistic"
Proportion of 1985 sales accounted for 29.9 31.3 .43 by products less than five years old(%)
Number of products launched in the 12.1 29.4 .I6 past two years
Number of products planned to be 9.1 30.1 .09 launched in the next iwo years
Reformulationslline extension(%) 51.3 51.0 .97 Imitative new products(%) 24.3 40.3 .10 Innovative new products(%) 24.4 8.7 .OO Motives of new product launchh
To meet financial goals 7.2 8.0 .21 To match competitors' innovations 5.4 5.6 -82 To be seen as innovative 7.3 6.2 .06 To meet changes of customer needs 7.5 7.4 .8 1 Availability of technology 5.7 5.6 .83 Slow growth of current products 6.1 5.4 .29 Forced by government legislation 2.9 2.9 .95 Changes of raw material costs 4.4 3.9 .44
I' Two-tail probability that the two-group means are equal. "~easured by I- to 10-point scales: I = not very important. I 0 = very irnpog-tant.
B. Project Management: ldea Source and Evaluation
Two-group Manufacturers Distributors mean test
Project management measures in = 101) ( n = 20) statistic"
ldea Source Market research on consumer needs 7.1 5.9 1 0 Customers' requests 7.6 6.9 .1? Sales or marketing team's ideas 7.4 7.1 .53 inspired by competitor 5.3 5.5 .75 Supplier suggestions 3.9 5.0 1 0 R&Dlengineering ideas 5.7 4.5 .0i Patent search 2.4 2.6 .6h Production staff ideas 5.2 3.8 .50 External inventor's ideas 2.8 4.0 .I4 Overseas technology sources 6.6 8.0 .07 . . Project Evaluation Method(%)" Concept testing 37.6 10.0 .OO Preference testing 21.8 15.0 .50 Strategy determination 49.5 70.0 .I0 Customer trailing 60.4 60.0 .97 Test-marketing 17.8 25.0 .46 None used 10.9 5.0 .32
" Same as in A. ' Proporlion of the firms that used the releranl market research method.

INDUSTRIAL DISTRIBUTOR'S INNOVATION I PROD I N K O V M A N A G 235 19XK:S:ZZ7-2411
C. Success Rate a n d Reasons
Two-group Manufacturers Distributors mean test
Success ratelreason measures (n = 101) (n = 20) statistic'
Successifailure rate(%)b Clear-cut success 51.1 50.3 .92 T o early to tell 36.0 32.6 .66 Clear-cut failure 11.0 12.9 .66 Don't know 2.0 4.2 .32
Success factors' Market and competition
Market was large and rapidly growing 4.5 3.6 .24 Market was not very competitive 7.2 7.5 .79
Product Benefit and Quality Product offered big benefits to users 3.2 3.6 .50 Product quality was quite satisfactory 2.8 3.3 .31
Ease of Adoption Product was extremely novel 5.1 5.0 .87 Product could be tried on a small scale 5.0 5.2 .83 Product needed little change in behavior 3.8 3.6 .75
Synergy Product was compatible with current
I. technicaliproduction capability 2.2 3.6 . I3 2. marketing skills 2.2 2.7 .53
Marketing Targeting and pricing were appropriate 3.0 3.5 .41 Adequate sales effoit was allocated 3.8 3.6 .71 Adequate promotion was allocated 3.9 3.9 .97 Distribution channels were appropriate 3.1 4.0 .29
Production Stock availability was adequate 3.3 4.5 .07
Research Internal research was sufficient 5.7 5.5 -82 External research was sufficient 5.2 4.6 .36 Market was correctly predicted
Project Management Dedicated advocate was responsible 3.1 4.8 .08 Development stages were well managed 3.4 4.7 .03
" Same as in A. "Proportion out of the new products that were launched in the past two years. ' Measured by I- to 10-point scales: 0 = strongly agree. 5 = neither agree nor disagree. 10 = strongly disagree.
success of its new products. But they were not formed manufacturing and distribution functions. very important to the DM distributor. They employed similar innovation strategies and
their new products accounted for about the same To complete our comparative analysis between proportion of total sales (the second versus the each pair of manufacturing-distribution mix third columns in Table 5 , A to C), Other charac- categories, we also performed two-group mean teristics of these categories of manufacturers and tests for the MD manufacturer against the DM distributors are that: distributor. and for the MM manufacturer against - the DD distributor. 1. The MD manufacturer reported that it would
MD manufacturer versus DM distributor. Both launch a smaller number of new products in the MD manufacturer and the DM distributor per- the next two years than would the DM distri-

236 J PKOD INNOV MANAC tYXX:5:ZZ7-240
E. YOON A N D C. L. LlLlEN
Table 5. Comparison Between ManufacturerIDistributor Categories A. Innovation Strategy (LevelIFocusliMotive)
Manufactureridistributor category"
innovation strategy measures MM(55) MD(45) DM(11) DD(9)
Proportion of 1985 sales accounted 36.Y 22.2 25.Sb 48.2 for by products less than five years old(%)
Number of products launched in 12.8 11.3 42.1 13.9 the past two years
Number of products planned to be 10.5 7.6b 47.Sb 8.8 launched in the next two years
Reformulationslline extension(%) 51.4 50.0 55.2 45.2 Imitative new products(%) 23.2 26.1 35.4 47.1 Innovative new products(%) 25.3 23.9b 9.4 7.7b Motives of new product launchC To meet financial goals 7.3 7.0b 8.6 7.2 To match competitors' innovations 5.3 5.4 6.4 4.6 To be seen as innovative 7.7b 6.8 6.5 5.Xb To meet changing customers' needs 7.9b 7.0b 8.Sb 5.9b Availability of technology 6.0 5.4 6.Sb 4.4 Slow growth of current products 5.6b 6.6 6.5" 4.0' Forced by government legislation 3.1 2.8 3.1 2.7 Changes of raw material costs 4.3 4.5 4.7 2.8
'' The four manufactureridistributor categories are defined in Tahle 2. "tndicales that the difference is statislicaliy significant at It. I level in the Iwo-group mean lerls. M M is compared ro MD. MD to DM. DM
to DD. and DD to M M . ' Measured by I - to 10-point scales: I = not very imponant. I0 = very import:rnt.
B. Idea Generation and Evaluation Methods
Manufactul-er/distribut<~r c;~tegory
innovation strategy measures MM(55) MD(45I DM(III DD(9)
Idea Source Market research on consumer needs 7.1 7.1 6.7 4.9" Customers' requests 7.5 7.8 7.5 6.0 Sales or marketing ream's ideas 7.4 7.3 7.9" 6.0h Inspired by competitor 4.9" 5.7 6. I 4.7 Supplier suggestions 3.4" 4.3 5.7 4.0 R&D/engineering ideas h.4h 4.8 5.8" 2.8" Patent search 2.3 2 .5 1.8 1.3 Production staff ideas 4.6h 3.6" 5.2" 2.0" External inventor's ideas 2.6 3.0 3.5 4.6 Overseas technology sources 6.5 6.7h 9,0h 6.7
Project Evaluation Method(%)' . .
Concept testing 36.6 40.0 18.2 0.0" Preference testing 23.6 20.0 18.2 1 1 . 1 Strategy determination 49.1 49.0 63.6 77.8 Customer trailing ' 63.6 55.6 72.7 44.4 Test-marketing 10.9 26.7 9. l ' ~ 44.4h None used 7.3 15.6 0.0 I l l
~
' S a m e as in A. "ame as in A .
f'roporlion of the 1,irns that used the rrlrvnnt market research inethiid.
INDUSTRIAL DISTRIBUI'OR'S ~ N N O V A T I O N J PROD I N N O V M A N A G 237 lY88:~:227-2JO
C. Success Rate and Reasons
Manufdcturerldistrihutor category"
Innovation strategy measures M M MD DM DD
SuccesslFailure Rate(%%.)' Clear-cut success 59.5 42.0 49.6 51.2 T o early to tell 30.6 41.1 32.5 32.8 Clear-cut failure 7.4 15.6 13.8 11.9 Don't know 2.5 1.3 4.2 4.2
Success Factors" Market and Competition
Market was large and rapidly growing 4.7 4.1 4.5 2.6h Market was not very competitive 7.3 7.2 7.3 7.7
Product Benefit and Quality Product offered big benefits to users 3.4 2.8 3.8 3.3 Product quality was quite satisfactory 2.7 2.9 3.5 3.0
Ease of Adoption Product was extremely novel 5. I 4.9 4.6 5.6 Product could be tried on a small scale 5.4 4.5 5.4 4.9 Product needed little change in behavior 4.1 3.5 3.2 4.0
Synergy Product was compatible with current
I . technicallproduction capability 2.0 2.4 3.9 3.1 2. marketing skills 2.4 1.9 3.5 1.7
Marketing Targeting and pricing were appropriate 3.1 2.8 4.1 2.8 Adequate sales effort was allocated 3.9 3.5 4.0 3.0 Adequate promotion was allocated 3.3 4.4 3.3 Distribution channels were appropriate 3.0 3.2 5.1" 2.6
Production Stock availability was adequate 3.2 3.5" 5.5" 3.1
Research Internal research was sufficient 5.5 5.7 5.1 6.0 External research was sufficient 5.5 4.9 5.0 4.0 Market was correctly predicled
Project Management Dedicated advocate was responsible 3.4 2.7" 5.1 4.4 Development stages were well managed 3.2 3.7" 5.4 3.8
.'Same as in A. "ame as in A.
Proponion out of the new product\ that were launched in the p;tsi two years. "easurrd by I- 10 11)-point scaler: 0 = \irongiy agree, 5 = nclthel- agi-cc nor disagree. 10 = \trongly disagree.
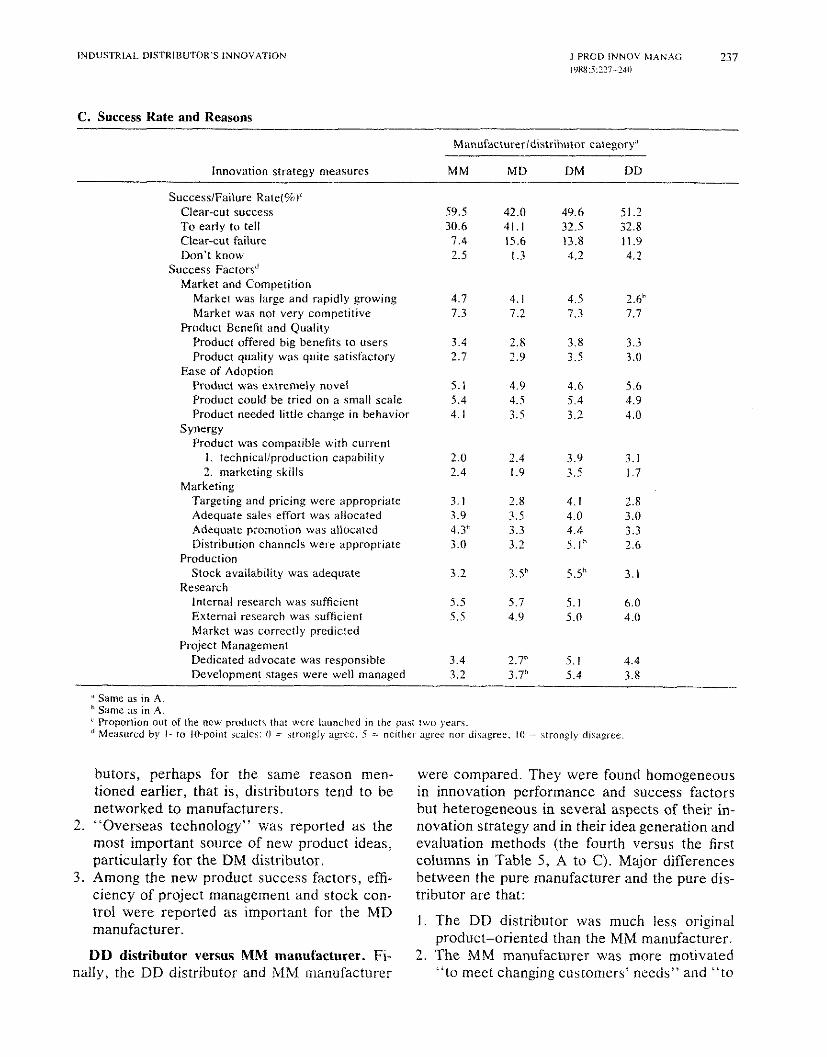
butors, perhaps for the same reason men- tioned earlier, that is, distributors tend to be networked to manufacturers.
2. "Overseas technology" was reported as the most important source of new product ideas, particularly for the DM distributor.
3. Among the new product success factors, effi- ciency of project management and stock con- trol were reported as important for the MD manufacturer.
DD distributor versus MM manufacturer. Fi- nally, the DD distributor and MM manufacturer
were compared. They were found homogeneous in innovation performance and success factors but heterogeneous in several aspects of their in- novation strategy and in their idea generation and evaluation methods (the fourth versus the first columns in Table 5, A to C). Major differences between the pure manufacturer and the pure dis- tributor are that:
1. The DD distributor was much less original product-oriented than the MM manufacturer.
2. The MM manufacturer was more motivated "to meet changing customers' needs" and "to

238 J PROD INNOV MANAG E. YOON AND G. L. LlLlFK lY88:5:227-240
be seen as innovative" than the DD distributor was.
3. The MM manufacturer generated new product ideas relatively more often "from market re- search" and through "sales and marketing teams" and "R&D/engineering and produc- tion staffs" than the DD distributor did.
4. "Test marketing" was widely used by the DD distributor, but "concept testing" was more widely used by the MM manufacturer. This finding is consistent with our observation that the MM manufacturer is more likely to de- velop original products that need a careful testing.
Summary, Implications and Future Research Our empirical study of 135 Australian industrial firms revealed that overall innovation strategies and idea generation/evaluation methods are somewhat different for the manufacturer and the
distributor and for different categories of manu- facturing-distribution mix. Success rates and success factors, however, were quite similar be- tween them. Figure 1 summarizes the differences and similarities between these groups. Although the findings are especially pertinent to Australian industry, they are likely to have wide interna- tional relevance for all manufacturer-distributor interaction.
Our findings suggest that the distributor's ac- tive involvement in "product innovation," or the innovative manufacturer's involvement in "dis- tribution," can be as efficient as the "product innovation" by the (traditional) pure manufac- turer, particularly for market-driven product in- novation. Overcoming the marketing difficulties associated with market newness has been re- ported as a key to a high success rate of new products [4]. New channels and salesforce, new advertising and promotion methods, new compe- titors and new customers tend to lower the suc-
MM marul&er Helerogsnwus In
M M Contnbuton of new
D D D Wle ol R&D w d ensineern stall as ilss m m e s
E
Heterogeneous in
Pmponion of onginal pmduns
Pmwnlon ol original
imponawe 01 major wduds
moliies, klea souices, and screening methods
Homagensous in
Major Imliies ol pmdud launch
Major s u m of pmduu ideas
Success rates and mapr soocess
Heterogeneous in
I Conlributmn a1 new prmhcis I
Imponarm of msies. &a sources, meenirg
lmponance 01 overreas lechrwlngy and projen manage& role
Figure 1. Manufacturing-Distribution Functional Mix and Innovation Strategy1 Perfnnnance. Major function: M = man- ufacturing; D = distribution; E = end- users. MM = manufacturer operates no distribution function; D D = mannfac- turer operates some distribution func- tion, too; DM = distributor operates some manufacturing function, too; D D = distributor operates no manufacturing function.

INDUSTRIAL DISTRIBUTOR'S LNNOVATtON J PROD INNOV MANAG 239 lllXH:S:?t7-?4(!
cess rate. An active involvement by the distri- butor in the product innovation program can be of great help in avoiding or reducing those market- newness problems.
The industrial distributor's expertise in com- municating with end-users may help identify user needs early. An early identification of customer needs can allow the innovator extra time for idea screening and product development that will en- hance the likelihood of success of a new product. The distributor's expertise in stock management can also be combined with the manufacturer's in R&D, idea screening, product development and marketing strategy formulation. A high potential for synergy between the new product manufac- turer and the distributor is supported by a review of industry practice. A study of directness of channels in industrial distribution [I71 reports that indirect distribution is more heavily prac- ticed early in the product l i e cycle, whereas man- ufacturer-internal channels become the more popular strategy as the product goes from growth to maturity.
We expect to see continued research on the role of the distributor in industrial product inno- vation, given the changing distribution environ- ment. In order to extend this exploratory study, some future research should focus on the strate- gic interaction between the manufacturer and the distributor.
T h e authors thank the Institute for the Study of Business Markets (Penn State University) and the Chisholm Institute of Technology (Australia) for the data base provided. The first author also acknowledges the support of an Auburn COB'S Research Grant and thanks Bess Whitten for her edi- torial assistance.
References 1. Anderson, J. C. and Narus, J. A. A model of the distributor's
perspective of distributor-manufacturer working relationships. Journal of Marketing 48~62-74 (Fall 1984).
2. Anderson. J. C. and Narus, 1. A. Toward a better understanding of distribution channel working relationships. In: Indusrriol Marketing: A Germon.American Perspecriue, Klaus Backhaus and David T. Wilson (eds.1. Berlin: Sprinser-Verlag, 1986, pp. 320-336.
3. Buzzell, Robert D. Is vertical integration profitable? Nohard Business Review 61:92-102 (January-February 1983).
4. Copper, Robert. How new product strategies impact on perfor- mance. Journal of Product Innouorion Mlinagernenr 1(1):5-18 (January 1984).
5. Comer. James M. The computer. personal selling. and sales management. d~,rmicl ef Morbriny 3937-33 (July 1975).
6. Crawford. C. Merle. New Pn>dln'r.s M<tnuprmmr. Homewood. IL: Richard D. Irwin lnc.. 1983. pp. 573-579.
7. Distribution '82: An overview. Bigger opportunities and obsta- cles. Purchasing 93:4548 (September 9. 1982).
8. Doust, Somerby. What buyers want from distributors. Purchas- ing 95:67-71 (October 13. 1983).
9. Ciaskl. John F The lhevry u l p u e r and conf l~c l in ihsnnrls of d#\!rrhunon. Journul o! Vorkt,tiny 389.29 (Summe: 19XJ).
10. Gaski, John F. Interrelations among a channel entity's power sources: Impact of the exercise of reward and coercion on ex- pert, referent, and legitimate power sources. Journal of Marker- ing Research 23:62-77 (February 1986).
1%. Gauvin, Stephane. Lilien, Gary L. and Link, Peter. New Zndus- trio1 Product Acriuity in Audrolio: An E r p l o r n r o ~ Survey. lSBM Report, Penn State University (February 1987).
12. Hlavacek, James D. and McCuistion. Tommy I . Industrial dis- tributors-When, who, and how? Haruord Businers Review 61:96-101 (January-Febmary 1983).
13. Hutt, Michael D. and Speh, Thomas W. IndustrialMnrkering Monagemenr: A Strategic View of Business Markers (2nd edi- tion). New York The Dryden Press, 1985, pp. 293-294.
14. Industrial Disrriburion. 37th annual survey of distributor apera- tions. 7337-45 (July 1983).
15. lain, Subhash C. Marketing Planning and Strategy (2nd edi- tion). Cincinnati: South-Western Publishing. 1985. pp. 812- 813.
16. Kotler, P, iMnrketing Management: Analysis, Planning, and Control (5th edition). Englewood Cliffs, NJ: Prentice-Hall, 1984, pp. 546-549.
17. Lilien. Gary L. Advisor 2: Modeling the marketing mix decision for industrial products. Management Science 25(2):191-204 (February 1979).
18. Lilien, Gary L. and Yoon, Eunsang. Determinants of New In- dusrrinl Product Performance: A Strnregic Re-emminafion of rhe Empirical Literomre. ISBM Report, Penn State University (19871.
19. Link, Peter L. Keys to new product success and failure. Indus- rnnl Mnrkering Manngemenr 16:109-118 (May 1987).
20. Main, J. G. The chain reaction that's rocking industrid distribu. tion. Sales and Marketing Management 114:4145 (February 23, 1976).
21. McCammon, B. C., Jr. Perspectives for distribution program- ming. In: Verricni Mnrket Systems, L. P. Bucklin (ed.). Glen- view, IL: Scott Foresman, 1970, pp. 32-51.
22. Michman, Ronald D. Trends affecting industrial distributors. Indirsrriol Markering Manogemcnr 9:213-216 (1980).
23. Morse, R. C. Lord of the rings. Marketing Communications 725-31 (May 1982).
24. Narus, James A. and Anderson, James C. Industrial dist"butor selling: The roles of outside and inside sales. IndrrstriolMarker- ing Manogemenr 15:55-62 (19861.
25. Price, Margaret. Distributors: No endangered species. Industry Week 47-50 (January 24, 1983).
26. Rosenberg. L. 1. and Stern, L. W. Conflict measurement in the distribution channel. Journal of Morkering Reseorch 8:437-442 (November 1971).
?7. Shapiro, Benson P. and Wyman, John. New ways to reach your customers. HaruardBrrsiness Reuiew 60:103-110 (July-August 1982).
28. Stern, L. W. and El-Ansary, A. I. Markering Channels (2nd edition). Englewood Cliffr, NJ: Prentice-Hall, 1982, pp. 343- 344.

240 J PROD INNOV MANAG E. YOON AND G . L. LILIEN 1988:5:227-240
29. Ternin, Thomas R. What happens at a distributor's semicustom in marketing strategy. Journal of Marketing 40:lO-16 (July logic design center. Purchasing 95:92A9-11 (May 10, 1984). 1976).
30. Urban, Glen L. and Hauser, John R. Design and Markelin8 of 32. yoon, E~~~~~~ and ~ i l i ~ " , c~~~ L. N~~ industria] product New Producrs. Englewood Cliffs, NJ: Prentice-Hall, 1980, PP. .~ ~elformance: The effects of market characteristics and strateev. ~ ~~~ 175-176. ~ -, Journal of Product lnnouorion Manngemenr 3:134-144 (Sep-
31. Webster, Frederick E.. Jr. The role of the industrial distributor tember 1985).