characteristics of one sprite-producing summer...
TRANSCRIPT
Atmospheric Research 127 (2013) 90–115
Contents lists available at SciVerse ScienceDirect
Atmospheric Research
j ourna l homepage: www.e lsev ie r .com/ locate /atmos
Characteristics of one sprite-producing summer thunderstorm
Jing Yang a,⁎, Xiushu Qie a, Guili Feng b
a Key Laboratory of Middle Atmosphere and Global Environment Observation (LAGEO), Institute of Atmospheric Physics, Chinese Academy of Sciences,Beijing 100029, Chinab Shandong Research Institute of Meteorology, Jinan 250031, China
a r t i c l e i n f o
⁎ Corresponding author.E-mail address: [email protected] (J. Yang).
0169-8095/$ – see front matter © 2011 Elsevier B.V. Adoi:10.1016/j.atmosres.2011.08.001
a b s t r a c t
Article history:Received 30 December 2010Received in revised form 29 July 2011Accepted 9 August 2011
Twenty-nine sprites were observed during four years from 2007 to 2010 with one most spri-te-productive storm on 1–2 August 2007 which produced 16 sprites. In this paper, the mostsprite-productive storm is analyzed by using data from lightning detection network, Dopplerradar, MTSAT (Multi-Function Transport Satellite) satellite, TRMM (Tropical Rainfall MeasuringMission), NCEP. The results show that most sprites appeared in groups and in shape of carrot.Most sprites occurred frequently when the cloud top brightness temperature is getting warmand radar reflectivity is becoming weak with characteristics of sharp decrease of negative CGsand slight increase of positive CGs. The parent cloud-to-ground lightning flashes (CGs) werepositive and located in region with cloud top brightness temperature of −40 to −60 °C andradar reflectivity of 15–35 dBZ. The sprite-producing storm was fortunately scanned by TRMMduring sprite time period. One orbit data could be used for PR (Precipitation Radar, 2A25) andtwo orbit data for TMI (TRMMMicrowave Imager, 2A12 and 1B11). Results based on TRMM indi-cated that storm reflectivity with 30 dBZwas at about 12 km in the convective region and 4 km instratiform region. The precipitation ice mostly located in 6–8 km with the largest value of2.1 g/m3, but most cloud ice located between 10 and 14 km with no cloud ice below 6 km andvery few at 6.0–8.0 km. The cloud water content located mostly between 4 and 6 km. Character-istics of vertical cross sections of radar reflectivity, precipitation ice and cloud ice agree well.Vertical cross sections along convective and stratiform regions show that contents of precipitationice and cloud ice in convective regionwere larger than that in stratiform region. But cloudwater instratiform region was larger than that in convective region. The storm evolution could be seenclearly from characteristics of precipitation ice, cloud ice, cloud water and polarization correctedtemperature at two different times. The CG distribution agrees well with low values of polariza-tion corrected temperature region, indicating that lightning flashes have close relationship withice particles. Although this paper is a case study of sprite-producing thunderstorm based onTRMM data, the results provided detailed information of microphysical structure of this sprite-producing storm.
© 2011 Elsevier B.V. All rights reserved.
Keywords:SpritesLightningThunderstorms
1. Introduction
Sprites are kind of TLEs which occur above thunderstorms(Lyons et al., 2003a). The two main morphological shapes ofsprites are column and carrot. The sprites can occur in
ll rights reserved.
clusters, sometimes of a dozen or more spread out overseveral tens of kilometers (Wescott et al., 1998). The over-whelming majority of sprites are induced by positive CGflashes. The dancing sprites are often triggered by spiderlightning (Mazur et al., 1998). Although dancing spritesare not as common as column and carrot sprites, they canalso be found in the literature. In addition, there are also‘fireworks’ sprites (Su et al., 2002) and ‘Jellyfish’ spritesthat were recorded.

Table 1Characteristics of the 16 sprites and some parent cloud-to-ground flashes (CGs).
Sequence number Sprite occurrence time Parent CG occurrence time Sprite appearance Sprite duration (ms) Peak current ofparent CGs (kA)
Local time Local time
2007-08-01 2007-08-011 21:30:10 645 Columniform 1202 22:02:48 940 Carrot 403 22:58:42 934 Carrot 804 23:19:50 670 23:19:50 6625 Carrot 40 40
2007-08-02 2007-08-025 00:04:18 346 Unknown 806 00:23:07 737 00:23:07 7323 Carrot 120 227 00:47:45 219 00:47:45 2101 Carrot 40 2228 00:56:37 674 00:56:37 6631 Carrot 40 859 01:10:42 738 Carrot 4010 01:12:31 601 01:12:31 5976 Unknown 40 9711 01:18:27 31 Carrot 4012 01:22:40 998 Dancing 16013 01:27:24 906 01:27:24 9002 Unknown 40 25514 01:33:21 816 Carrot 8015 01:38:16 005 01:38:15 9932 Carrot 40 6216 01:43:04 693 Dancing 80Average 68 112
91J. Yang et al. / Atmospheric Research 127 (2013) 90–115
A typical storm may produce a sprite every severalminutes. In the U.S. High Plains, sprites usually continue forseveral hours. Most observations indicate that sprites are asso-ciated with the mature-to-dissipating stage of mid-latitudenocturnal mesoscale convective systems (MCSs) (e.g. Lyonset al., 2000; Lyons et al., 2003a). Lang et al. (2010) showedthat layers well above the 0 °C isotherm can be the sourcecharge for sprites. Although it is well known that the typical
a
Storm
Observation site
Radar
215 km
600 km
435
km
326 km
326 km
221
km
d1
326 km
Fig. 1. (a) Locations of observation site and sprite-producing thunderstorm on the goand their parent CGs were not found. (d1–d2) Dancing sprite and its parent CG wa
meteorological scenario for sprites involves MCSs (Lyons et al.,2003b), relationships between sprite production and convec-tive intensity, the microphysical structure of the stratiform re-gion, and MCS organizational structure remain uncertain.
The observations reported here started in 2007 in theeastern part of China and continued during the followingyears. From 2007 to 2010, a total of 29 sprites were observedwith one most sprite-productive storm on 1–2 August 2007
b
221
km
221
km
c
326 km
326 km
221
km
ed2
221
km
ogle map. (b) and (c) are columniform and carrot sprite images, respectively,s not found. (e) Undefined sprite.

Table 2Morphological distribution of sprite types.
Type Number of events Percentage
Column (single) 0 0Column (group) 2 7%Carrot (single) 2 7%Carrot (group) 16 55%Dancing 2 7%Undefined 7 24%
Table 3Meteorological characteristics of the thunderstorm.
Parent active cell (km2) 14,800Cloud top temp (°C) −50Cloud top height (km) 9–11Sea surface temp (°C) 26Number of TLEs observed 16
92 J. Yang et al. / Atmospheric Research 127 (2013) 90–115
which produced 16 sprites (characteristics of these 16 spritesand some parent CGs were listed in Table 1). This study pre-sents a detailed analysis of the most sprite-productive meso-scale convective complexes (MCCs). The analysis is focusedon characteristics of lightning activity, radar reflectivity andtheir relationship during the whole process of thunderstormdevelopment as well as the time period in which manysprites occurred. Such studies have already been conductedmostly in the United States (e.g. Lyons et al., 2003a; Lyonset al., 2003b), Europe (e.g. Savtchenko et al., 2009; Neubertet al., 2005; Van der Velde et al., 2006), Africa (Williamset al., 2009), Japan (Hayakawa et al., 2004), Mediterraneanregion (Ganot et al., 2007) and Taiwan (Su et al., 2002). How-ever, in this study, multiple data including lightning locationdata, MTSAT (Multi-Function Transport Satellite) satellite im-ages, Doppler radar data, NCEP Reanalysis Derived data andthe TRMM (Tropical Rainfall Measuring Mission) data havebeen used to analyze characteristics of the thunderstormand lightning activity. These results will give additional infor-mation on sprite-producing thunderstorms, especially infor-mation from TRMM data during sprite time period have notbeen found in the literature so far. In addition, our study isuseful as a comparative one in China.
2. Data description
The sprite experiment was carried out in Zhanhua county(37°49′42″N, 118°05′06″E, see the location in Fig. 1a),Shandong province. The observation system consists of acamera (Watec902H) and 12 mm f/0.8 lens, and the field ofview (FOV) is 31.1° (H) by 21.2° (V) (Yang et al., 2008).The camera is PAL, 25 frames per second (each frame lasts40 ms) with 1/2 inch interline transfer CCD image sensor. Itis super high sensitive (minimum illumination: 0.0003 lx.F1.4). Data from the camera are recorded in real time ontoa computer hard disk, and the time is synchronized withGPS (Global Positioning System). During the observation pe-riod, infrared weather maps (MTSAT satellite images) wereused to obtain the location of potential thunderstorms for ob-servations. Based on real-time lightning information from
ground lightning location network, accurate position of thecenter of electrical activity was determined, which was usedto adjust the camera pointing direction. The lightning locationdata is provided by Shandong Province Lightning DetectionNetwork, which consists of 10 sensors and one data processingcenter, and uses a combined TOA/MDF technology (Cumminset al., 1998). Each CG lightning record comprises data on theoccurrence time, location, peak current, and polarity of light-ning. The location accuracy of the network is about 2000 m,which has been proved by the fault of high-voltage trans-mission line (Liu et al., 1997). In addition, data from theMTSAT satellite has been used to supply cloud characteris-tics with spatial resolution of 0.05°×0.05°, and was down-loaded from the website (http://weather.is.kochi-u.ac.jp/archive-e.html) for reanalysis. The MTSAT was launched in2005 and is three-axis stabilized. Its geostationary orbit is35,800 km above the equator at 140° east longitude or 145°east longitude. The MTSAT carries five sensors, that is VIS(0.55–0.90 μm), IR1 (10.3–11.3 μm), IR2 (11.5–12.5 μm),IR3 (6.5–7.0 μm) and IR4 (3.5–4.0 μm), information couldbe found in http://www.jma.go.jp/jma/jma-eng/satellite/about_mt/8.Major_Characteristics_of_the_meteorological_payload.html. Data used in this paper is IR1.
Doppler radar is a useful tool for monitoring the MCSs.Radar used in this paper is a WSR-98D S-band Fully CoherentDoppler Weather radar. It is an upgraded version of the USA'sNEXRAD (WSR-88D), and shares many features includingstate-of-the-art computerized control, 24-hour operationalcapability, real-time monitoring, real-time calibration, andhigh accuracy and reliability. It operates in two basic modes,clear-air and precipitation mode. It has two scanning range,one is 230 km and the other is 460 km. Data with scanningrange of 230 km has been used in this paper and its resolutionis 1 km. The radar image is updated every 6 min. The data wasprovided by Shandong Meteorological Bureau and has beenused to characterize the structure and evolution of theMCSs. The NCEP Reanalysis Derived data was provided by theNOAA/OAR/ESRL PSD, Boulder, Colorado, USA, from their Website (http://www.cdc.noaa.gov/) and processed via GrADSsoftware (http://grads.iges.org/grads/grads.html). The datais given in 4-times daily (6-hour intervals) (00Z, 06Z, 12Zand 18Z), and was downloaded according to the time ofTLEs appearance, in the research area of latitudes 33–41°Nand longitudes of 113–125°E. The main data used from thissite was the sea surface temperature (SST).
The TRMM (Tropical Rainfall Measuring Mission) satellitelaunched jointly by the United States and Japan in 1997, carriesfive detectors, the Precipitation Radar (PR), the TRMM Micro-wave Imager (TMI), the Lightning Imaging Sensor (LIS), theVisible and Infrared Scanner (VIRS) and the Clouds and theEarth's Radiant Energy System (CERES) (e.g. Kummerowet al., 1998; Feng et al., 2007). Although this satellite passesabove the research area only twice a day, fortunately the thun-derstorm was scanned during its evolution. The data 2A25 ofPR contain reflectivity, rain rate, rain type, and so on. Comparedwith PR, ground-based radar is usually difficult to obtain reflec-tivity with high vertical resolution but the vertical resolution ofPR is higher than that of ground-based radar (PR vertical reso-lution is 250 m and Doppler radar resolution is 1000 m whenscanning range is 230 km). Therefore, PR data will be used foranalyzing the precipitation structure in this paper. TMI is a
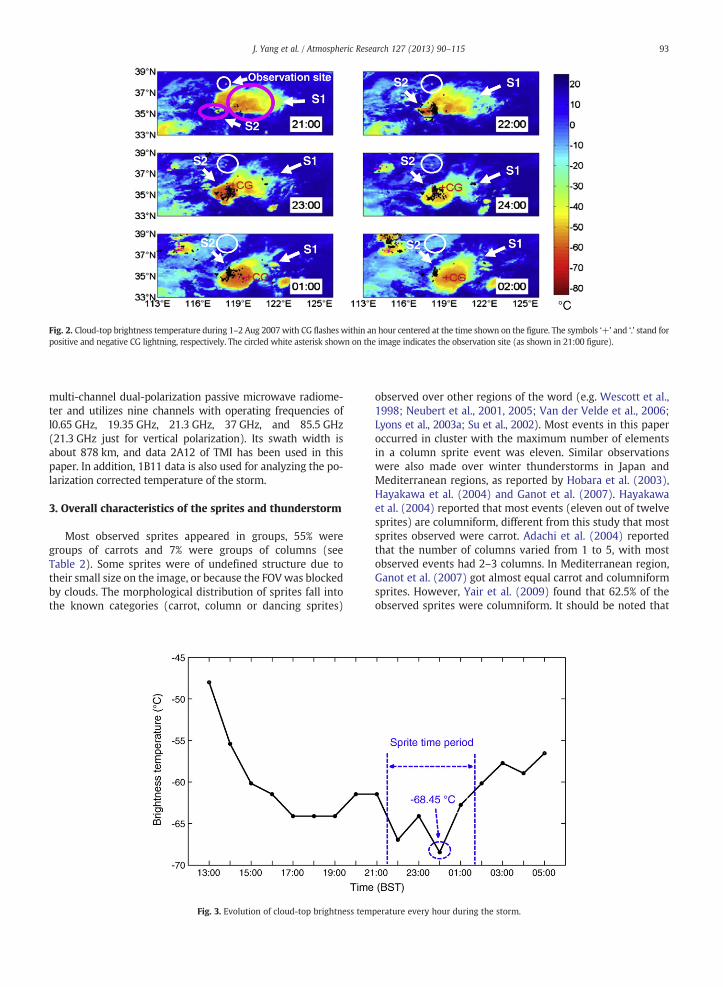
Fig. 2. Cloud-top brightness temperature during 1–2 Aug 2007with CG flashes within an hour centered at the time shown on the figure. The symbols ‘+’ and ‘.’ stand forpositive and negative CG lightning, respectively. The circled white asterisk shown on the image indicates the observation site (as shown in 21:00 figure).
93J. Yang et al. / Atmospheric Research 127 (2013) 90–115
multi-channel dual-polarization passive microwave radiome-ter and utilizes nine channels with operating frequencies ofl0.65 GHz, 19.35 GHz, 21.3 GHz, 37 GHz, and 85.5 GHz(21.3 GHz just for vertical polarization). Its swath width isabout 878 km, and data 2A12 of TMI has been used in thispaper. In addition, 1B11 data is also used for analyzing the po-larization corrected temperature of the storm.
3. Overall characteristics of the sprites and thunderstorm
Most observed sprites appeared in groups, 55% weregroups of carrots and 7% were groups of columns (seeTable 2). Some sprites were of undefined structure due totheir small size on the image, or because the FOVwas blockedby clouds. The morphological distribution of sprites fall intothe known categories (carrot, column or dancing sprites)
Fig. 3. Evolution of cloud-top brightness tem
observed over other regions of the word (e.g. Wescott et al.,1998; Neubert et al., 2001, 2005; Van der Velde et al., 2006;Lyons et al., 2003a; Su et al., 2002). Most events in this paperoccurred in cluster with the maximum number of elementsin a column sprite event was eleven. Similar observationswere also made over winter thunderstorms in Japan andMediterranean regions, as reported by Hobara et al. (2003),Hayakawa et al. (2004) and Ganot et al. (2007). Hayakawaet al. (2004) reported that most events (eleven out of twelvesprites) are columniform, different from this study that mostsprites observed were carrot. Adachi et al. (2004) reportedthat the number of columns varied from 1 to 5, with mostobserved events had 2–3 columns. In Mediterranean region,Ganot et al. (2007) got almost equal carrot and columniformsprites. However, Yair et al. (2009) found that 62.5% of theobserved sprites were columniform. It should be noted that
perature every hour during the storm.

Fig. 4. Evolution of time intervals between two successive sprites during thesprite time period.
Fig. 5. Lightning flashes superposed on radar reflectivity cross sections at difor parent CGs. CG1, CG2 and CG3 occurred at 00:23:07, 00:47:45 and 00:5respectively.
94 J. Yang et al. / Atmospheric Research 127 (2013) 90–115
fferent t6:37, re
sprite characteristics in Table 2 are limited because of thesmall sample size and the clouds in the camera FOV. The lim-ited sprite characteristics may also due to the overlaps ofsprite elements when seeing from one single observationsite.
The meteorological data, including storm sizes, cloud-topbrightness temperatures and height, sea surface temperaturesvalues are summarized in Table 3. The sea surface temperature(SST) of the Yellow Seawas obtained from theNCEP/NCAR rea-nalysis, andwas found to be about 26 °C during the observationday. The MTSAT hourly cloud-top brightness temperature inFig. 2 showed that the thunderstorm was an MCCs. The thun-derstorm developed at 15:00 on 1 August, and became stron-gest at 17:30 (named S1) with coldest cloud-top brightnesstemperature of−64.12 °C (as shown in Fig. 2). Then the thun-derstormweakened and cloud region became largewith cloud-top brightness temperature increasing from −64.12 °C (at19:00) to −61.45 °C (at 21:00). A new small storm cell
imes at 4, 6 and 8 km. The black ‘−’ stands for negative CGs and red ‘•’ standsspectively. CG4, CG5 and CG6 occurred at 01:12:31, 01:27:24 and 01:38:16
,
117 117.5 118 118.5 119 119.5 120 120.5oE
Longitude
34
34.5
35
35.5La
titud
e
117 117.5 118 118.5 119 119.5 120 120.5oE
Longitude
34
34.5
35
35.5
36oN
36oN
Latit
ude
00:11, 8 km
00:36, 4 km CG1
CG2
CG3
60
55
50
45
40
3530
25
2015
10
dBZ
60
55
50
45
40
35
30
2520
dBZ
15
10
Fig. 5 (continued).
95J. Yang et al. / Atmospheric Research 127 (2013) 90–115
(named S2) occurred southwest of the previous thunderstormat 21:00 and developed very rapidly with coldest cloud-topbrightness temperature of −66.96 °C at 22:00. The first spriteappeared at 21:30:10 and no parent CG was found. The cloudcoverage of S2 became large at 22:00 compared with that at21:00. At 23:00 the thunderstorm S2 became even larger andthe fourth sprite was recorded at 23:19:50 and its parent CGs(labeled with ‘+CG’ in the figure) located in region withcloud-top brightness temperature of about −40 to −50 °C,falling in the range of −40 to −55 °C reported by Savtchenkoet al. (2009). It is found that parent CGs located in comparative-ly warm regions of the storm compared with the coldest tem-perature of −64.12 °C at 23:00. The evolution of cloud-topbrightness temperature every hour shown in Fig. 3 indicatesthat the coldest temperature of −68.45 °C occurred at 00:00(but region with cloud-top brightness temperature of −50 °Cdominated at this time), indicating that cloud top was highestat 00:00. Many sprites occurred after 00:00. After the sprite at00:47:25 on 2 August the time intervals between two succes-sive sprites was much shorter than that of the previous ones(as shown in Fig. 4), with the maximum of 14 min and
minimum of 2 min and an average of 5.5 min. Period of fre-quent sprites corresponded with cloud-top brightness temper-ature increasing as shown in Fig. 3, confirming results that coldcloud tops expanding (The cloud top expanding could also beseen from the fact that storm area shown in Doppler radarimages in Fig. 5 labeled ‘00:36’ was larger than that labeled‘00:11’, and will be discussed in the next section) and gettingwarm during the sprite occurrence period (Soula et al., 2009).
4. Characteristics of the CGs and thunderstorm
The distribution of CGs on the cloud-top brightness temper-ature (shown in Fig. 2) indicates that negative CGs clusteredin large cloud-top brightness temperature gradient region be-tween 01:00 and 02:00 and eight sprites were recorded duringthis time period. The parent CGs located in region with cloud-top brightness temperature of −50 to −60 °C. These resultsmight have some uncertainties due to the coarse resolution ofthe infrared weather maps. Fig. 6 presents evolution of CGflash rate per 5 min in the storm cell which produced mostsprites during the time period between 00:00 and 02:00 on 2
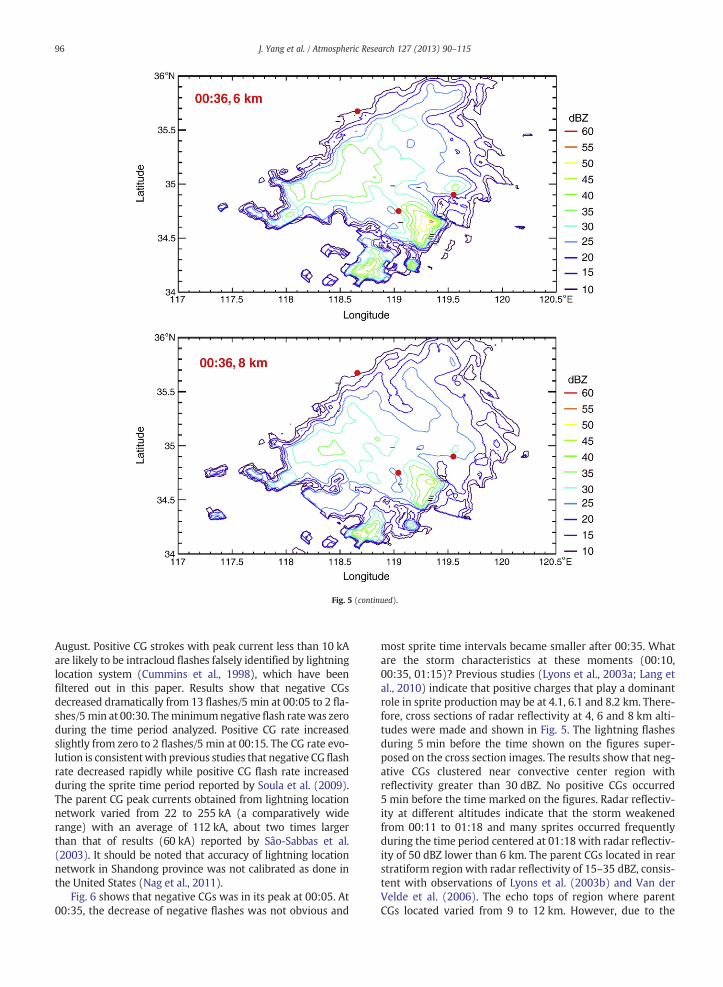
Fig. 5 (continued).
96 J. Yang et al. / Atmospheric Research 127 (2013) 90–115
August. Positive CG strokes with peak current less than 10 kAare likely to be intracloud flashes falsely identified by lightninglocation system (Cummins et al., 1998), which have beenfiltered out in this paper. Results show that negative CGsdecreased dramatically from 13 flashes/5 min at 00:05 to 2 fla-shes/5 min at 00:30. Theminimumnegative flash ratewas zeroduring the time period analyzed. Positive CG rate increasedslightly from zero to 2 flashes/5 min at 00:15. The CG rate evo-lution is consistentwith previous studies that negative CG flashrate decreased rapidly while positive CG flash rate increasedduring the sprite time period reported by Soula et al. (2009).The parent CG peak currents obtained from lightning locationnetwork varied from 22 to 255 kA (a comparatively widerange) with an average of 112 kA, about two times largerthan that of results (60 kA) reported by Sâo-Sabbas et al.(2003). It should be noted that accuracy of lightning locationnetwork in Shandong province was not calibrated as done inthe United States (Nag et al., 2011).
Fig. 6 shows that negative CGs was in its peak at 00:05. At00:35, the decrease of negative flashes was not obvious and
most sprite time intervals became smaller after 00:35. Whatare the storm characteristics at these moments (00:10,00:35, 01:15)? Previous studies (Lyons et al., 2003a; Lang etal., 2010) indicate that positive charges that play a dominantrole in sprite production may be at 4.1, 6.1 and 8.2 km. There-fore, cross sections of radar reflectivity at 4, 6 and 8 km alti-tudes were made and shown in Fig. 5. The lightning flashesduring 5 min before the time shown on the figures super-posed on the cross section images. The results show that neg-ative CGs clustered near convective center region withreflectivity greater than 30 dBZ. No positive CGs occurred5 min before the time marked on the figures. Radar reflectiv-ity at different altitudes indicate that the storm weakenedfrom 00:11 to 01:18 and many sprites occurred frequentlyduring the time period centered at 01:18 with radar reflectiv-ity of 50 dBZ lower than 6 km. The parent CGs located in rearstratiform region with radar reflectivity of 15–35 dBZ, consis-tent with observations of Lyons et al. (2003b) and Van derVelde et al. (2006). The echo tops of region where parentCGs located varied from 9 to 12 km. However, due to the

Fig. 5 (continued).
97J. Yang et al. / Atmospheric Research 127 (2013) 90–115

0
5
10
15
-CG
rat
e (f
lash
es/ 5
min
)
Time (BST)00
:05
00:1
500
:25
00:3
500
:45
00:5
501
:05
01:1
501
:25
01:3
501
:45
01:5
502
:05
0
2
4
6
8
+C
G r
ate
(fla
shes
/ 5 m
in)
Fig. 6. Evolution of CG lightning flash rate per 5 min during the period in which sprites occurred frequently.
98 J. Yang et al. / Atmospheric Research 127 (2013) 90–115
lack of information on lightning VHF radiation sources andthe aloft electric field, it is difficult to determine the chargeorigin of positive CG lightning.
5. Precipitation and microphysical structure ofthe thunderstorm
The TRMM satellite happened to scan the thunderstormduring the sprite time period, and valuable data of PR andTMI were thereby acquired. The performance of PR was com-pared with ground-based radar by Feng et al. (2007), indicat-ing that both of the CAPPI (Constant Altitude Plan PositionIndicator, CAPPI) and rain rate patterns were consistent. Inaddition, vertical resolution of PR is higher than that ofground-based radar as mentioned in data descriptionpart. Therefore, PR data are helpful for analyzing the stormprecipitation structure. In this paper, 2A25 (PR), 1B11 (TMI,85.5 GHz) and 2A12 (TMI, 85.5 GHz) have been used. Oneorbit data (orbit number 55325, 21:57) could be used for2A25, and two orbit data (orbit number are 55325 and55326, corresponding with time of 21:57 and 23:34, respec-tively) for 1B11 and 2A12. Characteristics of storm radarreflectivity, precipitation ice, cloud ice, cloud water content,and polarization corrected temperature during sprite timeperiod were obtained.
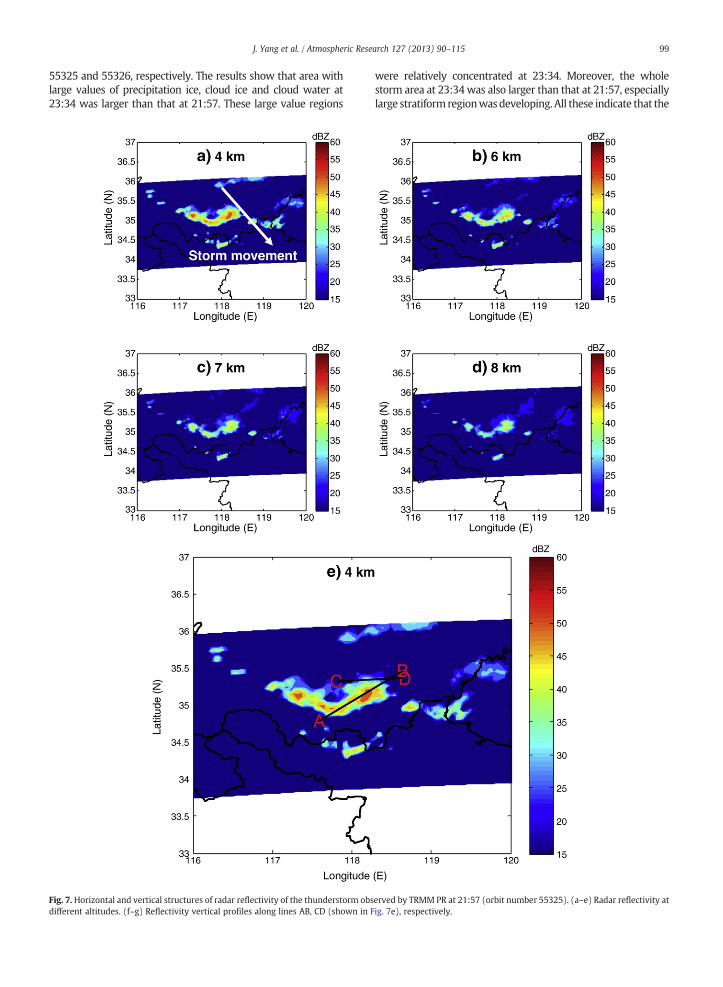
The TRMM radar reflectivity at different levels was shownin Fig. 7. The lightning flashes were not superposed on PRreflectivity in order to see the reflectivity characteristicsclearly. Figs. 7(a–e) show radar reflectivity at different alti-tudes at 21:57 (one sprite occurred at 22:02), indicating itis a multi-cell thunderstorm with maximum reflectivity ofabout 55 dBZ (the storm movement was also marked by anarrow on Fig. 7a). Area with radar reflectivity of 45 dBZ at6 km altitude was much smaller than that at 4 km, and reflec-tivity of 45 dBZ could not be seen at 8 km altitude. The parentCG for sprites at 23:19:50 occurred in rear stratiform regionof the storm and other parent CGs also occurred in stratiformregion. Therefore, although parent CG for sprites at 22:02:48was not found, we suspect that it also occurred in the strati-form region, too. Since this paper focus on sprites and mostparent CGs located in stratiform region, vertical cross sec-tions have been drawn through convective region along lineAB and through stratiform region along CD (Fig. 7e), respec-tively. Characteristics of slices along line AB (Fig. 7f) indicate
that a reflectivity of 30 dBZ was at about 12 km, indicatingthat the convection in this region was strong and the stormwas in the developing stage. Compared with slice along AB,slice along CD shows that reflectivity of 30 dBZ was at about5 km. The storm 0 °C isotherm was at about 4 km altitude(for the limitation of the paper, the figure was not shown),and Lang et al. (2010) showed that layers well above the0 °C isotherm can be the source charge for sprites. Since theparent CGs located in stratiform region, the positive chargesfor sprites were not very high.
Figs. 8–10 show characteristics of precipitation ice, cloudice and cloud water at different altitudes and their verticalcross sections (locations of AB and CD are the same as inFig. 7e) at 21:57 during sprite time period. The results indi-cate that there was no precipitation ice below 4 km, andmost precipitation ice located at 6–8 km with the largestvalue of 2.1 g/m3. But the cloud ice mostly located between10 and 14 km with no cloud ice below 6 km and very few be-tween 6.0 and 8.0 km, indicating that convection at this timewas strong and cloud ice particles were brought to high alti-tudes. The largest value of cloud ice was about 0.33 g/m3. Thecloud water mostly located between 4 and 6 km. There wassome cloud water in 3.5–4.0 km and very few cloud watercould be seen above 6 km, which to some extent consistentwith radar reflectivity result that 0 °C isotherm was at about4 km and maximum radar reflectivity occurred between 4and 6 km. Large differences of precipitation ice, cloud ice andcloud water content in convective and stratiform regionswere observed, with more precipitation ice and cloud ice inconvective region than that in stratiform region. There wasmore cloud water in stratiform region than that in convectiveregion. Two storm cells along AB could be seen clearly inradar reflectivity, precipitation ice and cloud ice. It is very inter-esting that therewere two large value regions of cloudwater inthe vertical directions as shown in Fig. 10(f–g), similar phe-nomena were not observed in precipitation ice and cloudice, indicating that cloud water had more complex verticalstructure.
Figs. 11–13 show characteristics of precipitation ice, cloudice and cloud water contents at different altitudes and theirvertical cross sections along convective and stratiformregions at 23:34 (orbit number is 55326, one sprite occurredat 23:19). Fig. 14 shows comparison of precipitation ice, cloudice and cloud water contents from data with orbit number of
99J. Yang et al. / Atmospheric Research 127 (2013) 90–115
55325 and 55326, respectively. The results show that area withlarge values of precipitation ice, cloud ice and cloud water at23:34 was larger than that at 21:57. These large value regions
Fig. 7. Horizontal and vertical structures of radar reflectivity of the thunderstorm obsdifferent altitudes. (f–g) Reflectivity vertical profiles along lines AB, CD (shown in F
were relatively concentrated at 23:34. Moreover, the wholestorm area at 23:34 was also larger than that at 21:57, especiallylarge stratiform regionwasdeveloping. All these indicate that the
erved by TRMM PR at 21:57 (orbit number 55325). (a–e) Radar reflectivity atig. 7e), respectively.
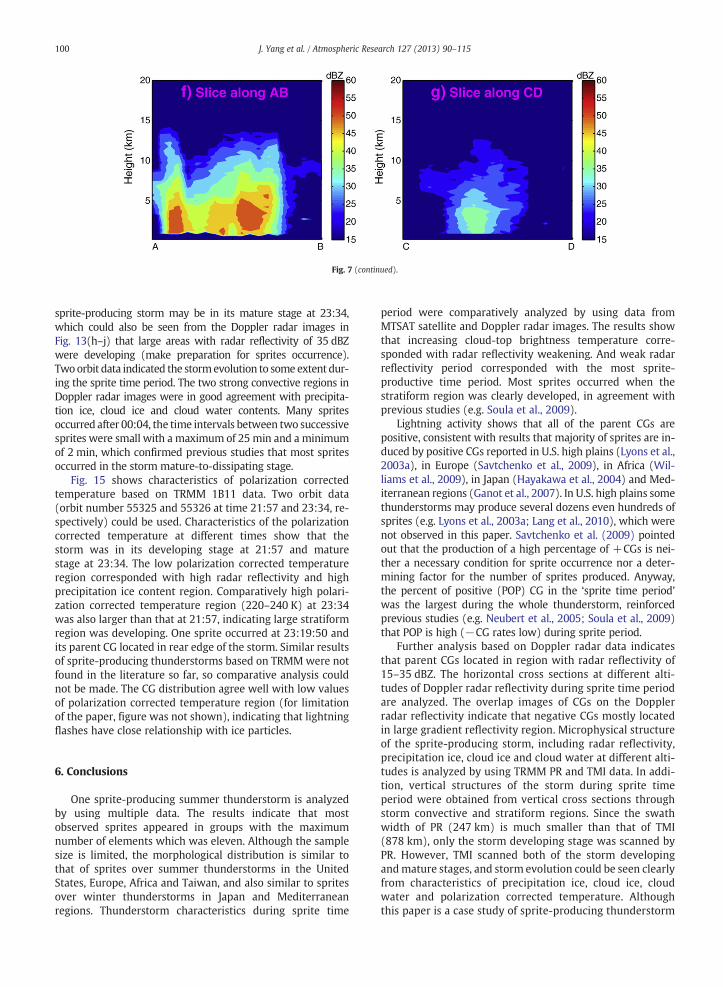
Fig. 7 (continued).
100 J. Yang et al. / Atmospheric Research 127 (2013) 90–115
sprite-producing storm may be in its mature stage at 23:34,which could also be seen from the Doppler radar images inFig. 13(h–j) that large areas with radar reflectivity of 35 dBZwere developing (make preparation for sprites occurrence).Twoorbit data indicated the stormevolution to some extent dur-ing the sprite time period. The two strong convective regions inDoppler radar images were in good agreement with precipita-tion ice, cloud ice and cloud water contents. Many spritesoccurred after 00:04, the time intervals between two successivesprites were small with a maximum of 25 min and a minimumof 2 min, which confirmed previous studies that most spritesoccurred in the storm mature-to-dissipating stage.
Fig. 15 shows characteristics of polarization correctedtemperature based on TRMM 1B11 data. Two orbit data(orbit number 55325 and 55326 at time 21:57 and 23:34, re-spectively) could be used. Characteristics of the polarizationcorrected temperature at different times show that thestorm was in its developing stage at 21:57 and maturestage at 23:34. The low polarization corrected temperatureregion corresponded with high radar reflectivity and highprecipitation ice content region. Comparatively high polari-zation corrected temperature region (220–240 K) at 23:34was also larger than that at 21:57, indicating large stratiformregion was developing. One sprite occurred at 23:19:50 andits parent CG located in rear edge of the storm. Similar resultsof sprite-producing thunderstorms based on TRMM were notfound in the literature so far, so comparative analysis couldnot be made. The CG distribution agree well with low valuesof polarization corrected temperature region (for limitationof the paper, figure was not shown), indicating that lightningflashes have close relationship with ice particles.
6. Conclusions
One sprite-producing summer thunderstorm is analyzedby using multiple data. The results indicate that mostobserved sprites appeared in groups with the maximumnumber of elements which was eleven. Although the samplesize is limited, the morphological distribution is similar tothat of sprites over summer thunderstorms in the UnitedStates, Europe, Africa and Taiwan, and also similar to spritesover winter thunderstorms in Japan and Mediterraneanregions. Thunderstorm characteristics during sprite time
period were comparatively analyzed by using data fromMTSAT satellite and Doppler radar images. The results showthat increasing cloud-top brightness temperature corre-sponded with radar reflectivity weakening. And weak radarreflectivity period corresponded with the most sprite-productive time period. Most sprites occurred when thestratiform region was clearly developed, in agreement withprevious studies (e.g. Soula et al., 2009).
Lightning activity shows that all of the parent CGs arepositive, consistent with results that majority of sprites are in-duced by positive CGs reported in U.S. high plains (Lyons et al.,2003a), in Europe (Savtchenko et al., 2009), in Africa (Wil-liams et al., 2009), in Japan (Hayakawa et al., 2004) and Med-iterranean regions (Ganot et al., 2007). In U.S. high plains somethunderstorms may produce several dozens even hundreds ofsprites (e.g. Lyons et al., 2003a; Lang et al., 2010), which werenot observed in this paper. Savtchenko et al. (2009) pointedout that the production of a high percentage of +CGs is nei-ther a necessary condition for sprite occurrence nor a deter-mining factor for the number of sprites produced. Anyway,the percent of positive (POP) CG in the ‘sprite time period’was the largest during the whole thunderstorm, reinforcedprevious studies (e.g. Neubert et al., 2005; Soula et al., 2009)that POP is high (−CG rates low) during sprite period.
Further analysis based on Doppler radar data indicatesthat parent CGs located in region with radar reflectivity of15–35 dBZ. The horizontal cross sections at different alti-tudes of Doppler radar reflectivity during sprite time periodare analyzed. The overlap images of CGs on the Dopplerradar reflectivity indicate that negative CGs mostly locatedin large gradient reflectivity region. Microphysical structureof the sprite-producing storm, including radar reflectivity,precipitation ice, cloud ice and cloud water at different alti-tudes is analyzed by using TRMM PR and TMI data. In addi-tion, vertical structures of the storm during sprite timeperiod were obtained from vertical cross sections throughstorm convective and stratiform regions. Since the swathwidth of PR (247 km) is much smaller than that of TMI(878 km), only the storm developing stage was scanned byPR. However, TMI scanned both of the storm developingandmature stages, and storm evolution could be seen clearlyfrom characteristics of precipitation ice, cloud ice, cloudwater and polarization corrected temperature. Althoughthis paper is a case study of sprite-producing thunderstorm
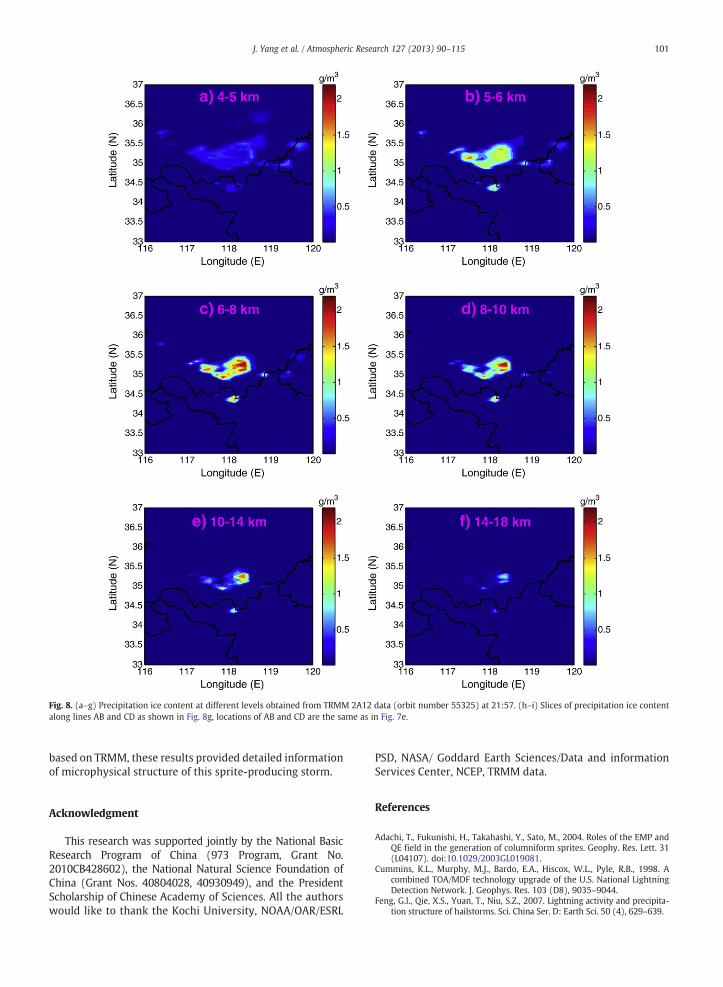
Fig. 8. (a–g) Precipitation ice content at different levels obtained from TRMM 2A12 data (orbit number 55325) at 21:57. (h–i) Slices of precipitation ice contentalong lines AB and CD as shown in Fig. 8g, locations of AB and CD are the same as in Fig. 7e.
101J. Yang et al. / Atmospheric Research 127 (2013) 90–115
based on TRMM, these results provided detailed informationof microphysical structure of this sprite-producing storm.
Acknowledgment
This research was supported jointly by the National BasicResearch Program of China (973 Program, Grant No.2010CB428602), the National Natural Science Foundation ofChina (Grant Nos. 40804028, 40930949), and the PresidentScholarship of Chinese Academy of Sciences. All the authorswould like to thank the Kochi University, NOAA/OAR/ESRL
PSD, NASA/ Goddard Earth Sciences/Data and informationServices Center, NCEP, TRMM data.
References
Adachi, T., Fukunishi, H., Takahashi, Y., Sato, M., 2004. Roles of the EMP andQE field in the generation of columniform sprites. Geophy. Res. Lett. 31(L04107). doi:10.1029/2003GL019081.
Cummins, K.L., Murphy, M.J., Bardo, E.A., Hiscox, W.L., Pyle, R.B., 1998. Acombined TOA/MDF technology upgrade of the U.S. National LightningDetection Network. J. Geophys. Res. 103 (D8), 9035–9044.
Feng, G.l., Qie, X.S., Yuan, T., Niu, S.Z., 2007. Lightning activity and precipita-tion structure of hailstorms. Sci. China Ser. D: Earth Sci. 50 (4), 629–639.

Fig. 8 (continued).
102 J. Yang et al. / Atmospheric Research 127 (2013) 90–115
Ganot, M., Yair, Y., Price, C., Ziv, B., Sherez, Y., Greenberg, E., Devir, A., Yaniv,R., 2007. First detection of transient luminous events associated withwinter thunderstorms in the eastern Mediterranean. Geophy. Res. Lett.34 (L12801). doi:10.1029/2007GL029258.
Hayakawa, M., Nakamura, T., Hobara, Y., Williams, E., 2004. Observation ofsprites over the Sea of Japan and conditions for lightning-induced spritesin winter. J. Geophys. Res. 109 (A01312). doi:10.1029/2003JA009905.
Hobara, Y., Hayakawa, M., Ohta, K., Fukunishi, H., 2003. Lightning dis-charges in association with mesospheric optical phenomena in Japanand their effect on the lower ionosphere. Adv. Polar Upper Atmos.Res. 17, 30–47.
Kummerow, C., Barnes, W., Kozu, T., Shiue, J., Simpson, J., 1998. The TropicalRainfall Measuring Mission (TRMM) sensor package. J. Atmos. Oceanic.Technol. 15 (3), 809–817.
Lang, T.J., Lyons, W.A., Rutledge, S.A., Meyer, J.D., MacGorman, D.R., Cummer,S.A., 2010. Transient luminous events above two mesoscale convectivesystems: storm structure and evolution. J. Geophys. Res. 115 (A00E22).doi:10.1029/2009JA014500.
Liu, F.X., Li, X.Y., Cao, Z.X., Chen, J.X., Ma, Q.M., 1997. The application & anal-ysis of data of lightning location system in Shandong province. Shan-dong Electr. Power 96 (4), 1–8 (In Chinese).
Lyons, W.A., Armstrong, R.A., Bering, E.A.I., Williams, E.R., 2000. The hundredyear hunt for the sprite. EOS, Trans. AGU 81, 373–377.
Lyons, W.A., Williams, E.R., Cummer, S.A., Stanley, M.A., 2003a. Characteris-tics of sprite-producing positive cloud-to-ground lightning during the19 July 2000 STEPS mesoscale convective systems. Mon. Weather. Rev.131, 2417–2427.
Lyons, W.A., Andersen, L.M., Nelson, T.E., Huffines, G.R., 2003b. Characteris-tics of sprite-producing electrical storms in the STEPS 2000 domain.Paper presented at second conference on Meteorological Applicationsof Lightning Data. Am. Meteorol. Soc., Atlanta, Ga.
Mazur, V., Shao, X.-M., Krehbiel, P.R., 1998. “Spider” lightning in intracloud andpositive cloud-to-ground flashes. J. Geophys. Res. 103, 19811–19822.
Nag, A., Mallick, S., Rakov, V.A., Howard, J.S., Biagi, C.J., Hill, J.D., Uman, M.A.,Jordan, D.M., Rambo, K.J., Jerauld, J.E., DeCarlo, B.A., Cummins, K.L.,Cramer, J.A., 2011. Evaluation of U.S. National Lightning Detection Net-work performance characteristics using rocket-triggered lightning dataacquired in 2004–2009. J. Geophys. Res. 116 (D02123). doi:10.1029/2010JD014929.
Neubert, T., Allin, T.H., Stenbaek-Nielsen, H., et al., 2001. Sprites over Europe.Geophys. Res. Lett. 28, 3585–3588.
Neubert, T., Allin, T.H., Blanc, E., Farges, T., Haldoupis, C., Mika, A., Soula, S.,Knutsson, L., van der Velde, O., Marshall, R.A., Inan, U., Sátori, G., Bór, J.,Hughes, A., Laursen, S., Rasmussen, Ib.L., 2005. Co-ordinated observationsof transient luminous events during the EuroSprite2003 campaign. J.Atmos. Sol.-Terr. Phys. 67, 807–820.

Fig. 9. (a–g) Cloud ice content at different levels obtained from TRMM 2A12 data (orbit number 55325) at 21:57. (h–i) Slices of cloud ice content along lines ABand CD as shown in Fig. 9g, and the locations of AB and CD are the same as in Fig. 7e.
103J. Yang et al. / Atmospheric Research 127 (2013) 90–115
Sâo-Sabbas, F.T., Sentman, D.D., Wescott, E.M., O.P. Jr., O.M. Jr., Taylor, M.J.,2003. Statistical analysis of space–time relationships between spritesand lightning. J. Atmos. Solar. Terr. Phys. 65, 525–535.
Savtchenko, A., Mitzeva, R., Tsenova, B., Kolev, S., 2009. Analysis of lightningactivity in two thunderstorm systems producing sprites in France. J.Atmos. Solar-Terr. Phy. 71, 1277–1286.
Soula, S., Van der Velde, O., Montanya, J., Neubert, T., Chanrion, O., Ganot, M.,2009. Analysis of thunderstorm and lightning activity associated withsprites observed during the EuroSprite campaigns: two case studies.Atmos. Res. 91, 514–528.
Su, H.t., Hsu, R.R., Chen, A.B., Lee, Y.J., Lee, L.C., 2002. Observation of spritesover the Asian continent and over oceans around Taiwan. Geophy. Res.Lett. 29 (4). doi:10.1029/2001GL013737.
Van der Velde, O.A., Mika, A., Soula, S., Haldoupis, C., Neubert, T., Inan, U.S.,2006. Observations of the relationship between sprite morphology andin-cloud lightning processes. J. Geophys. Res. 111 (D15203). doi:10.1029/2005JD006879.
Wescott, E.M., Sentman, D.D., Heavner,M.J., Hampton, D.L., Lyons,W.A., Nelson, T.,1998. Observations of ‘columniform’ sprites. J. Atmos. Sol. Terr. Phys. 60,733–740.
Williams, E.R., Lyons, W.A., Hobara, Y., Mushtak, V.C., Asencio, N., Boldi, R.,Bór, J., Cummer, S.A., Greenberg, E., Hayakawa, M., Holzworth, R.H.,Kotroni, V., Li, J., Morales, C., Nelson, T.E., Price, C., Russell, B., Sato,M., Sátori, G., Shirahata, K., Takahashi, Y., Yamashita, K., 2009.Ground-based detection of sprites and their parent lightning flashesover Africa during the 2006 AMMA campaign. Q. J. R. Meteorol. Soc.doi:10.1002/qj.489.
Yair, Y., Price, C., Ganot, M., et al., 2009. Optical observations of transient lu-minous events associated with winter thunderstorms near the coast ofIsrael. Atmos. Res. 91 (2–4), 529–537.
Yang, J., Qie, X.S., Zhang, G.S., Zhao, Y., Zhang, T., 2008. Red sprites over thunder-storms in the coast of Shandong province. China. Chin. Sci. Bull. 53 (7),1079–1086.
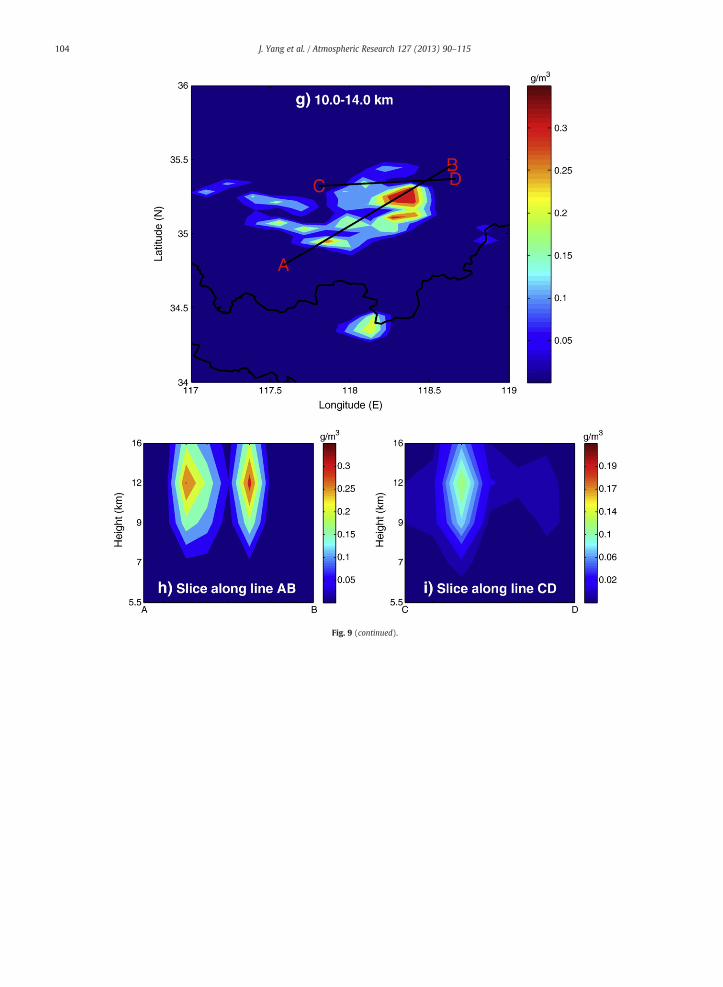
Fig. 9 (continued).
104 J. Yang et al. / Atmospheric Research 127 (2013) 90–115
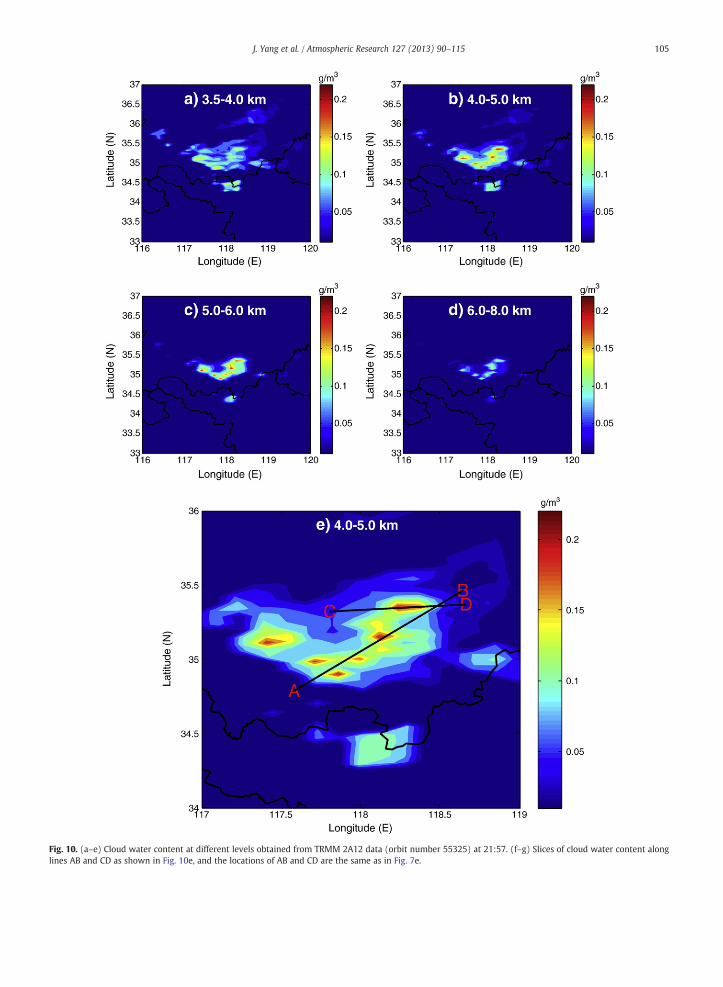
Fig. 10. (a–e) Cloud water content at different levels obtained from TRMM 2A12 data (orbit number 55325) at 21:57. (f–g) Slices of cloud water content alonglines AB and CD as shown in Fig. 10e, and the locations of AB and CD are the same as in Fig. 7e.
105J. Yang et al. / Atmospheric Research 127 (2013) 90–115

Fig. 10 (continued).
106 J. Yang et al. / Atmospheric Research 127 (2013) 90–115
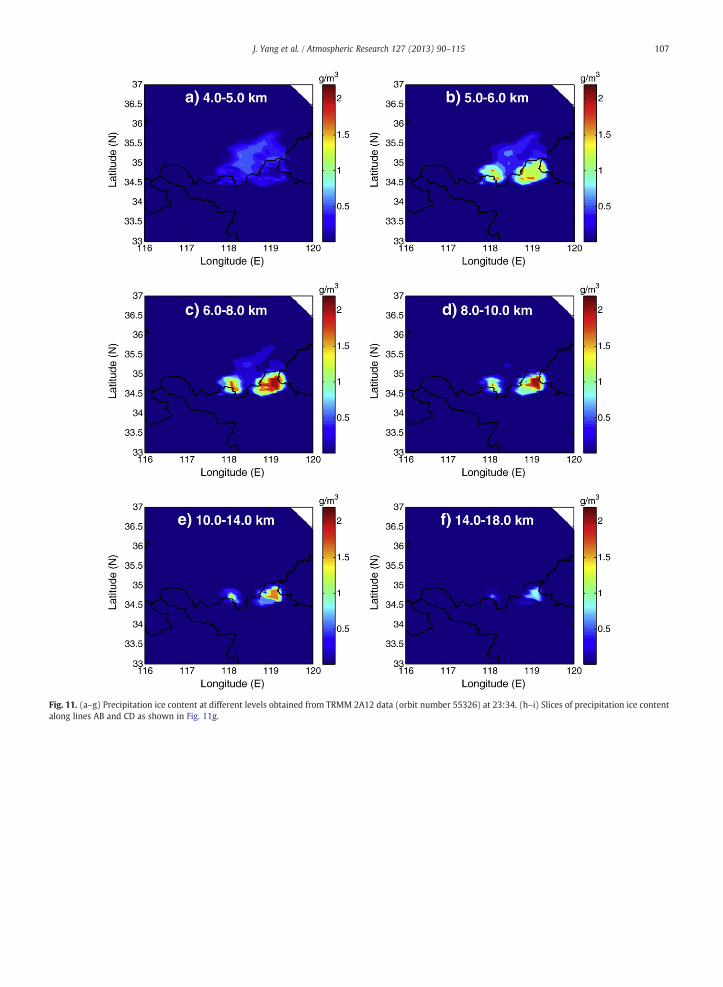
Fig. 11. (a–g) Precipitation ice content at different levels obtained from TRMM 2A12 data (orbit number 55326) at 23:34. (h–i) Slices of precipitation ice contentalong lines AB and CD as shown in Fig. 11g.
107J. Yang et al. / Atmospheric Research 127 (2013) 90–115

Fig. 11 (continued).
108 J. Yang et al. / Atmospheric Research 127 (2013) 90–115
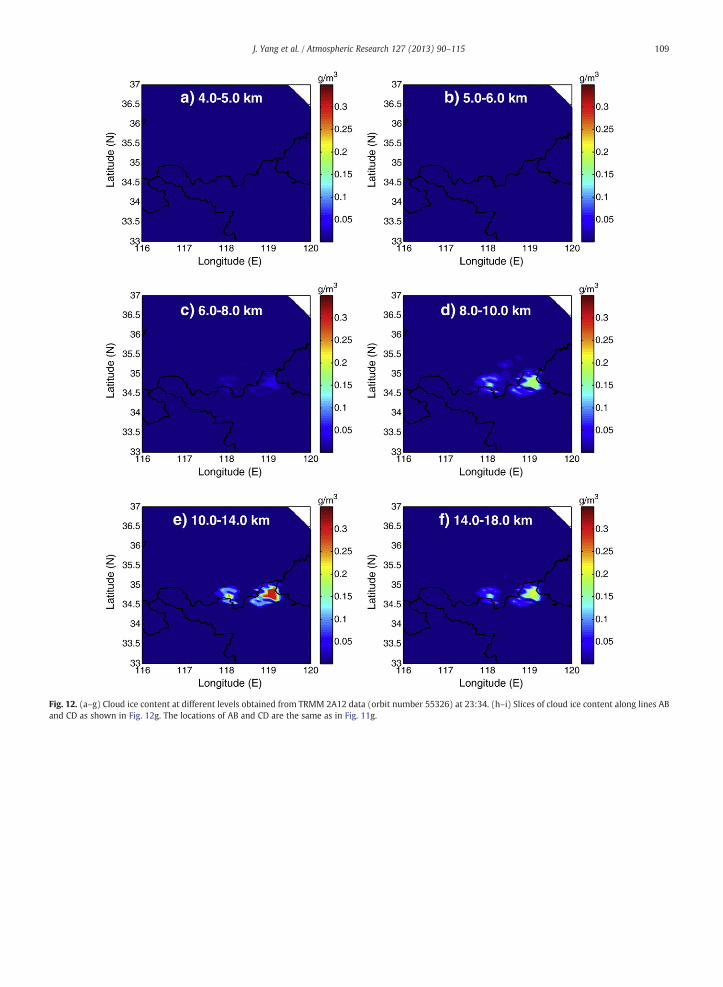
Fig. 12. (a–g) Cloud ice content at different levels obtained from TRMM 2A12 data (orbit number 55326) at 23:34. (h–i) Slices of cloud ice content along lines ABand CD as shown in Fig. 12g. The locations of AB and CD are the same as in Fig. 11g.
109J. Yang et al. / Atmospheric Research 127 (2013) 90–115

BA
CD
Longitude (E)
Latit
ude
(N)
BA
CD
117 118 119 12034
34.5
35
35.5
36
0.05
0.1
0.15
0.2
0.25
0.3
g) 10.0-14.0 km H
eigh
t (km
)
BA
g/m3
5.5
7
9
12
16
0.05
0.1
0.15
0.2
0.25
0.3
Hei
ght (
km)
DC
g/m3
g/m3
5.5
7
9
12
16
0.02
0.06
0.1
0.14
0.17
0.19
i) Slice along CD h) Slice along AB
Fig. 12 (continued).
110 J. Yang et al. / Atmospheric Research 127 (2013) 90–115

Fig. 13. (a–e) Cloud water content at different levels obtained from TRMM 2A12 data (orbit number 55326) at 23:34. (f–g) Slices of cloud water content alonglines AB and CD as shown in Fig. 13e. The locations of AB and CD are the same as in Fig. 11g. (h–j) Lightning flashes superposed on radar reflectivity cross sectionsat 4, 6 and 8 km at 23:29 1 August. The black ‘−’ stands for negative CGs and red ‘+’ stands positive CG, respectively.
111J. Yang et al. / Atmospheric Research 127 (2013) 90–115
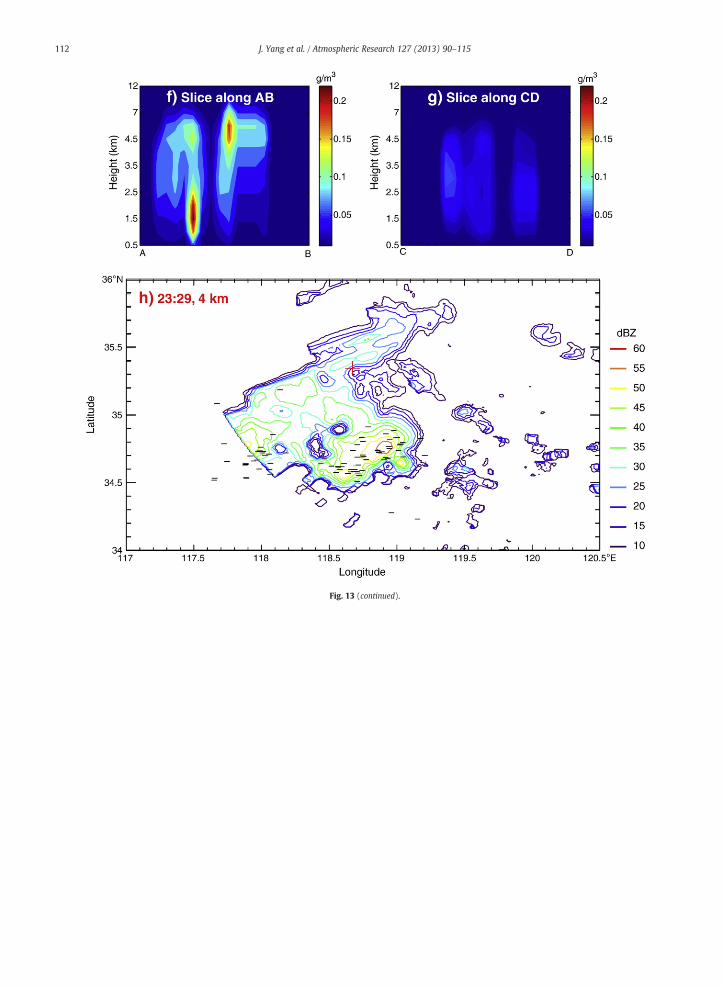
Fig. 13 (continued).
112 J. Yang et al. / Atmospheric Research 127 (2013) 90–115

Fig. 13 (continued).
113J. Yang et al. / Atmospheric Research 127 (2013) 90–115

Fig. 14. Comparison of precipitation ice (PrecipIce), cloud ice (CldIce) and cloud water (CldWater) obtained from orbit number 55325 (21:57) and orbit number55326 (23:34).
114 J. Yang et al. / Atmospheric Research 127 (2013) 90–115

Fig. 15. Characteristics of polarization corrected temperature based on TRMM 1B11 data. (a) Polarization corrected temperature at 21:57 (orbit number 55325);(b) polarization corrected temperature at 23:34 (orbit number 55326).
115J. Yang et al. / Atmospheric Research 127 (2013) 90–115