characteristics of academic leadership styles - wsu · pdf fileiv leadership styles and style...
TRANSCRIPT
LEADERSHIP STYLES AND STYLE ADAPTABILITY OF DEANS AND DEPARTMENT
CHAIRS AT THREE PUBLIC RESEARCH UNIVERSITIES
By
AIEMAN AHMAD AL-OMARI
A dissertation submitted in partial fulfillment of the requirements for the degree of
Doctor of Philosophy
WASHINGTON STATE UNIVERSITY College of Education
MAY 2005

ii

iii
ACKNOWLEDGMENT
This dissertation is the culmination of a long process that involved working within a
network of incredible people. With my sincere gratitude, I name but some of them here, although
mere words will fail to convey my sincere appreciation for their roles in my graduate education.
To my committee chair, Willie Heggins, thank you. You exemplify leadership through
your quiet strength and selfless determinations. You are the ultimate mentor, and I hope to share
with my students the same wisdom, guidance, patience, support, and encouragement that you
have shown me. Your friendship has meant a great deal to me throughout my graduate work. I
would also like to thank Forrest Parkay, Phyllis Erdmann, and Michael Pavel, each of you, for
your encouragement and support.
To my kids, Ahmad, Ayham, Malik, and Hala, you are my pride and joy. I thank you for
your love, wonderful insights, support, and friendship. Your constant encouragement during my
graduate study was uplifting and a constant source of energy for me. I’ll be there for each of you
when it’s your turn.
Finally, to my wife, Kawkab, I thank you for being there with me, every step of the way.
You always made everything so easy, so reachable, and so possible that, at times, I never felt like
I struggled. Thank you for your love, support, understanding, and for reminding me not to tilt at
windmills.
iv
LEADERSHIP STYLES AND STYLE ADAPTABILITY OF DEANS AND DEPARTMENT
CHAIRS AT THREE PUBLIC RESEARCH UNIVERSITIES
Abstract
By Aieman AL-OMARI, Ph.D. Washington State University
MAY 2005
Chair: Willie Heggins
This study was designed to identify the leadership styles and style adaptability, as defined
by the Leadership Effectiveness and Adaptability Description (LEAD) Self instrument, of deans
and department chairs at three Public Doctoral Research Universities-Extensive (Carnegie
Commission on Higher Education, 2000) in the northwest region of the United States.
Both deans and department chairs selected selling as their primary leadership style. They
apply the leadership style of selling as a means to have their faculty and staff accepts and display
the behaviors most valued or needed by them. The selling style is appropriate if followers are
confident and willing to take responsibility but are unable to do so because of lack of expertise.
The interrelationship among the leadership styles of deans and the demographic factors
was low. There was insufficient evidence to show exists of a significant difference for leadership
styles among deans as perceive themselves, with the exception of their discipline. A significant
difference does exist between delegating leadership style among deans based upon their
discipline.

v
Contrary to deans, it could be concluded that leadership styles of department chairs is
affected by demographic factors. Male department chairs differ significantly from female
department chairs in telling, and delegating, while female department chairs differ significantly
from male department chairs in participating. A significant relationship exists between the
leadership styles of selling, participating, and delegating among department chairs based upon
their discipline. A significant relationship exists between the leadership styles of participating,
and delegating among department chairs based upon their departments’ enrollment. The
leadership style of participating among department chairs was found to be based upon
experience in their current position.
Style adaptability of deans and department chairs fell into the middle range. This range
reflects a moderate degree of adaptability. Scores in this range usually indicate a pronounced
primary leadership style with less flexibility in the secondary styles. Style adaptability levels of
deans and department chairs are not very affected by demographic factors. There was insufficient
evidence to show that a significant difference exists in style adaptability levels among deans and
department chairs as they perceive themselves.

vi
TABLE OF CONTENTS
Page
ACKNOWLEDGEMENTS ………………………………………………………….. iii
ABSTRACT ………………………………………………………………………….. iv
LIST OF TABLES ……………………………………………………………………. ix
DEDICATION ………………………………………………………………………... xii
CHAPTERS
1. THE PROBLEM AND ITS BACKGROUND …………………………….. 1
Introduction ………………………………………………………………… 1
Statement of the Problem ………………………………………….……….. 4
The Importance of the Problem ……………………………………………. 4
Purpose of the Study ……………………………………………………….. 5
Questions of the Study …………………………………………………….. 6
Theoretical Framework: The Situational Leadership Model ……………… 8
Operational Definitions …………………………………………………….. 11
Assumptions ………………………………………………………………... 12
Limitations and Delimitations of the Study ……………………………….. 12
2. REVIEW OF LITERATURE ……………………………………………… 14
Leadership Definition ……………………………………………………… 14
The Leadership Theory ……………………………………………………. 17
Trait Theories ………………………………………………………… 18
Power and Influence Theories ……………………………………….. 19

vii
Behavior Theories ……………………………………………………. 21
Contingency Theories ………………………………………………... 22
Cultural and Symbolic Theories ……………………………………... 24
Cognitive Theories …………………………………………………… 24
The Leadership Studies Related to Deans and Department Chairs ……….. 25
3. METHODOLOGY AND RESEARCH DESIGN ………………………… 36
The Population and Sample of the Study …………………………………. 36
Design of the Study ……………………………………………………….. 36
Research Questions and Hypothesis of the Study ………………………… 37
Instrumentation ……………………………………………………………. 38
Validity of the Study ……………………………………………………… 41
Data Collection ……………………………………………………………. 41
Data Analysis ……………………………………………………………… 42
4. RESULTS …………………………………………...…………………….. 43
Leadership Styles …………………………………………………………. 45
Style Adaptability ………………………………………………………… 47
Leadership Styles and Demographic Variables …………………………… 49
Style Adaptability and Demographic Variables .…………………………. 64
5. CONCLUSIONS AND IMPLICATIONS ………………………………… 72
REFERENCES ……………………………………………………………………….. 78
APPENDIX …………………………………………………………………………… 84

viii
A. Lead-Self Instrument ………………………………………………………. 84
B. Personal Information Data Sheet …………………………………………... 88
C. Leadership Style and Range ……………………………………………….. 90
D. Style Adaptability …………………………………………………………. 94
E. Cover Letter to Deans and Department Chairs for Survey ……………….. 96
F. Center For Leadership Studies, Inc. Permission to Use Materials ………... 98
ix
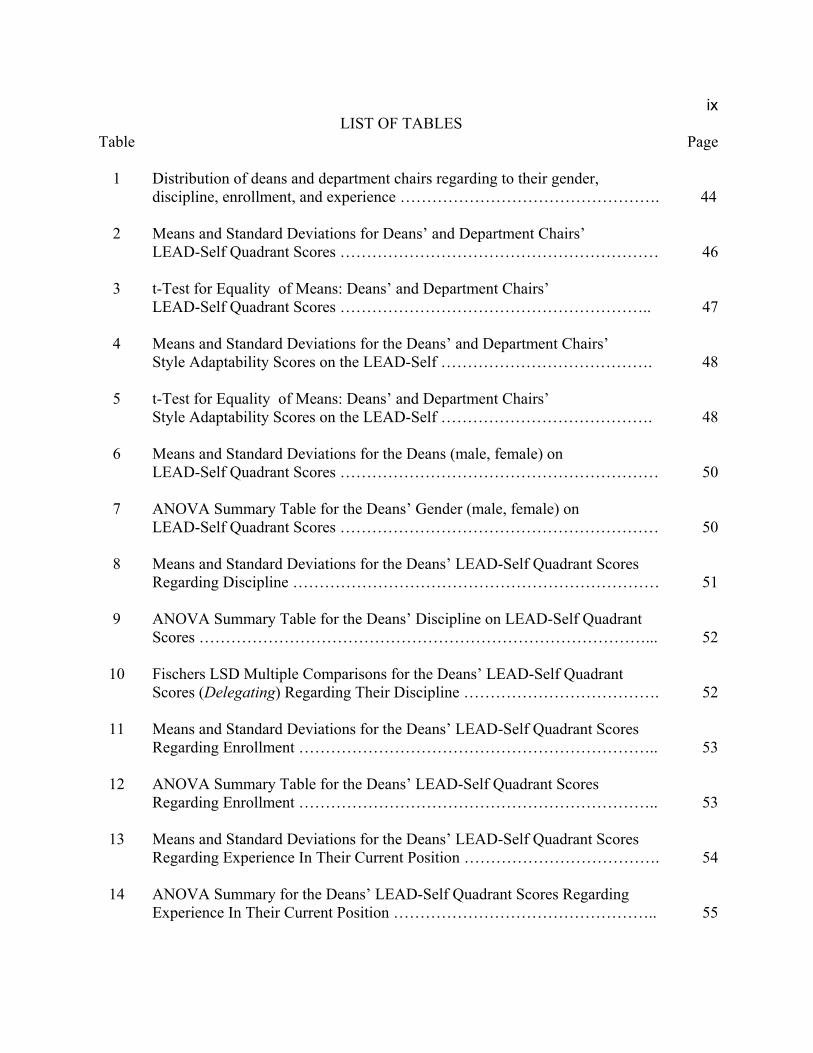
LIST OF TABLES Table Page
1 Distribution of deans and department chairs regarding to their gender, discipline, enrollment, and experience ………………………………………….
44
2 Means and Standard Deviations for Deans’ and Department Chairs’ LEAD-Self Quadrant Scores ……………………………………………………
46
3 t-Test for Equality of Means: Deans’ and Department Chairs’ LEAD-Self Quadrant Scores …………………………………………………..
47
4 Means and Standard Deviations for the Deans’ and Department Chairs’ Style Adaptability Scores on the LEAD-Self ………………………………….
48
5 t-Test for Equality of Means: Deans’ and Department Chairs’ Style Adaptability Scores on the LEAD-Self ………………………………….
48
6 Means and Standard Deviations for the Deans (male, female) on LEAD-Self Quadrant Scores ……………………………………………………
50
7 ANOVA Summary Table for the Deans’ Gender (male, female) on LEAD-Self Quadrant Scores ……………………………………………………
50
8 Means and Standard Deviations for the Deans’ LEAD-Self Quadrant Scores Regarding Discipline ……………………………………………………………
51
9 ANOVA Summary Table for the Deans’ Discipline on LEAD-Self Quadrant Scores …………………………………………………………………………...
52
10 Fischers LSD Multiple Comparisons for the Deans’ LEAD-Self Quadrant Scores (Delegating) Regarding Their Discipline ……………………………….
52
11 Means and Standard Deviations for the Deans’ LEAD-Self Quadrant Scores Regarding Enrollment …………………………………………………………..
53
12 ANOVA Summary Table for the Deans’ LEAD-Self Quadrant Scores Regarding Enrollment …………………………………………………………..
53
13 Means and Standard Deviations for the Deans’ LEAD-Self Quadrant Scores Regarding Experience In Their Current Position ……………………………….
54
14 ANOVA Summary for the Deans’ LEAD-Self Quadrant Scores Regarding Experience In Their Current Position …………………………………………..
55
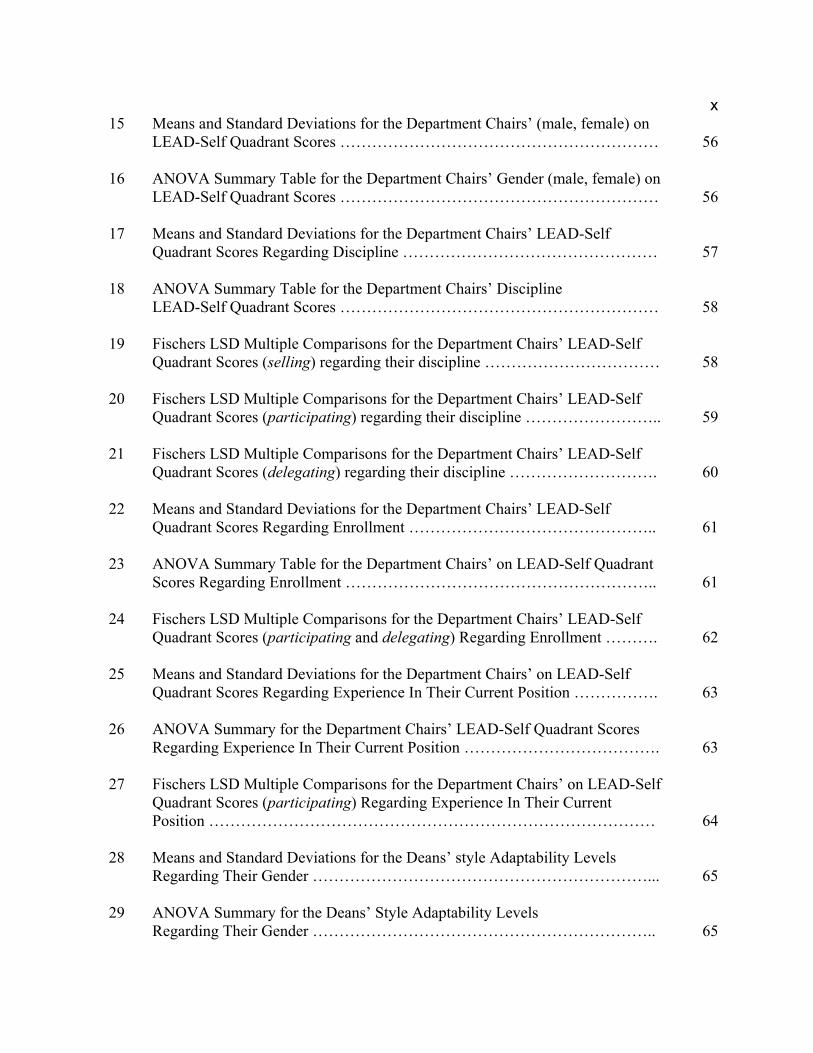
x
15 Means and Standard Deviations for the Department Chairs’ (male, female) on LEAD-Self Quadrant Scores ……………………………………………………
56
16 ANOVA Summary Table for the Department Chairs’ Gender (male, female) on LEAD-Self Quadrant Scores ……………………………………………………
56
17 Means and Standard Deviations for the Department Chairs’ LEAD-Self Quadrant Scores Regarding Discipline …………………………………………
57
18 ANOVA Summary Table for the Department Chairs’ Discipline LEAD-Self Quadrant Scores ……………………………………………………
58
19 Fischers LSD Multiple Comparisons for the Department Chairs’ LEAD-Self Quadrant Scores (selling) regarding their discipline ……………………………
58
20 Fischers LSD Multiple Comparisons for the Department Chairs’ LEAD-Self Quadrant Scores (participating) regarding their discipline ……………………..
59
21 Fischers LSD Multiple Comparisons for the Department Chairs’ LEAD-Self Quadrant Scores (delegating) regarding their discipline ……………………….
60
22 Means and Standard Deviations for the Department Chairs’ LEAD-Self Quadrant Scores Regarding Enrollment ………………………………………..
61
23 ANOVA Summary Table for the Department Chairs’ on LEAD-Self Quadrant Scores Regarding Enrollment …………………………………………………..
61
24 Fischers LSD Multiple Comparisons for the Department Chairs’ LEAD-Self Quadrant Scores (participating and delegating) Regarding Enrollment ……….
62
25 Means and Standard Deviations for the Department Chairs’ on LEAD-Self Quadrant Scores Regarding Experience In Their Current Position …………….
63
26 ANOVA Summary for the Department Chairs’ LEAD-Self Quadrant Scores Regarding Experience In Their Current Position ……………………………….
63
27 Fischers LSD Multiple Comparisons for the Department Chairs’ on LEAD-Self Quadrant Scores (participating) Regarding Experience In Their Current Position …………………………………………………………………………
64
28 Means and Standard Deviations for the Deans’ style Adaptability Levels Regarding Their Gender ………………………………………………………...
65
29 ANOVA Summary for the Deans’ Style Adaptability Levels Regarding Their Gender ……………………………………………………….. 65
xi
30 Means and Standard Deviations For The Deans’ Style Adaptability Levels
Regarding Their Discipline ……………………………………………………..
66
31 ANOVA Summary For The Deans’ Style Adaptability Levels Regarding Their Discipline ……………………………………………………………………….
66
32 Means and Standard Deviations for the Deans’ Style Adaptability Levels Regarding their college enrollment ……………………………………………..
66
33 ANOVA Summary for the Deans’ Style Adaptability Levels Regarding their college enrollment ………………………………………………………………
67
34 Means and Standard Deviations for the Deans’ Style Adaptability Levels Regarding their experience ……………………………………………………..
67
35 ANOVA Summary for the Deans’ Style Adaptability Levels Regarding their experience ……………………………………………………………………….
67
36 Means And Standard Deviations For The Department Chairs’ Style Adaptability Levels Regarding Their Gender …………………………………..
68
37 ANOVA Summary For The Department Chairs’ Style Adaptability Levels Regarding Their Gender ………………………………………………...
68
38 Means and Standard Deviations for the Department Chairs’ Style Adaptability Levels Regarding their Discipline ………………………………………………
69
39 ANOVA Summary For The Department Chairs’ Style Adaptability Levels Regarding Their Discipline …………………………………………………….
69
40 Means And Standard Deviations For The Department Chairs’ Style Adaptability Levels Regarding Their Department Enrollment …………………
70
41 ANOVA Summary For The Department Chairs’ Style Adaptability Levels Regarding Their Department Enrollment ………………………………………
70
42 Means and Standard Deviations For The Department Chairs’ Style Adaptability Levels Regarding Their Experience In Current Position …………
71
43 ANOVA Summary For The Department Chairs’ Style Adaptability Levels Regarding Their Experience In Current Position ………………………………
71

xii
DEDICATION
This study and my subsequent doctorate degree are dedicated to my father’s memory,
who toughened his hands to gain opportunities so that his children would never have to toughen
theirs.
1
CHAPTER ONE
THE PROBLEM AND ITS BACKGROUND Introduction
The study of leadership is not a recent phenomenon. Given the history of discussion
relating to leadership found in the writings of Greek and Chinese philosophers, it would be
reasonable to expect to find a clear definition of leadership. However, despite the plethora of
literature available, there has been no consistent definition of leadership found (Mello, 1999).
Definitions of leadership offered by researchers such as Montgomery (1961), Tannenbaum and
Schmidt (1961), Kotter (1990), and Drouillard and Kleiner (1996) share a common theme,
indicating that a leader has the potential ability to influence a group of individuals towards the
achievement of a particular goal.
Many studies have been conducted resulting in the development of some important
theories and concepts of leadership, but mainly in areas of business and industry organizations
(Yukl, 1989). Very little research has been conducted on leadership in academia, and
comparatively less research within academic colleges and departments. While nearly 80 percent
of all administrative decisions in higher education are made at the department level (Hilosky, &
Watwood, 1997; Wolverton, Gmelch, Wolverton, & Sarros, 1999), deans and department chairs
are thought to adopt a collaborative style in reaching their decisions. Deans and department
chairs are slow to gain recognition as leaders and agents of change (Gmelch & Miskin, 1995).
Formal training, instruction, or orientation for dean and department chair positions is
often non-existent (Bennett, 1982; Tucker, 1984). Deans and department chairs are placed in
charge of academic units without actual knowledge of people management skills or how to
accomplish group goals. These academics are given responsibility without proper advising or

2
instruction, and some have difficulty in this situation at the expense of their respective
departments. Recommendations for dean and department chair training and workshops are found
in the works of Bennett (1982) and Tucker (1984). As Redwood, Goldwasser, and Street (1999)
acknowledge, “some leaders are born, but most need help.”
Therefore, deans and academic department chairs, especially those new to their positions,
can confront their new challenges with fewer problems if they understand essential elements for
developing a culture of proactive change. Deans and department chairs are expected to be agents
of change, college professionals, and mentors guiding faculty and staff through team building
and professional development.
College deans have the ability to exert power, control information, allocate resources, and
assess the performance and promotion of their faculty and staff. They serve as academic
facilitators between university presidential initiatives, faculty governance, and student needs
(Astin and Scherrei, 1980). The deans’ complex balancing process of their varied roles and
responsibilities are often viewed differently among faculty, provosts, students, and deans
themselves (Gmelch, Wolverton, Wolverton, & Sarros, 1999). These differing perceptions of the
position place further multiple, conflicting, and consequential pressures upon deans (Gmelch,
Wolverton, Wolverton, & Sarros, 1999; Kapel & Dejnozka, 1979).
Academic department chairs are one element of the academic administration of their
institution, and occupy a unique role in higher education institutions. The Gmelch and Miskin
(1993) study defined three major challenges facing department chairs. A better understanding of
these challenges may help department chairs affect desired changes in the department. The three
challenges are: 1) to develop an understanding and clarity about the motives and roles of a
department chair; 2) to understand the strategic planning process for creating a productive

3
department and vision, building a mission statement that describes the long term intent and this
vision, and which sets the priorities for daily departmental endeavors and decision making
processes; and 3) to develop key leadership skills needed to be an effective department chair,
manage time effectively, and creatively manage stress.
In the United States, universities employ approximately 80,000 department chairs
(Wolverton, Gmelch, Wolverton, & Sarros, 1999). This number of academic department chairs
in of higher education institutions, warrants the need to explore their leadership styles. A national
study of university department chairs in the United States in 1991 showed the average chair was
50 years old, white, male, tenured, and possessed a Ph.D. Of 564 chairs participating in this
national study, the ethnic statistics were: 95 % white, 3 % Asian, 1.5 % Black, 0.18 % Native
American, and no Hispanic (Gmelch & Miskin, 1995).
Seagren, Creswell, and Wheeler (1993) defined the position of department chair as a mid-
level manager of an academic unit responsible for faculty workload, faculty and staff
development, student appeals, curriculum, programs of study, budgeting, and planning. The
department chair typically provides a link between faculty, students, programs, and upper level
administrators.
The studies addressing the leadership styles of deans and department chairs are limited.
Most of the research has focused on specific and different topics such as their transition from
research and teaching to academic management (Arter, 1981), their dilemmas and stress in
leadership (Cleveland, 1960; Wolverton, Gmelch, Wolverton, & Sarros, 1999), their position of
conflict (Feltner & Goodsell, 1972; Wolverton, Wolverton, & Gmelch, 1999), their management
skills and mobility (Sagaria, 1988; Sagaria & Krotseng, 1986), and their role in governance and
decision making (Baldridge, 1971). Given this limited research, there is a need to further study

4
leadership styles and style adaptability of deans and department chairs at Public Doctoral
Research Universities-Extensive (Carnegie Commission on Higher Education, 2000).
Statement of the Problem
As academic administrators, deans and department chairs are called upon to interact with
and influence others in leading their faculty, and administrative cabinets. These two groups, the
faculties and administrative cabinets, each with varied responsibilities, hierarchical relationships,
educational backgrounds, attitudes, and personalities, present to deans and department chairs
differing leadership situations. Whether a dean or department chair can manage these situations
in an equal and effective manner given their own individual leadership style and background,
may determine the amount of satisfaction a dean or department chair garners from their position.
The interaction of a dean’s or department chair’s leadership style with the group leadership
situations within the faculty and administrative cabinet can greatly influence the success of the
dean or department chair with these groups as well as with the institution. The objective of this
study is to identify leadership styles and style adaptability of deans and department chairs as
perceived by them at three Public Doctoral Research Universities-Extensive.
The Importance of the Problem
The efficiency of leadership styles of deans and department chairs is a significant factor
influencing both the nature and the quality of an institution. The dean or department chair that is
able to develop an effective leadership style and maintain a relationship of productive harmony
with the other principal leadership centers of the college is better able to devote more energy
toward the creative development of the college. Conversely, a dean or department chair with an

5
ineffective leadership style and is in conflict with either the faculty or administrative cabinet is
not positioned well to further their goals for the department or institution.
Most of the literature on organizational leadership concerns the leadership style and the
relationship of a principal leader of a single group that the leader is perceived to lead. Such a
view of organizational leadership admits to only one hierarchical relationship, a leader of a
subordinate group. This approach to understanding organizational leadership styles does not
adequately replicate the most complex situation in a university where the principal leaders, the
deans and department chairs, are expected to lead equally well multiple groups, one of which is
hierarchically superior and another of which is subordinate to the dean and department chair.
The problem as presented seeks to explore leadership styles and style adaptability of
deans and department chairs as perceived by them at three Public Doctoral Research
Universities-Extensive, and to investigate the differing leadership situations with which a dean
and department chair are presented, and to relate these situations to their perceived leadership
styles.
Purpose of the study
The literature addressing leadership theories and models in higher education tends to
consider college presidents and upper-level administrators as leaders, and rarely focuses on mid-
level managers, deans and department chairs, for their leadership studies. Despite the fact that
nearly 80 % of all administrative decisions in higher education are made at the department level
(Wolverton, Gmelch, Wolverton, & Sarros, 1999), department chairs are slow to gain
recognition as leaders and agents of change (Gmelch & Miskin, 1995).

6
This study focused on deans and department chairs in an attempt to provide them with
an opportunity for concentrated study of them in positions of leadership. The situational
leadership model developed by Hersey and Blanchard (1982) was used as the framework for this
study. Hersey and Blanchard developed a major component in leadership theory with their
situational leadership model. This model was created by combining early studies on leadership
and then dividing this information into quadrants. Hersey and Blanchard (1982) stated, “The
style of leaders is the consistent behavior patterns that they use when they are working with and
through other people” (p. 126).
Therefore, by using the situational leadership model as a framework, and the Leadership
Effectiveness and Adaptability Description (LEAD)-Self instrument (Appendix A), this study
investigated the leadership styles and style adaptability of deans and department chairs as
perceived by them, and how demographic variables (gender, discipline, experience in current
position, and enrollment of the college or department) influence leadership styles and style
adaptability levels of them at three Public Doctoral Research Universities-Extensive.
Questions of the study
The research questions were designed to identify leadership styles and style adaptability
of deans and department chairs as perceived by them at three Public Doctoral Research
Universities-Extensive.
The research questions of this study are:
1. How do deans and department chairs perceive their leadership styles?
2. What is the average style adaptability level among deans and department chairs?

7
3. How do demographic variables (gender, discipline, experience in current position, and
enrollment of the college or department), influence leadership styles and style
adaptability levels of deans and department chairs?
Ho1: There is no significant difference among leadership styles of deans as perceived
by them for each of the following variables:
a. Gender of dean
b. Discipline
c. Enrollment of the college
d. Experience in current position
Ho2: There is no significant difference among leadership styles of department chairs as
perceived by them for each of the following variables:
a. Gender of department chair
b. Discipline
c. Enrollment of the department
d. Experience in current position
Ho3: There is no significant difference among style adaptability levels of deans as
perceived by them for each of the following variables:
a. Gender of dean
b. Discipline
c. Enrollment of the college
d. Experience in current position
Ho4: There is no significant difference among style adaptability levels of department
chairs as perceived by them for each of the following variables:

8
a. Gender of department chair
b. Discipline
c. Enrollment of the department
d. Experience in current position
Theoretical Framework: The Situational Leadership Model
As a theoretical framework of this study, the situational leadership model that was
developed by Hersey, Blanchard, and Johnson (1996) is based on the interrelationships among
three salient elements of group dynamics: First, amount of guidance and direction (i.e., task
behavior) a leader provides to members of the organization; second, amount of socio-emotional
support (i.e., relationship behavior) a leader provides to members of the organization; and third,
readiness levels (i.e., maturity levels) that followers exhibit in working on tasks necessary for the
achievement of organizational goals. This concept provides leaders with some understanding of
the relationship between an effective style of leadership and the level of readiness of their
subordinates.
Hersey, Blanchard, and Johnson (1996), as well as other leadership theorists such as
Fiedler (1967) and Blake and Mouton (1964), maintain that no single leadership style is
appropriate for all situations. Effective leaders adapt their leadership behaviors to the readiness
levels of subordinates. In the situational leadership model, the two dimensions of task and
relationship are related to a third dimension: the maturity levels of the group or organization, or
rather its readiness.
Readiness in situational leadership is defined as the extent to which a subordinate
demonstrates the ability and willingness to accomplish a specific assigned task. Readiness is not
9
a personal characteristic; it is not an evaluation of a person’s traits, values, or age. Readiness is
how prepared a person may perform a particular task (Hersey, Blanchard, & Johnson, 1996).
Hersey, Blanchard, and Johnson (1996) suggest four leadership styles that reflect
behaviors along two dimensions. The first dimension, Task Behavior, consists of one-way
communication and activities that are highly directive. In other words, the leader is explicit about
assigning duties and responsibilities to be met by their subordinates. Leadership behaviors within
this dimension include telling them what to do, and how, when, and where to do the assigned
tasks.
The second dimension, Relationship Behavior, focuses on the leader’s facilitative ability
to reach desired goals, and consists of two-way communication and providing support,
encouragement, and positive psychological feedback (Hersey, Blanchard, & Johnson, 1996).
According to the Situational Leadership model, leadership styles refer to four salient
communication patterns the leader may use in talking to followers, which are telling, selling,
participating, and delegating. The two behaviors of telling and selling are primarily leader
oriented with one-way communications. Alternatively, participating and delegating are largely
follower-oriented with two-way communications. Participating behaviors require the leader to
invest considerable socio-emotional involvement in working with subordinates, while delegating
behaviors involves a diminishment of involvement and support.
The following descriptions apply to the four styles:
- Style 1 (Telling): This leadership style is characterized by above-average amounts of
task behavior and below-average amounts of relationship behavior. This style is appropriate
when an individual or group is low in ability and willingness and needs direction. This style

10
emphasizes directive behavior in which the leader identifies the roles of followers and tells
them what, how, when, and where to do various tasks (Hersey, Blanchard, & Johnson, 1996).
- Style 2 (Selling): This leadership style is characterized by above-average amounts of
both task and relationship behavior. The task behavior is appropriate because people are still
considered unable, but because they’re trying, it is important to be supportive of their motivation
and commitment. The leader establishes and maintains two-way communication and provides
sufficient support and reinforcement so that followers will psychologically accept the leader’s
decisions (Hersey, Blanchard, & Johnson, 1996).
- Style 3 (Participating): This style is characterized by above-average amounts of
relationship behavior and below-average amounts of task behavior. The decision-making
procedure being shared by both the leader and follower characterizes this style. The leader
maintains the role of confidence in the aptitude of his followers (Hersey, Blanchard, & Johnson,
1996).
- Style 4 (Delegating): This style is characterized by below-average amounts of both
relationship and task behavior. The followers are allowed to take charge and decide for
themselves what, how, when, and where to do various tasks. The leader shows complete
confidence in his followers’ aptitudes and decisions (Hersey, Blanchard, & Johnson, 1996).
More effective leaders determine which leadership style is most appropriate for them by
first assessing the readiness level of the subordinates, which is their ability and willingness to
perform the task. The two major components of readiness are ability and willingness. Ability is
the knowledge, experience, and skill that an individual or group brings to a particular task or
activity. Willingness is the extent to which an individual or group has the confidence,
11
commitment, and motivation to accomplish a specific task (Hersey and Blanchard, & Johnson,
1996).
After identifying the readiness level of the individual or group they are attempting to
influence, the leader determines the most appropriate leadership style. Hence, style adaptability
is the extent to which the leaders are able to vary their style in response to the demands of a
particular situation or problem.
Hersey, Blanchard, and Johnson (1996) suggest that all leaders have a primary leadership
style and that most leaders have a secondary leadership style. A leader’s primary leadership style
is defined as the behavior pattern used most often when attempting to influence the activities of
others, for example, a preferred subordinate. A leader’s secondary leadership style is the
behavior pattern most often used only on occasion. Further, leaders have one primary leadership
style, and they tend to use one of the four basic leadership styles described in Situational
Leadership in most leadership situations. However, they may have no secondary leadership style
or they may have up to three secondary styles.
Operational Definitions
The following definitions were operationalized for this study.
Leadership: The process of influencing the activities of an individual or a group in
efforts toward goal achievement in a given situation (Hersey, Blanchard, & Johnson, 1996).
Leadership Style: The behavior pattern a person exhibits when attempting to influence
the activities of others (Hersey, Blanchard, & Johnson, 1996).

12
Style Range: The extent to which a leader is able to vary their leadership style through
the four quadrants of the Situational Leadership Model. A wide style range possesses a greater
ability to be effective in various situations (Hersey, Blanchard, & Johnson, 1996).
Style Adaptability: The degree to which leaders are able to vary their style according to
the demands of a given situation, per the Situational Leadership Model (Hersey, Blanchard, &
Johnson, 1996).
Readiness: Readiness in Situational Leadership is defined as the extent to which a
follower demonstrates the ability and willingness to accomplish a specific task (Hersey,
Blanchard, & Johnson, 1996).
Doctoral Research Universities-Extensive: These institutions typically offer a wide range
of baccalaureate programs, and they are committed to graduate education through the doctorate.
During the period studied, they awarded 50 or more doctoral degrees per year across at least 15
disciplines (Carnegie Commission on Higher Education, 2000).
Assumptions
For the purpose of conducting this study, the following major assumptions were made:
1. That all respondents are honest and truthful, and that all question responses are factual;
2. That deans and department chairs have leadership styles that differentiate them from
other academic administrators;
3. That deans and department chairs rely on leadership styles that are unique in higher
education;
4. That deans and department chairs leadership styles are adequately represented on the
Leadership Effectiveness Adaptability Description (LEAD) Self instrument; and
13
5. That deans and department chairs are unique administrators in contrast to other faculty
and senior level administrators.
Limitations and Delimitations of the Study
The following are limitations and resulting delimitations of the current study:
1. The study is limited to the department chairs and deans at three Public Doctoral Research
Universities-Extensive in the northwest region of the United States.
2. This inquiry into leadership styles and style adaptability of deans and department chairs
at three of Public Doctoral Research Universities-Extensive. Therefore, the study findings
cannot be generalized to other areas of education or other administrative positions within
or outside of the universities studied.
3. The data collection and intent of the study were limited to three Public Doctoral Research
Universities-Extensive. Therefore, the findings of this study should not be interpreted
representative of the views of other deans and department chairs at other academic
institutions.
4. Only predefined leadership styles were evaluated using the survey instrument. Therefore,
findings of this study may not be inclusive of leadership styles that are personally unique
or dependent upon the individual holding the position of dean or department chair.
5. The data collected for this study occurred during the fall of 2004. Therefore, the study’s
findings are indicative of that time period only and as such, are not reflective of
alternative or different chronological episodes. As with the assumptions noted above, the
study of a heuristic value, and the limitations were accepted to individually guide this
research.
14
CHAPTER TWO
REVIEW OF LITERATURE
The literature review related to the study of leadership styles and style adaptability of deans and
department chairs as perceived by them at three Public Doctoral Research Universities-
Extensive.
The literature review is organized to focus first on a discussion of definitions of
leadership and leadership theories, placing emphasis on these theories that guide analysis of the
study data, and secondly to focus on leadership literature for deans and department chairs.
Leadership Definition
The study of leadership is both daunting and enticing. Leadership study is daunting
because it is one of the most important and pervasive issues regularly argued across a multitude
of disciplines including political, educational, legal, and psychological ones. Leadership is the
subject of much published work produced annually. Over 7,000 books, articles or presentations
on leadership were produced in 1990 (Bass, 1990; Hogan et al., 1994). In addition, its
definitions, taxonomies, and typologies are numerous; at one time, leadership was noted as
having over 350 definitions (Bass, 1990; Bennis & Nanus, 1997).
Leadership study can be enticing and has been a preoccupation of human beings since the
beginning of life (Bass, 1990). It provides a means for aspiring leaders to liken themselves with
the great individuals who have worn the title of leader.
For all the attention given leadership study, however, James MacGregor Burns’ (1978)
astute observation still holds, which is that it “is one of the most observed phenomena on earth
and it is one of the least understood” (p.2). Scholars have attempted to define, categorize, and

15
attribute the study of leadership to situations, only to add to its confusion and
incomprehensibility. Rost (1993) said that “attempts to define leadership have been confusing,
varied, disorganized, idiosyncratic, muddled, and according to conventional wisdom, quite
unrewarding”. Bass (1990) reduced the concept to a “rough scheme of classification”:
Leadership has been conceived as the focus of group processes, as a matter of personality, as a matter of inducing compliance, as the exercise of influence, as particular behaviors, as a form of persuasion, as a power of relation, as an instrument to achieve goals, as an effect of interaction, as a differentiated role, as initiation of structure, as many combinations of these definitions (p. 11).
Yukl (1998) asserted that despite research efforts, leadership has no common definition, and that
confusion and a “state of fermentation” exist given the disparity in approaches, research focus,
and lack of integrated theoretical findings. New theories have emerged that replicated older ones;
in effect, pouring “old wine into new bottles” (Bass, 1990; Bass & Avolio, 1994).
For all the definitions, many are ambiguous (Pfeffer, 1977) or contradictory and
inconclusive (Gmelch, 1999). For example, some definitions of leadership do not distinguish it
from social influence phenomena, and others tend to emulate general models of behavior
(Pfeffer, 1977). The result is that leadership has been categorized into a myriad of dimensions,
and these overlapping meanings have only added to the confusion (Pfeffer, 1977; Spitzberg,
1987).
Given the multidimensional demands of higher education, it is easy to see why so few
institutions have attempted to define their leadership. As the leadership crisis continues,
however, so escalates the search for solutions for this leadership dilemma (Gmelch, 1999).
Leaders, the studies say, are born, not made—are not born; possess distinctive traits—possess no special traits at all; emerge from the ranks of faculty—must be trained and developed; or must use power and influence—must merely manage symbols and the academic culture. (Gmelch, 1999, p.1)
16
To avoid adding to the established confusion, this study attempts to clarify the concept
of leadership as it relates to higher education. The research seeks to identify the leadership styles
and style adaptability of deans and department chairs as perceived by them at three Public
Doctoral Research Universities-Extensive.
In general, according to Rowley (1997), and specifically in the context of higher
education, the world and markets are changing, and political and legal contexts are shifting. In
addition, information technology has increased the speed of communication and therefore has
impacted the ability of organizations to monitor and respond to their customers’ requirements. In
such an environment, organizations and their employees must learn how to change.
According to Salaman and Butler (1994), in order to change appropriately organizations
must be able to analyze themselves, their processes, structures, and environments. They must be
able to identify preferred and appropriate responses, as well as be able to implement them. In
other words, organizations must be able to learn and to learn from their learning. Without this
ability, organizations will not be able to exercise appropriate choice in respect to structure,
process, culture, and product; and consequently, they will fail. The learning organization needs a
process for supporting people in the identification and exploitation of learning opportunities.
Establishing such a process is a shared role for management development advisers, and trainers
and educators in partnership with line managers.
In this context, managers need to accept responsibility for the performance of others.
Mumford (1980) suggests that managers who are good developers of their staff possess several
characteristics. These mangers draw out the strengths and weaknesses of their staff rather than
suppress them; they reward their staff both materially and psychologically for risks taken in
attempting to develop themselves; they positively seek to identify learning opportunities for

17
staff; they grant time off for professional development; they involve their subordinates in
some of their own tasks and do not simply delegate tasks that they do not wish to do themselves;
they share some of their problems and anxieties with their staff as one way of enhancing staff
development; they listen to rather than talk at their staff; they do not seek to shape individuals
as replicas of themselves; and they take risks on the desired results of their departments in
pursuit of relevant learning opportunities for their staff.
To exhibit these characteristics, managers need to develop appropriate adult to adult
relationships, as well as the language and behavior that are used in these relationships.
Individual learning, to a significant extent then rests on the relationships that managers
collectively, within an organization have with their staff. Higher education institutions need to
reflect on the relationships that managers of both academic and non-academic staff form with
their staff and, in general, provide appropriate management development.
Pettigrew and Whipp (1991) identified four key environmental variables that were
handled differently by higher performing firms. The variables are: 1) environmental assessment;
2) leading change; 3) viewing human resources as both assets and liabilities; and 4) achieving
coherence. Successful management of all of these variables can be viewed as adopting a
problem-solving approach where high quality data and data analysis, along with open dialogue
are central.
The Leadership Theory
Views of leadership have changed radically over the years. The earliest leadership
research attempts to determine what makes one person a leader and another not a leader, and did
so by examining the supposedly inherent traits of known leaders. After the accumulation of
18
leadership traits became too large to manage or interpret, researchers focused on leadership
behavior, and what leaders do in their leadership capacities. The assumption was that leadership
was something almost any individual could accomplish if they attempted to learn how.
Studying leadership behavior is important because it can help improve the effective
utilization of human resources (Hersey & Blanchard, 1969); it can help in preventing resistance
to change, restriction of output, and labor disputes; and often, it can lead to a more efficient
organization. As such, the following leadership theories provide scholars with a vision and
introduce leadership behaviors that may assist deans and department chairs in better managing
different situations in the course of their work and in their interactions with others.
Trait Theories
Theories that investigate the personal characteristics of successful leaders are described
as trait theories. These theories consider the innate qualities or traits characteristic of good
leaders. Successful academic leaders have been described in terms of their personal attributes,
interpersonal abilities, and technical management skills. Personal attributes include humor,
courage, judgment, integrity, intelligence, persistence, work ethic, vision, and being opportunity
conscious; interpersonal abilities include being outgoing, team building, and compassionate.
Technical management skills include producing results, resolving conflicts, analyzing and
evaluating problems, ability to enhance the work environment, and goal oriented (Bensimon,
Neumann, & Birnbaum, 2000).
While the early emphasis on individual personality and talent is no longer viewed as the
sole determinants of a good leader, an appropriate combination of personal characteristics is seen

19
as an important contribution to effective leadership. Rowley (1997) said that the following
characteristics are generally viewed as being important:
• Intelligence, a desire to solve complex problems or discover patterns in events are
prevalent.
• Initiative, the ability to perceive the need for action and to do something about it; this
characteristic is often related to energy and stamina.
• Self-assurance, the self-confidence to believe in what they are doing; this characteristic
is related to he individual’s perception of their role in society and their aspirations for
themselves.
• The helicopter trait, a descriptive term for the ability to understand a situation at
different levels of detail.
Trait theory is important because it seeks a framework based on the qualities of
exceptional leaders in terms of personal characteristics. This framework can then be used to
identify potential leaders. However, trait theories give little consideration to the context in which
leadership is exercised (Rowley, 1997).
Power and Influence Theories
There are two types of power and influence theories: 1) theories that consider leadership
in terms of the influence or effects that leaders may have on their followers (social power theory
and transformational leadership theory); and 2) theories that consider leadership in terms of
mutual influence and reciprocal relationships between leaders and followers (social exchange
theory and transactional leadership theory).

20
Social power theory
From this perspective, effective leaders are those who can use their power to
influence the activities of others. The most likely sources of power for academic leaders
are expert and referent power over legitimate, coercive, or reward powers (Bensimon,
Neumann, & Birnbaum, 2000).
College presidents can exert influence over their campuses through charismatic
power. This particular perspective maintains that academic leaders can cultivate
charismatic power by remaining distant or remote from constituents, by attending to their
personal appearance and style, and by exhibiting self-confidence. To establish distance
and remoteness, presidents are counseled not to establish close relationships with faculty,
not to be overly visible, and to emphasize the importance of trappings of the office as
symbols of its elevated state. Style consists of presidential competence, attitude, speech,
dress, mannerisms, appearance, and personal habits (Bensimon, Neumann, & Birnbaum,
2000).
Social exchange theory and Transactional Theory
College and university presidents can accumulate and exert power by controlling
access to information, controlling the budgetary process, allocating resources to preferred
projects, and assessing major faculty and administrative appointments. On college
campuses, however, the presence of other sources of power, (i.e., the trustees’ power to
make policy and the faculty’s professional authority), seriously limits the president’s
discretionary control of organizational activities. For this reason, social exchange theory
is particularly useful for examining the principles of shared governance and consultation,

21
and the image of the president as first among equals, which under surrounds much of
the normative values of academic organizations. Transactional theory can be particularly
useful for understanding the interactions between leaders and followers (Bensimon,
Neumann, & Birnbaum, 2000).
Transformational Theory
Transformational Theory suggests that effective leaders create and promote a
desirable vision or image of the institution. Unlike goals, tasks, and agendas, which refer
to concrete and instrumental ends to be achieved, a vision refers to altered perceptions,
attitudes, and commitments. The transformational leader must encourage the college
community to accept a vision created by his or her symbolic actions (Bensimon,
Neumann, & Birnbaum, 2000).
Behavior Theories
Behavior theories examine whether the leader is task oriented (initiating structure) or
people oriented (consideration), or both. Blake and Mouton (1964) adapted their managerial grid
into an academic style and applied it to higher education. Their model suggests five styles of
academic administration: 1) care-taker, 2) authority-obedience, 3) comfortable-pleasant, 4)
constituency-centered, and 5) team oriented. The optimum style is identified as team
administration, which is characteristic of leaders who scored high on both concern for
institutional performance and concern for people (Bensimon, Neumann, & Birnbaum, 2000).
Some limited empirical tests of these theories have been performed. A study of
department chairs by Knight and Holen (1985) found that those considered effective by the
faculty scored high both in initiating structure (task) and consideration of people. Alternatively, a

22
case study of a single institution reports that department chairs with high faculty morale
scored high on measures of consideration of people and participative leadership style, but not
high in initiating structure (Madron, Craig, & Mendel, 1976).
Contingency Theories
From this perspective, effective leadership requires adapting one’s style of leadership to
situational factors. Vroom (1983) found that if these theories were used to determine the kind of
leader most appropriate to chair academic departments, each department would prescribe a
different type of leader. Situational variables in Fiedler’s (1967) contingency model and in
House’s (1971) path-goal theory prescribe a task-oriented leader who would do whatever is
necessary to help staff to achieve a desired goal.
Balancing work concerns and human concerns is difficult under ideal circumstances. Fred
Fiedler, who called these dimensions task-orientation and relationship-orientation, believed that
leaders would be able to focus on either one or the other, but not both simultaneously. Fiedler
saw task-orientation and relationship-orientation as two ends of a continuum, and believes it
logically impossible to be at both ends of the continuum. Fiedler’s research on contingency
theory ascertained that leaders who described their least preferred coworker in positive terms
were human relations oriented; whereas those who described the least preferred coworker in
negative terms were task-oriented (Mazzarella, 1983).
In contrast, Hersey and Blanchard’s life-cycle theory and the Vroom-Yetton decision
process theory identify individuals with a delegating and participative style of leadership. This
theory is based upon the ability of the leader or manager to diagnose the group environment or
situation with the purpose of adjusting the leadership style, the group situation, or possibly both.

23
An application of the Vroom-Yetton model to the study of decision-making among
department chairs concludes that they frequently chose autocratic styles of decision-making in
situations where a consultative style would have increased the likelihood of the faculty’s
acceptance of the decision (Bensimon, Neumann, & Birnbaum, 2000). Hersey and Blanchard’s
theory was used to develop a questionnaire that would help department chairs determine
departmental level of maturity and select a corresponding style of leadership (Tucker 1984).
Analyses of studies on the behavior of leaders by Dill (2000) suggested that when given a choice
of leadership roles, faculty members consistently preferred the leader to be a facilitator, or one
who solved problems and who sought to provide the resources necessary for the research
activities of faculty members.
In describing situational leadership theory, Hersey and Blanchard (1977) theorize that
there is a curvilinear relationship between task behavior (initiating structure) and maturity. More
accurately, as the leaders are able to assess the leadership situation with which they must deal,
the leaders should adjust their behavior or style to be compatible with the situation. As the
maturity of the group increases, the leader should reduce task directed behavior and increase
relationship behavior. Maturity is seen as the degree to which the group is able to increase their
level of aspirations and accomplishments. In the very mature state, a group essentially self-
actualizes and a leader operates with a high degree of delegation.
Generally, contingency theories have found their greatest applicability in the study of
leadership in academic departments, likely because decision-making at this level is less
equivocal than at higher levels of the academic organization (Bensimon, Neumann, & Birnbaum,
2000).

24
Cultural and Symbolic Theories
Occasionally, effective leaders give symbolic meaning to events that others may see as
perplexing, senseless, or chaotic. These leaders do so by focusing attention on aspects of college
life both familiar and meaningful to the college community. Leaders may play an important role
in creating and maintaining institutional sagas. The role of academic leaders in the preservation
of academic culture may be even more critical today than in the past, because increased
specification, professionalism, and complexity have weakened the values and beliefs that have
provided institutions with a common sense of purpose, commitment, and order. Although leaders
may not be able to change the current culture through management, their attention to social
integration and symbolic events may enable them to sustain and strengthen the culture that
already exists (Bensimon, Neumann, & Birnbaum, 2000).
Strategies of change that make sense to institutional members, and are therefore likely to
elicit acceptance and support may depend upon leaders’ understanding of an organization from
cultural perspectives. These leaders may be required to act as anthropologists uncovering the
organizational culture by seeking to identify metaphors embedded in the language of the college
community. Leaders may become more effective by using symbols that are consistent with the
institution’s culture (Bensimon, Neumann, & Birnbaum, 2000).
Cognitive Theories
Cognitive theories have important implications for perceptions of leaders’ effectiveness.
In many situations, presidential leadership may not have measurable outcomes other than social
attribution, or the tendency of campus constituents to assign to a president the credit or blame for
unusual institutional outcomes. From this perspective, leaders are individuals believed by
25
followers to be responsible for particular events. Leaders themselves, in the absence of clear
indicators, are subject to cognitive bias that can lead them to make predictable errors of judgment
and to over-estimate their effectiveness in campus improvements (Bensimon, Neumann, &
Birnbaum, 2000).
As a result, theories of leadership style are of much value to leaders attempting to
improve their performance in different organizations, particularly university deans and
department chairs. Leadership styles may vary according to the situations confronting deans and
department chairs. Department chairs applying leadership styles have numerous desired goals,
the most important of which are to raise motivation of faculty and staff, help them accept
changes, improve morale, diminish stress, reduce workload, increase innovations, and improve
human relations.
The leadership Studies Related to Deans and Department Chairs
The following section is reviews a number of studies pertaining to the leadership style of
deans and department chairs in higher education institutions.
The reputation of a university depends upon its departments and the scholars within them.
Previously, autonomy in the development of the departments was a necessity if the university
was to achieve a national reputation. Today, the university assesses itself and is assessed by the
quality of its departments; therefore, the departments possess the advantages of familiarity,
formal simplicity, and a clearly defined hierarchy of authority. A department provides a basis for
which faculty members can interact. A department as a unified group of faculty and staff can
operate effectively within the university organization. Academic departments form the basic unit

26
of the administrative structure with power to initiate most actions that affected the institution
(Dressel & Reichard, 1970).
The importance of the department in academic governance apparently increases as
universities become larger and more internally differentiated. The importance of an academic
department is defined by the value of the faculty and staffs in the department especially the chair
and their leadership behavior (Croson, J.J., 1960; Ryan, 1972).
Glaser and Smalley (1995) found that women are now uniquely equipped to contribute to
the new work climate because of their natural leadership tendencies. These characteristics
include: having a positive attitude, solid job knowledge, a personal touch, generosity, a sense of
direction, consistency, flexibility/ adaptability, open-mindedness, trustworthiness/ reliability,
firmness/ decisiveness, a sense of humor, strength/ confidence, visibility/ accessibility, and
ability to motivate.
The Wolverton, Gmelch, Wolverton, and Sarros’s (1999) study examined department
chair stress as a multi-dimensional construct with links to multiple variables between American
and Australian department chairs. They found that chairs in both countries were 50.5 years old
average, had been in their positions for approximately four years, and were tenured when they
assumed the position. Chair positions were held primarily by men with 17 % women in Australia
and 11 % in the United States. About 50 % of all chairs viewed themselves as achieving an equal
balance of being both a faculty member and an administrator. In Australia, 47 % of chairs
surveyed, and in the United States 43 % of chairs surveyed, considered themselves as academic
faculty exclusively and as administrators. In both Australia and the United States, fewer than 30%
of current chairs indicated that they would eventually seek a higher administrative position. In
Australia, the most dominant stress factor appeared to be the administrative relationship, which

27
accounted for 29.4% of the variance, followed by human relations 5.7%, administrative tasks
4.7%, academic role 3.6%, and external time 3.3%. In the United States, administrative task
stress appeared to be most important factor and accounted for 27% of the variances with
administrative relationships second 5.9%, human relations third 4.7%, academic role fourth 4.0%,
and external time fifth 3.6%.
In general, reviewed literature relating to academic department chair leadership style in
the United States showed the average chair to be 50 years old, white, male, tenured, and
possessing a Ph.D. (Gmelch & Miskin, 1995).
The research of Gmelch and Miskin (1993) defined three major challenges facing
department chairs. The first major challenge is to develop an understanding of and clarity about
the motives and roles of a department chair. The second major challenge is to understand the
strategic planning process for creating a productive department, a department with a vision, and
building a departmental mission statement. This statement would describe the long-term intent
and vision of the department and set the priorities for daily department endeavors and decision-
making processes. The third major challenge is to develop key leadership skills required for
being an effective department chair, which include managing time well and creatively reducing
stress.
According to results of the National Survey Center for the Study of the Department Chair
located at Washington State University (Gmlech & Miskin, 1993), chairs most frequently served
in their roles for personal development reasons (321 chairs surveyed or 60%). However, 251 or
46.8% of the chairs said they had been asked to serve by their college dean or colleagues. These
were the two most frequent reasons given for serving as department chair; the first reason
represents an intrinsic motivation to serve, and the latter is an extrinsic motivation to serve. In

28
response to the second question, 46% of the chairs surveyed indicated a willingness to serve
another term as chair, 30% said they would not, and 24% were undecided. Interestingly, those
who agreed to serve primarily for extrinsic reasons were the least willing to serve another term,
25%. In contrast, 75% of the intrinsically motivated chairs were willing to serve another term.
Academic department chairs are part of the administration of their institution in that they
occupy a unique role in higher education institutions. According to Tight (1992), department
chairs in the American higher education system possess less formal powers than deans, whereas
in Europe, the United Kingdom, and Australia it was the opposite. The educational systems are
converging and the constraints for department chairs and deans are largely similar and internal,
(e.g., tradition and values of academia, collegiality, length of term, and status of department
chairs).
Ryan’s (1972) study was based upon a comparative field study of fifteen academic
departments at Ohio State University, which were selected to represent the social sciences,
humanities, physical sciences, biological sciences, business, and education schools. The
departments classified into headships and collegial groupings. Headship organizations are
defined as those in which decisional power tended to be centralized. Committees were often
formed to advise the chairperson who ultimately made the final decision. Alternatively,
committees possessed decisional powers, but the chairperson selectively appointed the
committee members. Ten departments were found to be headship departments, and the
chairperson was perceived as being dominant. Collegial organizations were defined as those in
which decisions were made at a faculty meeting, as group committees were functional, and they
served as advisory to the total council or a committee of the whole. The chairperson was not seen

29
either as dominating committees or as making final decisions. Only five departments met
these criteria.
Bolton and Boyer’s (1973) study at University of Cincinnati explored a different
approach in a specific context: organization development in academic departments. Results of
the study indicated that helping departments improve their capabilities to address at their own
level the broad problem of developing educational plans, improving teaching effectiveness,
improving relationships between faculty and students was solved. Also, department heads
perform as the educational and managerial leader of the unit. It was important that the top
administrative units at the University of Cincinnati begin to understand and support the
organizational work of the departments. Improvement in communication, decision-making, and
problem solving abilities improve the quality of decisions made at the department level.
Furthermore, Knight and Holen’s (1985) study purpose was to ascertain whether
significant relationships exist between departmental leadership (defined as faculty’s perceptions
of their chairperson’s initiating structure and consideration) and faculty’s perceptions of the
quality of their chairperson’s performance of typical responsibilities. Also, the sample of the
Knight and Holen study was 458 department chairpersons and 5830 faculty members in 65
colleges and universities across the United States. The sample included 52 public and 13 private
academic institutions. To differentiate among levels of leadership, chairpersons were ranked
separately as high, medium, or low on initiating structure and consideration. The major results of
this study were that both initiating structure and consideration were found to be significant for all
but one performance item of the department chair. The one exception was consideration but was
not significant for whether or not the department chair facilitates obtaining grants and contracts
from external sources. Individuals who become chairs of academic departments seldom have
30
administrative backgrounds as might be assumed to be a prerequisite for the position. Also,
the combination of high initiating structure and high consideration is the most effective
leadership style.
To be successful leaders, Kouzes and Posner (1987) state that the five most common
leadership practices to employ are: challenge the process, inspire a shared vision, enable others
to act, model the way, and encourage the heart. Kouzes and Posner add that the majority of
people admire leaders who are honest, competent, forward looking, and inspiring. Teamwork is
essential for a productive organization, collaboration is needed to develop the commitment and
skills of employees, solve problems, and respond to environmental pressures.
Martin (1993) conducted a study of the roles and characteristics of individuals identified
as effective academic deans at public research universities. Effective leaders were found to be
identified by five areas of expertise: 1) they are cultural representatives of their colleges and
universities; 2) as communicators, they are continually striving for more efficient and more
inclusive communication structures, networks, and processes; 3) they are skilled managers; 4)
they are planners and analysts; and 5) they are advocates of the institution and cultivate
relationships with various groups and individuals on campus.
Cyphert and Ingersoll (1974) attempted to identify elements of the leadership strategies
of academic administrators by focusing on the role of the dean. Subjects in this study were
identified by virtue of being incumbent deans in specific university colleges or schools
considered as “high status,” “upwardly mobile,” or “low status” in the fields of arts and
sciences, business, education, engineering, law, medicine, and nursing. A total of 101 colleges or
schools were selected, and 75 participated. The findings revealed the following characteristics:

31
a) quality faculty, b) innovative instruction, c) the basic research function, d) student affairs, including strong admission policies and placement services, e) financial support …, and f) attention to modifying governance and administrative structure are all ingredients that administrators identify as crucial in high status schools; conversely, deans of low status schools do not rate these factors as significant characteristics of their operation (p. 359). In a study of 189 faculty members, 27 presidents, and 27 deans in a community college
setting, Cox (1974) found significant differences existed between the perceptions of faculty
members and presidents, as well as between the perceptions of presidents and deans concerning
the real and ideal descriptions relative to the initiating structure and consideration dimension of
leader behavior.
Several research efforts have dealt with the role and leadership behavior of department
chairs. Knox (1977) maintained that:
Leadership means dealing with people. In order to build rapport and a good working relationship with department members, the chair must try to understand their perceptions. With understanding comes a realization of the type of approach, which will work best in supervising and motivating the staff (p. 6).
Johnson (1976) studied the relationship between administrator’s roles and degree of
success. This study involved 41 department chairs and 282 faculty members of physical
education departments at colleges and universities in the United States. The researcher concluded
the following three characteristics were significant:
1) congruity of role perceptions between the administrator and faculty will lead to improved faculty perception of the administrator’s success at carrying out specific roles; 2) the more administrators feel that they are leaders, capable of assuming authority, the less successful they will be in the opinion of their faculty; and, 3) the administrator who is cheerful and who possesses an even disposition will be viewed as more successful by the faculty than administrators who do not possess such characteristics (pp 7-8). The research conducted by Hoyt and Spangler (1978) involved 103 department chairs and
1,333 faculty members at four large universities located in various regions of the United States.

32
In this study, the faculty members assessed the administrative effectiveness of their
department chairs. They also described the department chairs’ behavior. The results led to an
extraction of four administrative styles: 1) democratic practice; 2) structuring; 3) interpersonal
sensitivity; and 4) vigor. The researchers noted a highly significant relationship between the
ratings of administrative effectiveness and behavioral descriptions. Similarly, the four measures
of administrative style were significantly related to performance. Specifically, structuring and
interpersonal sensitivity were the best predictors of performance. Activities related to “Building
Department’s Reputation” were best predicted by vigor and democratic practice, while “Planning
and Development” effectiveness was predicted best by vigor, structuring and democratic
practices.
The study conducted by Toylyati (1981) focused on the expectations and perceptions of
deans, department chairs, faculty members, and students researching leadership behavior of
academic department chairs at 18 institutions in three states: Arkansas, Kansas, and Oklahoma.
A total of 39 deans, 51 department chairs, 174 faculty members, and 166 students participated in
this study. The researcher reported several findings and drew the following conclusions:
… that the academic department chairman is placed in a position where he encounters conflicting expectations in his relationships with group members … The academic department chairman is placed in a position where he encounters conflicting expectations in his relationship with faculty regarding the consideration dimension and with students regarding consideration and initiating structure dimensions… The academic chairman was placed in apposition where he encountered conflicting expectations in his relationship with the dean regarding the consideration dimension and with the students regarding the initiating structure dimension (pp. 88-90).
Often a department chair’s leadership effectiveness is judged by the virtues of how they
deal with various operations concerning personnel, curriculum, and so forth. However, such
leadership effectiveness may be hampered by the influence of interest groups, internal and/or
33
external. Whitson and Hubert (1982) examined the influences of interest groups as perceived
by department chairs in large public universities. A sample of 320 department chairs in 58 public
universities participated in Whitson and Hubert’s study. The findings of this study confirmed the
influence on university and departmental functioning, particularly for those interest groups and
individuals within the university itself. This observation may not only be critical to the operation
of the department, but also to the effective functioning of the institution.
Bennett (1983) observed that:
Department chairpersons are in the trenches of higher education. It is they who had the charge daily on the fields of institution and research. Unless their maneuvers on the field are successful, battles won elsewhere in the institution will not matter much (p. 52).
Thus, he foresaw the future roles of the department chair as an entrepreneur, a creative
custodian of standards, and as a politician.
Several other studies have examined the dimensions of leadership behavior of faculty
members in higher education institutions. Concerning the leadership behavior of faculty
members, some researchers believe that teachers are leaders or that leadership style is identical to
what has been called teaching style (Swanson, 1974), and that teacher behavior s identical to
leader behavior (Gibb, 1955). McBeath and Andrews (1960) indicated that teaching
effectiveness in the classroom is related to leadership qualities. For example, Swanson (1974)
maintained that teachers differ widely in their individual approaches to the learning process, that
these individual differences reflect differences in leadership style, and that each style can, in
turn, be related to productivity and improvement.
Senior level faculty in 28 public institutions of higher education in four states participated
in Brown’s study (1973). The findings of this work revealed a strong relationship between a
superior and the leadership of that superior; there was a stronger dislike of an authoritarian

34
leadership style than there was a preference for democratic styles. While the professors
preferred a subordinate-centered leadership style, they did not necessarily favor the most extreme
of the transactional style; the professors stated a preference for participative decision-making as
opposed to more authoritarian styles.
Mezoff (1978) claimed that there have been several parallels between the development of
general leadership theories and teacher as leader behavior theories. He noted that personality
characteristics of leaders and teachers were equally inconclusive. Reviewing several researchers,
Mezoff observed that some dimensions of effective teaching did not correspond to leadership
consideration and structure behaviors. Among those investigated dimensions were the teacher’s
ability to motivate students, the teacher’s professional involvement, punctuality and neatness, the
analytic/ synthetic approach, and the area of assignments and evaluation. Mezoff further
indicated that some aspects of leadership were unique and not usually found in teaching, for
example, the interdependence of subordinates, the factor of group cohesiveness, emergent
leadership, and clearly explicit group goals.
Viewing the college classroom as a leadership situation at San Antonio College, Jabs
(1982) applied the initiating structure to one group of 66 students, and consideration to another
group of 77 students. Jabs concluded the following:
Initiating structure or teacher centered instruction is more effective than consideration in the acquisition of factual knowledge or data learning, but consideration leadership is superior to initiating structure in the stimulation of personal development in the student (p. 20).
In validating the Fiedler’s contingency model of leadership, Hardy (1982) attempted to
determine whether task-centered and human relation-oriented classroom teachers exhibit
different classroom behavior. In his study, 14 full-time graduate students of education at a large
35
eastern university were observed in teaching situations by three trained observers. The study
produced several inconclusive findings and mixed results. However, Hardy did have different
observations. For example:
Since the low LPC [Least Preferred Co-worker] teacher is not as adept at improving leader-member-relations, these relations might not be as strong as in the high LPC teacher’s classroom (p. 16).
Because the dean and the department chair are responsible for managing multiple tasks
and groups, style of leadership, style adaptability, and methods to improve interaction with
others become important. Although several theories of leadership exist in terms of task versus
behavior, Hersey and Blanchard’s Situational Leadership Theory takes the quadrant leadership
model and expands upon it. A leader is effective only if they use the leadership style appropriate
for the readiness level of the group. Therefore, a dean or department chair will only be effective
if the appropriate leadership style is employed for the level of their college or department.
The study that follows investigates the leadership styles and style adaptability of deans
and department chairs at three Public Doctoral Research Universities-Extensive through the
application of Hersey and Blanchard’s (1996) Situational Leadership Theory.

36
CHAPTER THREE
METHODOLOGY AND RESEARCH DESIGN
The purpose of this study was to identify leadership styles and style adaptability of deans
and department chairs as perceived by them at three Public Doctoral Research Universities-
Extensive, as defined by the Leadership Effectiveness and Adaptability Description (LEAD) Self
Instrument (Appendix A).
The Population and Sample of the Study
A selection of current deans and department chairs came from three universities located
in the northwest region of the United States, Washington, Idaho, and Oregon and classified as
Public Doctoral Research Universities-Extensive (Carnegie Commission on Higher Education,
2000). The sample from the population was taken as a purposive trial. A total of 100 survey
packages were mailed and 84 responses were received (21 deans and 63 department chairs), for
an 84% response rate. To represent a broad range of disciplines, eight deans of colleges were
chosen from each of the three universities that participated in this study. Once the university
deans’ were selected, three department chairs from eight colleges in each university were
selected randomly to receive questionnaires. If the college had less than three departments, an
additional department from within the same category was chosen.
Design of the Study
This study was quantitative and of descriptive research design to investigate the
leadership styles and style adaptability of deans and department chairs as perceived by them at
three Public Doctoral Research Universities-Extensive. The study compared leadership styles in
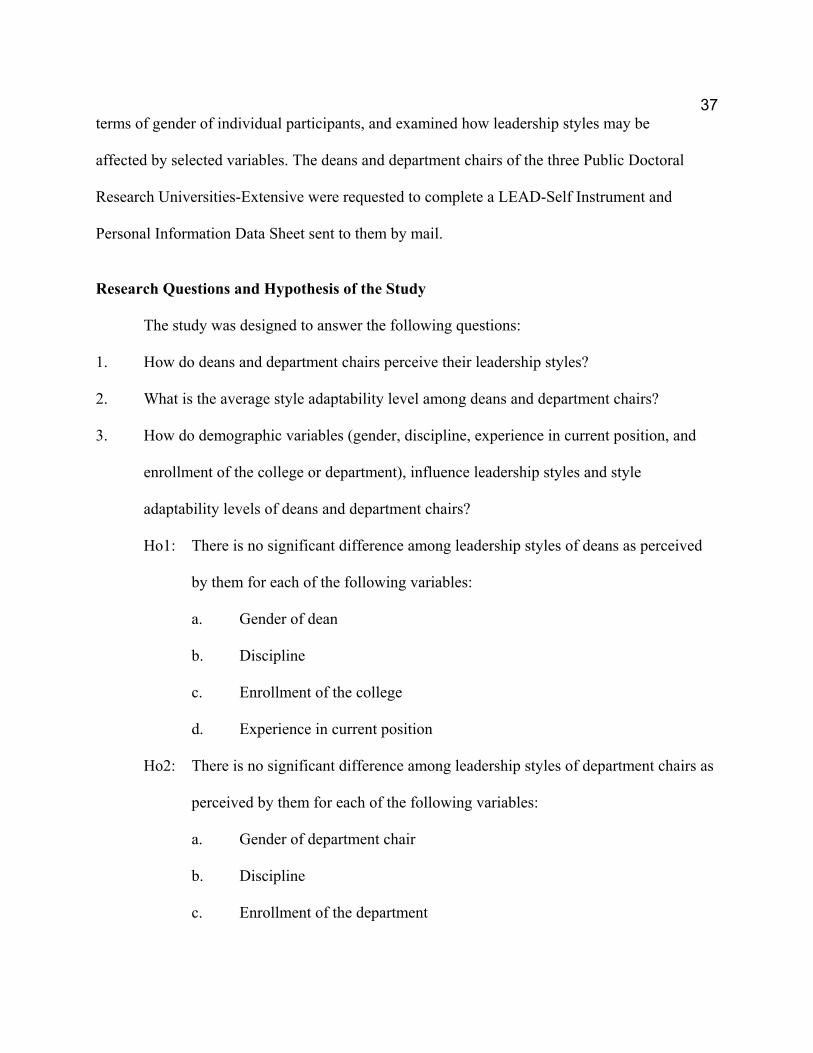
37
terms of gender of individual participants, and examined how leadership styles may be
affected by selected variables. The deans and department chairs of the three Public Doctoral
Research Universities-Extensive were requested to complete a LEAD-Self Instrument and
Personal Information Data Sheet sent to them by mail.
Research Questions and Hypothesis of the Study
The study was designed to answer the following questions:
1. How do deans and department chairs perceive their leadership styles?
2. What is the average style adaptability level among deans and department chairs?
3. How do demographic variables (gender, discipline, experience in current position, and
enrollment of the college or department), influence leadership styles and style
adaptability levels of deans and department chairs?
Ho1: There is no significant difference among leadership styles of deans as perceived
by them for each of the following variables:
a. Gender of dean
b. Discipline
c. Enrollment of the college
d. Experience in current position
Ho2: There is no significant difference among leadership styles of department chairs as
perceived by them for each of the following variables:
a. Gender of department chair
b. Discipline
c. Enrollment of the department

38
d. Experience in current position
Ho3: There is no significant difference among style adaptability levels of deans as
perceived by them for each of the following variables:
a. Gender of dean
b. Discipline
c. Enrollment of the college
d. Experience in current position
Ho4: There is no significant difference among style adaptability levels of department
chairs as perceived by them for each of the following variables:
a. Gender of department chair
b. Discipline
c. Enrollment of the department
d. Experience in current position
Instrumentation
Data were collected using two instruments: the Leadership Effectiveness and
Adaptability Description (LEAD)-Self Instrument (Appendix A) and the Personal Information
Data Sheet (Appendix B). LEAD-Self, introduced in 1974 by Hersey, Blanchard, and Johnson
(1996), was the primary data collection instrument. The LEAD-Self Instrument accumulates and
analyzes self-perceptions of a leader’s effectiveness and adaptability..
The LEAD-Self Instrument was used in this study to evaluate behaviors displayed by
deans and department chairs, as they perceive themselves. The LEAD-Self yielded four style
scores and one normative adaptability score from 12 management situational questions.

39
Permission to use the LEAD-Self Instrument was granted by its developers, and the
instrument was purchased from The Center for Leadership Studies in Escondido, California.
In addition to the LEAD-Self instrument, a demographic survey instrument called the
Personal Information Data Sheet (Appendix B) was included in the survey packet to help
determine appropriate factors relating to the subject’s gender, years in current position,
enrollment of the college and department, and any other data relevant or pertinent to the study.
The LEAD-Self Instrument consists of 12 management situations and four possible
leadership style responses for each: 1) a high task–low relationship behavior; 2) a high task–high
relationship behavior; 3) a high relationship–low task behavior; and 4) a low relationship–low
task behavior. The respondent selects the answer that most closely matches how they think they
would typically respond in a given situation.
The LEAD-Self Instrument is designed to measure self-perceptions of three dimensions
of leadership behavior: 1) style; 2) style range; and 3) style adaptability. Style and style range are
indicated by scores in four quadrants of the situational leadership model: quadrant 1, high task
and low relationship behavior; quadrant 2, high task and high relationship behavior; quadrant 3,
high relationship and low task behavior; and quadrant 4, low relationship and low task behavior.
The dominant leadership style of a respondent is defined as the quadrant with the most responses
on the LEAD-Self Instrument; the minimum to maximum score range for each quadrant is 0-12.
A respondent’s supporting style (or styles) is defined as a style they might apply on occasion. At
least two responses in a quadrant are required for a style to be considered a supporting style.
The degree to which an individual’s leadership behaviors are appropriate to the demands
of a given situation is known as style adaptability. Hersey, Blanchard, and Johnson (1996) make
an important distinction between style adaptability and style range:

40
Leaders with style adaptability can make whatever style (or styles) they use fit a given situation. People who have a narrow range can be effective over a long period of time if they remain in situations in which their style has a high probability of success, but they cannot be said to have style adaptability. Conversely, people who have a wide range of styles may be ineffective if they use a style that is not appropriate for the demands of the situation. These people, too, cannot be said to have style adaptability. Thus, a wide style range will not guarantee effectiveness; style range is not as relevant to effectiveness as style adaptability (p. 300).
Hersey and Blanchard developed a scoring procedure for style adaptability (Appendix D)
that is based on theoretical principles and empirical research from the behavioral sciences. For
each of the 12 situations presented in the LEAD-Self Instrument, the leadership behavior with
the highest probability of success is scored a 3 and the least appropriate is scored a 0. Thus, style
adaptability scores range from 0 (i.e., the highly unlikely instance in which a respondent’s
leadership behaviors are by no means appropriate for a given situation) to 36 (i.e., the
respondent’s leadership behaviors are maximally appropriate), with scores below 23 representing
an ineffective ability to vary style according to leadership situations, and scores above 30
representing an effective ability to vary style according to the situation (Center for Leadership
Studies, 2002).
The stability of the LEAD-Self Instrument, according to Greene (1980), is moderately
strong. For example, in two administrations separated by a six-week interval, 75 percent of
managers maintained their dominant style, and 71 percent maintained their supporting styles.
Pre- and post- correlations for both the dominant and supporting styles were .71, and each was
significant (p< .01) (Greene, 1980).
41
Validity of the Study
The results of this study as a quantitative research method can be generalized to the
population of the study, with consideration given to the situations presented in the study and the
individual characteristics of the participants.
Data Collection
A survey packet was mailed to the 24 deans and 76 department chairs at three Public
Doctoral Research Universities-Extensive in the northwest region of the United States, more
specifically Washington, Idaho, and Oregon. In addition to a pre-addressed return envelope, a
cover letter was enclosed in each packet explaining the purpose of the study with appropriate
instructions concerning completion of the survey. Each instrument was coded for tracking and
follow-up purposes. To insure optimal participation in the study, subsequent and strategically
planned contact was made with desired participants who did not return the survey package within
a specified time. Two weeks after the original mailing, follow-up emails were sent to non-
responding recipients requesting their help in completing the study. Two weeks later, a new
survey packet was sent to the still non-responding recipients.
Data Analysis
The data accumulated from the research instrument were scored, analyzed, and
statistically evaluated as they related to the research questions of this study. A two-tailed t-test
was used to determine any differences on the mean scores of leadership styles and style
adaptability of deans and department chairs.
An analysis of the variance comparing leadership mean scores for each of the
demographic variables was used to test whether there was a significant difference between

42
leadership styles and style adaptability levels among deans and department chairs as perceived
by them for each of the following factors:
a. Gender of dean or department chair
b. Discipline
c. Enrollment of the college or department
d. Experience in current position
Quantitative descriptive statistics were used to find the prevalent leadership style among all
deans and department chairs at the Public Doctoral Research Universities-Extensive surveyed.
Mean scores were used to find the average style adaptability level among all deans and
department chairs at the Public Doctoral Research Universities-Extensive surveyed.
43
CHAPTER FOUR
RESULTS
The data collected for this study were analyzed by using Statistical Package for Social
Sciences (SPSS) software to investigate the leadership styles and style adaptability of deans and
department chairs as perceived by them at three Public Doctoral Research Universities-Extensive
(Carnegie Commission on Higher Education, 2000).
The data analysis were conducted to determine if there were differences in scores within
the subscales of the perceived Leadership Effectiveness Adaptability Description (LEAD)-Self
Instrument at a significant level of .05. The LEAD-Self Instrument was introduced in 1974 by
Hersey, Blanchard, and Johnson (1996) and provides self-perceptions of a leader’s effectiveness
and adaptability. The LEAD-Self Instrument consists of 12 management situations and four
possible leader responses for each situation that were: 1) a high task, low relationship behavior;
2) a high task, high relationship behavior; 3) a low task, high relationship; and 4) a low task, low
relationship behavior. The respondent selects the item that most closely approximates how they
would typically respond in a given managerial situation. Two-tailed t-test statistical analysis was
used to assess whether significant differences exist when compared the mean of scores of deans
and department chairs.
The breakdown of respondents (deans and department chairs) with regard to their gender,
discipline, enrollment, and experience follows in Table 1.
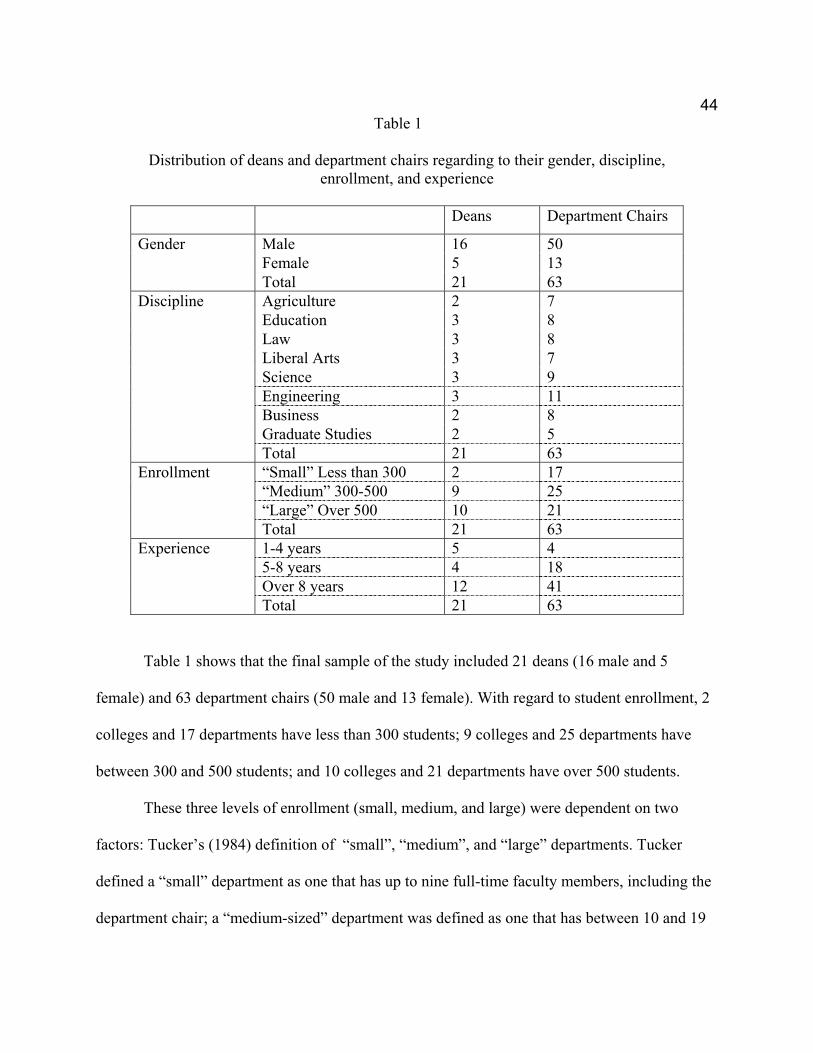
44
Table 1
Distribution of deans and department chairs regarding to their gender, discipline, enrollment, and experience
Deans Department Chairs
Male 16 50 Female 5 13
Gender
Total 21 63 Agriculture 2 7 Education 3 8 Law 3 8 Liberal Arts 3 7 Science 3 9 Engineering 3 11 Business 2 8 Graduate Studies 2 5
Discipline
Total 21 63 “Small” Less than 300 2 17 “Medium” 300-500 9 25 “Large” Over 500 10 21
Enrollment
Total 21 63 1-4 years 5 4 5-8 years 4 18 Over 8 years 12 41
Experience
Total 21 63
Table 1 shows that the final sample of the study included 21 deans (16 male and 5
female) and 63 department chairs (50 male and 13 female). With regard to student enrollment, 2
colleges and 17 departments have less than 300 students; 9 colleges and 25 departments have
between 300 and 500 students; and 10 colleges and 21 departments have over 500 students.
These three levels of enrollment (small, medium, and large) were dependent on two
factors: Tucker’s (1984) definition of “small”, “medium”, and “large” departments. Tucker
defined a “small” department as one that has up to nine full-time faculty members, including the
department chair; a “medium-sized” department was defined as one that has between 10 and 19

45
full-time faculty members; and a ”large” department was defined as having 20 or more full-
time faculty members; and second factor is the faculty-student ratio at the three doctoral
comprehensive public universities that participated in this study was 1:25. Depending on these
two factors, enrollment in a “small” department was 225 students (less than 300), enrollment in a
“large” department was 500 students or more, and enrollment in a “medium” department was
between 300 and 500.
According to experience in their current position, 5 deans and 4 department chairs have
less than 4 years of experience, 4 deans and 18 chairs have 5 to 8 years of experience each, and
12 deans and 41 chairs have over 8 years of experience each.
Leadership Styles
Leadership styles of deans and department chairs are revealed through answering
question one of this study: How do deans and department chairs perceive their leadership styles?
Table 2 shows the results from the LEAD-Self survey responses that were analyzed to
identify the deans’ and department chairs’ primary leadership styles from among the four
situational leadership styles: 1) telling – high task/low relationship behavior; 2) selling – high
task/high relationship behavior; 3) participating – low task/high relationship behavior; and 4)
delegating – low task/low relationship behavior. Both deans and department chairs selected
selling (high task/ high relationship) as their primary leadership style with mean scores on this
dimension of 5.57 and 5.63, respectively. Additionally, both groups ranked participating as their
secondary leadership style. While deans ranked the remaining styles as telling and delegating,
department chairs ranked the remaining as delegating and telling.

46
Table 2
Means and Standard Deviations for Deans’ and Department Chairs’ LEAD-Self Quadrant Scores
Deans
(N = 21) Department chairs
(N = 63)
Mean S.D. Mean S.D. Quadrant 1, high task and low relationship behavior (telling)
0.81 0.68 1.02 1.01
Quadrant 2, high task and high relationship behavior (selling)
5.57 1.29 5.63 1.47
Quadrant 3, low task and high relationship behavior (participating)
5.24 1.09 4.19 1.52
Quadrant 4, low task and low relationship behavior (delegating)
0.38 0.50 1.16 1.23
Table 3 shows the results of a two-tailed t-test for equality of means to see if there were
any significant differences between the deans’ and department chairs’ LEAD-Self quadrant
scores. The results show significant differences exist between the two groups in participating
and delegating as revealed by the LEAD-Self quadrant scores.
For participating style, the deans were (M = 5.24 ± 1.09) and the department chairs were
(M = 4.19 ± 1.52), t(82) = 2.909, p = .005; and for delegating style the deans were (M = .38 ±
.50) and the department chairs were (M = 1.16 ± 1.23), t(82) = -2.804, p = .006. Thus, the deans
had significantly higher scores for a participating style, while the department chairs had
significantly higher scores for a delegating style.
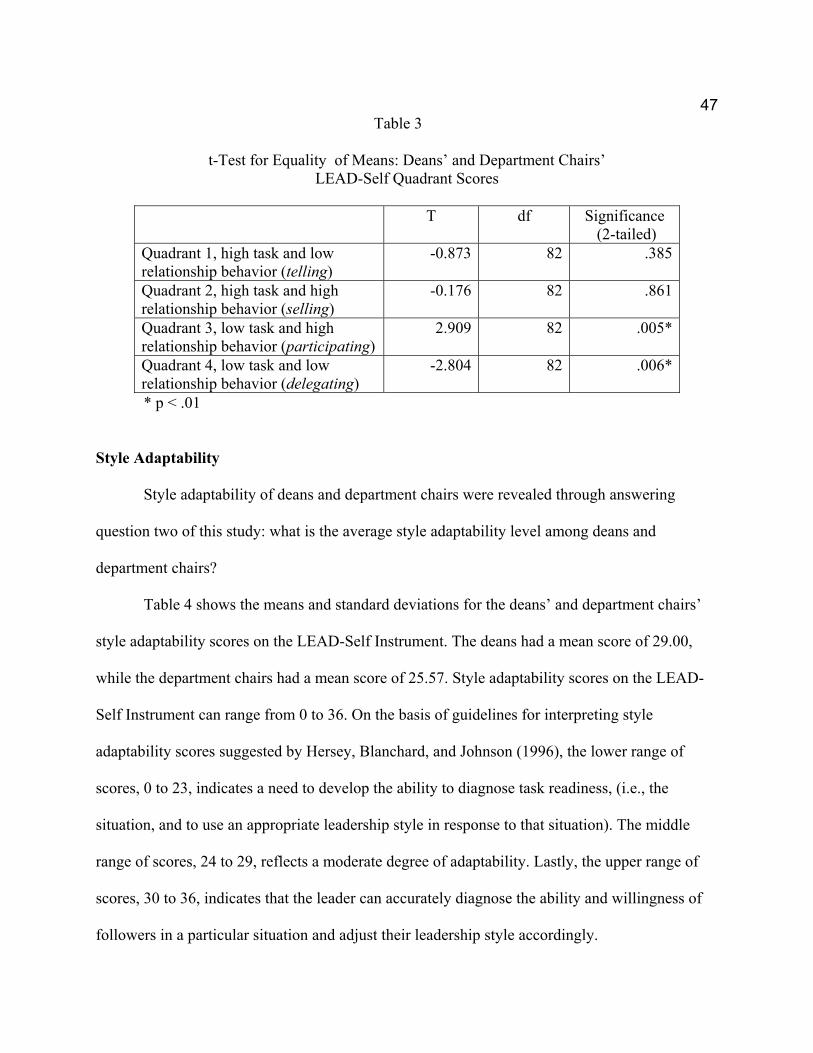
47
Table 3
t-Test for Equality of Means: Deans’ and Department Chairs’ LEAD-Self Quadrant Scores
T df Significance
(2-tailed) Quadrant 1, high task and low relationship behavior (telling)
-0.873 82 .385
Quadrant 2, high task and high relationship behavior (selling)
-0.176 82 .861
Quadrant 3, low task and high relationship behavior (participating)
2.909 82 .005*
Quadrant 4, low task and low relationship behavior (delegating)
-2.804 82 .006*
* p < .01 Style Adaptability
Style adaptability of deans and department chairs were revealed through answering
question two of this study: what is the average style adaptability level among deans and
department chairs?
Table 4 shows the means and standard deviations for the deans’ and department chairs’
style adaptability scores on the LEAD-Self Instrument. The deans had a mean score of 29.00,
while the department chairs had a mean score of 25.57. Style adaptability scores on the LEAD-
Self Instrument can range from 0 to 36. On the basis of guidelines for interpreting style
adaptability scores suggested by Hersey, Blanchard, and Johnson (1996), the lower range of
scores, 0 to 23, indicates a need to develop the ability to diagnose task readiness, (i.e., the
situation, and to use an appropriate leadership style in response to that situation). The middle
range of scores, 24 to 29, reflects a moderate degree of adaptability. Lastly, the upper range of
scores, 30 to 36, indicates that the leader can accurately diagnose the ability and willingness of
followers in a particular situation and adjust their leadership style accordingly.

48
With the preceding guidelines for interpreting the style adaptability scores on the
LEAD-Self Instrument, it appears that, overall, the deans are in the middle range of scores, yet
very close to the upper range. The department chairs, on the other hand, are in the middle range
of scores.
Table 4
Means and Standard Deviations for the Deans’ and Department Chairs’ Style Adaptability Scores on the LEAD-Self
Deans
(N = 21) Department chairs
(N = 63)
Mean S.D. Mean S.D. Style Adaptability (Range: 0 to 36)
29.00 2.10 25.57 2.76
Table 5 shows the results of a two-tailed t-test for equality of means to determine whether
there was a significant difference between the deans’ and department chairs’ style adaptability
scores on the LEAD-Self Instrument. The results show significant differences between the
deans’ (M = 29.00 ± 2.10) and department chairs’ (M = 25.57 ± 2.76), t(82) = 5.200, p = .000
style adaptability scores on the LEAD-Self instrument. Thus, the deans had significantly higher
scores for style adaptability than the department chairs.
Table 5
t-Test for Equality of Means: Deans’ and Department Chairs’
Style Adaptability Scores on the LEAD-Self
T df Significance (2-tailed) Style Adaptability (Range: 0 to 36)
5.200 82 .000*
* p<.01

49
Leadership Styles and Demographic Variables
Leadership styles and demographic variables of deans and department chairs are revealed
through answering null hypotheses, one and two of question three. Question three was: How do
demographic variables (gender, discipline, experience in current position, and enrollment of the
college or department), influence leadership styles and style adaptability levels of deans and
department chairs?
Leadership Styles and Demographic Variables: Deans
Ho1: There is no significant difference among leadership styles of deans as perceived by them
for each of the following variables:
a. Gender of dean
b. Discipline
c. Enrollment of the college
d. Experience in current position
Means and standard deviations, and a one-way analysis of variance were used to test
these variables. Means and standard deviations for deans, both male and female, are presented in
Table 6, and the ANOVA Summary data are presented in Table 7. The result of the study fails to
reject part “a” of null hypothesis Number 1; there is insufficient evidence to show that a
significant difference exists between the leadership styles among male and female deans.

50
Table 6
Means and Standard Deviations for the Deans (male, female) on LEAD-Self Quadrant Scores
Male
(N = 16) Female (N = 5)
Mean S.D. Mean S.D. Quadrant 1, high task and low relationship behavior (telling)
0.69 0.70 1.20 .45
Quadrant 2, high task and high relationship behavior (selling)
5.81 1.11 4.80 1.64
Quadrant 3, low task and high relationship behavior (participating)
5.19 0.83 5.40 1.82
Quadrant 4, low task and low relationship behavior (delegating)
.32 .48 .60 .55
Table 7
ANOVA Summary Table for the Deans’ Gender (male, female) on LEAD-Self Quadrant Scores
Sum of
Squares df Mean
Square F Sig.
Between Groups 1.001 1 1.001 2.308 .145Within Groups 8.238 19 .434
Quadrant 1, high task and low relationship behavior (telling) Total 9.238 20
Between Groups 3.905 1 3.905 2.538 .128Within Groups 29.238 19 1.539
Quadrant 2, high task and high relationship behavior (selling) Total 33.143 20
Between Groups .172 1 .172 .138 .714Within Groups 23.638 19 1.244
Quadrant 3, low task and high relationship behavior (participating) Total 23.810 20
Between Groups .315 1 .315 1.290 .270Within Groups 4.637 19 .244
Quadrant 4, low task and low relationship behavior (delegating) Total 4.952 20
Regarding discipline, means and standard deviations are presented in Table 8 and the
ANOVA Summary data were presented in Table 9. The results of the study reject part “b” of null
hypothesis Number 1; a significant difference exists between delegating leadership style among
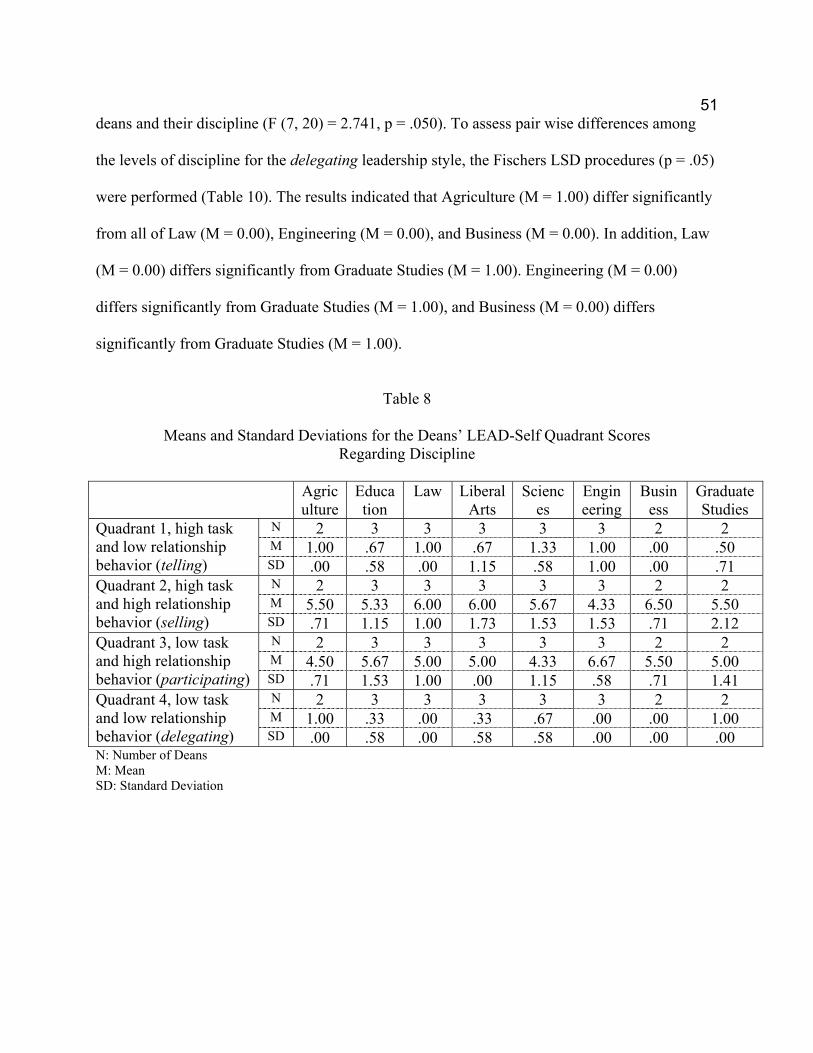
51
deans and their discipline (F (7, 20) = 2.741, p = .050). To assess pair wise differences among
the levels of discipline for the delegating leadership style, the Fischers LSD procedures (p = .05)
were performed (Table 10). The results indicated that Agriculture (M = 1.00) differ significantly
from all of Law (M = 0.00), Engineering (M = 0.00), and Business (M = 0.00). In addition, Law
(M = 0.00) differs significantly from Graduate Studies (M = 1.00). Engineering (M = 0.00)
differs significantly from Graduate Studies (M = 1.00), and Business (M = 0.00) differs
significantly from Graduate Studies (M = 1.00).
Table 8
Means and Standard Deviations for the Deans’ LEAD-Self Quadrant Scores
Regarding Discipline
Agriculture
Education
Law Liberal Arts
Sciences
Engineering
Business
Graduate Studies
N 2 3 3 3 3 3 2 2 M 1.00 .67 1.00 .67 1.33 1.00 .00 .50
Quadrant 1, high task and low relationship behavior (telling) SD .00 .58 .00 1.15 .58 1.00 .00 .71
N 2 3 3 3 3 3 2 2 M 5.50 5.33 6.00 6.00 5.67 4.33 6.50 5.50
Quadrant 2, high task and high relationship behavior (selling) SD .71 1.15 1.00 1.73 1.53 1.53 .71 2.12
N 2 3 3 3 3 3 2 2 M 4.50 5.67 5.00 5.00 4.33 6.67 5.50 5.00
Quadrant 3, low task and high relationship behavior (participating) SD .71 1.53 1.00 .00 1.15 .58 .71 1.41
N 2 3 3 3 3 3 2 2 M 1.00 .33 .00 .33 .67 .00 .00 1.00
Quadrant 4, low task and low relationship behavior (delegating) SD .00 .58 .00 .58 .58 .00 .00 .00 N: Number of Deans M: Mean SD: Standard Deviation

52
Table 9
ANOVA Summary Table for the Deans’ Discipline on LEAD-Self Quadrant Scores
Sum of Squares
df Mean Square
F Sig.
Between Groups 2.738 7 .391 .782 .614Within Groups 6.500 13 .500
Quadrant 1, high task and low relationship behavior (telling) Total 9.238 20
Between Groups 7.643 7 1.092 .557 .778Within Groups 25.500 13 1.962
Quadrant 2, high task and high relationship behavior (selling) Total 33.143 20
Between Groups 10.810 7 1.544 1.544 .237Within Groups 13.000 13 1.000
Quadrant 3, low task and high relationship behavior (participating) Total 23.810 20
Between Groups 2.952 7 .422 2.741 .050*Within Groups 2.000 13 .154
Quadrant 4, low task and low relationship behavior (delegating) Total 4.952 20
* p< .05
Table 10
Fischers LSD Multiple Comparisons for the Deans’ LEAD-Self Quadrant Scores (Delegating) Regarding Their Discipline
Disciplines Agriculture
Education
Law Liberal Arts
Sciences Engineering
Business Graduate Studies
Agriculture - .085 .015* .085 .369 .015* .024* 1.00 Education .085 - .317 1.00 .317 .317 .369 .085 Law .015* .317 - .317 .058 1.00 1.00 .015* Liberal Arts .085 1.00 .317 - .317 .317 .369 .085 Sciences .369 .317 .058 .317 - .058 .085 .369 Engineering .015* .317 1.00 .317 .058 - 1.00 .015* Business .024* .369 1.00 .369 .085 1.00 - .024* Graduate Studies 1.00 .085 .015* .085 .369 .015* .024* - * p< .05
Regarding enrollment for the deans’ colleges, means and standard deviations are
presented in Table 11 and the ANOVA Summary data are presented in Table 12. The results of
the study fail to reject part “c” of null hypothesis number 1; there is insufficient evidence to

53
show that a significant difference exists between the leadership styles among deans based
upon enrollment of their colleges.
Table 11
Means and Standard Deviations for the Deans’ LEAD-Self Quadrant Scores Regarding Enrollment
“Small” less 300
“Medium” 300-500
“Large” more 500
N 2 9 10 M .50 .67 1.00
Quadrant 1, high task and low relationship behavior (telling)
SD .71 .50 .82 N 2 9 10 M 6.50 5.56 5.40
Quadrant 2, high task and high relationship behavior (selling)
SD .71 1.13 1.51 N 2 9 10 M 4.50 5.44 5.20
Quadrant 3, low task and high relationship behavior (participating)
SD .71 1.01 1.23 N 2 9 10 M .50 .33 .40
Quadrant 4, low task and low relationship behavior (delegating)
SD .71 .50 .52 N: Number of Deans M: Mean SD: Standard Deviation
Table 12
ANOVA Summary Table for the Deans’ LEAD-Self Quadrant Scores
Regarding Enrollment
Sum of Squares
df Mean Square
F Sig.
Between Groups .738 2 .369 .782 .473Within Groups 8.500 18 .472
Quadrant 1, high task and low relationship behavior (telling) Total 9.238 20
Between Groups 2.021 2 1.010 .584 .568Within Groups 31.122 18 1.729
Quadrant 2, high task and high relationship behavior (selling) Total 33.143 20
Between Groups 1.487 2 .744 .600 .560Within Groups 22.322 18 1.240
Quadrant 3, low task and high relationship behavior (participating) Total 23.810 20
Between Groups 5.238E-02 2 2.619E-02 .096 .909Within Groups 4.900 18 .272
Quadrant 4, low task and low relationship behavior (delegating) Total 4.952 20

54
Regarding deans’ experience in their current positions, means and standard deviations
are presented in Table 13 and the ANOVA Summary data are presented in Table 14. The results
of the study fail to reject part “d” of null hypothesis number 1; there is insufficient evidence to
show that a significant difference exists between the leadership styles among deans and their
experience in their current position.
Table 13
Means and Standard Deviations for the Deans’ LEAD-Self Quadrant Scores
Regarding Experience in Their Current Position
1-4 years 5-8 years Over 8 years N 5 4 12 M .60 .50 1.00
Quadrant 1, high task and low relationship behavior (telling)
SD .55 .58 .74 N 5 4 12 M 6.00 6.50 5.08
Quadrant 2, high task and high relationship behavior (selling)
SD 1.22 .58 1.31 N 5 4 12 M 4.80 5.00 5.50
Quadrant 3, low task and high relationship behavior (participating)
SD 1.30 .82 1.09 N 5 4 12 M .60 .00 .42
Quadrant 4, low task and low relationship behavior (delegating)
SD .55 .00 .51 N: Number of Deans M: Mean SD: Standard Deviation

55
Table 14
ANOVA Summary for the Deans’ LEAD-Self Quadrant Scores Regarding Experience in Their Current Position
Sum of
Squares df Mean
Square F Sig.
Between Groups 1.038 2 .519 1.139 .342Within Groups 8.200 18 .456
Quadrant 1, high task and low relationship behavior (telling) Total 9.238 20
Between Groups 7.226 2 3.613 2.509 .109Within Groups 25.917 18 1.440
Quadrant 2, high task and high relationship behavior (selling) Total 33.143 20
Between Groups 2.010 2 1.005 .830 .452Within Groups 21.800 18 1.211
Quadrant 3, low task and high relationship behavior (participating) Total 23.810 20
Between Groups .836 2 .418 1.827 .189Within Groups 4.117 18 .229
Quadrant 4, low task and low relationship behavior (delegating) Total 4.952 20
Leadership Styles and Demographic Variables: Department Chairs
Ho2: There is no significant difference among leadership styles of department chairs as
perceived by them for each of the following variables:
a. Gender of department chair
b. Discipline
c. Enrollment of the department
d. Experience in current position
Regarding gender, means and standard deviations are presented in Table 15 and the
ANOVA Summary data is presented in Table 16. Part “a” of null hypothesis number 2 is
rejected; a significant difference exists between the leadership styles of male and female
department chairs in telling (F (1, 62) = 11.645, p = .001), participating (F (1, 62) = 7.216, p =
.009), and delegating (F (1, 62) = 5.618, p = .021). The results indicated that male department

56
chairs differ significantly from women department chairs in telling (M = 1.22 for men, M =
0.23 for women), and delegating (M = 1.34 for men, M= 0.46 for women). However, women
differ significantly from men in participating (M = 5.15 for women, M = 3.94 for men).
Table 15
Means and Standard Deviations for the Department Chairs’ (male, female) on LEAD-Self Quadrant Scores
Male (N = 50)
Female (N = 13)
Mean S.D. Mean S.D. Quadrant 1, high task and low relationship behavior (telling)
1.22 1.02 0.23 0.44
Quadrant 2, high task and high relationship behavior (selling)
5.50 1.49 6.15 1.34
Quadrant 3, low task and high relationship behavior (participating)
3.94 1.50 5.15 1.21
Quadrant 4, low task and low relationship behavior (delegating)
1.34 1.30 .46 .52
Table 16
ANOVA Summary Table for the Department Chairs’ Gender (male, female) on
LEAD-Self Quadrant Scores
Sum of Squares
df Mean Square
F Sig.
Between Groups 10.096 1 10.096 11.645 .001*Within Groups 52.888 61 .867
Quadrant 1, high task and low relationship behavior (telling) Total 62.984 62
Between Groups 4.411 1 4.411 2.067 .156Within Groups 130.192 61 2.134
Quadrant 2, high task and high relationship behavior (selling) Total 134.603 62
Between Groups 15.202 1 15.202 7.216 .009*Within Groups 128.512 61 2.107
Quadrant 3, low task and high relationship behavior (participating) Total 143.714 62
Between Groups 7.962 1 7.962 5.618 .021*Within Groups 86.451 61 1.417
Quadrant 4, low task and low relationship behavior (delegating) Total 94.413 62
* P< .05

57
Regarding discipline, means and standard deviations are presented in Table 17 and the
ANOVA Summary data is presented in Table 18. The results of the study reject part “b” of null
hypothesis number 2; a significant difference exists between the leadership styles selling (F (7,
62) = 2.89, p = .012), participating (F (7, 62)= 4.581, p = .000) and delegating (F (7, 62) =
3.527, p = .003) among department chairs based upon their discipline. To assess pair wise
differences among the levels of discipline for the selling, participating, and delegating leadership
styles, the Fischers’ LSD procedures (p = .05) were performed.
Table 17
Means and Standard Deviations for the Department Chairs’ LEAD-Self Quadrant
Scores Regarding Discipline
Agriculture
Education
Law Liberal Arts
Sciences
Engineering
Business
Graduate Studies
N 7 8 8 7 9 11 8 5 M 1.29 .63 .88 1.00 1.22 1.27 .75 1.00
Quadrant 1, high task and low relationship behavior (telling) SD .95 .52 .64 1.00 .97 1.19 1.16 1.73
N 7 8 8 7 9 11 8 5 M 5.86 5.63 5.13 6.14 4.00 6.18 6.25 6.20
Quadrant 2, high task and high relationship behavior (selling) SD .69 1.41 .99 1.35 1.41 1.54 1.67 1.10
N 7 8 8 7 9 11 8 5 M 4.43 5.50 3.75 4.43 5.33 2.73 3.88 3.80
Quadrant 3, low task and high relationship behavior (participating) SD .53 1.51 2.12 1.13 1.22 1.10 .83 1.10
N 7 8 8 7 9 11 8 5 M .43 .25 2.25 .43 1.44 1.82 1.13 1.00
Quadrant 4, low task and low relationship behavior (delegating) SD .53 .46 1.91 .53 1.24 .98 1.36 .00 N: Number of Department Chairs M: Mean SD: Standard Deviation

58
Table 18
ANOVA Summary Table for the Department Chairs’ Discipline LEAD-Self Quadrant Scores
Sum of Squares
df Mean Square
F Sig.
Between Groups 3.568 7 .510 .472 .851Within Groups 59.416 55 1.080
Quadrant 1, high task and low relationship behavior (telling) Total 62.984 62
Between Groups 36.203 7 5.172 2.891 .012*Within Groups 98.401 55 1.789
Quadrant 2, high task and high relationship behavior (selling) Total 134.603 62
Between Groups 52.929 7 7.561 4.581 .000*Within Groups 90.785 55 1.651
Quadrant 3, low task and high relationship behavior (participating) Total 143.714 62
Between Groups 29.251 7 4.179 3.527 .003*Within Groups 65.162 55 1.185
Quadrant 4, low task and low relationship behavior (delegating) Total 94.413 62
* P< .01
Regarding selling leadership style, the results in (Table 19) indicated that Agriculture (M
= 5.86) differ significantly from Science (M = 4.00). Education (M = 5.63) differs significantly
from Science (M = 4.00). Liberal Arts (M = 6.14) differ significantly from Science (M = 4.00).
Science (M = 4.00) differs significantly from all of Engineering (M = 6.18), Business (M =
6.25), and Graduate Studies (M = 6.20).
Table 19
Fischers LSD Multiple Comparisons for the Department Chairs’ LEAD-Self Quadrant Scores (selling) regarding their discipline
Disciplines Agriculture
Education
Law Liberal Arts
Sciences Engineering
Business Graduate Studies
Agriculture - .739 .295 .691 .008* .618 .573 .663 Education .739 - .458 .458 .015* .374 .354 .454 Law .295 .458 - .147 .089 .095 .098 .164 Liberal Arts .691 .458 .147 - .002* .952 .878 .942 Sciences .008* .015* .089 .002* - .001* .001* .005* Engineering .618 .374 .095 .952 .001* - .913 .980 Business .573 .354 .098 .878 .001* .913 - .948 Graduate Studies .663 .454 .164 .942 .005* .980 .948 - * p< .05

59
Regarding participating leadership style, the results in (Table 20) indicated that
Agriculture (M = 4.43) differ significantly from Engineering (M = 2.73). Education (M = 5.50)
differs significantly from all of Law (M = 3.75), Engineering (M = 2.73), Business (M = 3.88),
and Graduate Studies (M = 3.80). Law (M = 3.75) differs significantly from Science (M = 5.33).
Liberal Arts (M = 4.43) differ significantly from Engineering (M = 2.73). Science (M = 3.88)
differs significantly from all of Engineering (M = 2.73), Business (M = 3.88), and Graduate
Studies (M = 3.80).
Table 20
Fischers LSD Multiple Comparisons for the Department Chairs’ LEAD-Self Quadrant Scores (participating) regarding their discipline
Disciplines Agricu
lture Educati
on Law Liberal
Arts Sciences Engineer
ing Business Graduate
Studies Agriculture - .113 .312 1.00 .168 .008* .409 .407 Education .113 - .009* .113 .790 .000* .014* .024* Law .312 .009* - .312 .014* .092 .846 .946 Liberal Arts 1.00 .113 .312 - .168 .008* .409 .407 Sciences .168 .790 .014* .168 - .000* .023* .037* Engineering .008* .000* .092 .008* .000* - .060 .127 Business .409 .014* .846 .409 .023* .060 - .919 Graduate Studies .407 .024* .946 .407 .037* .127 .919 - * p< .05
Regarding delegating leadership style, the results in (Table 21) indicated that Agriculture
(M = .43) differs significantly from both of Law (M = 2.25), and Engineering (M = 1.82).
Education (M = .25) differs significantly from all of Law (M = 2.25), Science (M = 1.44), and
Engineering (M = 1.82). Law (M = 2.55) differs significantly from all of Liberal Arts (M = .43),
Business (M = 1.13), and Graduate Studies (M = 1.00). Liberal Arts (M = .43) differ
significantly from Engineering (M = 1.82).
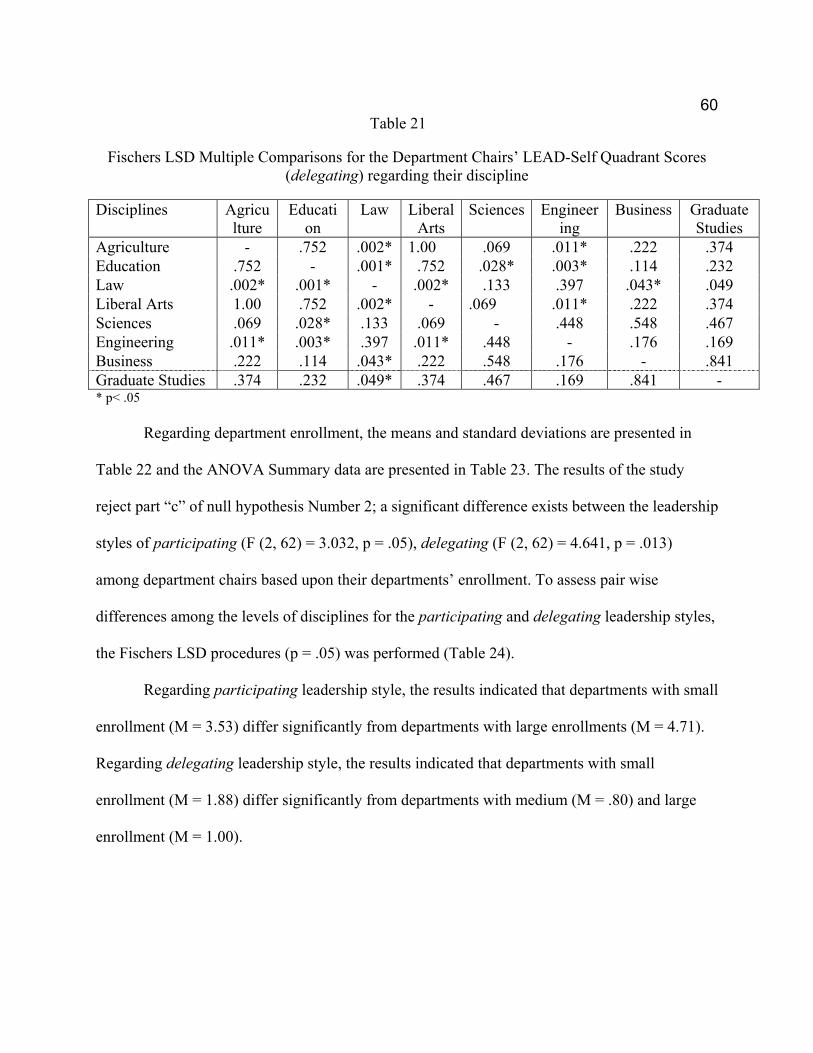
60
Table 21
Fischers LSD Multiple Comparisons for the Department Chairs’ LEAD-Self Quadrant Scores (delegating) regarding their discipline
Disciplines Agricu
lture Educati
on Law Liberal
Arts Sciences Engineer
ing Business Graduate
Studies Agriculture - .752 .002* 1.00 .069 .011* .222 .374 Education .752 - .001* .752 .028* .003* .114 .232 Law .002* .001* - .002* .133 .397 .043* .049 Liberal Arts 1.00 .752 .002* - .069 .011* .222 .374 Sciences .069 .028* .133 .069 - .448 .548 .467 Engineering .011* .003* .397 .011* .448 - .176 .169 Business .222 .114 .043* .222 .548 .176 - .841 Graduate Studies .374 .232 .049* .374 .467 .169 .841 - * p< .05
Regarding department enrollment, the means and standard deviations are presented in
Table 22 and the ANOVA Summary data are presented in Table 23. The results of the study
reject part “c” of null hypothesis Number 2; a significant difference exists between the leadership
styles of participating (F (2, 62) = 3.032, p = .05), delegating (F (2, 62) = 4.641, p = .013)
among department chairs based upon their departments’ enrollment. To assess pair wise
differences among the levels of disciplines for the participating and delegating leadership styles,
the Fischers LSD procedures (p = .05) was performed (Table 24).
Regarding participating leadership style, the results indicated that departments with small
enrollment (M = 3.53) differ significantly from departments with large enrollments (M = 4.71).
Regarding delegating leadership style, the results indicated that departments with small
enrollment (M = 1.88) differ significantly from departments with medium (M = .80) and large
enrollment (M = 1.00).

61
Table 22
Means and Standard Deviations for the Department Chairs’ LEAD-Self Quadrant Scores Regarding Enrollment
“Small”
less 300 “Medium” 300-500
“Large” more 500
N 17 25 21 M .82 .96 1.24
Quadrant 1, high task and low relationship behavior (telling)
SD .81 1.06 1.09 N 17 25 21 M 5.76 6.04 5.05
Quadrant 2, high task and high relationship behavior (selling)
SD 1.30 1.37 1.60 N 17 25 21 M 3.53 4.20 4.71
Quadrant 3, low task and high relationship behavior (participating)
SD 1.28 1.41 1.68 N 17 25 21 M 1.88 .80 1.00
Quadrant 4, low task and low relationship behavior (delegating)
SD 1.36 1.08 1.10 N: Number of Deans M: Mean SD: Standard Deviation
Table 23
ANOVA Summary Table for the Department Chairs’ on LEAD-Self Quadrant Scores Regarding Enrollment
Sum of
Squares df Mean
Square F Sig.
Between Groups 1.744 2 .872 .854 .431Within Groups 61.240 60 1.021
Quadrant 1, high task and low relationship behavior (telling) Total 62.984 62
Between Groups 11.632 2 5.816 2.838 .066Within Groups 122.971 60 2.050
Quadrant 2, high task and high relationship behavior (selling) Total 134.603 62
Between Groups 13.193 2 6.597 3.032 .056*Within Groups 130.521 60 2.175
Quadrant 3, low task and high relationship behavior (participating) Total 143.714 62
Between Groups 12.648 2 6.324 4.641 .013*Within Groups 81.765 60 1.363
Quadrant 4, low task and low relationship behavior (delegating) Total 94.413 62
* P< .05
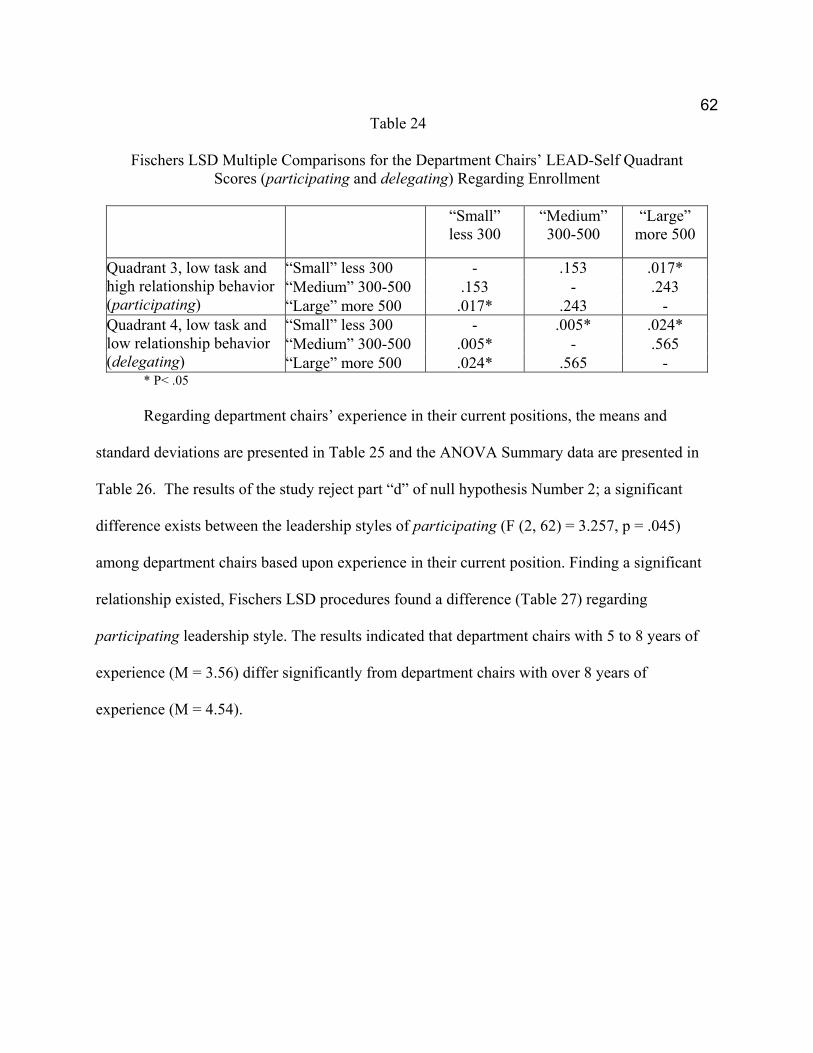
62
Table 24
Fischers LSD Multiple Comparisons for the Department Chairs’ LEAD-Self Quadrant Scores (participating and delegating) Regarding Enrollment
“Small”
less 300 “Medium” 300-500
“Large” more 500
“Small” less 300 - .153 .017* “Medium” 300-500 .153 - .243
Quadrant 3, low task and high relationship behavior (participating) “Large” more 500 .017* .243 -
“Small” less 300 - .005* .024* “Medium” 300-500 .005* - .565
Quadrant 4, low task and low relationship behavior (delegating) “Large” more 500 .024* .565 -
* P< .05
Regarding department chairs’ experience in their current positions, the means and
standard deviations are presented in Table 25 and the ANOVA Summary data are presented in
Table 26. The results of the study reject part “d” of null hypothesis Number 2; a significant
difference exists between the leadership styles of participating (F (2, 62) = 3.257, p = .045)
among department chairs based upon experience in their current position. Finding a significant
relationship existed, Fischers LSD procedures found a difference (Table 27) regarding
participating leadership style. The results indicated that department chairs with 5 to 8 years of
experience (M = 3.56) differ significantly from department chairs with over 8 years of
experience (M = 4.54).
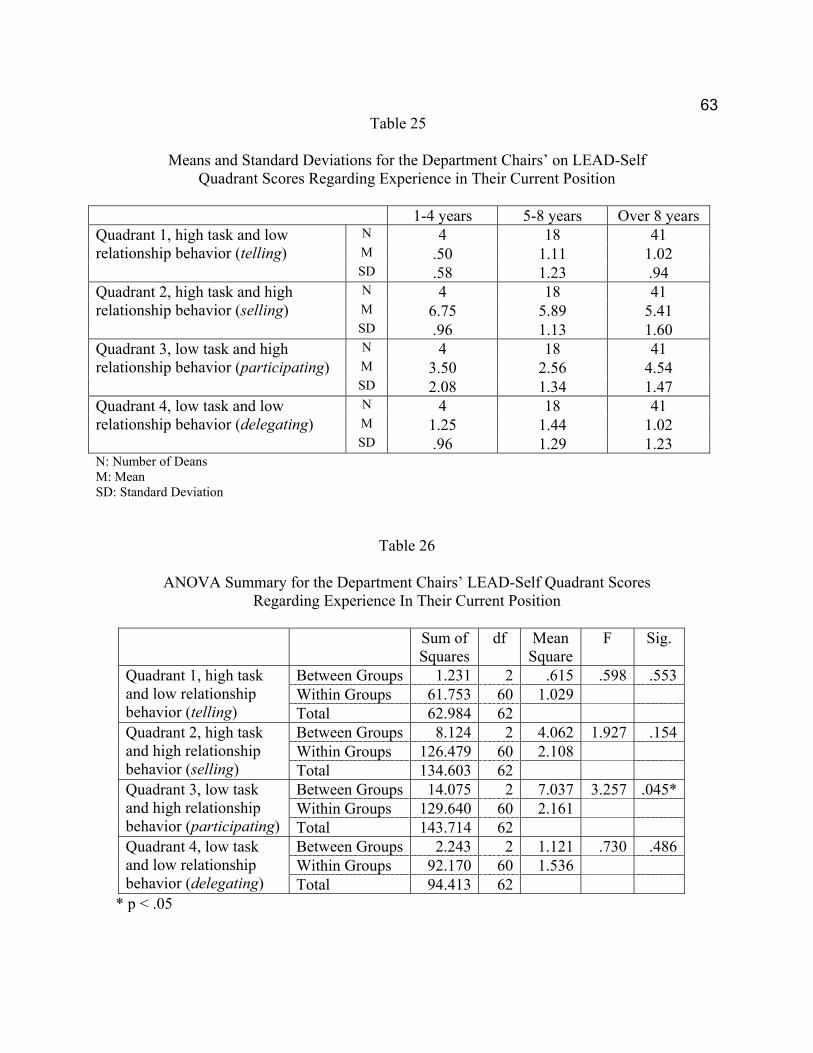
63
Table 25
Means and Standard Deviations for the Department Chairs’ on LEAD-Self Quadrant Scores Regarding Experience in Their Current Position
1-4 years 5-8 years Over 8 years
N 4 18 41 M .50 1.11 1.02
Quadrant 1, high task and low relationship behavior (telling)
SD .58 1.23 .94 N 4 18 41 M 6.75 5.89 5.41
Quadrant 2, high task and high relationship behavior (selling)
SD .96 1.13 1.60 N 4 18 41 M 3.50 2.56 4.54
Quadrant 3, low task and high relationship behavior (participating)
SD 2.08 1.34 1.47 N 4 18 41 M 1.25 1.44 1.02
Quadrant 4, low task and low relationship behavior (delegating)
SD .96 1.29 1.23 N: Number of Deans M: Mean SD: Standard Deviation
Table 26
ANOVA Summary for the Department Chairs’ LEAD-Self Quadrant Scores Regarding Experience In Their Current Position
Sum of
Squares df Mean
Square F Sig.
Between Groups 1.231 2 .615 .598 .553Within Groups 61.753 60 1.029
Quadrant 1, high task and low relationship behavior (telling) Total 62.984 62
Between Groups 8.124 2 4.062 1.927 .154Within Groups 126.479 60 2.108
Quadrant 2, high task and high relationship behavior (selling) Total 134.603 62
Between Groups 14.075 2 7.037 3.257 .045*Within Groups 129.640 60 2.161
Quadrant 3, low task and high relationship behavior (participating) Total 143.714 62
Between Groups 2.243 2 1.121 .730 .486Within Groups 92.170 60 1.536
Quadrant 4, low task and low relationship behavior (delegating) Total 94.413 62
* p < .05
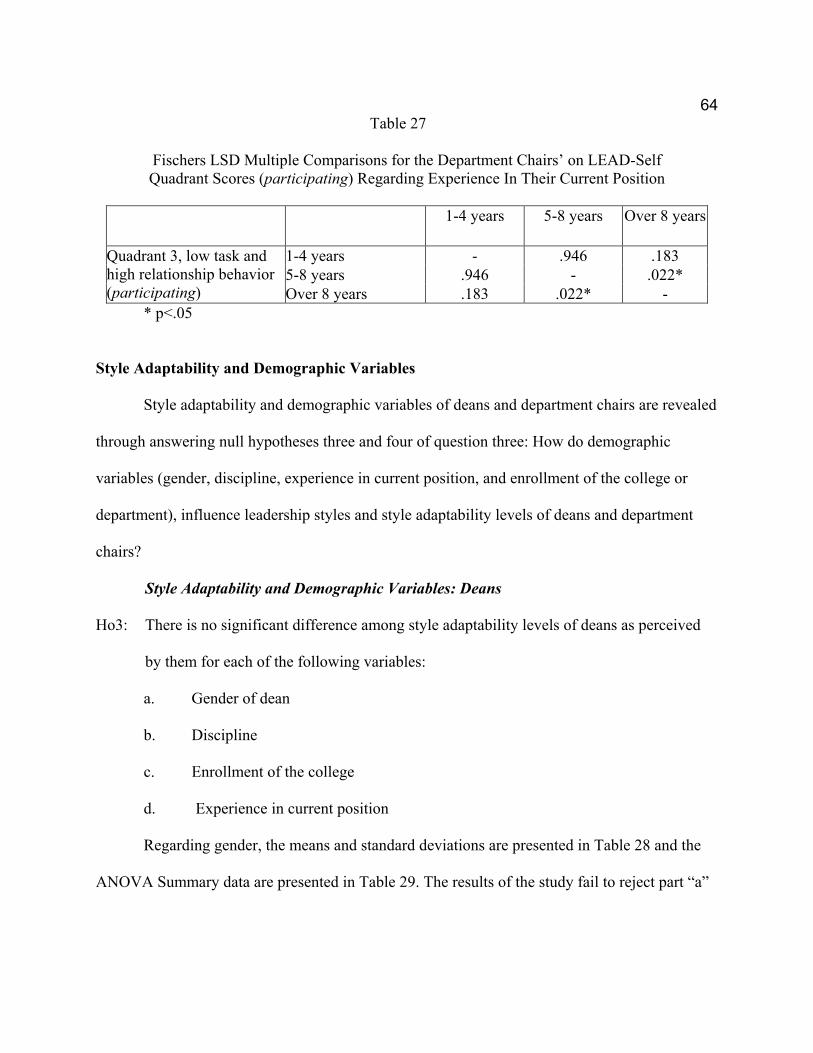
64
Table 27
Fischers LSD Multiple Comparisons for the Department Chairs’ on LEAD-Self Quadrant Scores (participating) Regarding Experience In Their Current Position
1-4 years 5-8 years Over 8 years
1-4 years - .946 .183 5-8 years .946 - .022*
Quadrant 3, low task and high relationship behavior (participating) Over 8 years .183 .022* -
* p<.05
Style Adaptability and Demographic Variables
Style adaptability and demographic variables of deans and department chairs are revealed
through answering null hypotheses three and four of question three: How do demographic
variables (gender, discipline, experience in current position, and enrollment of the college or
department), influence leadership styles and style adaptability levels of deans and department
chairs?
Style Adaptability and Demographic Variables: Deans
Ho3: There is no significant difference among style adaptability levels of deans as perceived
by them for each of the following variables:
a. Gender of dean
b. Discipline
c. Enrollment of the college
d. Experience in current position
Regarding gender, the means and standard deviations are presented in Table 28 and the
ANOVA Summary data are presented in Table 29. The results of the study fail to reject part “a”

65
of null hypothesis Number 3; no significant difference exists between the style adaptability
levels among male and female deans.
Table 28
Means and Standard Deviations for the Deans’ style Adaptability Levels Regarding Their Gender
N Mean Std. Deviation Male 16 29.31 1.99Female 5 28.00 2.35Total 21 29.00 2.10
Table 29
ANOVA Summary for the Deans’ Style Adaptability Levels Regarding Their Gender
Sum of Squares
df Mean Square F Sig.
Between Groups 6.563 1 6.563 1.531 .231Within Groups 81.438 19 4.286Total 88.000 20
Regarding discipline, the means and standard deviations are presented in Table 30 and
the ANOVA Summary data are presented in Table 31. The results of the study fail to reject part
“b” of null hypothesis Number 3; no significant difference exists between style adaptability
levels among deans regarding their discipline.

66
Table 30
Means and Standard Deviations for the Deans’ Style Adaptability Levels Regarding Their Discipline
N Mean Std. Deviation
Agriculture 2 31.50 .71Education 3 29.67 .58Law 3 28.00 1.00Liberal arts 3 29.33 3.21Science 3 30.33 2.52Engineering 3 27.00 1.73Business 2 28.50 .71Graduate 2 28.00 2.83Total 21 29.00 2.10
Table 31
ANOVA Summary for the Deans’ Style Adaptability Levels
Regarding Their Discipline
Sum of Squares df Mean Square F Sig. Between Groups 37.000 7 5.286 1.347 .305Within Groups 51.000 13 3.923Total 88.000 20
Regarding college enrollment, the means and standard deviations are presented in Table
32 and the ANOVA Summary data are presented in Table 33. The results of the study fail to
reject part “c” of null hypothesis number 3; no significant difference exists between style
adaptability levels among deans regarding to their college enrollment.
Table 32
Means and Standard Deviations for the Deans’ Style Adaptability Levels Regarding their college enrollment
N Mean Std. Deviation
“Small” less 300 2 29.00 1.41“Medium” 300-500 9 28.67 1.87“Large” more 500 10 29.30 2.50Total 21 29.00 2.10

67
Table 33
ANOVA Summary for the Deans’ Style Adaptability Levels Regarding their college enrollment
Sum of Squares df Mean Square F Sig.
Between Groups 1.900 2 .950 .199 .822Within Groups 86.100 18 4.783 Total 88.000 20
Regarding experience in their current position, the means and standard deviations are
presented in Table 34 and the ANOVA Summary data are presented in Table 35. The results of
the study fail to reject part “d” of null hypothesis Number 3; no significant difference exists
between style adaptability levels among deans regarding their experience in their current
position.
Table 34
Means and Standard Deviations for the Deans’ Style Adaptability Levels Regarding their experience
N Mean Std. Deviation
1-4 years 5 28.00 1.585-8 years 4 28.50 .58Over 8 years 12 29.58 2.47Total 21 29.00 2.10
Table 35
ANOVA Summary for the Deans’ Style Adaptability Levels Regarding their experience
Sum of Squares df Mean Square F Sig.
Between Groups 14.403 2 7.202 1.661 .221Within Groups 69.386 16 4.337Total 83.789 18

68
Leadership Adaptability and Demographic Variables: Department Chairs
Ho4: There is no significant difference among style adaptability levels of department chairs as
perceived by them for each of the following variables:
a. Gender of department chair
b. Discipline
c. Enrollment of the department
d. Experience in current position
Regarding gender, the means and standard deviations are presented in Table 36 and the
ANOVA Summary data are presented in Table 37. The results of the study fail to reject part “a”
of null hypothesis Number 4; no significant difference exists between style adaptability levels
among male and female department chairs.
Table 36
Means And Standard Deviations For The Department Chairs’ Style Adaptability Levels Regarding Their Gender
N Mean Std. Deviation
Male 50 25.42 2.71Female 13 26.15 3.00Total 63 25.57 2.76
Table 37
ANOVA Summary for the Department Chairs’ Style Adaptability Levels Regarding Their Gender
Sum of
Squares df Mean
Square F Sig.
Between Groups 5.556 1 5.556 .724 .398Within Groups 467.872 61 7.670 Total 473.429 62
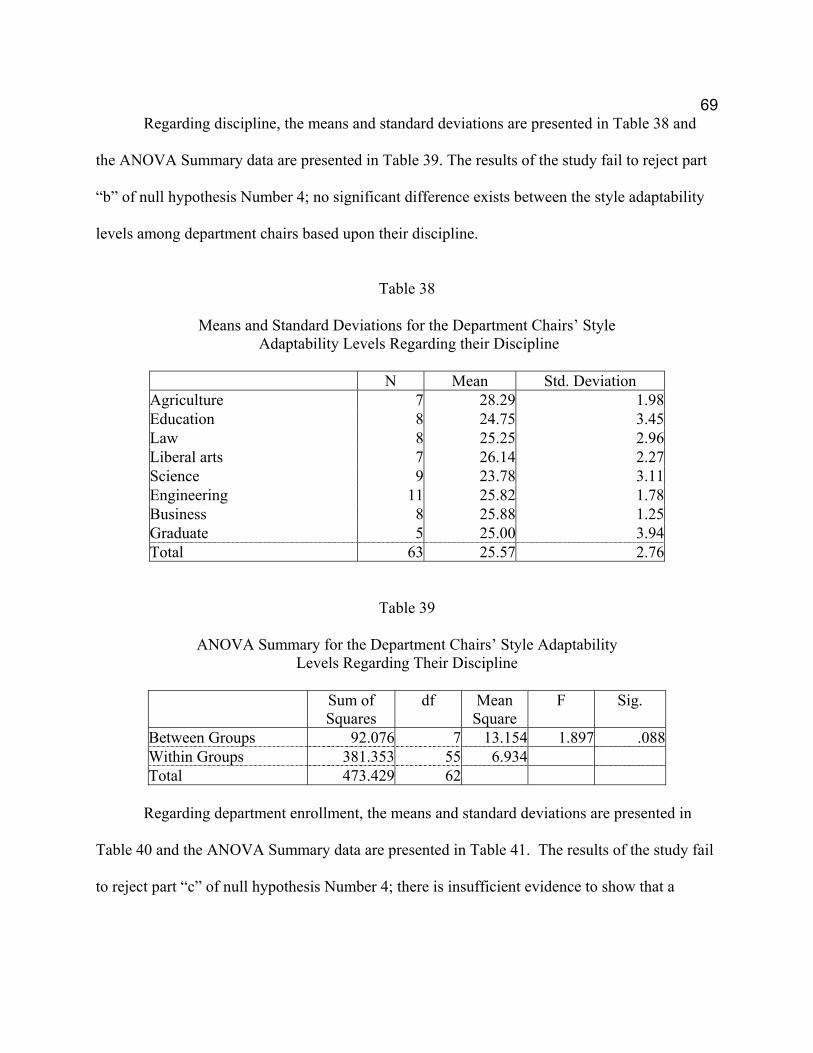
69
Regarding discipline, the means and standard deviations are presented in Table 38 and
the ANOVA Summary data are presented in Table 39. The results of the study fail to reject part
“b” of null hypothesis Number 4; no significant difference exists between the style adaptability
levels among department chairs based upon their discipline.
Table 38
Means and Standard Deviations for the Department Chairs’ Style
Adaptability Levels Regarding their Discipline
N Mean Std. Deviation Agriculture 7 28.29 1.98Education 8 24.75 3.45Law 8 25.25 2.96Liberal arts 7 26.14 2.27Science 9 23.78 3.11Engineering 11 25.82 1.78Business 8 25.88 1.25Graduate 5 25.00 3.94Total 63 25.57 2.76
Table 39
ANOVA Summary for the Department Chairs’ Style Adaptability Levels Regarding Their Discipline
Sum of
Squares df Mean
Square F Sig.
Between Groups 92.076 7 13.154 1.897 .088Within Groups 381.353 55 6.934Total 473.429 62
Regarding department enrollment, the means and standard deviations are presented in
Table 40 and the ANOVA Summary data are presented in Table 41. The results of the study fail
to reject part “c” of null hypothesis Number 4; there is insufficient evidence to show that a
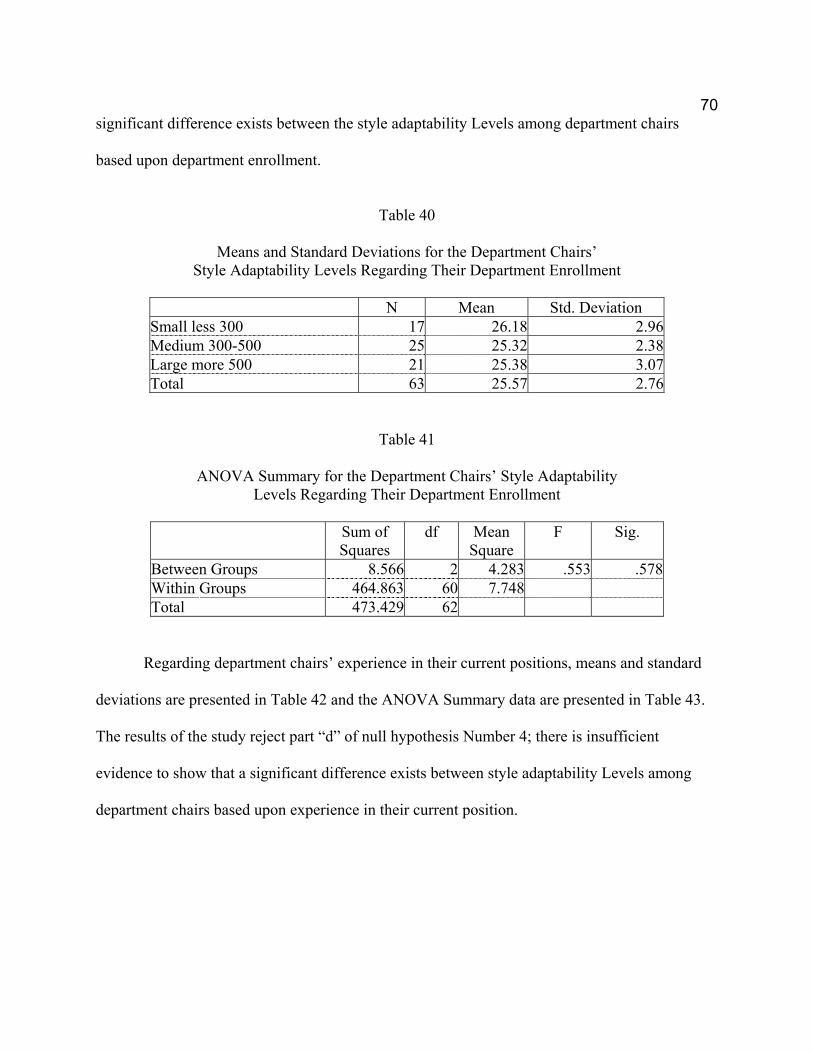
70
significant difference exists between the style adaptability Levels among department chairs
based upon department enrollment.
Table 40
Means and Standard Deviations for the Department Chairs’
Style Adaptability Levels Regarding Their Department Enrollment
N Mean Std. Deviation Small less 300 17 26.18 2.96Medium 300-500 25 25.32 2.38Large more 500 21 25.38 3.07Total 63 25.57 2.76
Table 41
ANOVA Summary for the Department Chairs’ Style Adaptability Levels Regarding Their Department Enrollment
Sum of
Squares df Mean
Square F Sig.
Between Groups 8.566 2 4.283 .553 .578Within Groups 464.863 60 7.748Total 473.429 62
Regarding department chairs’ experience in their current positions, means and standard
deviations are presented in Table 42 and the ANOVA Summary data are presented in Table 43.
The results of the study reject part “d” of null hypothesis Number 4; there is insufficient
evidence to show that a significant difference exists between style adaptability Levels among
department chairs based upon experience in their current position.
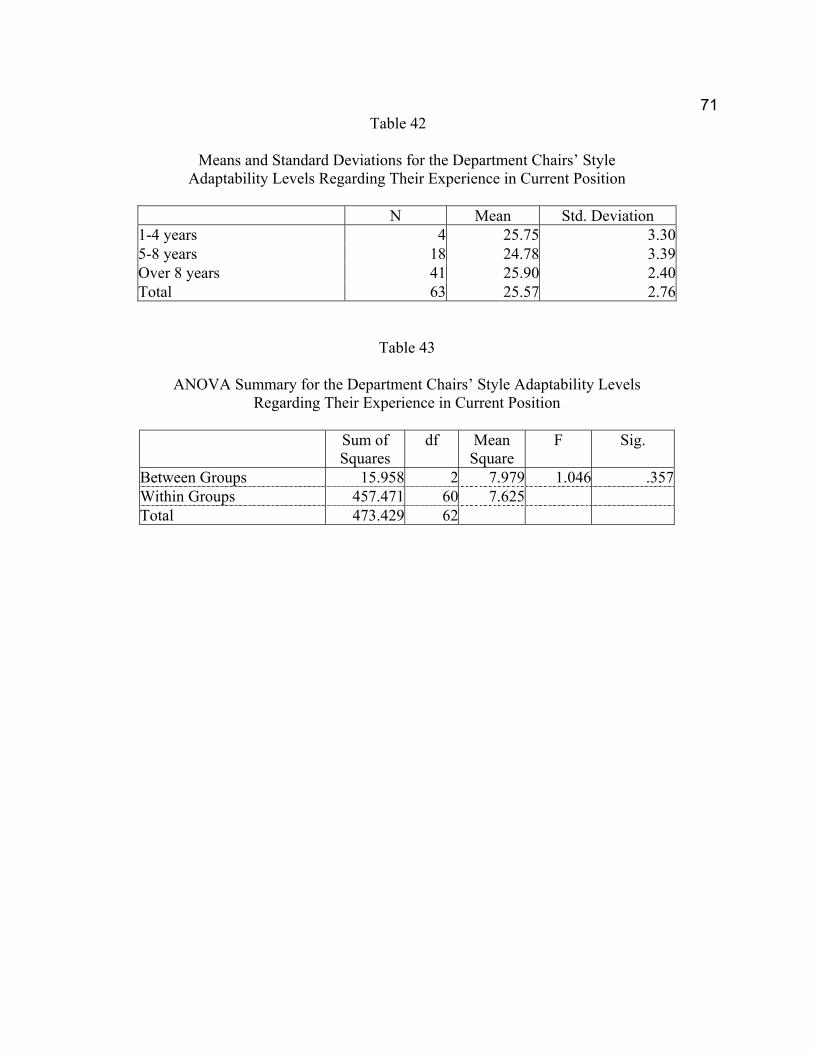
71
Table 42
Means and Standard Deviations for the Department Chairs’ Style Adaptability Levels Regarding Their Experience in Current Position
N Mean Std. Deviation
1-4 years 4 25.75 3.305-8 years 18 24.78 3.39Over 8 years 41 25.90 2.40Total 63 25.57 2.76
Table 43
ANOVA Summary for the Department Chairs’ Style Adaptability Levels Regarding Their Experience in Current Position
Sum of
Squares df Mean
Square F Sig.
Between Groups 15.958 2 7.979 1.046 .357Within Groups 457.471 60 7.625Total 473.429 62

72
CHAPTER FIVE
CONCLUSIONS AND IMPLICATIONS
This study was designed to identify the leadership styles and style adaptability as defined
by the Leadership Effectiveness and Adaptability Description (LEAD) Self Instrument, of deans
and department chairs at three Public Doctoral Research Universities-Extensive (Carnegie
Commission on Higher Education, 2000) in the northwest region of the United States. The study
compared these factors in terms of gender of individual participants and examined how these
factors may be affected by selected demographic factors.
Summary
This study would make available useful information about the leadership styles and style
adaptability of deans and department chairs at three Public Doctoral Research Universities-
Extensive, information based upon the perceptions of their leadership styles by as provided by
the deans and department chairs. The Leadership Effectiveness and Adaptability Description
(Appendix A) and the Personal Information Data Sheet (Appendix B) were used to conduct this
study. The LEAD-Self survey is a validated research instrument of leadership styles. Permission
to use the LEAD-Self instrument was granted by its developers (Appendix F), and the instrument
was purchased from The Center for Leadership Studies in Escondido, California. The Personal
Information Data Sheet was developed to obtain demographic data for comparison. The LEAD-
Self Instrument and the personal information data sheet were mailed to the 24 deans and 76
department chairs at three Public Doctoral Research Universities-Extensive in the northwest
region of the United States, more specifically, Washington, Idaho, and Oregon. In addition to a

73
pre-addressed return envelope, cover letter (Appendix E) was enclosed in each packet
explaining the purpose of the study with appropriate instructions concerning completion of the
survey.
The LEAD instrument surveys were scored and analyzed based upon directions provided
by The Center for Leadership Studies (2000). The results and information garnered from the
personal information data sheets were statistically analyzed using the Statistical Package for
Social Sciences (SPSS) software.
Three research questions and four hypotheses were stated in this study. The questions and
hypotheses were:
Research Question 1: How do deans and department chairs perceive their leadership styles?
Research Question 2: What is the average style adaptability level among deans and department
chairs?
Research Question 3: How do demographic variables (gender, discipline, experience in current
position, and enrollment of the college or department), influence leadership styles and
style adaptability levels of deans and department chairs?
Null Hypothesis 1: There is no significant difference among leadership styles of deans
as perceived by them for each of the following variables:
a. Gender of dean
b. Discipline
c. Enrollment of the college
d. Experience in current position
Null Hypothesis 2: There is no significant difference among leadership styles of
department chairs as perceived by them for each of the following variables:

74
a. Gender of department chair
b. Discipline
c. Enrollment of the department
d. Experience in current position
Null Hypothesis 3: There is no significant difference among style adaptability levels
of deans as perceived by them for each of the following variables:
a. Gender of dean
b. Discipline
c. Enrollment of the college
d. Experience in current position
Null Hypothesis 4: There is no significant difference among style adaptability levels
of department chairs as perceived by them for each of the following variables:
a. Gender of department chair
b. Discipline
c. Enrollment of the department
d. Experience in current position
Conclusions
Deans and department chairs are responsible for managing multiple tasks and groups,
therefore, style of leadership, style adaptability, and methods to improve interaction with others
become important. Although several theories of leadership exist in terms of task versus behavior,
Hersey and Blanchard’s (1977) Situational Leadership Theory takes the quadrant leadership
model and expands upon it. A leader is effective only if they use the leadership style appropriate
75
for the readiness level of the group. Therefore, a dean or department chair will only be
effective if the appropriate leadership style is employed for the level of their college or
department.
With regard to leadership style, both deans and department chairs selected selling (high
task/high relationship behavior) as their primary leadership style, and selected participating as
their secondary style. With selling as the main category of leadership style, deans and department
chairs appear to acquire the acceptance of their faculty and staff and carryout the behaviors most
wanted or needed by them. The followers in this of style are confident and willing to take
responsibility but are unable to do because of a lack of expertise (Center for Leadership Studies,
Inc., 2002).
Regarding style adaptability, deans and department chairs fell in the middle range of
scores. According to the Center for Leadership Studies, Inc. (2002), the middle range reflects
“…a moderate degree of adaptability. Scores in this range usually indicate a pronounced primary
leadership style with less flexibility into the secondary styles” (Center for Leadership Studies,
Inc., 2002).
Based upon the findings of this study, it could be concluded that leadership styles of
deans are not significantly affected by demographic factors. There was insufficient evidence to
show that a significant difference exists for leadership styles among deans as perceived by them,
with the exception of their discipline; there was however sufficient evidence that a significant
difference exists between delegating leadership style among deans based upon their discipline.
Contrary to deans’ leadership style, it could be concluded that the leadership styles of
department chairs are affected by demographic factors. The results of this study indicated that
male department chairs used telling and delegating leadership styles more than female

76
department chairs, while female department chairs used participating more than male. This
difference between male and female department chairs leadership styles reflects the changing
criteria for modern leaders. Glaser and Smalley (1995) found that women are now uniquely
equipped to contribute to the new work climate because of their natural leadership tendencies.
These characteristics include: having a positive attitude, solid job knowledge, a personal touch,
generosity, a sense of direction, consistency, flexibility/ adaptability, open-mindedness,
trustworthiness/ reliability, firmness/ decisiveness, a sense of humor, strength/ confidence,
visibility/ accessibility, and ability to motivate.
A significant difference exists between the leadership styles of selling, participating, and
delegating among department chairs based upon their discipline. A significant difference was
found to exist between the leadership styles of participating and delegating among department
chairs based upon their departments’ enrollment. A significant difference exists between the
leadership styles of participating among department chairs based upon experience in their
current position. Professional and organizational development in communication, decision-
making, and problem solving abilities improve the quality of decisions made at college and
department level.
Findings of this study indicated that that style adaptability levels of deans and department
chairs at the three Public Doctoral Research Universities-Extensive evaluated for this study are
not significantly affected by demographic factors. There was insufficient evidence to conclude
that a significant difference exists for style adaptability levels among deans and department
chairs as perceived by them.
Based upon Bolton and Boyer’s (1972) study, professional and organizational
development in academic colleges and departments helping deans and department chairs

77
imrprove their capabilities to address at their own level the broad problem that faces
developing their leadership style and style adaptability. At the same time developing educational
plan, improving teaching effectiveness, and improving relationship among faculty, staff, and
students.
Recommendations
The following recommendations are made as a result of the findings of this study:
1. Further research could be conducted to establish whether there are differences between
the leadership behaviors of deans and department chairs at Public Doctoral Research
Universities-Extensive;
2. Further research could be conducted to establish whether there are differences between
the leadership behaviors of male and female deans and department chairs at Public
Doctoral Research Universities-Extensive;
3. Further research could be conducted to establish suitable continuing education programs
to provide for the development of enhanced leadership behaviors of deans and
department chairs at Public Doctoral Research Universities-Extensive;
4. Further research could be conducted to establish if there are differences in the leadership
behaviors of deans and department chairs over a period of time; and
5. Further research could be conducted to determine differences between the leadership
behaviors of deans and department chairs at institutions of higher education in Jordan and
the United States.
78
REFERENCES Arter, M.H. (1981). Career advancement from institutional research to academic utilizing
institutional research. Paper presented at the 21st Annual Forum of the Association for Institutional Research (AIR), Minneapolis, May 17-20, ERIC Document No. 205119.
Astin, A.W., & Scherrei, R.A. (1980). Maximizing leadership effectiveness. San Francisco:
Jossey-Bass. Baldridge, V.J. (1971). Academic governance. Berkeley, CA: McCutchan. Bass, B. M. (Ed.) (1990). Bass & Stogdill’s handbook of leadership: Theory, research, and
managerial applications (3rd ed.). New York: The Free Press. Bass, B. M., & Avolio, B.J. (Eds.). (1994). Improving organizational effectiveness through
transformational leadership. Thousand Oaks, CA: SAGE Publications. Bennett, J.B. (1983). What lies in the future for department chairpersons? Educational Record,
64(2), pp. 52-56. Bennett, J. (1982). Ambiguity and abrupt transitions in the department chairperson’s role.
Educational Record, 63(4), pp. 53-56. Bennis, W., & Nanus, B. (1997). Leaders: Strategies for taking charge (2nd ed.). New York:
Harper Business. Bensimon, E.M, Neumann, A., & Birnbaum, R. (2000). Higher education and leadership theory.
In M. Christopher Brown, II, Organization governance in higher education (5th edition) (pp.241-231). Boston: Pearson Custom Publishing.
Blake, R.R. and Mouton, J.S. (1985). The Managerial Grid III. Houston, TX: Gulf Publishing. Blake, R.R. and Mouton, J.S. (1964). The Managerial Grid. Houston, TX: Gulf Publishing. Bolton, C. K., & Boyer, R. K. (1973). Organizational development for academic departments.
Journal of Higher Education, 44(5), pp. 352-369. Brown, M. A. (1973). What kind of leaders do faculty members want? College Management,
8(1), pp.25-26, 36. Burns, J. M. (1978). Leadership. New York: Harper & Row. Carnegie Commission on Higher Education (2000). A Classification of institutions of higher
education. Berkeley: Carnegie Commission on Higher Education.

79
Center for Leadership Studies, Inc. (2002). LEAD Directions: Directions for self-scoring and analysis.
Cleveland, H. (1960). The dean’s dilemma: Leadership. Public Administration Review, 20, pp.
22-27. Cox, E. W. (1974). Superiors and subordinates’ perceptions and expectations of the leader
behavior of the dean of instruction: A study of the North Carolina community college system. Unpublished doctoral dissertation, the University of North Carolina at Grantsburg.
Cyphert, F. R., & Ingersoll, R. W. (1974). Leadership strategy in academic administration.
Journal of Teacher Education, Vol. XXV, pp. 357-359. Dill, D.D. (2000). The nature of administrative behavior in higher education. In M. Christopher
Brown II, Organization governance in higher education (5th edition) (pp.92-110). Boston: Pearson Custom Publishing.
Dressel, P. L., & Reichard, D. J. (1970). The university department: Retrospect and prospect.
Journal of Higher Education, 41(5), pp. 387-402. Drouillard, S. E., & Kleiner, B. H. (1996). Good leadership. Management Development Review,
9, 30-33. Feltner, B.D., & Goodsell, D.R. (1972). The academic dean and conflict management. Journal of
Higher Education, 43(9), pp. 692-701. Fiedler, F.E. (1967). A theory of leadership effectiveness. New York: McGraw-Hill. Gibb, C. (1955). Classroom behavior of the college teacher. Educational and Psychological
Measurement, 15, pp.254-263. Glaser, C., & Smalley, B.S. (1995). Swim with the dolphins: How women can succeed in
corporate America on their own terms. New York: Warner Books Gmelch, W. H. (1999). Building leadership capacity for institutional reform. Paper presented at
the Inaugural Conference of the Global Consortium of Higher Education and Research for Agriculture, Amsterdam.
Gmelch, W.H., Wolverton, M., Wolverton, M.L., & Sarros, J.C. (1999). The academic dean: An
imperiled species searching for balance. Research in Higher Education, 40(6), pp. 717-740.
Gmelch, W. H., & Miskin, V. D. (1995). Chairing an academic department. Thousand Oaks:
SAGE Publications.

80
Gmelch, W. H., & Miskin, V. D. (1993). Leadership skills for Department chairs. Bolton, MA:
Anker Publishing Company. Greene, J.F. (1980). Executive summary for the LEAD-Self Manual. Unpublished report. San
Diego, CA: The Center for Leadership Studies. Hardy, R.C. (1982). The contingency model of leadership effectiveness: Motivational
implications of the teaching role as leader in the classroom. ERIC Document ED 218 762.
Hersey, P., Blanchard, K.H., & Johnson, D.E. (1996). Management of organizational behavior:
Utilizing human resources (7th ed.). Upper Saddle River, NJ: Prentice Hall. Hersey, P., & Blanchard, K. H. (1982). Management of organizational behavior: Utilizing
human resources (4th ed.). r. Englewood Cliffs, NJ: Prentice –Hall, Inc. Hersey, P., & Blanchard, K. H. (1977). Management of organizational behavior. NJ: Prentice –
Hall, Inc. Hersey, P., & Blanchard, K. (1976). Situational leadership. San Diego, CA: Center for
Leadership Studies. Hersey, P., & Blanchard, K. H. (1969). Management of organizational behavior: Utilizing
human resource. Englewood Cliffs, NJ: Prentice –Hall, Inc. Hilosky, A., and Watwood, B. (1997). Transformational leadership in a changing world: A
survival guide for new chairs and deans. Paper Presented at the Sixth Annual International Conference of the Chair Academy, Reno, NV, Feb. 12-15.
Hogan, R., Curphy, G. J., & Hogan, J. (1994). What we know about leadership: Effectiveness
and personality. American Psychologist, 49(6), 493-504. House, R.J. (1971). A path goal theory of leader effectiveness. Administrative Science Quarterly,
16, pp. 321-338. Hoyt, D. P., & Spangler, R. K. (1978). Administrative effectiveness of the academic department
head: Its correlates of effectiveness. Manhattan: Kansas State University, ERIC Document ED 171 215.
Jabs, M. L. (1982). Leadership in the college classroom. Improving College and University
teaching, 1, pp. 200-202. Johnson, D. J. (1976). Relationship between administrators’ personality and how they and the
faculty perceived the administrators’ role and degree of success. ERIC Document ED 178 506.
81
Kapel, D.E., & Dejnozka, E.L. (1979). The education deanship: A further analysis. Research in
Higher Education, 10, pp. 99-112. Knight, W. H., & Holen, M. C. (1985). Leadership and the perceived effectiveness of department
chairpersons. Journal of Higher Education, 56 (6), pp. 677-690. Knox, W. G. (1977). Power of pawn: Leadership and the department head resources booklet.
Ontario: Ontario Secondary School Teacher’s Federation, ERIC Document ED 153 309. Kotter, J. P. (1990). A Force for change: How leadership differs from management. N.Y.: The
free press. Kouzes, J. M., & Posner, B. Z. (1987). The Leadership: challenge: How to get extraordinary
things done in organizations. San Francisco, Oxford: Jossey-Bass Publishers. Madron, T.M., Craig, J.R., & Mendel, R.M. (1976). Departmental morale as a function of the
perceived performance of department heads. Research in Higher Education, 5, pp. 83-94. Martin, J.L. (1993). Academic deans: an analysis of effective academic leadership at research
universities. Paper presented at the Annual Meeting of the American Educational Research Association, Atlanta, GA, April 1993.
Mazzarella, J. A. (1983). Leadership styles. In Stuart C. Smith, Jo Ann Mazzarella, and Philip k.
Piele (Eds.), School leadership handbook for survival (pp. 58-87). Eugene, OR: ERIC. McBeath, A., & Andrews, J. (1960). Teacher leader behavior and teaching effectiveness. Alberta
Journal of Educational Research, 6, pp. 10-18. Mello, J. A. (1999). Reframing leadership pedagogy through model and theory building. Career
Development International, 4, pp. 163–169. Mezoff, B. (1978). Improving the effectiveness of university teaching: an application of
leadership theory. ERIC Document ED 169 815. Mongomery, B. L. (1961). The path to leadership. London: Collins clear-type press. Mumford, A. (1980). Making Experience Pay. NY: McGraw-Hill. Pettigrew, A., & Whipp, R. (1991). Managing Change for Competitive Success. Oxford:
Blackwell. Pfeffer, J. (1977). The ambiguity of leadership. Academy of Management Review, 2, pp. 104-
112.
82
Redwood, S., Goldwasser, C., & Street, S. (1999). Action management. New York: John Wiley
& Sons, Inc. Rost, J. C. (1993). Leadership for the twenty-first century. Westport, CT: Praeger Publishers. Rowley, J. (1997). Academic leaders: Made or born? Industrial and Commercial Training,
29(3), pp. 78-84. Ryan, D. W. (1972). The internal organization of academic departments. Journal of Higher
Education, 43(6), pp. 464-482. Sagaria, M.A., & Krotseng, M.V. (1986). Deans’ managerial skills: What they need and what
they bring to a job. Journal of the College and University Personnel Association, 37(2), pp. 1-7.
Sagaria, M.A. (1988). Administrative mobility and gender: Patterns and prices in higher
education. Journal of Higher Education, 59(3), pp. 306-326. Salaman, G., & Butler, J. (1994). Why managers won’t learn. In Mabey, C. and Iles, P. (Eds.),
Managing Learning. Routledge, London, New York, (with the Open University). Seagren, A. T., Creswell, J. W., and Wheeler, D. W. (1993). The department chair: New roles,
responsibilities, and challenges. Washington, D.C.: The George Washington University School of Education and Human Development. (ERIC Document Reproduction Services No. Ed RI-88-062014)
Spitzberg, I. J. (1987). Paths of inquiry into leadership. Liberal Education, 73(2), pp. 24-28. Swanson, R. (Nov.-Dec., 1974). The teacher as a leader. College Student Journal, 8, pp. 40-45. Tannenbaum, R., and Schmidt, W. H. (1961). How to choose a leadership pattern. Harvard
Business Review, 36, pp. 23–29. Tight, M. (1992). Leadership: deans and heads of departments. In The Encyclopedia of higher
education (Vol. 2, pp. 1390–1397). Oxford; New York: Pergamon Press. Toylyati, M. (1981). The leadership behavior of the academic department chairman:
Expectations and perceptions of deans, chairmen, faculty members, and students at selected institutions of higher learning. Unpublished doctoral dissertation, Oklahoma State University.
Tucker, A. (1984). Chairing the academic department: Leading among peers, 2ed edition. NY:
Macmillan Publishing Company.
83
Vroom, V.H. (1983). Leaders and leadership in academe. The Review of Higher Education, 6(4), pp. 367-386.
Yukl, G. A. (1998). Leadership in organizations (4th ed.). Upper Saddle River, NJ: Prentice Hall. Yukl, G.A. (1989). Leadership in Organizations (2nd ed.). New York, NY: Prentice-Hall. Whitson, L. J., & Hubert, F.W. (1982). Interest groups and the department chairperson. Journal
of Higher Education, 53(2), pp. 163-176. Wolverton, M., Gmelch, W. H., Wolverton, M. L., & Sarros, J.C. (1999). Stress in academic
leadership: U.S. and Australian department chairs/heads. The Review of Higher Education, 22(2), pp. 165-185.
Wolverton, M., Wolverton, M.L., & Gmelch, W.H. (1999). The impact of role conflict and
ambiguity on academic deans. Journal of Higher Education, 70, pp. 80-106.

84
APPENDIX A
LEAD-SELF INSTRUMENT

85

86

87
88
APPENDIX B
PERSONAL INFORMATION DATA SHEET
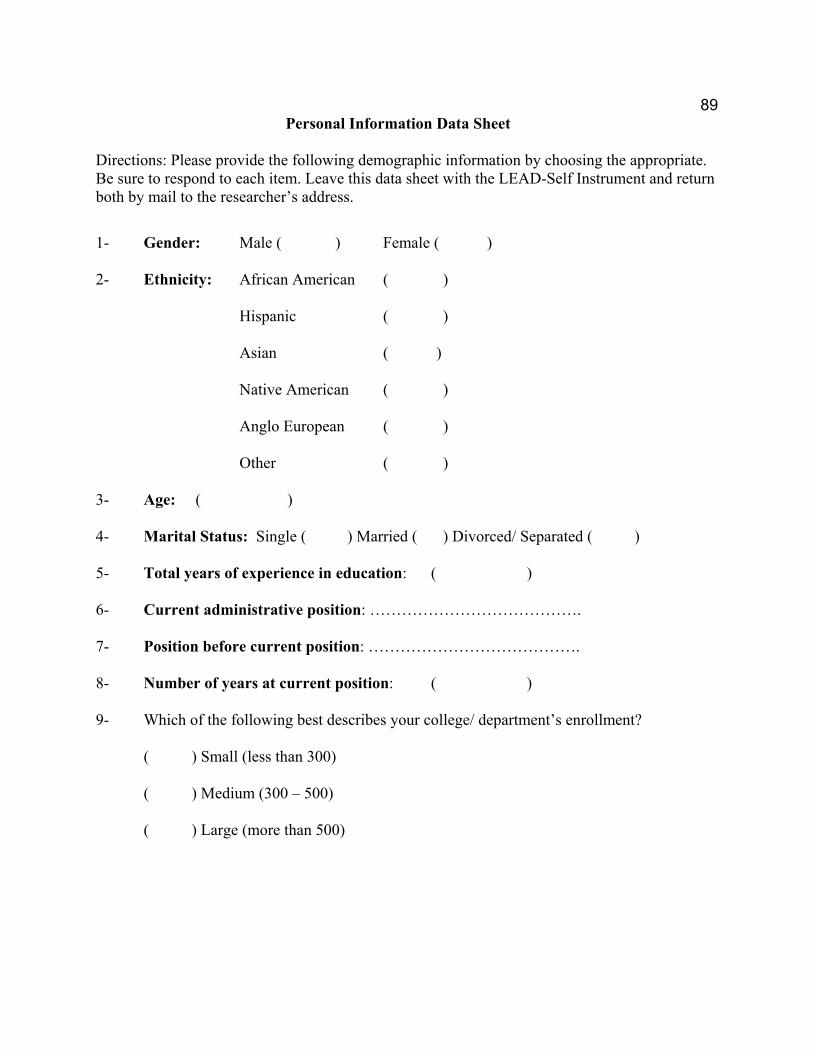
89
Personal Information Data Sheet
Directions: Please provide the following demographic information by choosing the appropriate. Be sure to respond to each item. Leave this data sheet with the LEAD-Self Instrument and return both by mail to the researcher’s address.
1- Gender: Male ( ) Female ( )
2- Ethnicity: African American ( )
Hispanic ( )
Asian ( )
Native American ( )
Anglo European ( )
Other ( )
3- Age: ( )
4- Marital Status: Single ( ) Married ( ) Divorced/ Separated ( )
5- Total years of experience in education: ( )
6- Current administrative position: ………………………………….
7- Position before current position: ………………………………….
8- Number of years at current position: ( )
9- Which of the following best describes your college/ department’s enrollment?
( ) Small (less than 300)
( ) Medium (300 – 500)
( ) Large (more than 500)
90
APPENDIX C
LEADERSHIP STYLE AND RANGE

91

92

93

94
APPENDIX D
STYLE ADAPTABILITY

95

96
APPENDIX E
COVER LETTER TO DEANS AND DEPARTMENT CHAIRS FOR SURVEY

97
Informed consent
Dear Participant:
You have been invited to participate in the study, “Leadership styles and style adaptability of deans and department chairs at three public research universities.” The purpose of this study is to (a) how do deans and department chairs perceive their leadership styles? (b) What is the average style adaptability level among deans and department chairs?
For the purposes of data collection, you will be asked to respond to the questionnaire that is administered via mail with an enclosed self-address stamp for its return. Your participation is confidential, and confidentiality will be maintained through storage of data in a secure location accessible only to the researcher and his advisor; use of personal and organizational pseudonyms in written reports and oral presentations of this research; and purging of personality-identifiable information from questionnaires and research reports. There are no foreseeable risks or discomfort to participants involved in this study. While you will be encouraged to answer questionnaire questions honestly, you may refrain from questionnaire questions if you are uncomfortable. You may choose to withdraw during the responding process at any time. If you have questions or need additional information about this research or your participation, you may contact me at: Aieman AL-OMARI, 1630 NE Valley Rd. APT. # E103 Pullman, Washington 99163/ Dr. Willie Heggins III 365 Cleveland Hall Pullman, Washington 99164, or by e-mail at: [email protected] and [email protected]. You can call the WSU Institutional Review Board at (509)335-9661. This study has been reviewed and approved for human participation by the WSU IRB.
I consent to participate in the research study named and described above.
Participant Name: (printed) ____________________________
Signature: __________________________________________ Date: ______________
Researcher Signature: _________________________________ Date: ______________
Researcher Signature: _________________________________ Date: ______________

98
APPENDIX F
CENTER FOR LEADERSHIP STUDIES, INC. PERMISSION TO USE MATERIALS
99