characterising seizures in anti-nmda-receptor encephalitis ...karl/characterising seizures in...
TRANSCRIPT

NeuroImage 118 (2015) 508–519
Contents lists available at ScienceDirect
NeuroImage
j ourna l homepage: www.e lsev ie r .com/ locate /yn img
Characterising seizures in anti-NMDA-receptor encephalitis withdynamic causal modelling
Gerald K. Cooray a,b,⁎, Biswa Sengupta a, Pamela Douglas a, Marita Englund b, Ronny Wickstrom c, Karl Friston a
a Wellcome Trust Centre for Neuroimaging, Institute of Neurology, University College London, UKb Clinical Neurophysiology, Karolinska University Hospital, Stockholm, Swedenc Neuropediatric Unit, Department of Women's and Children's Health, Karolinska Institutet, Sweden
⁎ Corresponding author at: Wellcome Trust Centre fQueen Square, London WC1N 3BG, UK.
E-mail address: [email protected] (G.K. Cooray).
http://dx.doi.org/10.1016/j.neuroimage.2015.05.0641053-8119/© 2015 The Authors. Published by Elsevier Inc
a b s t r a c t
a r t i c l e i n f oArticle history:Received 28 November 2014Accepted 24 May 2015Available online 30 May 2015
Keywords:Anti-NMDA-R encephalitisEEGDynamical causal modelling (DCM)Seizures
We characterised the pathophysiology of seizure onset in terms of slow fluctuations in synaptic efficacy using EEGin patients with anti-N-methyl-D-aspartate receptor (NMDA-R) encephalitis. EEG recordings were obtained fromtwo female patients with anti-NMDA-R encephalitis with recurrent partial seizures (ages 19 and 31). Focalelectrographic seizure activity was localised using an empirical Bayes beamformer. The spectral density of recon-structed source activity was then characterised with dynamic causal modelling (DCM). Eight models were com-pared for each patient, to evaluate the relative contribution of changes in intrinsic (excitatory and inhibitory)connectivity and endogenous afferent input. Bayesianmodel comparison established a role for changes in both ex-citatory and inhibitory connectivity during seizure activity (in addition to changes in the exogenous input). Seizuresin both patients were associated with a sequence of changes in inhibitory and excitatory connectivity; a transientincrease in inhibitory connectivity followed by a transient increase in excitatory connectivity and a final peak ofexcitatory–inhibitory balance at seizure offset. These systematic fluctuations in excitatory and inhibitory gainmay be characteristic of (anti NMDA-R encephalitis) seizures. We present these results as a case study and replica-tion to motivate analyses of larger patient cohorts, to see whether our findings generalise and further characterisethe mechanisms of seizure activity in anti-NMDA-R encephalitis.
© 2015 The Authors. Published by Elsevier Inc. This is an open access article under the CC BY license(http://creativecommons.org/licenses/by/4.0/).
Introduction
Anti-N-methyl-D-aspartate receptor (NMDA-R) antibody encephali-tis was discovered in 2007 in several females with ovarian teratomapresenting with psychiatric and dys-autonomous symptoms. The dis-ease has also been described in the paediatric population. It is an auto-immune disease with auto-antibodies targeting the NMDA-R (Dalmauet al., 2011). A multicentre study in the UK identified anti-NMDA-R en-cephalitis in 4% of patients with encephalitis (Granerod et al., 2010),which usually develops through specific phases (Iizuka et al., 2008).The prodromal phase can entail headache, fever, nausea, vomiting, diar-rhoea, or upper respiratory-tract symptoms. Within 2 weeks, patientsdevelop psychiatric symptoms; ranging from cognitive impairment topsychosiswith delusions andhallucinations. There is often a rapid disin-tegration of language. This disease often progresses with neurologicalsymptoms that can include reduced consciousness, oro-lingual-facialdyskinesia, seizures and dysautonomia. At this stage, the patient oftenrequires treatment in an intensive care unit. The frequency and intensi-ty of seizures usually decrease as the disease evolves; however, changes
or Neuroimaging at UCL — 12
. This is an open access article under
in medication and sedation can trigger status epilepticus at any givenpoint of the disease process (Dalmau et al., 2007). The disease is oftenassociatedwith tumours in the adult population,most often ovarian ter-atomas in female adults. The cause of anti-NMDA-R encephalitis (partic-ularly in the paediatric population), when not associated with tumours,is unknown (Florance et al., 2009). Treatment usually comprises im-mune therapy, together with removal of any coexisting tumour. With-out treatment the disease can improve slowly over several years butrelapses are not uncommon (Iizuka et al., 2008). Seizures are common:in a study of 100 patients with NMDAR-encephalitis 76 had seizures.Most commonly, generalised tonic–clonic seizures followed by focalseizures; however, six patients developed status epilepticus and twodeveloped epilepsia partialis continua. EEG abnormalities are oftenseen in patients, most commonly increased delta activity and mono-morphic appearance of rhythmic delta activity (Dalmau et al., 2008). Itis not uncommon to see “extreme delta brushes”, comprising rhythmicdelta activity with a brush of beta activity (Schmitt et al., 2012).Electrographic seizure activity can sometimes be detected on the EEG.
Electrographic seizure activity is one of the most specific findings inclinical electroencephalography (Daly et al., 2002). However, the under-lying pathophysiology is still poorly understood. Focal seizures typicallyexhibit three phases; initiation, propagation and termination (Schiffet al., 2000). They generally start with low-amplitude fast activity
the CC BY license (http://creativecommons.org/licenses/by/4.0/).

509G.K. Cooray et al. / NeuroImage 118 (2015) 508–519
(Allen et al., 1992; Spencer et al., 1992; Alarcon et al., 1995; Wendlinget al., 2003). This activity corresponds to the “ictal flattening”, some-times seen before seizure onset in the scalp EEG. The cause of this pre-ictal pattern is thought to be caused by disinhibition of pyramidal neu-rons (Wendling et al., 2002), although other studies have suggested thatsynchronization through inhibition is important for the generation oflow-amplitude fast activity at the onset of seizure activity (de Curtisand Gnatkovsky, 2009). During seizure propagation, there is usually atransition to large amplitude activitywith slower oscillatory activity, to-gether with spatial spreading. At this stage, seizure activity becomesmore complicated— beingmediated by a distributed epileptic network.Seizure offset usually entails a slowing of seizure activity and may befollowed by a post ictal phase. Even seizure termination is governedby complex network dynamics that remains poorly understood. It hasbeen suggested that seizures occurwhen there is an imbalance betweenexcitatory and inhibitory conductance (Scharfman, 2007; Schiff andSauer, 2008). Balanced excitation and inhibition in the brain is an im-portant aspect of neuronal processing, enabling fast responses that re-quire less energy consumption, and more efficient informationprocessing (Sengupta et al., 2013; Sengupta and Stemmler, 2014). Ac-tive engagement of gain control mechanisms that maintain this balancemay be compromised in epilepsy (Swann and Rho, 2014). However, it isunclear how this imbalance is related to seizure phenomenology in cor-tical circuits that generally exhibit normal excitatory–inhibitory balance(Soltesz, 2008). In this work, we use dynamic causal modelling withneural mass models to quantify excitation–inhibition balance in termsof intrinsic (within source) connectivity.
Neural massmodels were first conceived byWilson and Cowan usingmean field theory to estimate the average activity of neuronal popula-tions (Wilson and Cowan, 1972, 1973) based on the Hodgkin Huxley de-scription of single neurons. Neuron mass models offer a computationallytractable model of mesoscopic neuronal activity. A particular useful vari-ation of the Wilson and Cowan model was presented by Jansen and Rit,which has been used extensively in modelling different sorts of neuronalactivity, including seizure activity (Jansen and Rit, 1995). The transitionbetween normal and seizure activity has also been modelled in terms ofbifurcations (qualitative changes in neural mass dynamics due to quanti-tative changes inmodel parameters) (Blenkinsop et al., 2012; Breakspearet al., 2006; Grimbert and Faugeras, 2006; Jirsa et al., 2014;Nevado-Holgado et al., 2012). However, multistability has also been pro-posed as an alternative to bifurcations (Benjamin et al., 2012; Lopes daSilva et al., 2003). Bifurcations are induced by changes in one ormore pa-rameters of the neuralmassmodel. Parameterfluctuations during seizureonset has been inferred using a variety of methods, including Kalman fil-ter techniques and genetic algorithms (Blenkinsop et al., 2012; Freestoneet al., 2014; Nevado-Holgado et al., 2012; Schiff and Sauer, 2008; Ullahand Schiff, 2009, 2010; Wendling et al., 2005).
It is usually assumed that the transition fromnormal to seizure activ-ity can be modelled with changes in connectivity between neuronalpopulations (Blenkinsop et al., 2012; Freestone et al., 2014; Wendlinget al., 2002). Moreover, slow changes in ion concentrations have beenshown, both experimentally and computationally, to induce rapidchanges in neuronal dynamics that are formally similar to bifurcations(Bazhenov et al., 2004; Kager et al., 2000; Lewis and Schuette, 1975).Some modelling studies have considered glial cell ion homeostasis andconclude that changes in [K+] and [Na+] are necessary for seizure gen-eration in hippocampal tissue (Ullah and Schiff, 2010). Similarly, theability of extracellular oxygen to induce seizure activity has been veri-fied in vivo and in computational models (Ingram et al., 2014; Weiet al., 2014). Furthermore, dynamical multi-stability has been used tosimulate seizure activity, where [K+] can induce switching between(bistable) states, without the need for bifurcations (Frohlich et al.,2010). Finally, in contrast tomechanisms that are intrinsic to the sourceof seizure activity, several studies have highlighted the importance ofmultistability due to global changes in connectivity, causing both focaland general seizure activity (Benjamin et al., 2012; Terry et al., 2012).
In this paper, we characterise the evolution of seizure activity interms of slow fluctuations in the (synaptic) connectivity among specificneuronal populations that constitute a canonical cortical microcircuit.Crucially, we evaluate these intrinsic changes, while allowing for con-comitant changes in afferent activity from other distributed sources.To do this, we used dynamic causal modelling to analyse seizure activityin a patient with anti-NMDA-receptor encephalitis and attempt to rep-licate the findings in an identical analysis of a second patient.
Dynamic causalmodelling (DCM) is amethod formaking inferencesabout the neuronal architectures that underlie measured time series,such as EEG (Friston et al., 2007). The main constituents of a DCM area model of neuronal dynamics (e.g., a neural mass model) and a mea-surement model (e.g., a classical electromagnetic forward model).DCM has been widely used in neuroscience in modelling fMRI andEEG activity (David et al., 2006, 2008; Moran et al., 2008, 2011a,b,c;Friston et al., 2012). Crucially, several dynamic causal models can beinverted for any given data; enabling the evidence for competingmodels or hypotheses to be evaluated (with Bayesian model compari-son). In contrast to alternative approaches (e.g., Kalman filtering), weapply DCM to spectral density measures of seizure activity. This enablesone to (i) average spectral density measures over multiple seizures;(ii) estimate the spectral density of endogenous neuronal fluctuationswith scale free (non-Markovian) temporal correlations and (iii) esti-mate any changes in these fast fluctuations during seizure onset.Furthermore, DCM allows one to explicitly parameterise the slow fluc-tuations in model parameters (e.g., excitatory and inhibitory connectiv-ity) that contribute to the induction of seizure activity.
DCM has been used recently to model electrocorticography dataduring seizure onset. The authors found that changes in intrinsic con-nectivity were sufficient to explain seizure onset, and that seizure initi-ation was a result of transient loss of excitatory–inhibitory balance(Papadopoulou et al., 2015). This paper extends these findings with amore detailed analysis of non-invasive EEG data from human subjectswith a known and specific pathophysiology of NMDA receptor function.
Materials and methods
Recordings
EEG recordings were obtained retrospectively from two female pa-tients with anti-NMDA-R encephalitis from the database at Clinical Neu-rophysiology at Karolinska University Hospital, Stockholm, Sweden. Bothpatients were treated in intensive care with continuous EEG monitoringusing nine scalp electrodes positioned according to the 10–20 system(F3, F4, C3, C4, Cz, P3, P4, T3 and T4) together with a reference electrodeplaced over Fz. The seizures recorded from patient 1 (age 19 years)started with 20 Hz activity, which reduced in frequency and increasedin amplitude before termination after approximately 10–20 s, see Fig. 1.The seizures were clustered over time and occurred every two to threeminutes. A total of 55 seizures free of artefacts were selected for model-ling. The two seizures recorded from patient 2 (age 31 years) startedwith 10–15 Hz activity with a slow reduction in frequency before termi-nation after approximately 60 s, see Fig. 1. We did not have access tohigher density EEG recordings or invasive recordings as these patientshad seizures only during the acute phase of the disease.
Preprocessing
After acquisition, the data was re-referenced to a common averageand filtered using a bandpass filter (Butterworth 5th order filter) be-tween 0.5 and 70 Hz. Line activity was removed using a notch filter at50 Hz. We used an empirical Bayes beamformer to locate the sourcewith the greatest spectral power during thefirst secondof seizure activityin each patient (Belardinelli et al., 2012). We then reconstructed sourceactivity and this location for further analysis. The time series for each sei-zure was divided into 2000 ms windows without overlap, for both
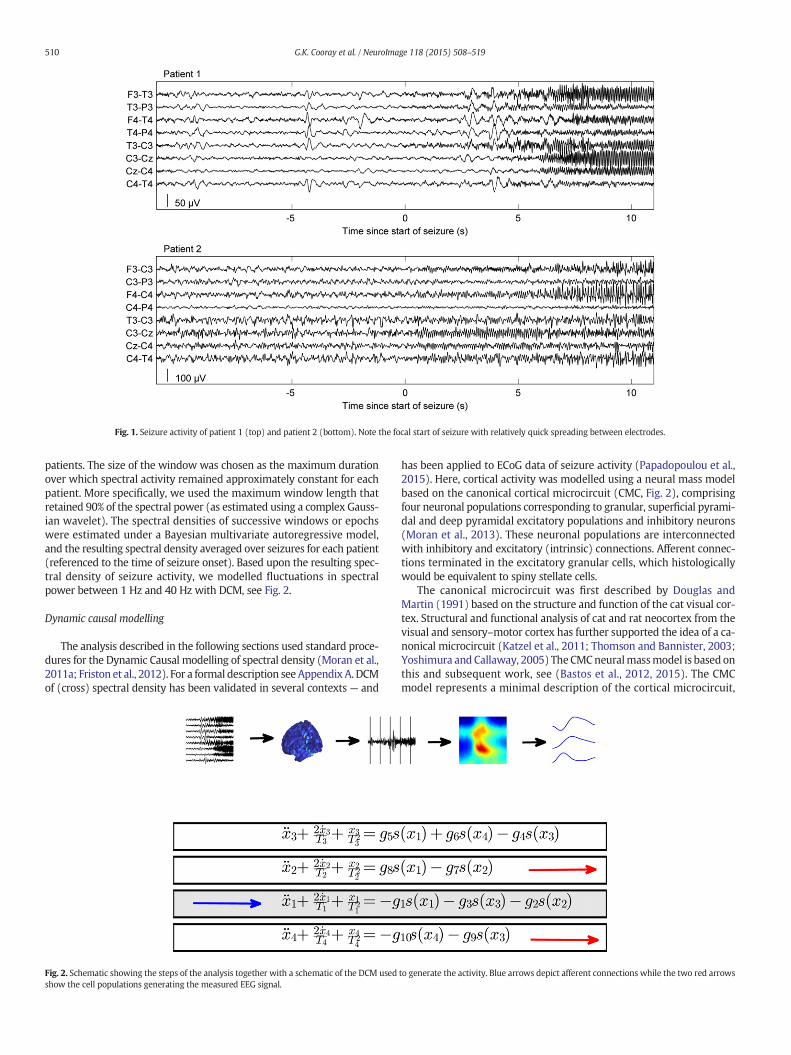
Fig. 1. Seizure activity of patient 1 (top) and patient 2 (bottom). Note the focal start of seizure with relatively quick spreading between electrodes.
510 G.K. Cooray et al. / NeuroImage 118 (2015) 508–519
patients. The size of the window was chosen as the maximum durationover which spectral activity remained approximately constant for eachpatient. More specifically, we used the maximum window length thatretained 90% of the spectral power (as estimated using a complex Gauss-ian wavelet). The spectral densities of successive windows or epochswere estimated under a Bayesian multivariate autoregressive model,and the resulting spectral density averaged over seizures for each patient(referenced to the time of seizure onset). Based upon the resulting spec-tral density of seizure activity, we modelled fluctuations in spectralpower between 1 Hz and 40 Hz with DCM, see Fig. 2.
Dynamic causal modelling
The analysis described in the following sections used standard proce-dures for the Dynamic Causal modelling of spectral density (Moran et al.,2011a; Friston et al., 2012). For a formal description seeAppendix A. DCMof (cross) spectral density has been validated in several contexts — and
Fig. 2. Schematic showing the steps of the analysis together with a schematic of the DCM usedshow the cell populations generating the measured EEG signal.
has been applied to ECoG data of seizure activity (Papadopoulou et al.,2015). Here, cortical activity was modelled using a neural mass modelbased on the canonical cortical microcircuit (CMC, Fig. 2), comprisingfour neuronal populations corresponding to granular, superficial pyrami-dal and deep pyramidal excitatory populations and inhibitory neurons(Moran et al., 2013). These neuronal populations are interconnectedwith inhibitory and excitatory (intrinsic) connections. Afferent connec-tions terminated in the excitatory granular cells, which histologicallywould be equivalent to spiny stellate cells.
The canonical microcircuit was first described by Douglas andMartin (1991) based on the structure and function of the cat visual cor-tex. Structural and functional analysis of cat and rat neocortex from thevisual and sensory–motor cortex has further supported the idea of a ca-nonical microcircuit (Katzel et al., 2011; Thomson and Bannister, 2003;Yoshimura and Callaway, 2005) The CMCneuralmassmodel is based onthis and subsequent work, see (Bastos et al., 2012, 2015). The CMCmodel represents a minimal description of the cortical microcircuit,
to generate the activity. Blue arrows depict afferent connections while the two red arrows

511G.K. Cooray et al. / NeuroImage 118 (2015) 508–519
where neuronal dynamics are represented by generic inhibitory and ex-citatory cell populations; e.g., the effect of fast spiking interneurons richin NMDA-R are represented by a generic inhibitory population(DeFelipe, 1999). In contrast to many neural mass models of corticalsources, the CMC includes two populations of excitatory pyramidalcells, located in superficial and deep cortical layers. These cell popula-tions are the sources of forward and backward extrinsic (between-source) connections respectively (Pinotsis et al., 2014). There is evi-dence that both deep and superficial pyramidal cells are necessary tomodel the full spectrum of cortical activity, where faster activity is gen-erated by the superficial population and slower activity by the deeppopulation (Bastos et al., 2012; Buffalo et al., 2011; Roopun et al.,2006, 2008). In DCM, electrophysiological measurements such as theEEG, are modelled as a mixture of depolarisations in superficial anddeep pyramidal cells, where, a priori, the contribution of deep pyrami-dal cells is optimised with a free parameter in relation to the (predom-inant) contribution from superficial populations.
Formally, the generative model of neuronal activity comprised eightcoupled non-linear first order ordinary differential equations with delays(see Appendix A). This model is similar to that of Jansen and Rit (Jansenand Rit, 1995) but augmented to include four populations per source(and anatomically plausible intrinsic connectivity among the sources).The parameters of DCMs include intrinsic connection strengths, synaptictime constants, delays and parameters of the activation functions relatingmean depolarisation to firing rates.
NMDA-R antibodies have been shown to target NMDA-R throughoutthe cortex – affecting both excitatory and inhibitory neurons –with a de-crease in inhibitory synaptic density on excitatory neurons (Moscatoet al., 2014). To model this, we equipped our with separate excitatoryand inhibitory gain parameters, where gain corresponds to the sensitivityof a neuronal subpopulation to excitatory or inhibitory input. Crucially,the intrinsic connections from the inhibitory population were allowedto change during seizure onset and their evolution was modelled usinga discrete cosine basis set with 8 components (over successive timewin-dows of seizure activity, seeAppendixA). These connectionswere chosentomodel GABAergic tone; noting that certain fast spiking inhibitory inter-neurons such as chandelier cells andbasket cells expressNMDAreceptorsand preferentially target the source of EEG signal (principally, the super-ficial pyramidal cells) (Goldberg et al., 2003; Kawaguchi and Kubota,1993). Similarly, all three excitatory intrinsic connections were allowedto change during seizure activity (Table 1). Note that all parameters ofthe afferent input were allowed to change with time giving the modelfull flexibility in modelling non-local input (see Appendix A). Themethods used in this study for estimating inhibitory and excitatory
Table 1(Free) Parameters estimated by dynamic causal modelling. The second column describes the p
Parameters estimated Notation
Constant parametersTime constants (Hz) Ti, i = 1,Connectivity constants (Hz) gi, i = 1,Slope of sigmoid function γTime delay for connections (ms) d
Time dependent parametersConnectivity parameters
Inhibitory (Hz) g3(t)Inhibitory (Hz) g4(t)Inhibitory (Hz) g9(t)Excitatory (Hz) g5(t)Excitatory (Hz) g6(t)Excitatory (Hz) g8(t)
Endogenous spectral inputAmplitude of spectral density of input a1(t)Power law exponent of spectral density of input a2(t)Amplitude of spectral density of measurement noise b1(t)Power law exponent of spectral density of measurement noise b1(t)Spectral innovation of input di(t), i =
connectivity have been previously validated in several studies, whereLFP recordings have been measured together with pharmacological ma-nipulations or with micro-dialysis measurements of extracellular gluta-mate levels (Moran et al., 2011a,b).
Model inversion and comparison
The parameters of themodel were estimated followingmodel inver-sion. The inversionwas performed using a standard variational Bayesianscheme (Variational Laplace) under the Laplace approximation; i.e., thepriors and posteriors were assumed to be Gaussian probability distribu-tions (Friston et al., 2007). Effectively, inversion means finding themodel parameters that maximise Bayesian model evidence. This auto-matically penalises complex models, because the model evidence com-prises an accuracy and complexity term — the model with the greatestevidence is the simplest model that provides an accurate explanationfor the data. Model inversion approximates the model evidence with aquantity called variational free energy (Appendix A; Friston et al.,2007). The variational free energy can then be used to compare compet-ing models in terms of their probability is given the data. This is knownas Bayesian model comparison (Stephan et al., 2010). Eight modelswere inverted (compared) for each patient, where different sets of pa-rameters (intrinsic connections) were allowed to change over time —as shown in Fig. 3. These ranged from models in which nearly all con-nections could change (model 7) to a null model that precluded anychanges over time windows (model 8). More specifically, we allowedfor all possible combinations of changes in excitatory connections, in-hibitory connections, and the parameters of the (power law) spectraldensity of afferent input from other sources.
Summary
In summary, seizures were identified from the EEG recordings andepileptogenic sources were localised using a standard beamformingtechnique. The seizure activity at this source was used for subsequentDCM. The seizure activity was windowed and the spectral activity esti-mated in each window. We then used a neural mass model to generatethe spectral activity of the underlying source by allowing slow fluctua-tions in excitatory and inhibitory (intrinsic) connections, while alsoallowing for changes in afferent activity from other parts of the brain.We used variational Laplace to estimate the ensuing model parametersfor a set ofmodels with andwithout changes in various parameters. Theresulting model evidence was used to compare different models of sei-zure activity and identify the best explanation of observed seizure
rior values and the third the log variances.
Prior mean Log prior variance
…, 4 [0.25 0.17 0.08 0.07] ∗ 1000 0.06252, 7, 10 [0.8, …, 0.2] ∗ 1000 0.0625
0.67 0.031251 0.03125
1.6 ∗ 1000 0.06250.8 ∗ 1000 0.06250.4 ∗ 1000 0.06250.8 ∗ 1000 0.06250.4 ∗ 1000 0.06250.8 ∗ 1000 0.0625
1 0.00781251 0.00781251 0.00781251 0.0078125
1, …, 8 1 0.0078125

Fig. 3. Eight models were inverted for each patient. Each sourcemodel comprised four neuronal populations representing different cell types from distinct cortical layers: excitatory gran-ular cells, superficial and deep pyramidal cells and inhibitory interneurons. These cells were interconnected using 10 connections (not drawn in for clarity). Six of these connectionswereallowed to change over time tomodel changes in EEG spectra during the seizure. Only connections that were allowed to change are shown. All three connections from the inhibitory cellsare marked in blue. All excitatory connections are marked in red. The spectral input marked in black was also allowed to vary in time. Model 7 – allowing changes in all three sets of pa-rameters – was the most likely.
512 G.K. Cooray et al. / NeuroImage 118 (2015) 508–519
activity. Data preprocessing and modelling were performed using theacademic freeware SPM12 (http://www.fil.ion.ucl.ac.uk/spm/).
Results
The seizure activity of the first patient comprised low amplitude20 Hz activity, which reduced in frequency to approximately 10 Hzbut increased in amplitude. After 10–20 s the seizure terminated. Sei-zure activity was most prominent over the temporal region on the leftside, although it showed a rapid and partial spread. In the second pa-tient, seizure activity was manifest as 10–15 Hz activity with a slowerreduction in frequency to about 5 Hz, accompanied by a slow increasein amplitude. The seizures terminated after approximately 60 s. Seizureactivity was prominent over the central region but spread relativelyquickly to several electrodes bilaterally. See Figs. 1 and 4 for time andtime–frequency plots of seizure activity from the two patients.
Eight competingmodelswere inverted for each patient; each allowingfor different combinations of changes in inhibitory and excitatory intrinsic
connectivity (and afferent input): see Fig. 3. The model with highest evi-dence (free energy) for both patients allowed for changes in both inhibi-tory and excitatory (i.e., GABA and NMDA dependent) connectivitytogether with changes in endogenous afferent input (i.e., the fullmodel). The null models with no changes in model parameters werefound to be least likely. Crucially, these results were exactly the samefor both patients. The bestmodel explainedmore than 97%of the variancein patient 1 and 95% in patient 2, see Table 2. The difference in log evi-dences (free energy) between the winning model and the next bestmodel exceeded 10 in both cases. A difference of three is consideredstrong evidence in favour of the winning model (and corresponds to anodds ratio of about 20:1).
The time course of inhibitory and excitatory connectivity and theirbalance (difference) showed systematic and similar changes during sei-zure activity; see Fig. 5. Seizure onset was induced by a transient in-crease in inhibitory connectivity followed by a transient increase inexcitatory activity and a final peak in excitatory–inhibitory balance dur-ing seizure termination. Inversion of individual seizures showed similar

Fig. 4.A). The top image illustrates the time frequency profile of observed seizure activity for patient 1 and the lower image illustrates the predicted time frequency plot after estimating theparameters of the DCM. Note the decrease in frequency as the seizure progresses. B). Similar illustration for patient 2. Note the difference in frequency content compared to patient 1 butthe similar decrease in frequency over time.
513G.K. Cooray et al. / NeuroImage 118 (2015) 508–519
results to the inversion of the averaged seizure (time frequency) activ-ity. We also characterised source activity during 5 min of pre- andpost-seizure activity, where the EEG showed no clear spectral changesand where the fluctuations in intrinsic connectivity (estimated underthe full model) were almost negligible: see Fig. 6.
The overall effects of these changes in synaptic efficacy correspondto a disruption of excitatory–inhibitory balance during the seizure. Toquantify the effect on each of the four populations, the predicted spec-tral activity of each population was reconstructed under the expectedparameters of the best model. The ensuing time frequency response isshown in Figs. 7A and B, for the first and second patient respectively.It can be seen that there was an increase in spectral activity of all celltypes during the seizure, with the superficial pyramidal cells showinga transient increase within a broad frequency range at seizure onset,while the inhibitory and deep pyramidal cells showed activity withina more narrow frequency range, which decreased in average frequencyas the seizure progressed. In thewinningmodel, the input to the corticalsource (a summary of all subcortical and cortical afferents), was
Table 2The variance described and the free energy for the different models inverted for each pa-tient. Note that the winning model (highest free energy) also had the best fit and thesewere the same models for both patients. The free energies are expressed relative to thenull model.
Model Patient 1 Patient 2
Varianceexplained
Freeenergy
Varianceexplained
Freeenergy
Inhibitory + excitatory + endogenous 0.97 1430 0.95 1740Inhibitory + excitatory 0.97 1380 0.94 1650Inhibitory + endogenous 0.97 1320 0.94 1600Excitatory + endogenous 0.96 1310 0.94 1680Inhibitory 0.90 860 0.91 1130Excitatory 0.91 1010 0.92 1460Endogenous 0.91 950 0.91 1230Null 0.50 0 0.75 0
modelled as coloured noise (with spectral features) and was alsoallowed to change during the seizure activity. The time frequency pro-file of this afferent input is illustrated in Figs. 8A and B. It can be seenthat there was an increase in the amplitude and a change in the spec-trum of afferent input during the seizure, suggesting a distributed epi-leptogenic process beyond the source that was modelled explicitly.
Summary
In summary, we found remarkable similarities between the explana-tions for seizure activity in both patients, regarding changes in the under-lying cortical intrinsic connectivity. In general, these changes involvedincreases in the amplitude and changes in the spectrum of afferent(endogenous) activity, together with dissociable changes in inhibitoryand excitatory intrinsic connectivity and their balance; peakingsuccessively during seizure activity. Furthermore, model comparisonrevealed the contribution of changes in both excitatory and inhibitoryconnectivity— in addition to the afferent input from subcortical and cor-tical structures; suggesting the importance of distributed network dy-namics in seizure initiation and maintenance.
Discussion
In effect, we used DCM as a virtual microscope to track the changes incortical dynamics during epileptic seizures registered with scalp EEGfrom two patients with anti-NMDA-R encephalitis. This allowed us toinfer activityof the constituent cell populations inepileptogenic sources—and the underlying changes in connectivity and afferent input subtendingthis activity. Our results indicated an increase in activity of all cell typesduring seizure activity. Furthermore, we identified systematic changesin inhibitory and excitatory connectivity — suggesting a disruption ofexcitatory–inhibitory balance during seizure activity. This is, to ourknowledge, the first time that cortical dynamics of seizure activity in-duced by anti-NMDA encephalitis has been inferred quantitatively fromnon-invasive EEG data.

Fig. 5. Changes in inhibitory and excitatory connectivity and their associated balance (difference). The parameters are shown as log scaling parameters. The first column shows changesinferred from average seizure activity and the second column shows themean of connectivity changes (±2 standard deviations) inferred from individual seizures for patient 1. The thirdand fourth column shows changes for patient 2, note that the standard deviationwere not calculated for patient 2, as therewere only two seizures. Note the peaks in activity occurring firstfor inhibitory activity followed by excitatory activity followed by excitatory-inhibitory balance (red and pink arrows).
514 G.K. Cooray et al. / NeuroImage 118 (2015) 508–519
Increased disinhibition has been previously suggested as a possiblecause of epileptic seizures (Wendling et al., 2002); however, several in-vivo and in-vitro studies have shown that there is sustained inhibitory ac-tivity during seizures and that disinhibition may not be necessary for
Fig. 6. The top row illustrates electrographic activity for fiveminutes before and after seizure iniThe lower row shows similar results for patient 2. Note the absence of changes inferred during
seizure generation (Dailey et al., 1989). In this study, we see amore com-plex picture, where we found a sequential peaking of inhibitory connec-tivity, excitatory connectivity and finally excitatory–inhibitory balance.The net effect on each of the main four cell types within cortical sources
tiation for patient 1, together with inferred changes in connectivity (under the full model).seizure activity.

Fig. 7. A). Time–frequency responses of each cell type in the canonical microcircuit model for patient 1. There is a general increase in activity of all four cell types during seizure activity.Superficial pyramidal cells show an early increase in spectral activity, with a subsequent slower reduction; while the inhibitory and deep pyramidal cells show amore sustained increase.B). Similar results for Patient 2 show a similar transient increase in superficial pyramidal activity and a more sustained response in the inhibitory cells.
515G.K. Cooray et al. / NeuroImage 118 (2015) 508–519
suggest an increase in activity but a decreasing frequency of the deep py-ramidal cells activity as the seizure progressed. The exact timing of the ac-tivation of each cell type is controlled by slow fluctuations in the intrinsicconnections to and from the input (granular or spiny stellate population).
Fig. 8.A). Spectral input for patient 1. Note that there is an increase in spectral activity during thend of the seizure.
At seizure onset, we see increased activity in the superficial pyramidalcells, which convey mainly fast (beta and low gamma band) activity to-gether with a slightly prolonged activation of deep pyramidal cells,which show slower activity (alpha and theta band). This was more
e seizure. B). Similar results for Patient 2 shows an increase in spectral activity towards the

516 G.K. Cooray et al. / NeuroImage 118 (2015) 508–519
pronounced in the first patient, where there is a greater change in fre-quency during the seizure. This change of activation from superficiallayers of the cortex to deeper (infragranular) layersmight be a ubiquitousfeature of seizure activity— as a decrease in themain oscillatory frequen-cy is characteristic of seizure activity. This electrophysiological patternhas also been termed the brain chirp (Schiff et al., 2000).
We were able to ask, using Bayesian model comparison, whetherseizure activity originating from the epileptogenic source dependedon other regions of the brain or not. Model comparison suggested thatseizure activity was indeed dependent on other subcortical or corticalregions. However, this time varying spectral input was not sufficientto explain seizure activity — as changes in intrinsic connectivity wasnecessary to explain changes in spectral activity (and thedifferent activ-ity profiles of superficial and deep pyramidal populations). Thesefluctu-ations in intrinsic connectivity can be thought of as changes in synapticgain. Changes in gain can be mediated by various biophysical and bio-chemical mechanisms, such as membrane-potential dependent ionchannels conductance or changes in ion concentrations. The effects ofintra and extracellular ion concentrations have been associated withthe generation of seizures in vivo and in vitro (Frohlich et al., 2010;Ingram et al., 2014). Experimental and computational studies speak tothe importance of ionic homeostasis and several models have includedglial cell physiology in this context (Frohlich et al., 2010; Ullah et al.,2009). As epileptic seizures are sometimes prolonged – and can lastfor minutes or hours – there is also a possible role for short and long-term receptive plasticity. Furthermore, seizures are not physiologicalevents and may affect neuronal dynamics pathologically through ener-gy (ATP) or oxygen depletion, which has been shown in vivo (Ingramet al., 2014; Wei et al., 2014). In short, further modelling of ionic andsynaptic homeostasis might be necessary to understand the detailedcauses of the slow parameter variations of the sort seen in the study.
Several studies have shown that it is possible to estimate synapticparameters using inversion schemes based on extended and unscentedKalman filters but also using alternative methods like multi-objectivegenetic algorithms (Freestone et al., 2014; Nevado-Holgado et al.,2012; Schiff and Sauer, 2008; Ullah and Schiff, 2010). It is importantto appreciate that the DCM scheme used here is formally distinct fromfiltering schemes. This is because the data features used by DCM hereare not the timeseries but their spectral density. Effectively, this enablesDCM to parameterise the second order statistics of endogenous fluctu-ations generating seizure activity. In our case, we used a mixture ofscale free dynamics (specified with a 1/f form in frequency space) andother coloured components we attribute to fast neuronal fluctuationsin afferent input from other sources. This means that we do not haveto estimate hidden neuronal states (as in Bayesianfiltering) but can for-mulate the inverse problem purely in terms of unknownmodel param-eters. Furthermore, inverting models based upon spectral responsesenables one to average over multiple seizures to provide a computa-tionally efficient summary of seizure activity.
Biological considerations suggest dysfunction in both excitatory andinhibitory synaptic activity, as these synaptic connections are affected inanti NMDA-R encephalitis (Moscato et al., 2014). We thereforemodelled fluctuations in the intrinsic gain of excitatory and inhibitoryconnectivity. It is possible that several excitatory (and inhibitory) con-nections could change independently during seizure onset; in principle,this can be addressed using Bayesian model comparison. Note that in-troducing more free (changes in intrinsic connectivity) parameterswould increase the accuracy of the fits but may reduce model evidenceby incurring a large complexity cost. In this paper, we used a parsimoni-ous model of gain fluctuations, because our focus was on changes in in-trinsic connectivity, relative to changes in extrinsic afferents.
In this studywe focused on the temporal dynamics of seizure activitybut not its spatial dynamics. The (pragmatic) reason for this was thesparse set of electrodes used for recording the seizure. We used a low-density setup, as these patients were being treated in an intensive careunit and the clinical indication for EEG was to detect the presence of
seizure activity (not source localisation).Wewere able, by visual analysisof the EEG, to determine that the seizures were focal. This observationwas used to motivate a single (epileptogenic) source model. The mainreason for reconstructing distributed seizure activity (including sourcelocalisation) is to delineate the seizure onset zone in cases of pre-surgical evaluation of patients with refractive epilepsy. Usually this is ac-complished with high-density recordings. In the future, we hope tomodel seizure activity recorded with high density EEG and apply similarmethods using DCM to obtain amore comprehensive characterisation ofthe spatiotemporal dynamics.
Recently, a canonical (Epileptor) model of epileptic seizure activitywas presented, which provided a formal taxonomy of seizure activityin terms of bifurcations (Jirsa et al., 2014; Proix et al., 2014). The onsetand offset of seizure activity were described as saddle node andhomoclinic bifurcations, respectively. Predictions of inter spike timingand direct current shifts associated with seizure onset and offset werealso confirmed in vitro. This Epileptormodel uses coupling between dy-namics at different time scales — such that bifurcations can be inducedby slowly varying neuronal states. In the present study no dynamicalmodel was used for the slow fluctuations of synaptic parameters, onlysmoothness constraints were imposed. In a forthcoming study we willconsider biophysically plausible DCMs in which slow parametric varia-tions depend on the fast activity of the hidden states, based on activitydependent plasticity.
We assumed fluctuations in synaptic efficacy were at least one time-scale slower than EEG activity. This prior assumption was imposed usingsmooth temporal (discrete cosine) basis functions to model changes inparameters (see Appendix A). This procedure requires the whole dataset to be inverted at once, which is computationally intensive but practi-cally possible, if a small number of cortical sources are modelled. Whenanalysing a more realistic dataset (with several sources of an epilepticnetwork) model inversion can become computationally intractable. Inthis setting, Bayesian belief updating, may provide a more efficientscheme for estimating slowly varying parameters, where estimates areupdated from epoch or window to window. This form of updating is for-mally similar to the Kalmanfilter techniques used in other studies to inferparameter dynamics from non-invasive and invasive recordings (Schiffand Sauer, 2008; Ullah and Schiff, 2010). If the generative model is verynon-linear other techniques can be used such as genetic algorithms ornumerical continuation procedures for bifurcations analysis (Blenkinsopet al., 2012; Nevado-Holgado et al., 2012). Finally, Generalised Filteringis a recently described Bayesian filtering scheme that allows for estima-tion of slowly varying parameters, which has already been used to esti-mate hidden states and parameters in fMRI analysis (Friston et al.,2010). In a forthcoming study, we will compare the analysis describedabove with computationally efficient Bayesian belief updating schemes.These might provide accurate and efficient schemes for the inversion oflarger epileptic networks.
Conclusion
With DCMwewere able to infer the cortical pathophysiology of sei-zure activity from two patients with anti-NMDA-R encephalitis record-ed in a clinical setting. We found distinctive changes in excitatory–inhibitory balance were necessary to explain observed seizure activityand that these changes were conserved over seizures. The same patternof changes was observed in a second patient with the same seizureaetiology. We hope to model an extended group of patients to seewhether our findings generalise and further characterise the mecha-nisms of seizure activity in anti-NMDA-R encephalitis.
Funding
This work was supported by the Wellcome Trust (088130/Z/09/Z)and a postdoctoral scholarship from the Swedish Brain Foundation

517G.K. Cooray et al. / NeuroImage 118 (2015) 508–519
(Hjarnfonden, PS2013/0017) to GC. BS and KJF are funded by aWellcome Trust Principal Research Fellowship (088130/Z/09/Z).
Acknowledgements
This work wasmade possible due to the excellent work by the tech-nical and clinical staff at the Department for Clinical Neurophysiology atKarolinska University Hospital, Stockholm, Sweden.
Appendix A
A.1. Canonical microcircuit model
The canonical microcircuit represents the activity of a cortical sourceand comprises four populations of cells that are assigned to variouslayers in the cortex. Each cell type is represented by a critically dampedharmonic oscillator driven by connections from other populationswith-in the source and through extrinsic connections from other sources(with a delay for transmission between cell types, δ), see Fig. 2. The neu-ronal dynamics are given by,
d2X!
dt2þ 2T−1 dX
!dt
þ T−2X!¼ U
!þ g S!
X!� �
A1:1
• X!
is a 4 × 1 vectorwhere the i-th element represents themean poten-tial of the i-th population.
• T is a 4 × 4 diagonal matrix containing the time constants of the fourpopulations.
• U!
is a 4 × 1 vector of afferent input to the i-th population δ on: here,just the first.
• g is a 4 × 4 matrix of intrinsic connections along the four popula-tions, excitatory connections are positive while inhibitory connec-tions are negative.
• S!
X!� �
is a 4 × 1 sigmoid vector function of mean potential that
models the firing rate of the population; i.e.,
Si X!� �
¼ Sigm X!
tð Þ� �
¼ tanh γ X!
t−δð Þ� �
A1:2
Where δmodels the conduction delays and γmodels the sensitivityof neuronal firing to depolarisation.
See Table 1 for definition of parameters. In the current model, ten ofthe intrinsic connectivity gains gij were nonzero. The predicted re-sponse, y (the activity of the virtual electrode), is given by:
y ¼ CTX!
A1:3
where C is 4 × 1 vector describing the leadfield of each subpopulation inthe cortex, in the current model, C is a weighted sum of the membranepotentials of the two pyramidal cell populations.
A.2. Transfer functions
We are interested in modelling the perturbations of this systemaround its fixed point induced by exogenous input. Under local linearassumptions, one can write Eq. (A1.1) in normal form; i.e., as a linearfirst order differential system:
dX!dt
¼ JX!þ U
!A2:1
J is the Jacobian of the operator mapping the neuronal states to their
time-derivatives and X!
is now a 8 × 1 vector. The Laplace transform ofEqs. (A1.3) and (A2.1), together a re-arrangement furnishes the transfer
function mapping the exogenous input to the spectral output of thesource.
~y ¼ H sð Þ ¼ CT sI− Jð Þ−1 eU! A2:2
The tilde sign is used to denote the Laplace transform. The transferfunction H(s) will depend on the parameters of the model through theJacobian J and the parameterised exogenous input, which means thatthe spectral output is a function of model parameters θ.
~y ¼ H θ; sð Þ A2:3
See Moran et al. (2011a,b,c) and Friston et al. (2012) for further de-tails. The spectral density of the input is modelled as 1/f noise with am-plitude and power law parameters together with a parameterisedspectral innovation. The spectral innovation was parameterised usinga discrete cosine set of order 8. Channel-specific measurement noisewas modelled as 1/f noise with amplitude and power law parameters.
A.3. Changes in parameters
Three of the (g3, g4, g9) representing inhibitory connections andthree excitatory connections (g5, g6, g8) were allowed to change withtime, as were the parameters of the (power law) spectral density ofafferent input, see Table 1. As we wanted to infer slow changes overtime we approximated this variation using a truncated series of cosinefunctions.
gi tð Þ ¼ giΓ inh tð Þ; i ¼ 3;4;9 A3:1
gi tð Þ ¼ giΓexc tð Þ; i ¼ 5;6;8 A3:2
The time course of changes Γi(t), i= inh, exc, was parameterised as adiscrete cosine set of order 8. Similar equations were used for parame-ters determining the spectral input.
A.4. Model inversion and variational free energy
Model inversion corresponds to optimising variational free energywith respect to an approximate posterior over the unknown model pa-rameters. For more details on the following see (Friston et al., 2007).Variational free energy, F, is defined as the difference between the evi-dence for a model and the Kullback–Leibler divergence (DKL) betweenthe approximating posterior, q(θ), and the true posterior.
F qð Þ ¼ log p ~yjmð Þ−DKL q θð Þjjp θj~yð Þð Þ A4:1
Note that for any pair of probability distributions, q and p,DKL(q||p) ≥ 0, with equality only when the distributions are identical.The free energy evaluated at any given q is less than the evidence forthemodel. Thismeans that bymaximising Fwith respect to the approx-imate posterior, one can evaluate a lower bound for the evidence, while(at the same time)minimising the difference between the approximateand true posteriors. Note that the sign of the variational free energyused here is opposite to the definition used in the physics literature.
A.5. Variational Laplace
The free energy can be written as the difference between theexpected energy and the entropy of the variational parameterdistribution.
F ¼ log p ~yj θ!ð Þð Þh iq þ log p θ!� �� �D E
q− log q θ
!� �� �D Eq: A5:1
The first two terms represent the expected energy. Under the La-place assumption that the approximate posterior is Gaussian with

518 G.K. Cooray et al. / NeuroImage 118 (2015) 508–519
mean and covariance (μ, Σ), the expected energy can be expressed asfollows (ignoring constants).
L μð Þ ¼ −12εTΠε−
12εθ
TΠθεθ þ 1
2log Πj j A5:2
• μ is the mean of the approximate posterior• ε = ỹ(s) − H(μ, s) is the prediction error• εθ = μ − μθ is the difference between the posterior and prior mean.• Π is the precision of sampling errors• Πθ is the precision (inverse covariance) of the prior distribution.
The free energy is maximised by performing a gradient ascent onEq. (A5.2). At convergence themeanof theposterior is retrieved. Finally,theposterior covariance is estimated from theHessian of the inverse en-ergy at its mean.
∑−1i j ¼ −
∂2L μð Þ∂θi∂θ j
A5:3
References
Alarcon, G., Binnie, C.D., Elwes, R.D., Polkey, C.E., 1995. Power spectrum and intracranialEEG patterns at seizure onset in partial epilepsy. Electroencephalogr. Clin.Neurophysiol. 94 (5), 326–337.
Allen, P.J., Fish, D.R., Smith, S.J., 1992. Very high-frequency rhythmic activity during SEEGsuppression in frontal lobe epilepsy. Electroencephalogr. Clin. Neurophysiol. 82 (2),155–159.
Bastos, A.M., Usrey,W.M., Adams, R.A., Mangun, G.R., Fries, P., Friston, K.J., 2012. Canonicalmicrocircuits for predictive coding. Neuron 76, 695–711.
Bastos, A.M., Litvak, V., Moran, R., Bosman, C.A., Fries, P., Friston, K.J., 2015. A DCM study ofspectral asymmetries in feedforward and feedback connections between visual areasV1 and V4 in the monkey. NeuroImage 104, 460–475.
Bazhenov, M., Timofeev, I., Steriade, M., Sejnowski, T.J., 2004. Potassium model for slow(2–3 Hz) in vivo neocortical paroxysmal oscillations. J. Neurophysiol. 92, 1116–1132.
Belardinelli, P., Ortiz, E., Barnes, G., Noppeney, U., Preissl, H., 2012. Source reconstructionaccuracy of MEG and EEG Bayesian inversion approaches. PLoS One 7, e51985.
Benjamin, O., Fitzgerald, T.H., Ashwin, P., Tsaneva-Atanasova, K., Chowdhury, F.,Richardson, M.P., Terry, J.R., 2012. A phenomenological model of seizure initiationsuggests network structure may explain seizure frequency in idiopathic generalisedepilepsy. J. Math. Neurosci. 2, 1.
Blenkinsop, A., Valentin, A., Richardson, M.P., Terry, J.R., 2012. The dynamic evolution offocal-onset epilepsies — combining theoretical and clinical observations. Eur.J. Neurosci. 36, 2188–2200.
Breakspear, M., Roberts, J.A., Terry, J.R., Rodrigues, S., Mahant, N., Robinson, P.A., 2006. Aunifying explanation of primary generalized seizures through nonlinear brain model-ing and bifurcation analysis. Cereb. Cortex 16, 1296–1313.
Buffalo, E.A., Fries, P., Landman, R., Buschman, T.J., Desimone, R., 2011. Laminar differencesin gamma and alpha coherence in the ventral stream. Proc. Natl. Acad. Sci. U. S. A. 108,11262–11267.
Dailey, J.W., Reigel, C.E., Mishra, P.K., Jobe, P.C., 1989. Neurobiology of seizure predisposi-tion in the genetically epilepsy-prone rat. Epilepsy Res. 3 (1), 3–17.
Dalmau, J., Tuzun, E., Wu, H.Y., Masjuan, J., Rossi, J.E., Voloschin, A., et al., 2007.Paraneoplastic anti-N-methyl-D-aspartate receptor encephalitis associatedwith ovar-ian teratoma. Ann. Neurol. 61 (1), 25–36.
Dalmau, J., Gleichman, A.J., Hughes, E.G., Rossi, J.E., Peng, X., Lai, M., et al., 2008. Anti-NMDA-receptor encephalitis: case series and analysis of the effects of antibodies.Lancet Neurol. 7 (12), 1091–1098.
Dalmau, J., Lancaster, E., Martinez-Hernandez, E., Rosenfeld, M.R., Balice-Gordon, R., 2011.Clinical experience and laboratory investigations in patients with anti-NMDAR en-cephalitis. Lancet Neurol. 10 (1), 63–74.
Daly, D.D., Pedley, T.A., Ebersole, J.S., 2002. Current Practice of Clinical Electroencephalog-raphy. In: Ebersole, J.A. (Ed.), 3rd revised edition (1 Dec. 2002) (ISBN-10:0781716942, ISBN-13: 978-0781716949) Lippincott Williams and Wilkins.
David, O., Kiebel, S., Harrison, L., Mattout, J., Kilner, J., Friston, K., 2006. Dynamic causalmodeling of evoked responses in EEG and MEG. NeuroImage 30, 1255–1272.
David, O., Guillemain, I., Saillet, S., Reyt, S., Deransart, C., Segebarth, C., et al., 2008. Identi-fying neural drivers with functional MRI: an electrophysiological validation. PLoS Biol.6 (12), 2683–2697.
de Curtis, M., Gnatkovsky, V., 2009. Reevaluating themechanisms of focal ictogenesis: therole of low-voltage fast activity. Epilepsia 50 (12), 2514–2525.
DeFelipe, J., 1999. Chandelier cells and epilepsy. Brain 122 (Pt 10), 1807–1822.Douglas, R.J., Martin, K.A., 1991. A functional microcircuit for cat visual cortex. J. Physiol.
440, 735–769.
Florance, N.R., Davis, R.L., Lam, C., Szperka, C., Zhou, L., Ahmad, S., et al., 2009. Anti-N-methyl-D-aspartate receptor (NMDAR) encephalitis in children and adolescents.Ann. Neurol. 66 (1), 11–18.
Freestone, D.R., Karoly, P.J., Nesic, D., Aram, P., Cook, M.J., Grayden, D.B., 2014. Estimationof effective connectivity via data-driven neural modeling. Front. Neurosci. 8, 383.
Friston, K., Mattout, J., Trujillo-Barreto, N., Ashburner, J., Penny, W., 2007. Variational freeenergy and the Laplace approximation. NeuroImage 34 (1), 220–234.
Friston, K., Stephan, K., Li, B., Daunizeau, J., 2010. Generalisedfiltering.Math. Probl. Eng. 34.Friston, K.J., Bastos, A., Litvak, V., Stephan, K.E., Fries, P., Moran, R.J., 2012. DCM for
complex-valued data: cross-spectra, coherence and phase-delays. NeuroImage 59(1), 439–455.
Frohlich, F., Sejnowski, T.J., Bazhenov, M., 2010. Network bistability mediates spontaneoustransitions between normal and pathological brain states. J. Neurosci. 30,10734–10743.
Goldberg, J.H., Yuste, R., Tamas, G., 2003. Ca2+ imaging of mouse neocortical interneuronedendrites: contribution of Ca2+-permeable AMPA and NMDA receptors to subthresh-old Ca2+ dynamics. J. Physiol. 551, 67–78.
Granerod, J., Ambrose, H.E., Davies, N.W., Clewley, J.P., Walsh, A.L., Morgan, D., et al., 2010.Causes of encephalitis and differences in their clinical presentations in England: amulticentre, population-based prospective study. Lancet Infect. Dis. 10 (12),835–844.
Grimbert, F., Faugeras, O., 2006. Bifurcation analysis of Jansen's neuralmassmodel. NeuralComput. 18, 3052–3068.
Iizuka, T., Sakai, F., Ide, T., Monzen, T., Yoshii, S., Iigaya, M., et al., 2008. Anti-NMDA recep-tor encephalitis in Japan: long-term outcome without tumor removal. Neurology 70(7), 504–511.
Ingram, J., Zhang, C., Cressman, J.R., Hazra, A., Wei, Y., Koo, Y.E., Ziburkus, J., Kopelman, R.,Xu, J., Schiff, S.J., 2014. Oxygen and seizure dynamics: I. Experiments. J. Neurophysiol.112, 205–212.
Jansen, B.H., Rit, V.G., 1995. Electroencephalogram and visual evoked potential generationin a mathematical model of coupled cortical columns. Biol. Cybern. 73 (4), 357–366.
Jirsa, V.K., Stacey, W.C., Quilichini, P.P., Ivanov, A.I., Bernard, C., 2014. On the nature of sei-zure dynamics. Brain 137, 2210–2230.
Kager, H., Wadman, W.J., Somjen, G.G., 2000. Simulated seizures and spreading depres-sion in a neuron model incorporating interstitial space and ion concentrations.J. Neurophysiol. 84, 495–512.
Katzel, D., Zemelman, B.V., Buetfering, C., Wolfel, M., Miesenbock, G., 2011. The columnarand laminar organization of inhibitory connections to neocortical excitatory cells.Nat. Neurosci. 14, 100–107.
Kawaguchi, Y., Kubota, Y., 1993. Correlation of physiological subgroupings of nonpyramidalcells with parvalbumin- and calbindinD28k-immunoreactive neurons in layer V of ratfrontal cortex. J. Neurophysiol. 70, 387–396.
Lewis, D.V., Schuette, W.H., 1975. NADH fluorescence and [K+]o changes during hippo-campal electrical stimulation. J. Neurophysiol. 38, 405–417.
Lopes da Silva, F.H., Blanes, W., Kalitzin, S.N., Parra, J., Suffczynski, P., Velis, D.N., 2003. Dy-namical diseases of brain systems: different routes to epileptic seizures. IEEE Trans.Biomed. Eng. 50, 540–548.
Moran, R.J., Stephan, K.E., Kiebel, S.J., Rombach, N., O'Connor, W.T., Murphy, K.J., et al.,2008. Bayesian estimation of synaptic physiology from the spectral responses of neu-ral masses. NeuroImage 42 (1), 272–284.
Moran, R.J., Jung, F., Kumagai, T., Endepols, H., Graf, R., Dolan, R.J., et al., 2011a. Dynamiccausal models and physiological inference: a validation study using isoflurane anaes-thesia in rodents. PLoS One 6 (8), e22790.
Moran, R.J., Mallet, N., Litvak, V., Dolan, R.J., Magill, P.J., Friston, K.J., et al., 2011b. Alter-ations in brain connectivity underlying beta oscillations in Parkinsonism. PLoSComput. Biol. 7 (8), e1002124.
Moran, R.J., Stephan, K.E., Dolan, R.J., Friston, K.J., 2011c. Consistent spectral predic-tors for dynamic causal models of steady-state responses. NeuroImage 55 (4),1694–1708.
Moran, R., Pinotsis, D.A., Friston, K., 2013. Neural masses and fields in dynamic causalmodeling. Front. Comput. Neurosci. 7, 57.
Moscato, E.H., Peng, X., Jain, A., Parsons, T.D., Dalmau, J., Balice-Gordon, R.J., 2014. Acutemechanisms underlying antibody effects in anti-N-methyl-D-aspartate receptor en-cephalitis. Ann. Neurol. 76 (1), 108–119.
Nevado-Holgado, A.J., Marten, F., Richardson, M.P., Terry, J.R., 2012. Characterising the dy-namics of EEG waveforms as the path through parameter space of a neural massmodel: application to epilepsy seizure evolution. NeuroImage 59, 2374–2392.
Papadopoulou, M., Leite, M., van Mierlo, P., Vonck, K., Lemieux, L., Friston, K., Marinazzo,D., 2015. Tracking slow modulations in synaptic gain using dynamic causal model-ling: validation in epilepsy. NeuroImage 107, 117–126.
Pinotsis, D.A., Brunet, N., Bastos, A., Bosman, C.A., Litvak, V., Fries, P., Friston, K.J., 2014.Contrast gain control and horizontal interactions in V1: a DCM study. NeuroImage92, 143–155.
Proix, T., Bartolomei, F., Chauvel, P., Bernard, C., Jirsa, V.K., 2014. Permittivity couplingacross brain regions determines seizure recruitment in partial epilepsy. J. Neurosci.34 (45), 15009–15021.
Roopun, A.K., Middleton, S.J., Cunningham, M.O., LeBeau, F.E., Bibbig, A., Whittington,M.A., Traub, R.D., 2006. A beta2-frequency (20–30 Hz) oscillation in nonsynaptic net-works of somatosensory cortex. Proc. Natl. Acad. Sci. U. S. A. 103, 15646–15650.
Roopun, A.K., Kramer, M.A., Carracedo, L.M., Kaiser, M., Davies, C.H., Traub, R.D., Kopell,N.J., Whittington, M.A., 2008. Period concatenation underlies interactions betweengamma and beta rhythms in neocortex. Front. Cell. Neurosci. 2, 1.
Scharfman, H.E., 2007. The neurobiology of epilepsy. Curr. Neurol. Neurosci. Rep. 7,348–354.
Schiff, S.J., Sauer, T., 2008. Kalman filter control of a model of spatiotemporal cortical dy-namics. J. Neural Eng. 5, 1–8.

519G.K. Cooray et al. / NeuroImage 118 (2015) 508–519
Schiff, S.J., Colella, D., Jacyna, G.M., Hughes, E., Creekmore, J.W., Marshall, A., et al., 2000.Brain chirps: spectrographic signatures of epileptic seizures. Clin. Neurophysiol. 111(6), 953–958.
Schmitt, S.E., Pargeon, K., Frechette, E.S., Hirsch, L.J., Dalmau, J., Friedman, D., 2012. Ex-treme delta brush: a unique EEG pattern in adults with anti-NMDA receptor enceph-alitis. Neurology 79 (11), 1094–1100.
Sengupta, B., Stemmler, M.B., 2014. Power consumption during neuronal computation.Proc. IEEE 102 (5), 738–750.
Sengupta, B., Laughlin, S.B., Niven, J.E., 2013. Balanced excitatory and inhibitory synapticcurrents promote efficient coding and metabolic efficiency. PLoS Comput. Biol. 9,e1003263.
Soltesz, K.S., 2008. Computational Neuroscience in Epilepsy. Academic Press, Amsterdam.Spencer, S.S., Guimaraes, P., Katz, A., Kim, J., Spencer, D., 1992. Morphological patterns of
seizures recorded intracranially. Epilepsia 33 (3), 537–545.Stephan, K.E., Penny, W.D., Moran, R.J., den Ouden, H.E., Daunizeau, J., Friston, K.J., 2010.
Ten simple rules for dynamic causal modeling. NeuroImage 49 (4), 3099–3109.Swann, J.W., Rho, J.M., 2014. How is homeostatic plasticity important in epilepsy? Adv.
Exp. Med. Biol. 813, 123–131.Terry, J.R., Benjamin, O., Richardson, M.P., 2012. Seizure generation: the role of nodes and
networks. Epilepsia 53, e166–e169.Thomson, A.M., Bannister, A.P., 2003. Interlaminar connections in the neocortex. Cereb.
Cortex 13, 5–14.Ullah, G., Schiff, S.J., 2009. Tracking and control of neuronal Hodgkin–Huxley dynamics.
Phys. Rev. E Stat. Nonlinear Soft Matter Phys. 79, 040901.
Ullah, G., Schiff, S.J., 2010. Assimilating seizure dynamics. PLoS Comput. Biol. 6,e1000776.
Ullah, G., Cressman Jr., J.R., Barreto, E., Schiff, S.J., 2009. The influence of sodium and potas-sium dynamics on excitability, seizures, and the stability of persistent states. II. Net-work and glial dynamics. J. Comput. Neurosci. 26, 171–183.
Wei, Y., Ullah, G., Ingram, J., Schiff, S.J., 2014. Oxygen and seizure dynamics: II. Computa-tional modeling. J. Neurophysiol. 112, 213–223.
Wendling, F., Bartolomei, F., Bellanger, J.J., Chauvel, P., 2002. Epileptic fast activity can be ex-plained by a model of impaired GABAergic dendritic inhibition. Eur. J. Neurosci. 15,1499–1508.
Wendling, F., Bartolomei, F., Bellanger, J.J., Bourien, J., Chauvel, P., 2003. Epileptic fast in-tracerebral EEG activity: evidence for spatial decorrelation at seizure onset. Brain126, 1449–1459.
Wendling, F., Hernandez, A., Bellanger, J.J., Chauvel, P., Bartolomei, F., 2005. Interictal toictal transition in human temporal lobe epilepsy: insights from a computationalmodel of intracerebral EEG. J. Clin. Neurophysiol. 22, 343–356.
Wilson, H.R., Cowan, J.D., 1972. Excitatory and inhibitory interactions in localized popula-tions of model neurons. Biophys. J. 12, 1–24.
Wilson, H.R., Cowan, J.D., 1973. A mathematical theory of the functional dynamics of cor-tical and thalamic nervous tissue. Kybernetik 13, 55–80.
Yoshimura, Y., Callaway, E.M., 2005. Fine-scale specificity of cortical networks depends oninhibitory cell type and connectivity. Nat. Neurosci. 8, 1552–1559.