characterisation of wearable and implantable physiological
TRANSCRIPT


Tampereen teknillinen yliopisto. Julkaisu 879 Tampere University of Technology. Publication 879 Jarno Riistama Characterisation of Wearable and Implantable Physiological Measurement Devices Thesis for the degree of Doctor of Technology to be presented with due permission for public examination and criticism in Tietotalo Building, Auditorium TB111, at Tampere University of Technology, on the 7th of May 2010, at 12 noon. Tampereen teknillinen yliopisto - Tampere University of Technology Tampere 2010

ISBN 978-952-15-2347-2 (printed) ISBN 978-952-15-2389-2 (PDF) ISSN 1459-2045

ABSTRACT
Electrodes are an important part of any biopotential measurement application. The electrodeswill be in direct galvanic contact with the skin or tissue of the measurement subject. Theinterface between the electrode and electrolyte has a complicated structure involving bothphysical and chemical processes and reactions. The thesis revises the complex interface interms of reactions occurring at the interface, the formation and structure of the double layerat the interface, electrode potential, and various electrical equivalent interface models. Theartefacts occurring at the interface are also introduced and possibilities to reduce them arediscussed.
A relation between the artefacts and electrode materials is established through electrochem-ical noise measurements performed with several metallic electrodes as well as with textileelectrodes. The electrochemical noise arising from the interface as a function of time reflectsthe stabilisation time of the current electrode–electrolyte interface. The electrochemical noisewill reduce as time from the application of the electrode on the subject elapses. The timethe interface needs to reach its steady state is called the stabilisation time of the electrode.Electrode materials that possess a short stabilisation time are the most suitable ones for appli-cations where artefacts are probable. Such applications are the ones that involve e.g. motionor deformation of the skin of the subject.
Noise measurements were conducted with gold (Au), silver (Ag), silver–silver-chloride (Ag/AgCl), platinum (Pt), stainless steel (AISI 316L), and textile (silver and copper yarns asconductive material) electrodes. The results show that Ag/AgCl electrodes have the shorteststabilisation time or, alternatively, least noise in the biopotential measurement applications.Stainless steel electrodes also showed good performance in terms of low electrochemicalinterface noise. It was also verified that all the electrodes will exhibit an equivalent noiselevel despite of the material as time elapses 10 minutes or more from the application of theelectrodes on the electrolyte. Based on the measurement results, optimal materials to be usedas electrodes can be determined.
The complex electrode–electrolyte interface can also be expressed as an electrical equiva-lent circuit model known as the lumped-element model. The model component values weredetermined from the measurements of some of the electrodes under research in the electro-chemical noise measurements. The knowledge about the component values provides means

ii Abstract
to calculate the impedance of the electrode which has to be taken into account in designingthe measurement amplifier. The interface components also form a natural RC-filter whichhas to be taken into account when determining the measurement signal bandwidth.
The measurements of the model components were performed with a square wave method,a novel and relatively simple measurement technique. The measurements done in the thesisapplied the technique successfully to the component measurements although originally thetechnique was used for other purposes. The measurement results obeyed the frequency vs.impedance curves widely accepted among scientists.
Some implantable biopotential measurement devices have been designed and realised andthe results are reported in the thesis. An inductively powered implantable electrocardiogram(ECG) measurement device is presented and both in vitro and in vivo measurement resultsare reported. A resonance-based biopotential measurement device is also introduced. Themeasurement device has an extremely simple construction and is basically a resonating LC-tank whose impedance is modified by a varactor. The reflected impedance of the LC-tank canbe measured at the detector device from which the biopotential can be derived. Measurementresults of the human ECG measured from the skin surface with the device are reported in thethesis.

PREFACE
The work presented in the thesis was carried out at Tampere University of Technology (TUT)and more specifically at the Institute of Measurement and Information Technology (–2008)and at the Department of Automation Science and Engineering (2009–) due to structuralchanges at TUT.
The work towards the dissertation was begun in September 2003, when a project funded bythe Academy of Finland was launched. The project, known as TULE (Finnish abbreviationfor Future Electronics), introduced an interesting and complex world of implantable medicaldevices to everyone involved in the project. The problems were many on the bumpy roadtowards the first prototype of the implantable ECG monitoring device that was tested in vivoin cows in summer 2006. However, the project learnt a lot and the author is highly gratefulfor the Academy of Finland to finance such an interesting project.
In 2006, a new project was launched, called Wisepla, that was funded by the Finnish Fund-ing Agency for Technology and Innovation (TEKES) and several Finnish companies. Thenew project was focused on surface measurement technology and especially on a wearable,long-term bioimpedance device for cardiac and respiratory measurements. This incorpo-rated textile electrodes into the research. There was, however, further development of theimplantable ECG-measurement device going on as well. The project enabled the researchgroup to miniaturise the device. Again, the author is highly grateful for the finance of theproject which learnt among other, more technical issues, the author many valuable thingsabout project management.
The department has provided me with the opportunity to write and finish my thesis on itsexpense. Without this remarkable financial support from the department, the thesis mightnever have been published or at least it would have been postponed into the future.
I want to express my deepest gratitude to the head of the department, Professor Jouko Halt-tunen, for kindly providing me the chance to stay a long time at the department and also forproofing my thesis. Professor Jukka Lekkala, my supervisor, deserves a great thanks for hisassistance and guidance to get me on the right tracks in the beginning of my doctoral studiesand for the guidelines provided by him during the writing period of the thesis. I also want tothank him for getting me involved in the interesting projects and relying on me in the projectmanager position. Casual discussions with him have also been pleasurable and motivating.

iv Preface
I highly appreciate the work done by the pre-examiners. Professor Danilo De Rossi fromUniversity of Pisa and Dr. Tech. Pasi Talonen from Atrotech Ltd. have made excellent andhuge job in reviewing the thesis and suggesting improvements and clarifications to the thesis.The work of both gentlemen has both enhanced the level of the thesis and made it morereadable.
Overall the people, either currently or previously, working at the institute and the colleaguesfrom other departments, have generated a very friendly and merry atmosphere where it hasalways been joyful to work in. The people have always been very helpful whenever assistancewas needed. I want to express my deepest gratitude to a dear friend of mine, an excellentresearcher, M.Sc. Ville Rantanen who has shared the office with me for several years. Thesometimes a little bizarre humour we both share has been an asset in the everyday workingenvironment.
The construction of the prototypes for many occasions has been possible thanks to Protopaja,where they could realise the tasks based on my partly unspecific drawings, schematics andexplanations. Thanks also belongs to the cleaning ladies in our wing who kept the rooms andcorridors clean and tidy thus providing us with a comfortable working environment.
The encouraging attitude and support, towards education provided by my childhood homeand parents, both mentally and financially, has played a great role in my decision to begin thedissertation process. I owe a great thanks to them.
The journey that started on a beautiful, yet chilly, September morning in 2003, to the dateof dissertation, has been long. However, I have had a great opportunity to share the wholejourney with my lovely wife, Jonna. During the dissertation process, our son Eetu has joinedthe team and delighted us from day to day. The relaxing and loving influence by these twopeople, has been one of the key factors in my well-being and they have also provided me withinsights into the real life outside the work. Although working is undoubtedly an importantpart of life, the real life I love and respect lies outside the boundaries of the working placeand does not care about titles.
Tampere, 14th April 2010Jarno Riistama

TABLE OF CONTENTS
Abstract . . . . . . . . . . . . . . . . . . . . . . . . . . . . . . . . . . . . . . . . i
Preface . . . . . . . . . . . . . . . . . . . . . . . . . . . . . . . . . . . . . . . . . iii
Table of Contents . . . . . . . . . . . . . . . . . . . . . . . . . . . . . . . . . . . v
List of Publications . . . . . . . . . . . . . . . . . . . . . . . . . . . . . . . . . . vii
List of Abbreviations . . . . . . . . . . . . . . . . . . . . . . . . . . . . . . . . . . xi
List of Symbols . . . . . . . . . . . . . . . . . . . . . . . . . . . . . . . . . . . . xiii
1. Introduction . . . . . . . . . . . . . . . . . . . . . . . . . . . . . . . . . . . . 1
1.1 Structure of the thesis . . . . . . . . . . . . . . . . . . . . . . . . . . . . . . 3
1.2 Contribution of the thesis . . . . . . . . . . . . . . . . . . . . . . . . . . . . 4
2. Electrode-electrolyte interface . . . . . . . . . . . . . . . . . . . . . . . . . . . 7
2.1 Electrochemical reactions . . . . . . . . . . . . . . . . . . . . . . . . . . . . 7
2.2 Double layer . . . . . . . . . . . . . . . . . . . . . . . . . . . . . . . . . . . 8
2.3 Standard electrode potential . . . . . . . . . . . . . . . . . . . . . . . . . . 9
2.4 Interface models . . . . . . . . . . . . . . . . . . . . . . . . . . . . . . . . . 11
2.5 Skin-electrode and skin-tissue interface models . . . . . . . . . . . . . . . . 15
2.6 Artefacts of the electrodes . . . . . . . . . . . . . . . . . . . . . . . . . . . 18
2.7 Electrode-electrolyte interface noise measurements . . . . . . . . . . . . . . 20
2.8 Impedance measurements of the electrode-electrolyte interface . . . . . . . . 22
3. Physiological surface measurement devices using electrodes . . . . . . . . . . . . 29
3.1 A short introduction to biopotential amplifiers . . . . . . . . . . . . . . . . . 29
3.2 A selection of surface measurement devices measuring ECG and bioimpedance 32
3.3 Surface electrode characterisation results . . . . . . . . . . . . . . . . . . . . 34

vi Table of Contents
3.3.1 Results of electrode-electrolyte interface noise measurements . . . . 34
3.3.2 Results of impedance measurements of the electrode-electrolyte in-terface . . . . . . . . . . . . . . . . . . . . . . . . . . . . . . . . . . 37
4. Implantable physiological measurement devices . . . . . . . . . . . . . . . . . . 41
4.1 Devices for monitoring purposes . . . . . . . . . . . . . . . . . . . . . . . . 41
4.1.1 Battery powered devices . . . . . . . . . . . . . . . . . . . . . . . . 42
4.1.2 Remotely powered devices . . . . . . . . . . . . . . . . . . . . . . . 43
4.1.3 Resonance-based devices . . . . . . . . . . . . . . . . . . . . . . . . 45
4.2 Material considerations for implantable applications . . . . . . . . . . . . . . 47
4.3 Inductively powered ECG monitor: Device characterisation . . . . . . . . . . 48
4.3.1 In vitro tests of the implantable ECG monitors and results . . . . . . 50
4.3.2 In vivo tests of the implantable ECG monitor and results . . . . . . . 52
4.4 Resonance-based passive biopotential (ECG) measurement device: charac-terisation . . . . . . . . . . . . . . . . . . . . . . . . . . . . . . . . . . . . 54
4.4.1 Measurement results . . . . . . . . . . . . . . . . . . . . . . . . . . 57
5. Discussion and Conclusions . . . . . . . . . . . . . . . . . . . . . . . . . . . . 61
Publication P1 . . . . . . . . . . . . . . . . . . . . . . . . . . . . . . . . . . . . . 77
Publication P2 . . . . . . . . . . . . . . . . . . . . . . . . . . . . . . . . . . . . . 79
Publication P3 . . . . . . . . . . . . . . . . . . . . . . . . . . . . . . . . . . . . . 81
Publication P4 . . . . . . . . . . . . . . . . . . . . . . . . . . . . . . . . . . . . . 83
Publication P5 . . . . . . . . . . . . . . . . . . . . . . . . . . . . . . . . . . . . . 85
Publication P6 . . . . . . . . . . . . . . . . . . . . . . . . . . . . . . . . . . . . . 87
LIST OF PUBLICATIONS
Parts of the thesis have been previously published. The following publications are includedin the thesis.
[P1] Riistama, J. and Lekkala, J. “ Electrode-electrolyte Interface Properties in Implanta-tion Conditions,” in Proceedings of the 28th Annual International Conference of theIEEE Engineering in Medicine and Biology Society – EMBC. Engineering Revolu-tion in Biomedicine, New York City, New York, USA. p. 6021-6024. 30 August—3September, 2006.
[P2] Riistama, J. and Lekkala, J. “Electrochemical noise properties of different electrodematerials in different electrolytes”, in Leonhardt, S., Falck, T. & Mähönen, P. (Eds.).IFMBE Proceedings. Volume 13. 4th International Workshop on Wearable and Im-plantable Body Sensor Networks (BSN 2007), RWTH Aachen University, Germany,pp. 149–154, March 26–28, 2007.
[P3] Riistama, J., Väisänen, J., Heinisuo, S., Lekkala, J., and Kaihilahti, J. “Evaluation ofan implantable ECG monitoring device in vitro and in vivo”, in Proceedings of the29th Annual International Conference of the IEEE EMBS Engineering in Medicineand Biology Society in conjunction with the Biennial Conference of the French Soci-ety of Biological and Medical Engineering (SFGBM), Lyon, France. pp. 5703–5706,August 23–26, 2007.
[P4] Riistama, J., Väisänen, J., Heinisuo, S., Harjunpää, H., Arra, S., Kokko, K., Mäntylä,M., Kaihilahti, J., Heino, P., Kellomäki, M., Vainio, O., Vanhala, J., Lekkala, J., andHyttinen, J. “Wireless and inductively powered implant for measuring electrocardio-gram”, Medical & Biological Engineering & Computing 45:1163–1174, 2007.
[P5] Riistama, J., Aittokallio, E., Verho, J. and Lekkala, J. “Totally passive wireless biopo-tential measurement sensor by utilizing inductively coupled resonance circuits”, Sen-sors and Actuators A – Physical 157(2):313–321, 2010.
[P6] Riistama, J., Röthlingshöfer, L., Leonhardt, S., and Lekkala, J. “Noise and interfaceimpedance of textile electrodes on simulated skin interface”, submitted to the Journalof IFMBE Medical and Biological Engineering and Computing, 2010.

viii List of Publications
SUPPLEMENTARY PUBLICATIONS
The following publications are not included in the thesis but are relevant with respectto the topic and therefore included into the list of supplementary publications.
[P7] Riistama, J. and Lekkala, J. “Characteristic Properties of ImplantableAg/AgCl- and Pt-electrodes,” in Proceedings of the 26th Annual International Con-fenrence of the IEEE EMBS (Engineering in Medicine and Biology Society), SanFrancisco, California, pp. 2360–2363, 1–5 September, 2004.
[P8] Riistama, J., Lekkala, J., Väisänen, S., Heinisuo, J., and Hyttinen, J. “ Introducing aWireless, Passive and Implantable Device to Measure ECG” in Kneppo, P. & Hoz-man, J. (eds.) IFMBE Proceedings. 3rd European Medical & Biological EngineeringConference IFMBE European Conference on Biomedical Engineering EMBEC’05,vol., 11, International Federation for Medical and Biological Engineering, Prague,Czech Republic, 5 p., 20–25 November, 2005.
[P9] Heinilä, H., Riistama, J., Heino, P., and Lekkala, J. “Low cost miniaturization of animplantable prototype”, Circuit World 35(1):34–40, 2009.

ix
CONTRIBUTION OF THE AUTHOR
In publications P1, P2 and P7 the author has been the main author of the papers. The authorhas also designed the measurement methods, conducted the measurements and analysed themeasurement results.
In publications P3, P4 and P8 the author has been the main author of the paper. The au-thor has also participated in the designing, construction and testing of the implantable ECGmeasurement devices as well as the data analysis.
In publication P5, the author has been the main author of the paper and made also dataanalysis on the measurement data. The author has actively participated in the supervision ofa M.Sc. thesis regarding the matters discussed in the paper.
In publication P6, the author has been the main author of the publication, designed the mea-surement methods and conducted the measurements. Materials used in the measurementstogether with the corresponding chapters in the publication were supplied by Ms Röthling-shöfer.
Publication P9 is mainly written by Ms Heinilä. The author has participated in the designingprocess of the implantable device, conducted the in vivo measurements, analysed the resultsand written the consecutive part in the publication.

x List of Publications

LIST OF ABBREVIATIONS
AC Alternating current
Ag Chemical symbol for silver
AgCl Chemical symbol for silver-chloride compound
AISI316L Acid resistant stainless steel
Au Chemical symbol for gold
BP Blood pressure
CMRR Common mode rejection ratio
DAQ Data acquisition
DC Direct current
ECG Electrocardiogram, graph describing the electrical activity of the heart
EEG Electroencephalogram, graph describing the electrical activity of thebrain
EIS Electrochemical impedance spectroscopy
FEM Finite element method
FFT Fast Fourier transform
Hg Chemical symbol for mercury
HRV Heart rate variability
IC Integrated circuit
ICA Independent component analysis
IDT Interdigital transducer
ILR Implantable loop recorder

xii List of Abbreviations
LSK Load shift keying
MEMS Micro electro mechanical systems
PBS Phosphate buffered saline
PCA Principal component analysis
PCB Printed circuit board
Pt Chemical symbol for platinum
RF Radio frequency
RMS Root-mean-square
SATP Standard ambient temperature and pressure, T = 25 C, p = 1 atm
SAW Surface acoustic wave
SBF Simulated body fluid
SNR Signal-to-noise ratio
Ti Chemical symbol for titanium
TUT Tampere University of Technology
TWB Total Water Balance
VCO Voltage Controlled Oscillator

LIST OF SYMBOLS
A Anion molecule of an electrolyte
A Gain of an amplifier
Acm Amplifier common mode gain
Ad Amplifier differential gain
Ae Confronting area of electrodes
An− Anion molecule of an electrolyte with valence n
AT Auxiliary variable used in the electrode impedance analysis
aox Activity of the oxidised agent
ared Activity of the reduced agent
α Auxiliary variable used in the electrode impedance analysis
C Correlation coefficient between amplifier voltage and current noise
Cc Parallel capacitance of the skin contact
CH Capacitance of the double layer
Ci Fixed capacitance of a resonance sensor with i =1, 2, 3, k
Cp Capacitance over electrode–electrolytic gel interface
Cpd Diffusion induced capacitance of the double layer in parallel circuit pre-
sentation
Cp,d Parallel capacitance of the dermis
Cp,e Parallel capacitance of the epidermis
Cp,s Parallel capacitance of fibrous sheath
Cp,t Parallel capacitance of tissue

xiv List of Symbols
Csd Diffusion induced capacitance of the double layer in series circuit pre-
sentation
D(i) Capacitance diode of a resonance sensor with i = 1, 2, or with no subindex
δ Thickness of the compact layer
Ei Non-equilibrium potential caused by a current flow
E0 Standard potential under SATP conditions
η Overpotential of an electrode
F The Faraday constant, F = 9.6487 ·104 C/mol
∆ f Frequency step in a discrete spectrum
IF Auxiliary variable used in the electrode impedance analysis
In, a Current noise of an amplifier
IS Auxiliary variable used in the electrode impedance analysis
IU (t) Faradic current through measurement resistor at time instant (t)
L(i) Inductance of a resonance sensor with i =1, 2 or with no sub index
l Separation of electrodes
M Metallic atom of an electrode
Mn+ Metallic ion of an electrode with valence n
n Valence of a redox reaction
n(e−) Number of electrons
pH2 Partial pressure of hydrogen
R Molar gas constant, R = 8.314 J/(K·mol)
RB Polarisation resistance of the bulk electrolyte
Rc Parallel resistance of the skin contact
RG Resistance of electrolytic gel
Ri Resistance of a resonance sensor with i =1, 2
Rlead Resistance of the measurement lead

xv
Rmeas Resistance of the measurement resistor
Rp Charge transfer resistance at electrode–electrolytic gel interface
Rpd Diffusion induced resistance of the double layer in parallel circuit pre-
sentation
Rp,d Parallel resistance of the dermis
Rp,e Parallel resistance of the epidermis
Rp,s Parallel resistance of fibrous sheath
Rp,t Parallel resistance of tissue
RS Sum resistance of Rx and Rmeas
Rsd Diffusion induced resistance of the double layer in series circuit presen-
tation
RT Resistance of tissue
Rt Charge transfer resistance of the double layer
Rx Volume resistance of electrolyte in impedance measurements
ρ Resistivity of an electrolyte
T Absolute temperature
T Half period of a square wave
∆T Time step, ∆T = T/8
VBIO Biopotential voltage
Vn,i i = e,a: voltage noise of an electrode or amplifier respectively
Vn,T Total equivalent noise of an amplifier–electrode circuit
Vre Voltage reduced to electrodes
VS Square wave voltage source amplitude
vfrms RMS noise calculated from a discrete voltage spectrum
vi,f Voltage density of the i:th component in a discrete voltage spectrum
vin,i Input voltage of an amplifier with i = 1,2
vout Output voltage of an amplifier

xvi List of Symbols
X2 Reflected impedance of a resonance sensor
Ze Impedance of the electrode–electrolyte interface

1. INTRODUCTION
Monitoring of people during their everyday life or sport performances has increased enor-mously in the 21st century. The need for the monitoring has arisen either from the suspectedor recognised problems in the personal health status or part of the needs may be man-madeand arise from the availability of such measurement devices. The wireless heart rate mon-itors have enabled continuous measurement of cardiovascular events in real time and withlittle discomfort to the measurement subject. Today, there are several commercial wirelessheart rate monitors available on the market and the first such product was made by the Finnishcompany Polar Electro in 1983. The product was known as Polar Sport Tester PE 2000 [61].
The wearable heart rate monitors are positioned for the mass market and typically the onlyinformation available from them is the heart rate. For the medical use, there are devicesthat are able to measure also the complete electrocardiographic (ECG) cycle and to store itfor later analysis. These devices are called Holter monitors and event (loop) recorders [40].They can capture and store measurement data from the abnormal seizure moments that arenot otherwise easily accessed due to their random nature. This helps the doctor to determinethe correct treatment methods for the patient.
Other wearable devices that monitor the well-being of the subject have also been suggested.Devices that measure the impedance of the tissues, known as bioimpedance measurementdevices, can be used to measure the Total Water Balance (TWB) of a subject [44]. Thebioimpedance measurement can also be used to measure e.g. respiration rate and volume[108].
As the number of elderly people is gradually increasing, there is a demand for wearable,wireless measurement devices that are able to monitor the people during their everyday ac-tivities. The body water balance is one of the key variables to be monitored in the elderlypeople where the risk of dehydration is actual [71].
The key demands can be stated shortly for the ambulatory measurement devices that are usedto measure physiological signals: In general, they shall be wireless and lightweight. In thedevelopment process, certain conventional solutions are sometimes blindly applied althoughit might be beneficial to consider the basics and explore different alternatives to be usedfor example as electrode material. Carbon loaded rubber, presented e.g. in [79], is a tradi-tional electrode material to be used in the wearable applications. Electrodes made of textile

2 1. Introduction
materials are, however, emerging thanks to their better integrability into clothing. Exam-ples of textile based electrodes integrated into garment are reported in several publications[44, 84, 87, 90].
The aim in the measurement applications is to obtain good enough signals for the current ap-plication with minimal cost and discomfort to the patient. These demands limit the selectionof electrode materials, sizes etc. in different ways and the electrode is often a compromisedsolution between price, size, durability, usability etc. It is of great importance that generalinformation which defines the electrical properties of the electrodes possibly in various ap-plications can be provided.
Some of the surface measurement devices can be made implantable, that is, placed under theskin, to enhance their usability and wearability. With implanted devices, e.g. the pacemakers,the battery and its capacity limits the usability of these devices. The implantable devices canalso be powered up wirelessly using inductive coupling between the implanted unit and anexternal unit on the skin surface. The inductive power coupling needs an external coil onthe skin surface whose optimal placement with respect to the implanted receiver coil canbe a problem in some cases. Inductively powered measurement devices solve the problem ofenergy capacity. The inductive power supply method has been used in many applications, e.g.in a phrenic nerve stimulator [116], in an implantable electroencephalography (EEG) monitor[46], an implantable telemetry system for sympathetic nerve activity and ECG measurementsystem [23].
Making the measurement devices to run on battery makes them more tolerant to interferences.The power line interference, for example, is a smaller problem with battery operated devicesthan with AC-powered devices since they can float in any potential and thus no commonground is present where the interferences are prone to connect.
The following questions were studied in the thesis:
1. Which electrode materials have the best characteristics in surface and implantable ap-plications? Electrodes exhibiting least electrochemical noise arising from the interfacetogether with low a impedance connection to the tissue or skin, are preferable in mostapplications. This question is studied and answered in Section 3.3.1.
2. Does there exist other, simpler, methods to measure the parameters of the electrode–electrolyte interface than traditionally used techniques requiring special instrumenta-tion and arrangements? The question is theoretically discussed in Section 2.8 andverified with measurements in Section 3.3.2.
3. Is it possible to obtain reliable long term data from an implantable measurement de-vice? Measurement data loss may be an issue with implantable devices, and also thedata is obtained from different environment than with traditional devices so that the

1.1. Structure of the thesis 3
interpretation of it is more difficult. A developed implantable measurement devicetogether with measurement results obtained with the device are presented in Section4.3.
4. Is it possible to measure bioelectric signals from the skin surface with a minimally com-plex device? A small, lightweight and inexpensive device that measures the ECG fromthe skin is under research. Section 4.4 presents the design of such a device togetherwith some preliminary measurement results.
1.1 Structure of the thesis
The thesis contains the following parts:
First, the electrode–electrolyte interface is reviewed. The electrochemical reactions, forma-tion and structure of the double layer, various interface models and artefacts of the mea-surement signals originating from the interface are discussed in detail. After discussing theinterface properties, the measurement methods of the interface electrochemical noise andimpedance are presented. There are naturally a number of measurement techniques but onlytechniques relevant to this thesis are presented.
In the next part, physiological surface measurement devices are discussed first in general andthen the results of the electrode characterisation studies are presented. The results are basedon the measurements of the author and are also presented in publications P1, P2, P6 and P7.
The following section deals with implantable physiological measurement devices. First someapplications are reviewed to provide the reader with an overview of the problem field. Thensome characteristic properties and demands of the measurement devices are discussed. Afterthese, the implantable ECG measurement devices designed and constructed at Tampere Uni-versity of Technology (TUT) are presented. The general presentation of the devices has beendivided into a separate section than the measurement results, both in vitro and in vivo, whichare presented in the consecutive sections. These results are also discussed in P3, P4, P8 andP9. The separation of the results from the general presentation of the developed devices isdone for clarity of the thesis structure. A totally passive resonant-based ECG measurementdevice is also presented in this part due to its obvious advantages in implantable applica-tions. The resonant sensor is originally discussed in publication P5. Fig 1.1 presents theinterconnections between the different issues investigated and presented in the thesis.
In the end, there is a discussion part included which considers the problems and limitationsof the applied measurement methods and debates the implantable ECG measurement devicesand their applicability. Conclusions of the obtained results are also presented.

4 1. Introduction
Biopotential
measurements
Electrode
characteristics
Measurement
devices
Impedance
(P1,P6,P7)
Implantable
devices
(P3,P4,P5,P8,P9)
Surface
devices
(P5)
Noise
(P2,P6,P7)
Fig. 1.1. A schematic figure of the interconnections between different issues researched and presentedin the thesis.
1.2 Contribution of the thesis
Several different electrode materials, both metallic and textile, have been investigated in termsof the electrochemical noise they exhibit at the interface between the electrode and the elec-trolyte. Several different electrolytes with different electrical conductivities have been used toconduct the measurements, which reflect the differences in the measurement results in severalelectrolytes.
The thesis presents and verifies a new measurement method for the interface impedance mea-surement of the electrode–electrolyte interface. The suggested square wave method has beenoriginally presented to be used for measurement of the electrolyte resistance at different fre-quencies but in the thesis it has been proved that the method can also be successfully appliedto the measurement of the interface component values at different frequencies. The thesiscontributes to the characterisation of the electrodes with the measurements and analysis ofthe results with respect to applications. The application aspect in the analysis of the measure-ment results has often been neglected in scientifical context.
An inductively powered, wireless, implantable measurement device to measure ECG has beenpresented and tested both in vitro and in vivo. In vivo measurements have been performed incows, and the results seem promising in terms of applicability of the measurement methodand apparatus to animal measurements. The presentation of the devices and the measurementsperformed with them give much valuable information about the implantable technology andpractical knowledge about the applications.
A simple, inexpensive, wireless measurement device to measure biopotentials has been in-troduced. Test measurements of ECG signal have been made with the device from the skin

1.2. Contribution of the thesis 5
surface and the device has been found to be applicable to biopotential measurements. Thedevice presents a fairly new measurement method that can be made affordable and dispos-able. Furthermore, the measurement device can be used on the skin surface or as implantedwhich makes it even a more important application.
In addition, the thesis gathers the widespread information, and generates new one, on thevarious electrode materials, electrolytes and their behaviour in one volume and connects thetheoretical aspects of the electrode characteristics with the real-life applications.

6 1. Introduction

2. ELECTRODE-ELECTROLYTE INTERFACE
The interface between the metallic electrode and ionic electrolyte is a complex system. Elec-trochemical reactions, section 2.1, occur at the interface which cause current to flow throughthe interface. There are two kinds of currents: displacement current originating from the dis-placement of charge carriers at the interface region and faradic current due to charge transferthrough the interface. The displacement current can also be called as a capacitive current.The faradic current is caused by redox reactions taking place at the interface. The reactionscan either release ions of the electrode into the solution or vice versa. [14, 28, 126] Fig 2.1visualises the structure and relations of the electrode–electrolyte interface that are discussedin more detail in the consecutive sections.
Electrode-
electrolyte
interface
Electrochemical
reactions
Double
layer
Standard
electrode
potential
Interface
models
Skin-electrode,
skin-tissue
models
Fig. 2.1. Structure and relations of the electrode–electrolyte interface.
2.1 Electrochemical reactions
When an electrode is immersed in an electrolyte, the electrochemical reactions on the elec-trode surface begin immediately. In the electrode, the current is carried by the electrons

8 2. Electrode-electrolyte interface
whereas in the electrolyte the free ions of the substance act as charge carriers. For the cur-rent to be able to flow through the electrolyte to the electrode and further to measurementelectronics, a charge transfer has to occur at the electrode–electrolyte interface.
When the metallic electrode is introduced into the electrolyte and a current should flowthrough it, either an oxidation reaction of the electrode atoms or a reduction/oxidation re-action of the electrolyte ions will occur. The reaction type of the electrolyte will depend onthe polarisation of the ions in the electrolyte. The reaction when the metallic atoms of theelectrode are oxidised can be stated as follows:
M Mn+ +n(e−) (2.1)
where M represents the metal atom, n its valence (integer), e− an electron and n(e−) numberof electrodes. For the case when reduction/oxidation of the electrolyte ions is to occur, thereaction will be written as:
An− A+n(e−) (2.2)
where An− represents an anion atom or molecule of the electrolyte solution and A is the atomor molecule of the electrolyte. The reduction/oxidation reactions are normally abbreviated asredox reactions [9].
The redox reactions taking place at the electrode–electrolyte interface will cause the chargedistribution at the interface to differ from that of the rest of the electrolyte. The chargeaccumulation at the interface can be measured as higher potential at the electrode than in thebulk electrolyte. This potential difference is known as half cell potential and the layer with ahigh charge density at the interface is called a double layer.
2.2 Double layer
The double layer has been discussed among the scientists in the electrochemical field since1879 when Helmholtz for the first time suggested that such a layer exists. The double layeris formed at the interface between the electrode and electrolyte due to the charge accumula-tion. The charge is accumulated on the interface because of the redox reactions described insubsection 2.1.
There exist several double layer models. Typically, the models have evolved as the time haspassed and knowledge and instrumentation have been developed yielding the newer modelsto be more complex than the older ones.
The first model suggested by Helmholtz in 1879, Fig 2.2(a) was relying on assumption thaton the surface of the metallic electrode there exists a tight layer of charges (positive metalions) and an equally tight layer of oppositely polarised charges are located in the electrolyteon the surface of the electrode. Helmholtz estimated that the separation between the two

2.3. Standard electrode potential 9
layers would be measured in molecular dimensions. The layer was called the space-chargeregion. [14, 28]
However, the Helmholtz model did not satisfactorily describe the electrode–electrolyte inter-face. In 1910, Gouy suggested that the creation of the double layer was also depending onthe osmotic pressure of the ions in the electrolyte. This lead to a smoother, exponentially de-caying potential distribution, Fig 2.2(b). Later, in 1913, Chapman further suggested that theosmotic pressure of the ions is equal in strength with the electrostatic force that the chargesexhibit. [126]
In 1924, Stern suggested yet another structure for the space-charge region, Fig 2.2(c). Thismodel was a more comprehensive model from those of Helmholtz’s or Gouy’s. The Sternmodel divided the space-charge region into two parts. A compact layer of charge is formedby the ions closest to the electrode surface. The strong electrostatic forces bind the ionstightly to the layer. The thickness of the compact layer is roughly the radius of a hydratedion. Another part is a diffuse layer that extends further to the electrolyte and where the ionsare more loosely arranged than in the compact layer. The dimension of the diffuse layer is inthe range of tens of ångstroms (Å) and depends on the concentration of the electrolyte. Asthe concentration increases, the length of the diffusion layer decreases. [14]
Stern extended his model further to include cases where the electrolyte contains dipoles. Theions bound to the electrode surface that form the compact layer have a minimum distancefrom each other. The gaps between the ions can be filled by the small dipoles and the potentialcurve will be as shown in Fig 2.2(d). [126]
2.3 Standard electrode potential
The double layer created at the electrode–electrolyte interface also creates a charge distribu-tion at the interface with a non-zero total charge. Hence, a potential is acting at the interface.The potential is known as the half cell potential or the standard potential. The potential de-pends at least on the temperature, electrode material, electrolyte and pH of the electrolyte.[14, 28]
A reference potential is needed in measuring the standard potential of an electrode. There-fore, another electrode is needed and the measured potential is the difference of these twoelectrodes. However, every metallic electrode exhibits a potential of its own and the mea-sured differential potential is not revealing the nature of the electrode under test unless acommon reference potential is defined.
According to an international agreement, the standard potential of a hydrogen electrode hasbeen defined to be zero when the following circumstances apply: The hydrogen electrodeconsists of a platinum electrode with electrodeposited platinum black and it is immersed in

10 2. Electrode-electrolyte interface
+++++
-----
V
x0δ
(a) Helmholtz model,1879
+
++
+
+
-
-
-
++-++---++-++-
V
x0δ
-
--
(b) Gouy model, 1910
+
++
+
+
-
-
-
++-++---++-++-
V
x0δ
-
-
(c) Stern model, 1924
+++++
-----
++---+--++-+-+---+++-++---+-
V
x0
δ
+-+-
+-
+-+-
+-
(d) Stern model withdipoles, 1924
Fig. 2.2. Various electrode–electrolyte interface models named after their inventors and years. δ, in thedistance from the electrode vs. potential figures, denotes the thickness of the compact layer ineach case.
an acid. When the activity of a hydrogen ion in the acid is 1 mole/litre (pH=0) and hydrogengas is bubbled around the electrode while its partial pressure pH2 is 1 atm, the standardpotential of this electrode type is defined to be zero at all temperatures. The reason for thehydrogen electrode to be chosen as the universal reference electrode lies in its reproducibilityand stability. [14] The hydrogen electrodes can be produced so that the potential difference oftwo hydrogen electrodes is less than 10 µV while for other electrodes the potential variationsare typically measured in the order of mV. The saturated calomel electrode (SCE with Hg–Hg2Cl2) is however comparable in stability and reproducibility with the hydrogen electrode.The potential variations of 1-20 µV have been measured for the SCE. [14, 28]
The standard potential of all other electrode materials is measured against the hydrogen elec-trode prepared in the manner explained earlier. The standard potential values measured andtabulated e.g. in [14, 28] are measured against the hydrogen electrode but under SATP con-ditions (SATP = Standard athmospheric temperature and pressure, T = 25 C, p = 1 atm.).The potentials will therefore be modified when either the temperature, electrolyte or pH ofthe electrolyte changes. The standard potential modified by the temperature changes obey theNernst equation
Ei = E0 +RTnF
ln(
aox
ared
)(2.3)
where E0 is the standard potential in SATP conditions, R molar gas constant, T the absolutetemperature, n the number of exchanged unity charges, F the Faraday constant and ai theactivities of reduced and oxidised species respectively.

2.4. Interface models 11
The standard potential applies only when the electrode is in electrochemical equilibrium withthe electrolyte and no current is drawn from the system. In the real life measurements, imme-diately when the electrode comes into contact with the body, a current begins to flow throughthe electrode and the potential difference over the interface will change. There have beenidentified four different reasons for the potential variation: [14, 52, 126]
1. charge transfer process through the electrode double layer
2. diffusion caused by concentration gradient or field
3. chemical reaction limiting the electrode reaction
4. crystallisation of the metal ions at the interface.
The difference between the disturbed potential and the standard potential is called overpoten-tial, η, and can be formulated as
η = Ei−E0 (2.4)
where Ei is the non-equilibrium potential caused by the current flow. Ei is a function of ap-plied current density that flows through the electrode. The theory behind the four previouslymentioned overpotential contributions is complex and since it is not the focus of this thesis,it is omitted here. For more exact discussion about these overpotential methods references[14, 126] are advised to be read.
When η is close to or exactly zero, the electrode is said to be non-polarisable and otherwisepolarised. The concept of polarisation of the electrode is misleadingly two-folded. Oneof the interpretations is as discussed previously and another suggested by Parsons in 1964is related to the charge exchange in the double layer. According to the other definition,the perfectly polarised electrode does not change charge over the interface whereas for theperfectly non-polarisable electrodes there is a free exchange of charge over the interface.Real life electrodes lie in between these extremities. Ag/AgCl-electrodes are close to beingperfectly non-polarisable and Pt electrodes lie close to the other end. [92]
2.4 Interface models
The double layer at the electrode–electrolyte interface has charges of one polarity on oneside and oppositely polarised charges on the other side of the interface. Hence, an intrinsiccapacitor is formed over the layer. When an electrical equivalent of the double layer is beingformulated, the resulting capacitor has to be included in the model. The standard potentialacting over the interface adds a voltage source to the model. Yet it is known that also directcurrent can flow through the interface, hence a resistor also has its place in the model. [28]

12 2. Electrode-electrolyte interface
Although the determination of the components comprising the electrical equivalent of thedouble layer (also known as the lumped element model) is somewhat straightforward, the de-termination of the connections between them has not always been clear. The determination ofthe component values is also a challenging task since the values are affected by the electrodemetal, its area, electrolyte, temperature, current density and the frequency of the current usedin the measurement situation. [14, 28]
In the case, where the charge transfer process is the most dominating part of the electrodeoverpotential, the electrical equivalent of the interface is straightforward: a parallel connectedresistor and a capacitor, Fig 2.3(a). The capacitance CH represents the capacitance of thedouble layer and Rt represent the resistance caused by the charge transfer at the interface.This approximation of the interface is valid under small signal conditions, i.e. when thecurrent density remains at low level. [14, 30, 126] The model is a special case of the standardRandles equivalent circuit originally presented in [97].
For an electrode material for which the exchange current density is low, the charge transferoverpotential is the dominating part of η. An example of such a material is Pt in hydrogenwhereas for Ag the effect of charge transfer overpotential is negligible. [14]
CH
Rt
(a) Electrical equiva-lent ignoring diffusionmechanisms.
CH
Cd
s Warburg
impedanceRt
Rds
(b) Equivalent circuit with Warburg series com-ponent.
CH
Cd
p
Rd
p
Warburgimpedance
Rt
(c) Equivalent circuit with Warburg parallelcomponent.
CH
Cd
p
Rd
p
Warburg
impedanceRt
RB
(d) Equivalent circuit with Warburg parallel componentand electrolyte bulk resistance.
Fig. 2.3. Evolution of electrical equivalent circuits of the electrode–electrolyte interface.
Warburg was the first to analyse the overpotential caused by the diffusion mechanisms un-der a sinusoidal excitation current. The sinusoidal current applied over the electrode willcause the charge concentration to vary as a function of time at the interface. The charge den-

2.4. Interface models 13
sity fluctuations can be regarded as concentration waves propagating in the electrolyte. Theconcentration wave amplitude will be decreased by the damping of the electrolyte and thespreading of the wave as it propagates in the electrolyte. It is possible to define a penetrationdepth for the concentration wave. At the distance of penetration depth from the electrodeinterface the amplitude of the concentration wave is 1/e of the initial amplitude at the elec-trode. When the frequency of the sinusoidal signal increases, also the damping increasesthus causing the penetration depth to decrease. This leads to situation where eventually theconcentration wave will only be in the proximity of the electrode surface. When the pen-etration depth is much smaller than the diffusion layer thickness, the impedance caused bythe diffusion will be negligible. Then the electrical equivalent of the interface will be like inFig 2.3(b) or its parallel equivalent in Fig 2.3(c).
The component names Rid and Ci
d in Fig 2.3(b) and Fig 2.3(c) with i = p, s, represent the dif-fusion induced resistance and capacitance. They are both inversely proportional to the squareroot of the applied signal frequency [30]. This fact makes it reasonable that the impedanceof the circuit presented in Fig 2.3(b) will be close to zero when the frequency is sufficientlyhigh. On the contrary, the impedance will be infinite if the frequency approaches zero. In thiscase, a frequency independent value for the Warburg impedance can be defined which keepsthe impedance finite.
The model of Fig 2.3(b) can be converted to a parallel connected resistor–capacitor model.The component values have to be scaled yet the same frequency behaviour applies. Theparallel connected Warburg equivalent circuit is presented in Fig 2.3(c).
The polarisation resistance of the bulk electrolyte can be easily added to the interface modelby adding an ohmic resistance RB in series with the circuit equivalent, see Fig 2.3(d). Thesame addition can be made for all presented circuit equivalents and by adding it to circuitFig 2.3(a), the Randles equivalent circuit is formed. Geddes and Baker suggested in [28] thatthe half cell potential can be added to the electrical equivalent as a DC-voltage source.
The electrical equivalent circuit shown in Fig 2.3(d) is the most complex and comprehensiveelectrical equivalent circuit model. The model can, however, be simplified when both lowfrequency and high frequency behaviour is examined. For the low frequency signals, thebehaviour of the double layer is dominated by the Warburg circuit component and the circuitcan be effectively reduced to contain only the Warburg impedance, Fig 2.4(a). [14]
When high frequency signals are considered, the Warburg impedance will be negligible sinceboth components of the Warburg model are inversely proportional to the applied frequency.Thus the interface impedance is dominated by the double layer capacitance and the electrolyteresistance. The high frequency approximation of the interface electrical equivalent is as inFig 2.4(b). [14]
The electrical equivalent component values of the interface also exhibit frequency depen-

14 2. Electrode-electrolyte interface
Cd
p
Rd
p
(a) Low frequencyapproximation ofthe electrical equiv-alent circuit of theelectrode–electrolyteinterface.
CH
RB
(b) High frequency ap-proximation of the elec-trical equivalent circuit.
Fig. 2.4. Low and high frequency approximations of the electrode–electrolyte interface electrical equiv-alent circuits.
dency. It has been suggested and with measurements proved that the interface componentvalues are exponentially decaying with frequency. There have been various suggestions onwhether both the resistance and the capacitance in model illustrated in Fig 2.3(a) would showthe same frequency dependency or should they be separated from each other having decayconstants of their own. The theory that is more widely used and proved correct, e.g. in [14],suggests that both the components have independent decay constants. [14, 28, 30, 103, 126]
Bera et al. have concluded in their study that by superimposing DC and AC current in themeasurement of interface parameters produce more reliable information about the polarisa-tion impedance for natural biosignals that contain both the DC and AC components. Theyalso observed that the interface component values show a transition point where the decayconstants of both the resistance and the capacitance are altered. The behaviour was suggestedto happen due to the usage of the DC current in the measurement. [7]
Schwan reported in [104] that the current density used for either measurement or simulationthrough the electrodes has a significant effect on the interface values the system exhibits. Hemeasured the interface component values of the interface model shown in Fig 2.3(a) for aPt electrode in KCl solution. The measurement frequency used was 100 Hz, electrode areanearly 1 cm2 and the nonlinear range begun from current value 0.4 mA which correspondsto current density of approximately 0.4 mA/cm2. The non-linearity will be shown in theinterface resistance as rapidly decreasing values with increasing current density. For theinterface capacitance, the effect will be opposite.
In his article, Schwan suggested that the limiting current density shall be assigned a value thatcorresponds the current density at which a 10 % deviation of the interface component values,Rt and CH, from their small signal values, is detected. He also suggested that the relationshipof the limiting current with frequency would follow an exponentially increasing form withan exponential constant of the same absolute value as the capacitance of the correspondingelectrode material–electrolyte interface has. This means that the limiting current of linearity

2.5. Skin-electrode and skin-tissue interface models 15
is higher at higher frequencies. [103]
McAdams et al. have also reported of the current limits for linear behaviour of the interfacecomponent values [65]. In their article it is suggested that the parallel connected resistor–capacitor model of Fig 2.3(a) is an appropriate model to be used in the modelling of theelectrode–electrolyte interface. They also state that the charge transfer resistance, Rt , domi-nates the impedance of the system at the low frequency zone and the nonlinear behaviour isfirst seen in the value of this component. When the frequency is increased, the capacitancewill be more dominant and the non-linearity will also be seen in those values.
Recently, Oh et al. have studied electrode systems with nanoscale gaps. They have reportedresults where the influence of the electrode polarisation impedance on the measurement re-sults can be remarkably reduced by a nanometer scale gap between the electrodes, whichcauses the double layers of the electrodes to overlap. The gap between the electrodes washeld much under 100 nm and the variations in the capacitance and resistance were mainlycaused by the sample solution. [85]
It is impossible to define exact universal interface component values for the componentspresented in Fig 2.3(d). This is because in realistic measurement situations, the applied fre-quency of the signals vary as well as the current through the electrodes. Since all the com-ponent values are dependent on the frequency and current density, the component values areconstantly changing. The information band e.g. of the ECG signal lies between 0.5–40 Hzand the signal waveform has a varying amplitude which implies also varying current densityat the electrodes during ECG measurements [114].
The resistance and the capacitance appearing in the interface models cause deformations inthe measurement signals since the interface will act like an RC-filter. It is therefore importantthat the interface values are such that the signal to be measured is not drastically modified bythe interface properties. [14]
2.5 Skin-electrode and skin-tissue interface models
The electrical equivalents of interfaces at pure electrode–electrolyte interface are as shownin Fig 2.3 and in Fig 2.4. However, when the electrodes are used in real measurement appli-cations, e.g. on the skin, there will be several interfaces on the signal route beginning fromthe signal source and ending at the electrode and read-out electronics. Furthermore, the in-terfaces are different for widely used gel-paste electrodes, textile electrodes and implantableelectrodes. The interfaces of all these three situations are illustrated in Fig 2.5. The schematicgraphs have been modified from sources [67, 70].
Components and their values in Fig 2.5(a), which describes the measurement setup for astandard electrolytic gel enhanced electrode, denote the resistance of the leads connecting

16 2. Electrode-electrolyte interface
Electrode
Gel
Epidermis
Dermis
RG
CpRp
Rp,e
Rp,d
Cp,e
Cp,d
Rlead
(a) Electrical equivalentcircuit of the electrode–electrolyte interface fora gel-paste electrode onskin.
Electrode
Skincontact
Epidermis
Dermis
CpRp
Rp,e
Rp,d
Cp,e
Cp,d
Rlead
CcRc
(b) Electrical equivalentcircuit of the electrode–electrolyte interface for atextile electrode on skin.
Electrode
Tissuefluids
Tissueororgan
RT
CpRp
Rp,t Cp,t
Rlead
(c) Electrical equivalentcircuit of the electrode–electrolyte interface foran implantable electrode.
Electrode
Tissuefluids
Tissueororgan
RT
CpRp
Rp,t Cp,t
Rlead
Rp,s Cp,s
Fibroussheath
(d) Electrical equivalentcircuit of the electrode–electrolyte interface foran implantable electrodewith a fibrous sheath.
Fig. 2.5. Electrode–electrolyte interface electrical equivalent circuits for various electrode types. Fig-ures modified from [67, 70]
the measurement electronics to the electrode (Rlead), the simplified interface impedance ofthe electrode–ion based conducting media (Rp and Cp), the impedance of the conductingelectrolytic gel applied between the electrode and the skin (RG), which is mostly resistiveand the impedance of the epidermis (the outer layer of the skin) and dermis (deeper layers ofthe skin not, however, including the subcutaneous tissues). The usage of the Randles modelis acceptable since in measurement applications, the current density is inherently kept at alow level.
For the case of a textile electrode, Fig 2.5(b), the situation is otherwise similar except from theconnecting layer between the electrode and the skin. When textile electrodes are being used,
2.5. Skin-electrode and skin-tissue interface models 17
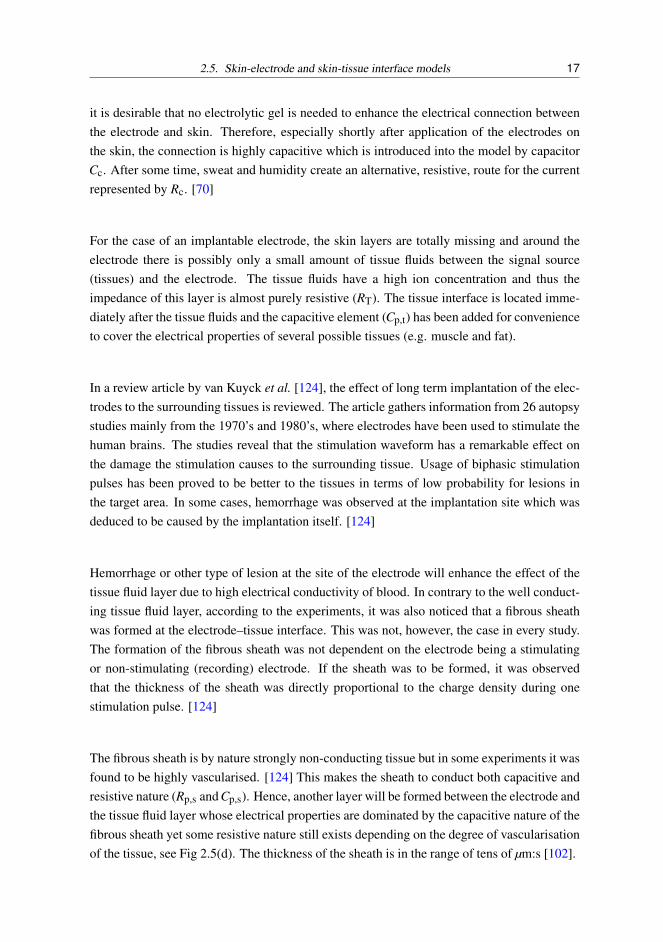
it is desirable that no electrolytic gel is needed to enhance the electrical connection betweenthe electrode and skin. Therefore, especially shortly after application of the electrodes onthe skin, the connection is highly capacitive which is introduced into the model by capacitorCc. After some time, sweat and humidity create an alternative, resistive, route for the currentrepresented by Rc. [70]
For the case of an implantable electrode, the skin layers are totally missing and around theelectrode there is possibly only a small amount of tissue fluids between the signal source(tissues) and the electrode. The tissue fluids have a high ion concentration and thus theimpedance of this layer is almost purely resistive (RT). The tissue interface is located imme-diately after the tissue fluids and the capacitive element (Cp,t) has been added for convenienceto cover the electrical properties of several possible tissues (e.g. muscle and fat).
In a review article by van Kuyck et al. [124], the effect of long term implantation of the elec-trodes to the surrounding tissues is reviewed. The article gathers information from 26 autopsystudies mainly from the 1970’s and 1980’s, where electrodes have been used to stimulate thehuman brains. The studies reveal that the stimulation waveform has a remarkable effect onthe damage the stimulation causes to the surrounding tissue. Usage of biphasic stimulationpulses has been proved to be better to the tissues in terms of low probability for lesions inthe target area. In some cases, hemorrhage was observed at the implantation site which wasdeduced to be caused by the implantation itself. [124]
Hemorrhage or other type of lesion at the site of the electrode will enhance the effect of thetissue fluid layer due to high electrical conductivity of blood. In contrary to the well conduct-ing tissue fluid layer, according to the experiments, it was also noticed that a fibrous sheathwas formed at the electrode–tissue interface. This was not, however, the case in every study.The formation of the fibrous sheath was not dependent on the electrode being a stimulatingor non-stimulating (recording) electrode. If the sheath was to be formed, it was observedthat the thickness of the sheath was directly proportional to the charge density during onestimulation pulse. [124]
The fibrous sheath is by nature strongly non-conducting tissue but in some experiments it wasfound to be highly vascularised. [124] This makes the sheath to conduct both capacitive andresistive nature (Rp,s and Cp,s). Hence, another layer will be formed between the electrode andthe tissue fluid layer whose electrical properties are dominated by the capacitive nature of thefibrous sheath yet some resistive nature still exists depending on the degree of vascularisationof the tissue, see Fig 2.5(d). The thickness of the sheath is in the range of tens of µm:s [102].

18 2. Electrode-electrolyte interface
2.6 Artefacts of the electrodes
The biopotential measurements typically suffer from various kinds of artefacts affecting themeasurement signal. Examples of such artefacts are e.g. motion artefacts, artefacts causedby different biopotential signals than the desired, typically EMG signals, and artefacts due toelectrochemical noise at the electrode interface. [13, 28]
The double layer is the source of the motion induced artefact. The charge distribution at theinterface is disturbed as the electrode moves with respect to skin. [9, 28]
There are several techniques to reduce the motion induced artefacts. One simple techniqueis to choose the placement of the electrodes so that they are located on places where theinterface movements between the electrode and skin are at minimum. One such applicationis presented by Qu et al. in [96]. They conducted impedance cardiography measurementswith spot electrodes instead of the traditionally used band electrodes. A better signal-to-noise ratio (SNR) was obtained with the spot electrodes due to smaller movement artefacts inthe signal.
The effect of motion artefact on the measurement result can also be reduced by using elec-trodes of recessed type. The recessed type electrodes do not have a direct connection to theskin. Instead, they are connected to the skin via an interface medium. Nowadays, there istypically a layer of conductive hydrogel paste added around the electrode which will stabilisethe electrode–electrolyte interface and reduce the motion artefacts. [30, 52]
The varying contact pressure also causes artefacts to the measurement signal. The artefactsdue to varying contact pressure will be represented in the measurement signal as the motioninduced artefacts. Degen et al. have studied the possibility to reduce these artefacts by mea-suring the impedance of the electrode–electrolyte interface [18]. The method is not novel assuch but in controversy to the other similar methods, the proposed method does not lower thecommon mode rejection ratio (CMRR) of the biopotential amplifier during the measurementof the impedance. This lowers the coupling of the motion artefacts and power-line interfer-ence.
In addition to the contact pressure variations, also external pressure applied to the interfacebetween the skin and the electrode will cause artefacts to appear in the measurement results.The artefacts have been suggested by Thakor and Webster in [120] to be caused by the differ-ent metabolic activity levels in the skin layers (stratum corneum, dead cells and inner layers,viable cells). The generator of the artefact potential has been proposed to lie in the stratumgranolosum and the pressure changes will change the metabolic activity of the layers thuscausing a potential difference between the inner and outer layers of the skin.
Ödman studied the temperature dependency of the potential differences between differentskin layers as well as the effect of electrode radius of curvature into the artefact amplitude
2.6. Artefacts of the electrodes 19
[137]. In the research, he observed that the increasing temperature will lower the artefactpotential and with increasing radius of curvature of the electrodes, the artefact potentials werealso reduced. The original assumption of Thakor and Webster was that the artefact currentremains constant as the skin is being compressed [120]. Talhouet et al. further investigatedthe artefacts related to the skin deformations by stretching the skin and they observed bothrapid and slow variations in the potentials of the skin layers. Rapid variations are mostly dueto the resistance change in the signal route between the deeper and surface skin layers but theslow variations were assumed to be due to the artefact current changes. [17]
Filtering the measurement signal can also reduce the artefacts in it. Filtering is, however,problematic since the frequencies where the artefacts lie, often overlap with those of themeasurement signal. Therefore filtering of the measurement signal also rules out a part of theinformation contained by the signal. [28] Barros et al. have suggested in [5] to utilise higherorder signal conditioning methods to remove the overlapping noise from the original signal.They utilised independent component analysis (ICA) in the signal conditioning and were ableto separate the artefact signals effectively from the original measurement data although theyoverlapped in the frequency domain.
In addition to movement artefacts in the measurement signal that originate from the move-ment of the electrode with respect the skin or skin layers, there may exist another movementinduced artefact signal. The artefact is caused by the static charge accumulated to the bodyof the measurement subject or in the body of somebody else in the vicinity of the subject.The moving charges cause artefacts in the measurement signal. The artefact type is calledtriboelectric interference due to its birth mechanism. [34]
The electrodes suffer also from electrochemical noise originating from impurities adsorbedby the electrodes. Aronson and Geddes have investigated the effect in [2] and found thata pair of electrochemically clean electrodes are very stable. However, after introducing aminute amount of impurity on one of the electrodes, the electrochemical noise exhibited bythe electrode pair is greatly higher. The noise is due to the unstable current that will flowin the electrode surface layer due to the short-circuited cell of two dissimilar metals of theelectrode and the contaminant. [28]
The biosignal quality and motion artefacts can also be enhanced by preconditioning the skinunder the electrode. [28] Talhouet et al. made measurements on the relationship betweenskin rubbing and electrode–skin interfacial impedance. [17] According to their measure-ment results, the impedance between the electrodes and skin reduces when the skin has beenrubbed with a tape or a piece of sandpaper. Lower absolute impedance values at the interfacealso induce lower variations which means smaller motion artefacts. Proper selection of theelectrode material and skin preparation may also reduce slow baseline drift observed in thesurface electrode measurements [29].
The artefacts in the bioelectrical signals are not always only an undesirable property. Pawar et
20 2. Electrode-electrolyte interface
al. have found in [93] that the artefacts in the measurement signals can be used to determinevarious body movement activities. They were able to categorise even very subtle movementsof test persons with relatively good accuracy. They used principal component analysis (PCA)in determining the most probable movement that has caused observed artefact in the mea-surement signal.
2.7 Electrode-electrolyte interface noise measurements
The knowledge of the electrochemical noise arising from the electrode–electrolyte interfaceis essential in determining the most suitable electrode material or setup to be used in thecurrent application. The electrochemical noise of a virtually still interface can reach noisevoltage values as high as tens of microvolts up to tens of millivolts [28]. The biopotentialsto be measured with the electrodes may be only few tens of microvolts in amplitude e.g. inEEG so the intrinsic noise in the electrodes may introduce truly remarkable problems.
The electrode immersed in an electrolyte is always in floating potential and therefore anotherelectrode, called the reference electrode, is needed to set the potential of the electrolyte atsome fixed level to which all other potentials are referenced. [14, 28] Hence, the measurementof the electrochemical noise of the interface has to be performed with two electrodes. Toobtain the actual electrochemical noise of some electrode–electrolyte pair, one has to havea reference electrode whose properties do not interfere with the measurement. Referenceelectrodes are shortly discussed in section 2.3. A hydrogen electrode is a good referenceelectrode to be used as a stable counterpart for the electrode under investigation. This methodcan be, however, time consuming and complex to apply.
The measurement method typically used for the measurement the electrode–electrolyte inter-face noise is rather straightforward. Aronson and Geddes suggested in [2, 28] that one takestwo identical samples of the electrode material under test and immerse these in the desiredelectrolyte. Then the electrodes are connected to a high impedance differential measurementamplifier and the differential voltage signal is measured. The resulting electrochemical noiseis not directly the noise of the electrode–electrolyte interface but it is the voltage noise be-tween the two electrodes. In relation to real-life measurements, this is typically the noisewhich is interesting and has practical importance and whose amplitude should be minimised.
Huigen et al. have conducted a research about the electrochemical noise at the interface [43].The measurements clearly indicate that the electrochemical noise is a strong function of sta-bilisation time that the electrode and the electrolyte are let to be in contact with each other.The research suggests that all materials will reach the same noise level after they have beenstabilised with the electrolyte. Some materials show more rapid stabilisation times than oth-ers. This leads to time dependency in all electrochemical measurements.

2.7. Electrode-electrolyte interface noise measurements 21
Due to the time dependency of the electrochemical noise the electrode exhibits, the electro-chemical noise should either be measured as a function of time or the time the electrode–electrolyte interface is let to stabilise. The time of stabilisation should be determined so thatit corresponds to the real-life measurement situation. The interface stabilisation times withthe most practical importance are short since the noise measurement then best corresponds toa situation where e.g. motion artefacts are present. After an artefact, the stabilisation processof the electrode–electrolyte interface starts all over again. However, in measurement applica-tions, the measurement of the biosignal continues immediately after the artefact whether theelectrode has been stabilised or not. This means that the time of stabilisation remains short.
Several stabilisation times for the interfaces have been used in different studies. Huigenet al. in [43] used immediate measurements of the interface noise up to several hours ofstabilisation time for face-to-face mounted standard pre-gelled electrodes. McAdams et al.on the other hand used stabilisation time of five minutes for gold (Au) electrodes in phosphatebuffered saline (PBS) solution [68]. Aronson et al. used an immediate measurement of theelectrochemical noise of the electrodes [2]. Typical electrode stabilisation time is measured inminutes, usually only few minutes of stabilisation is enough to produce low electrochemicalnoise in the measurements.
Harland et al. have presented a contactless (capacitive, only displacement current involved)biopotential measurement which by its nature does not have a stabilisation time [37]. How-ever, Casas et al. have studied the limitations and inaccuracies related to the capacitive mea-surement method and reported it not being as reliable as direct contact measurements [11].
The measurement of the amplified electrochemical noise can be made with a data acquisitioncard (DAQ) or it can be measured using a spectrum analyser. When a DAQ is being used,the measurement will be made in the time domain whereas with the spectrum analyser, themeasurement results will lie in the frequency domain. Whichever method is used in themeasurement of the voltage noise, the outputs of the measurements of different materialswith small variations are not easy to compare with each other. Therefore typically a root-mean-square (RMS) noise will be calculated from the results. The RMS noise values areeasier to be compared with each other.
When the measurement of the electrochemical noise between two identical electrodes is per-formed by using a spectrum analyser, the output of the measurement is the voltage spectrumof the measurement. Also, if the measurement was originally made with a DAQ, the measure-ment results can be converted from the time domain into the frequency domain with the fastFourier-transform (FFT) and the similar frequency spectrum will be obtained [8]. Conver-sion from the time domain into the frequency domain enables one to calculate the RMS noisevalue on a specific frequency interval. This is essential since the biopotential measurementsare performed on a limited frequency interval and the noise originating at frequencies outsideof this interval is not relevant, in fact inclusion of it in the RMS noise value is misleading.

22 2. Electrode-electrolyte interface
The RMS noise can be calculated from the discrete voltage density spectrum as
vfrms =
√N
∑i
v2i,f ·∆ f (2.5)
where N is the serial number of the highest discrete frequency component to be includedinto the calculations and vi,f is the value of the i:th sample in the voltage density spectrumwhose unit is V/
√Hz and ∆ f is the frequency step. For the case, where the voltage spectrum
has been calculated by the FFT, N = Nfft/2 where Nfft is the length of the FFT. The noisemeasurements presented in publications P2 and P7 were done with a spectrum analyser andin P6 with a DAQ card.
2.8 Impedance measurements of the electrode-electrolyte interface
The impedance of the electrode–electrolyte interface affect the biosignal to be measured.High impedance in this interface will also provide the external disturbing signals with a highimpedance route to couple to the measurement electronics. The problem is even greater ifthe disturbances are not coupled as common mode signals. In this case, the CMRR of themeasurement amplifier does not help in reducing the noise. The disturbances are not coupledas common mode signals when the electrode–electrolyte interfaces are not similar betweenthe measurement electrodes. The problem has been researched by Huhta et al. in [42] whostudied the power line interference coupling to the electrodes and leads. To avoid usingelectrode materials with the highest impedance, the knowledge about the interface impedanceis important.
The values of the interface components shown in Fig 2.3(d) are typically given as the to-tal impedance and phase of the interface or real and imaginary parts of the total measuredimpedance. Earlier, the measurement of the resistive and reactive parts separately was notregarded so important and only the total impedance was measured. Grimnes et al. have pub-lished a paper about two measurement setups that are able to measure individual electrode–skin interface impedance [35]. Possibly the earliest measurement method was suggested byHorton et al. in 1935 using two electrodes and a reference electrode [41].
When the impedance and phase are plotted against frequency, the resulting graph is called aBode-plot and when the real part of the impedance is plotted against the imaginary part ofthe impedance, the plot is called a Nyquist-plot. Characterisation of the electrode interfacesis reported in this way e.g. in [6, 68, 70, 78].
More sophisticated way of characterising the interface is to report the values of the singlecomponents inside the interface electrical equivalent model. The measurement method tomeasure the independent component values depends a little on the used interface model. Ifthe series connected resistor–capacitor model illustrated in Fig 2.4(b) is used, Nihtianov et
2.8. Impedance measurements of the electrode-electrolyte interface 23
al. have in [82] presented a simple and low cost method to determine the resistance andcapacitance values from the measurement data. The measurement method is based on an os-cillating circuit where from the time delay between the measured voltage values the interfacecomponent values can be calculated.
In case of more complicated circuit models e.g. Fig 2.3, the measurement of the componentvalues can be measured by utilising electrochemical impedance spectroscopy (EIS) [27, 98].Usage of the EIS method demands special instruments and conditions so that the measure-ments can be done. The method applies a sinusoidal voltage or current between the electrodeunder study and the counter electrode whose properties are known. The measurement resultsare then fitted numerically to match the component values of an interface model such as inFig 2.3(d). The applied frequency of the sinusoidal input signal can be varied which enablemeasurements of the component values against frequency. EIS is typically used in corrosiondetection or measurements related to corrosion in general [100].
In addition to the EIS method and apparatus, less complex measurement methods to deter-mine the interface component values do exist. One method presented by Lario-García et al.in 2003, was utilising two sinusoidal waves that were phase shifted with respect to each otherby 90. Applying these waves into the electrodes, three independent components could becalculated with 1.3 % accuracy [60].
Another method presented again by Lario-García et al. used square waves in the stimula-tion of the interface and it was originally implemented to determine the conductivity of anelectrolytic solution [58]. A further application of the method to contain a constant phaseelement (CPE) was presented by Lario-García et al. in [59]. The author applied the methodto determine the interface component values of the electrode–electrolyte interface when theconductivity of the electrolyte and its geometrical dimensions are known. These measure-ment setups and measurement results are originally discussed in P1 and P6 and revised inSection 3.3.2.
The measurement method suggested by Lario-García et al. and applied by the author, as-sumes a two-electrode system to be stimulated with a square wave waveform at frequencyf . Duty cycle of the square waves is constantly kept at 50 %. The analysis is based on theequivalent circuit model shown in Fig 2.4(a) enhanced with the bulk resistance resulting inthe Randles circuit equivalent model [97]. A schematic figure of the measurement situationof the interface impedance components with the proposed square wave method is presentedin Fig 2.6. The interface component names are as in Fig 2.3(d) and Fig 2.4(a), VS is thesquare wave voltage source amplitude, Rx denotes the resistance of the electrolyte and Rmeas
the measurement resistor resistance.
When the square waves are applied between the electrodes, the capacitance of the interfacewill modulate the square waves according to Fig 2.7. A measurement resistor is connectedin series with the signal path and the voltage response is measured. From the response,

24 2. Electrode-electrolyte interface
RB RxRB
VS
Rmeas
V
Rd
pR
d
p
Cd
pC
d
p
Fig. 2.6. Schematic figure of the interface impedance measurement situation with the square wavemethod.
the voltages of three separate time stamps are read. The time stamps can be chosen freelybetween 0 and T , the half period of the applied square wave, but the earlier time instants arefavoured since they have a higher SNR and contain more information about the interface thanthe points at the end of the square wave half period. The interface electrical equivalent circuitvalues RB, Rp
d and Cpd can be calculated from the measured values. The model assumes both
the electrodes to have identical interfaces.
0 0.2 0.4 0.6 0.8 10
0.2
0.4
0.6
0.8
1
1.2
1.4
1.6
1.8
T/8 3T/8 5T/8
Time (a.u.)
Volt
age
(a.u
.)
Output
Input
Measurement points
Fig. 2.7. Stimulating square wave, modified wave by the electrode–electrolyte interface and voltagemeasurement points. T is the half period of the square wave. Picture originally presented inP6.
Although the stimulation of the electrode network is done with square waves that include allpossible frequencies, it is still possible to obtain the values of the interface impedance as afunction of frequency. The frequency f at which the square waves are exitated will reflectthe frequency behaviour of the electrode interface components at the same frequency. This isreported in P1 and P6 for the interface components and for the electrolyte resistance in [58].
When the suggested measurement method is used, the resistance of the electrolyte betweenthe electrodes must be known. The resistance of the electrolyte between the electrodes is not

2.8. Impedance measurements of the electrode-electrolyte interface 25
obvious if the electrodes are smaller in size than the electrolyte cross sectional area. In thiscase, the current between the electrodes will flow in the volume between the electrodes andnot limit itself strictly in the cross sectional area of the electrodes. Therefore the resistanceof the electrolyte is lower than in the case where the electrolyte volume would be exactly thesame size with the electrodes. The resistance is called the electrolyte spreading resistance[54].
The electrolyte spreading resistance can be defined by finite element method (FEM) mod-elling when the conductivity of the electrolyte is known. FEM modelling can be used tosimulate the current density between the two electrodes. With the FEM program, the userdefines the voltage to be applied between the electrodes. By integrating the resulting currentdensity over the surface of one of the electrodes, the total current flowing between the elec-trodes can be determined. By applying the Ohm’s law, the resistance of the electrolyte canbe obtained. The proposed method has been used in P1. There are, however, equations tocalculate the electrolyte spreading resistance analytically. Equations are presented for e.g. in[54], but they are limited to only either square or circular electrodes.
In some cases, e.g. in case of P6, the electrodes are prepared to match, or exceed, the sizeof the electrolyte between the electrodes which simplifies the determination of the spreadingresistance: Due to the lack of edge effects at the electrodes, the current density will be con-stant throughout the electrode area that contacts the electrolyte. This demands, however, thatthe pressure on the electrodes is sufficient to keep them in steady contact with the electrolyte.Furthermore, when the electrodes are sufficiently far apart from each other, i.e. several mil-limetres, the capacitive coupling between the electrode parts exceeding the electrolyte area isnegligible and the whole electric field between the electrodes will be confined to the volumeof the electrolyte.
In cases, where the volume of the electric field between the electrodes is well defined, thevolume resistance of the electrolyte can be calculated by using the simple formula for resis-tance:
Rx = ρl
Ae(2.6)
where ρ is the resistivity of the electrolyte, l is the separation between the electrodes and Ae
the confronting area of the electrodes.
The measurements are performed with a signal generator that is able to produce square wavesand a DAQ. Voltage measurements at three time stamps are needed for the determination ofthe impedance components. The time stamps shown in Fig 2.7 were suggested by Lario-García et al. in [58] and the same time stamps were adopted to the research of the authoras well. The equations to determine the interface electrical component values are somewhatmodified from those of Lario-García’s. The derivation of the equations was based on Fig 2.6whereas in [58], the model was slightly compressed and the derivation of the equations wasbased on that model.

26 2. Electrode-electrolyte interface
The calculation of the independent component values demands some additional variables tobe defined:
∆T =T8
(2.7)
IS =
√IU (3∆T )− IU (∆T )IU (5∆T )− IU (3∆T )
(2.8)
α =ln |IS|∆T
(2.9)
AT =(IU (3∆T )− IU (∆T ))(1+ exp(T α))
2[exp(−3∆T α)IU (∆T )− exp(−∆T α)IU (3∆T )]exp(T α)(2.10)
IF =IU (3∆T )
2AT exp(−3∆T α) exp(T α)1+exp(T α) +1
(2.11)
T is the half period of the applied square wave and IU is the calculated current value from thevoltage measurement result over the measurement resistor Rmeas. The component values canbe now calculated by using Equations 2.7–2.11:
RB =V0− IF RS(1+AT )
2IF(1+AT )(2.12)
Rpd =
12
AT (RS +2RB) (2.13)
Cpd =
RS +2(RB +Rpd)
RS +2RB
∆Tln |IS|
(2.14)
where RS = Rx +Rmeas is applied for clarity.
The derived equations 2.7–2.14 were verified with a circuit model in Fig 2.6 that was bothmodelled with a PSpice circuit modelling program and with a physical circuit model con-structed of components with the same component values. The values of the components inthe network as well as the induced square wave frequency were set to match the values used inthe study by Lario-García et al. [58]. Table 2.1 summarises the results of the simulations andcircuit board model tests. Both the electrode–electrolyte interfaces were constructed of com-ponents with similar values for clarity. The electrolyte resistance was set to be Rx = 560 Ω
and the measurement resistor Rmeas = 2.696 kΩ. Frequency used in the stimulation of thesquare waves was 350 Hz and the sampling rate of the DAQ was set at 100 kHz to obtain ac-curate waveforms from the measurements. From Table 2.1 it can be seen that with sufficientlyhigh sampling frequency of the waveform, the independent component values of the interfacecan be relatively accurately defined although the accuracy of the analysis was poorer than theone reported by Lario-García et al. in [58]. Noteworthy still is, that the measurements donewith the constructed physical model indicate that the analysis done with the equations sug-

2.8. Impedance measurements of the electrode-electrolyte interface 27
Table 2.1. Values of the components used in the simulation and circuit model accompanied with theresults of analysis based on the square–wave method. Errors of the calculations are given inpercents inside the parentheses.
Physical modelComponent True value PSpice simulation Author Lario-García
RB 389 Ω 386 Ω (0.87 %) 404 Ω (3.8 %) 419 Ω (7.7 %)Rp
d 999 Ω 1002 Ω (0.40 %) 1092 Ω (9.4 %) 1131 Ω (13 %)Cp
d 0.964 µF 0.964 µF (0.02 %) 0.998µF (3.5 %) 1.006 µF (4.4 %)
gested by Lario-García is slightly less accurate than the analysis done with newly definedequations 2.7–2.14.

28 2. Electrode-electrolyte interface

3. PHYSIOLOGICAL SURFACE MEASUREMENT DEVICESUSING ELECTRODES
3.1 A short introduction to biopotential amplifiers
The biopotentials that are measured are inherently low in amplitude. The ECG signals rangefrom 0.1 up to 10 mV, EEG signals remain in the range of 10–100 µV measured from theskin surface [80, 132]. The signals have to be amplified in order to be able to record thesignals for instance with a DAQ card. The amplifier, however, introduces additional noise tothe measurement and the properties of the amplifier has to meet certain demands in order tobe able to record the signals reliably.
In the biopotential measurements, the difference in the potential between two electrodes ismeasured. The resulting signal is called the corresponding biopotential and it is measured us-ing a differential amplifier with voltage gain A, see Fig 3.1 [28, 105]. The amplifier–electrode
vin,1
vin,2
vout=A(vin,1-vin,2)
A
+
_
Fig. 3.1. Schematic figure of the differential amplifier used to measure biopotentials.
interface can be illustrated as in Fig 3.2. The amplifier includes current and voltage noise of
Vn,e
Ze
Vn,a
In,a A
Amplifier
Idealamplifier
Electrodes
Fig. 3.2. Schematic figure of the electrode–amplifier setup including the noise components that con-tribute to the measurements. Figure modified from [26, 33].
its own that will contribute to the measurement results. This non-ideal behaviour is visualised
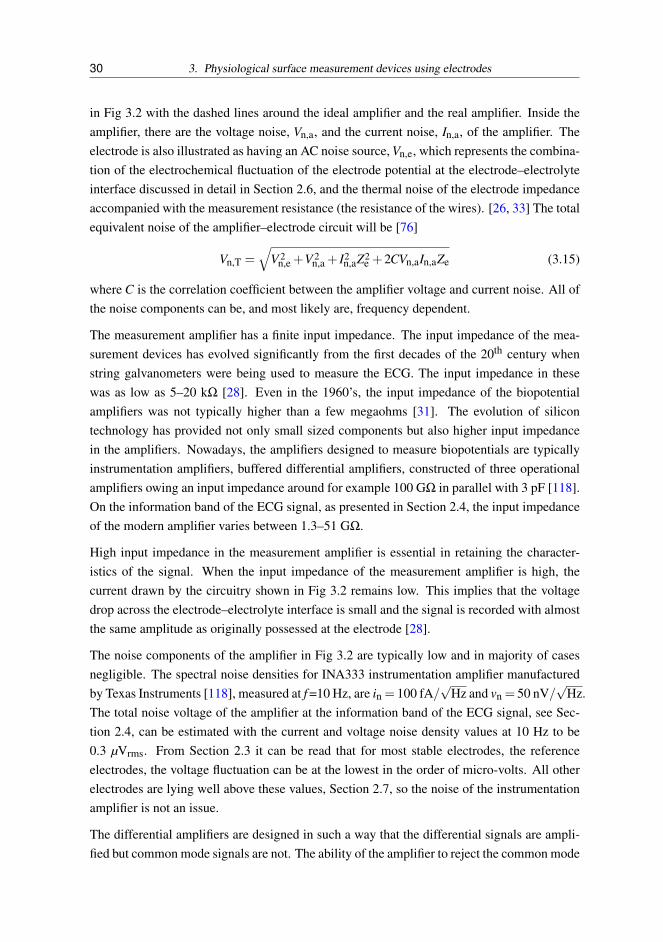
30 3. Physiological surface measurement devices using electrodes
in Fig 3.2 with the dashed lines around the ideal amplifier and the real amplifier. Inside theamplifier, there are the voltage noise, Vn,a, and the current noise, In,a, of the amplifier. Theelectrode is also illustrated as having an AC noise source, Vn,e, which represents the combina-tion of the electrochemical fluctuation of the electrode potential at the electrode–electrolyteinterface discussed in detail in Section 2.6, and the thermal noise of the electrode impedanceaccompanied with the measurement resistance (the resistance of the wires). [26, 33] The totalequivalent noise of the amplifier–electrode circuit will be [76]
Vn,T =√
V 2n,e +V 2
n,a + I2n,aZ2
e +2CVn,aIn,aZe (3.15)
where C is the correlation coefficient between the amplifier voltage and current noise. All ofthe noise components can be, and most likely are, frequency dependent.
The measurement amplifier has a finite input impedance. The input impedance of the mea-surement devices has evolved significantly from the first decades of the 20th century whenstring galvanometers were being used to measure the ECG. The input impedance in thesewas as low as 5–20 kΩ [28]. Even in the 1960’s, the input impedance of the biopotentialamplifiers was not typically higher than a few megaohms [31]. The evolution of silicontechnology has provided not only small sized components but also higher input impedancein the amplifiers. Nowadays, the amplifiers designed to measure biopotentials are typicallyinstrumentation amplifiers, buffered differential amplifiers, constructed of three operationalamplifiers owing an input impedance around for example 100 GΩ in parallel with 3 pF [118].On the information band of the ECG signal, as presented in Section 2.4, the input impedanceof the modern amplifier varies between 1.3–51 GΩ.
High input impedance in the measurement amplifier is essential in retaining the character-istics of the signal. When the input impedance of the measurement amplifier is high, thecurrent drawn by the circuitry shown in Fig 3.2 remains low. This implies that the voltagedrop across the electrode–electrolyte interface is small and the signal is recorded with almostthe same amplitude as originally possessed at the electrode [28].
The noise components of the amplifier in Fig 3.2 are typically low and in majority of casesnegligible. The spectral noise densities for INA333 instrumentation amplifier manufacturedby Texas Instruments [118], measured at f =10 Hz, are in = 100 fA/
√Hz and vn = 50 nV/
√Hz.
The total noise voltage of the amplifier at the information band of the ECG signal, see Sec-tion 2.4, can be estimated with the current and voltage noise density values at 10 Hz to be0.3 µVrms. From Section 2.3 it can be read that for most stable electrodes, the referenceelectrodes, the voltage fluctuation can be at the lowest in the order of micro-volts. All otherelectrodes are lying well above these values, Section 2.7, so the noise of the instrumentationamplifier is not an issue.
The differential amplifiers are designed in such a way that the differential signals are ampli-fied but common mode signals are not. The ability of the amplifier to reject the common mode

3.1. A short introduction to biopotential amplifiers 31
signals from being amplified is called the common mode rejection ratio (CMRR). CMRR isdefined in dB scale as [42, 105]
CMRR = 20lg∣∣∣∣ AdAcm
∣∣∣∣ (3.16)
where Ad is the differential gain of the amplifier and Acm is the common mode gain. A typicalvalue for CMRR in the 1960’s was 60 dB [42], today typical values range between 90–115dB [118].
The CMRR of the amplifier is in any case finite and many sources of interference are usuallypresent in the measurement environment. Huhta et al. have presented a list of the threecoupling mechanisms of interferences to the measurement [42, 119]:
1. Magnetic fields (induced into leads, from power line, motors, transformers, etc.)
2. Electric fields (displacement currents induced into the body from power lines, fluores-cent lamps, etc.)
3. Electromagnetic fields (modulated RF signals, from diathermy, electrosurgery, etc.).
All the interference sources may cause substantial disturbances in the measurements. Mag-netic disturbances can be rejected by keeping the area of the closed measurement loop smallsince the noise voltage the magnetic flux will generate in the measurement leads is propor-tional to the area. [42, 132]
The AC signals propagating in the power lines will be coupled to the measurement capaci-tively either through the person or the subject to be measured or through the measurementwires. The noise coupled to the measurement signal through the measurement leads betweenthe electrodes and the first stage amplifier can be reduced by shielding the cables. [42, 73]The shielding of the cables can be carried out by using coaxial measurement leads with theshield connected into the ground potential of the measurement electronics [132].
The common mode potential coupled to the measurements through the patient can be reducedby feeding the common mode signal back to the patient using a so called driven right legcircuit. This is realised by using an amplifier that has a current limiter and feeds the signal tothe patient through a third electrode [42, 73, 131]. The amplifier traditionally used has beenan operational amplifier but Spinelli et al. have proposed to use a transconductance amplifierfor this purpose. The usage of the transconductance amplifier allows wider bandwidth of thecommon mode signal and being a current feeding method, the electrode–electrolyte interfaceproperties play no role in the compensation efficiency [109].
Metting van Rijn et al. have listed the properties of a good biopotential amplifier:
1. very high common-mode input impedance (> 100 MΩ at 50 Hz)

32 3. Physiological surface measurement devices using electrodes
2. high differential-mode input impedance (>10MΩ at 50 Hz)
3. equal common-mode input impedance for all inputs
4. high common mode rejection ratio (> 80 dB at 50 Hz)
5. shielded input cables; the shields must be driven by a proper guarding circuit
6. additional reduction of common-mode voltage with a driven right leg circuit.
One further option to reduce the common mode interference from being coupled to the mea-surements is the usage of active electrodes [12]. The active electrodes will sense the potentialas traditional, passive, ones but in addition they have the ability to amplify the signal at theelectrode. This is realised by constructing the amplifier electronics either to the immediatevicinity of the electrode or the amplifier circuitry is constructed directly on the back side ofthe electrode [74, 83]. The usage of the active electrodes has been proved to be a very effec-tive means to reduce the common mode interference in the measurement [12, 74]. Nishimuraet al. showed that the use of an active electrode reduces or completely removes the need forpreparation of the patient skin prior to the measurements. They were also able to leave out theconductive electrolytic gel from the interface and still gain good quality measurement results.[83]
3.2 A selection of surface measurement devices measuring ECG andbioimpedance
To get an overview of some of the surface measurement applications where electrodes andespecially textile based electrodes are being used, a very brief and compact literature reviewon the subject is presented.
Vuorela et al. have presented portable, lightweight measurement devices to measure bioimpe-dance [127, 128]. The devices are designed for measuring the ECG and respiratory parame-ters of a human by means of bioimpedance measurement and data analysis. Seppä et al. havesuccessfully used the devices in measuring ECG and ventilation parameters non-invasivelyfrom test persons with minimal body geometry deformations due to physical activity [106].They have also measured the minute ventilation of a running test person with the device withrelatively good success [107].
The bioimpedance measurements have also been used in the determination of the water bal-ance of humans. Medrano et al. have presented in [69] a portable bioimpedance measurementsystem to determine the water balance in humans. Medrano et al. have further measured thewater balance from elderly people as a part of treatment in nursing homes [71].

3.2. A selection of surface measurement devices measuring ECG and bioimpedance 33
The determination of the minute ventilation with the aid of bioimpedance measurements is atime domain measurement where the frequency of the system is kept constant. In applicationsreported by Seppä et al. in [106–108], the applied frequency was around 100 kHz. In appli-cations for determining the water balance, the approach to the problem lies in the frequencyplane. The frequency of the signal drawn between electrodes is swept and the response ofthe measured impedance plotted. The water balance can be determined from the impedanceby utilising the Cole-Cole model [66, 69]. The frequencies used in the research by Medranoet al. varied between 5 kHz and 1 MHz. In general, the bioimpedance measurements can beused to obtain information on a very large scale of illnesses and function of the organs. Agood list, yet not necessarily complete, of possible measurement targets is given in [123].
In an article presented by Mühlsteff et al. [79], they suggested a portable and wearablemeasurement device capable of measuring the ECG of the test person as well as his activity.The device incorporates electrodes constructed of carbon-loaded rubber moulded in a form ofa band that is to be placed around the thorax of the test person. The results achieved with therubber electrodes were fairly good. However, the initial settling of the electrodes to reach astable level took 3–15 minutes depending on the person and the skin properties. 5–10 secondsof data was typically lost when motion artefacts were introduced.
Rita Paradiso with her research group has been very active in the field of wearable mea-surement applications employing textile electrodes [62, 89, 91]. They have been researchingtextile yarns to be used as conductors in smart clothing and the use of textile electrodesto measure mainly ECG. In an article by Paradiso et al. [91] there is a presentation of awearable, comprehensive health monitoring system which uses knitted textile electrodes tomeasure ECG. The electrodes have been made of a thin stainless steel wire. To improve theelectrical signal quality under dynamic conditions, a hydro-gel membrane was being usedwith the electrodes. Based on the data and figures presented in [91], Paradiso has also ap-plied for a US patent for the method of measuring respiratory, movement and cardiac signalswith knitted electrodes arranged in a certain way on the garment [88]. The same hydro-gelmembrane was used in a paper by Puurtinen et al. where the textile electrode behaviour wasexamined when placed on human thigh both dry, wet and with hydro-gel membrane [95].The results indicate that the hydro-gel enhanced interface between skin and electrode showshigher stability than dry or even wet electrode.
Nowadays, the market potential for portable, light-weight physiological measurement de-vices to measure ECG or heart rate is huge. There are several commercial applications on themarket that measure the heart rate of a test person. The technique of measuring the ECG andderiving the heart rate from the ECG signal is well-known and easily accessible by everyone.Therefore the accuracy of the devices and overall quality are widespread. The majority ofthe measurement devices rely on carbon loaded rubber electrodes attached on a belt that ismounted around the chest of the test person. Two major Finnish players in the heart rate mon-

34 3. Physiological surface measurement devices using electrodes
itor markets are Suunto (http://www.suunto.com) and Polar (http://www.polar.fi/en). Suuntohas collaborated with a Finnish software house, Firstbeat (http://www.firstbeat.fi), regard-ing the R-spike identification algorithm. The two presented companies are also respectedinternationally although there are companies like EKHO (http://www.ekho.us) and Timex(http://www.timex.com) that are more incorporated in the US markets. Although the technol-ogy used in the electrodes of these commercial devices has been proved to be feasible, still itis not suitable for continuous long-term monitoring due e.g. to the discomfort the electrodebelt causes to the subject. Hence, more research is needed before electrodes suitable for themass market and capable of performing long-term measurements can be assumed to appearon the market.
3.3 Surface electrode characterisation results
The interface noise originating from the electrode–electrolyte interface is one of the crucialcomponents to be aware of when choosing electrode materials for surface measurement ap-plications. Section 2.6 introduced various mechanisms that give rise to artefacts that disturbthe measurements. One of the artefacts is the interface noise whose measurement principlehas been introduced in Section 2.7.
In surface measurements, relatively short stabilisation time for the electrode–electrolyte inter-face is desired. Typically Ag/AgCl -electrodes are used which are generally known to possesssuitable characteristics to be used in the sensitive surface bio-potential measurements oftensuffering from artefacts [43]. Other metallic materials to be used as bio-potential electrodeswere also researched under the conduction of the thesis to find out their performance withrespect to Ag/AgCl electrodes.
The size of the measurement electrodes should be in relation with the electrochemical noiseit exhibits and the interface component values should change as a function of the size. Theseissues were also studied with measurements. Theoretical calculations for the noise–area re-lationship are presented in an article by Huigen et al. [43]. P2 reports the electrochemicalnoise of electrodes made of the same material but having different sizes. P1 and P7 report therelationship between the electrode–electrolyte interface component values with respect to thechanges in the geometrical area of the electrodes.
3.3.1 Results of electrode-electrolyte interface noise measurements
Several noise measurements were conducted first of which was made with Ag, Ag/AgCl andPt electrodes (P7) and the second with Ag, Au, Pt and stainless steel electrodes (P2) immersedin a liquid electrolyte. The research reported in P2 also the effect of the electrolyte havingon the measured noise was studied. Three electrolytes were used: saline (0.9 m-% NaCl),

3.3. Surface electrode characterisation results 35
phosphate buffered saline (PBS) and simulated body fluid (SBF). The size of the Ag andAg/AgCl -electrodes was varied by a factor of two in the first experiment (P7). The secondexperiment (P2) with four electrode materials also included electrodes in two different sizeswhere the sizes for all electrode materials were varied by a factor of two.
The noise measurements were performed in the first experiment with an Agilent spectrumanalyser 4396B and in the second experiment a spectrum analyser HP3561A by Hewlett-Packard was used. The results were mean valued over 16 or 32 samples to reduce the variancein the results [4].
The noise measurements done and reported in P7 clearly show that with relatively shortstabilisation time of two minutes, the Ag/AgCl electrodes exhibit the least electrochemicalnoise thus they are very suitable for surface measurements where both movement artefactsare present (sport applications or medical applications including possibility of movements)and/or the measurement results are needed rapidly after applying the electrodes on the skinof the subject (e.g. hospital environment, emergency care in an ambulance).
Measurement results reported in P2 reveal the differences in the electrochemical noise mea-surements between three electrolytes. The electrolytes had different conductivities whichwere measured with a four-wire conductivity meter. The conductivity of saline was measuredto have a conductivity falling in between the two other electrolytes, PBS and SBF. Accordingto the measurement results, the steel electrodes (material AISI 316L) showed low electro-chemical noise levels after being stabilised for one minute. They exhibited even lower noiselevels than the Ag/AgCl electrodes which are generally regarded as the electrodes exhibitingthe lowest noise level [43], P7. Au electrodes were measured to be the third best alternativeas electrode material with respect to low electrochemical noise. Pt electrodes showed thehighest noise level after the stabilisation time of one minute.
The relation between the surface area and the electrochemical noise the electrodes exhibit,obey the theory presented in [43] relatively good in the previously mentioned publications.The electrochemical noise amplitude should be inversely proportional to the square root ofthe electrode area. The relation between the measured electrochemical noise and the areaof Ag/AgCl electrodes does not match the theory in P2. The problem is most probably dueto imperfect AgCl-layer on the Ag electrode. The chloriding process was taking place in asaline solution with a 3 V potential difference with negative polarisation between the workingand target electrode and the process was held on for two minutes. Longer time would haveprovided a more stable AgCl layer [113, 130]. Despite imperfect AgCl layer on the Agelectrode, it is obvious that the AgCl coating has a stabilising effect on the electrochemicalnoise behaviour of the Ag electrodes.
For wearable applications, the textile electrodes are a more feasible choice for electrodesthan purely metallic ones researched in the previously mentioned studies. Electrochemical

36 3. Physiological surface measurement devices using electrodes
noise measurements were also done with textile electrodes. The measurements and resultsare reported in P6.
In the noise measurements of the textile electrodes, four different textile electrodes wereused. The conductive material in the electrodes was either silver or copper coated polyamidefibre. One of the electrodes also had a conductive polyuretane layer on the reverse side of theelectrode. Silver has been widely used in textile electrodes [6, 16] although fibres made ofstainless steel have also been used [89]. The electrolyte used in the measurements was madeof Agar-gel and for the measurements it was cut to a block of size (l,w,h) 5.3 x 5.1 x 4.7 cm.The conductivity of the Agar-block was set to match the conductivity of a wet human skin.The electrodes to be measured were applied on top and bottom of the gel block. A specialmeasurement stand and setup was used to apply a constant static pressure on the electrodesto secure a good galvanic contact between the gel and the electrodes. The measurement standhas been presented by Beckmann et al. in [6]. The electrodes were cut from the fabric so thatthey had area slightly exceeding that of the Agar-block’s. The excess area was used to connectthe measurement wires to the electrodes by crocodile clips as well it defined the orthogonalcontact area of the electrodes to be exactly the same as the size of the Agar-block thus allmeasurements are equivalent in electrode area since the same block was used throughout themeasurements.
An instrumentation amplifier AD620BRZ by Analog Devices was used to sense and amplifythe differential signal from the electrodes. The amplified signal was measured with a NationalInstruments USB-connected DAQ, type USB-6251 BNC. The signal was then converted fromthe time domain into the frequency domain by applying an FFT-algorithm on the data. TheRMS-noise of the electrode was calculated using Equation 2.5 and bandwidth which wasused was lying between 0 and 500 Hz.
The electrodes were applied on the Agar-block and the measurements of the noise were be-gun primarily after two minutes. The electrode noise data was recorded for 70 s each timeand the measurements were performed after the initial measurement at 5, 10, 15, 20, 25, 30,45 and 60 minutes from the application of the electrodes on the Agar-block. The time instantsof the individual measurements serve as the time the electrode–electrolyte interface has beenlet to stabilise. The RMS-noise of each measurement section was calculated and the noiseof different materials were compared as a function of time. In addition to use four differ-ent electrode materials, also three different preparation schemes were being applied on theelectrodes: dry electrodes (unconditioned), electrodes with a hydrogel membrane suppliedby ST&D Ltd., Belfast, U.K. at the interface to enhance the contact with the electrolyte andelectrodes moistened with the PBS solution to mimic sweat on the skin.
The measurement results reported in P6 clearly indicate that despite the material of the elec-trode, the stabilisation time remains under 10 minutes. Only some materials showed longerstabilisation times, 25–30 minutes, when they were unconditioned or had a hydrogel mem-

3.3. Surface electrode characterisation results 37
brane between the electrode and the electrolyte. Results also indicated that the electrodes thathad been moistened with the PBS, showed the most stable behaviour with time. All the fourtested materials seemed to have been stabilised after 10 minutes of application. The ratio ofthe electrochemical RMS-noise between measurements done after 2-3 minutes the applica-tion and measurement after 10 minutes or more is one decade in almost any case. In fact, thenoise value has been reduced by a decade between the measurements at 2-3 and 5 minutesyet the interface is not completely stabilised.
What was surprising in the results was that the RMS-noise values of all materials rose be-tween 30 and 45 minutes. An explanation for this kind of behaviour could be that the interfacedries up. This would especially be the case with hydrogel and PBS treated interfaces. Thesame behaviour was, however, seen for the unconditioned electrodes as well. Of all materi-als only for one material, called Kassel RS, the RMS value decreased again as time elapsedfrom 45 to 60 minutes. The material was the only material for which the conductive fibreswere partly made of copper. Another possible explanation for the elevated noise values at 45and 60 minutes is that the electrode textiles themselves absorb moisture from the Agar-blockcausing the interface to be in a state of constant variation.
3.3.2 Results of impedance measurements of the electrode-electrolyte interface
The impedance measurements of the electrode–electrolyte interface for the materials used inthe research in P7 were performed with an LCR-meter HP4262A by Hewlett-Packard. Themeasurements were performed at two frequencies, 120 Hz and 1 kHz. The results obtainedwith the measurement device are, however, erroneous when compared to results reported inP1 or values e.g. in [28]. The resistive part of the interface impedance according to P7 is in theorder of tens of ohms although according to results obtained in P1, the resistive part is in theorder of hundreds of kilo ohms with virtually the same contact area. The results of the latterare in line with the results shown in [28]. Reason for the errors occurring in the measurementresults is unknown yet with high probability errors are due to LCR-measurement device’scapability to reliably measure impedance lying in this range. The results obtained in P7seemed to satisfy the measurement scale of the device but when results in [28] or P1 areexamined, the span of the measurement range is no longer enough to measure the interfacecomponents correctly.
Consecutive electrode impedance measurements were done with the measurement methodutilising square waves. The method is discussed in more detail in Section 2.8. Measurementspresented in P1 were done with Au, Pt, stainless steel (AISI 316L) and Ag/AgCl electrodesand they were performed at 40, 75, 110, 200 and 350 Hz. The input and output waveformsillustrated in Fig 2.7, were measured with a PCI-6052E DAQ by National Instruments. Themeasurement current density varied between 850 µA/cm2 and 2000 µA/cm2 depending on theseparation and area of the electrodes. In the analysis of the measurement results, the modified

38 3. Physiological surface measurement devices using electrodes
Warburg circuit equivalent was used, namely the low frequency approximation illustrated inFig 2.4(a). This model was used because the analysis was found to be very sensitive to theaccuracy of the measured waveforms and erroneous results, e.g. imaginary resistances, wereobtained when the most complex circuit equivalent was used as shown in Fig 2.6.
Interface component measurements indicated that the Ag/AgCl electrode had the greatestinterface capacitance compared to other materials under research. This seems to be in con-troversy with the known fact that Ag/AgCl is a non-polarised material whose behaviour atthe interface should be mainly resistive. However, according to results obtained in P1, theinterface resistance of Ag/AgCl is much lower than for other three materials. Capacitance is,however, greater but the same behaviour has been reported in [28] as well. In conclusion, thesquare wave measurement method of the interface component values seems to be applicablealso in the case of non-polarised materials. This statement is opposite to what is stated in P1.
The power law behaviour of interface resistance and capacitance mentioned in Section 2.4was verified in the research. The slope of interface resistance for polarised materials (Pt, Auand AISI 316L) was calculated to be between 0.70 and 0.95 for 7 x 7 x 0.5 mm electrodes andfrom 0.43 to 0.54 for 3.5 x 7 x 0.5 mm electrodes. The corresponding powers for interfacecapacitance were between 0.16 and 0.26 for electrodes with greater area and 0.34 and 0.48for electrodes with smaller area. The values of the slope of the impedance vs. frequency plotare in good relation with the values suggested in [7, 14, 28, 30, 103, 126]. It is interesting tonote that the slope of the exponential curve depends on the area of the electrode. It seems thatthe absolute value of the slope of the resistance as a function of frequency is proportional tothe area of the electrode whereas the absolute value of the capacitance slope is inversely pro-portional to the area. For non-polarised electrodes, Ag/AgCl, the slopes were not calculateddue to the partly non-linear behaviour of the impedance curves. The non-linear behaviour ismost probably related to the current density at the electrodes.
Impedance measurements made with textile electrodes were conducted in the same manner asfor the solid metallic electrodes revised earlier in this chapter. The measurement range was,however, only up to 10 Hz due to a very low signal level at higher frequencies. Impedancemeasurements were performed after the noise measurements without breaking the connectionof the electrode and electrolyte. According to Mühlsteff et al. [78], the interface impedancehas reached its long-term equilibrium after approximately 60 minutes. More specific expla-nation about the measurement setups and measurement results can be found in P6.
The slope of the resistance and capacitance vs. frequency that were obtained in the mea-surements were between 0.14 and 0.58 for resistance and 0.62 to 0.80 for the capacitance.The values for resistance vary a lot yet covering the whole range estimated by the modelspresented in Section 2.4. The values calculated for the capacitance were more constant thanfor the resistance and the variation was smaller both between the electrode materials and theelectrode preparations. The measurement alternating current density was kept on a low level

3.3. Surface electrode characterisation results 39
being only 0.61 µA/cm2 which guaranteed the impedance to lie in its linear range while thedirect current density was 5 nA/cm2. According to Bera et al. this kind of superimposed AC-and DC-stimulation more reliably simulate the actual measurement situation and more real-istic measurement results are obtained [7]. From the measurement results the same tendencyas for the RMS-noise could be seen: the preparation of the electrode–electrolyte surface gavemore stable measurement results. The PBS conditioned interface gave the most stable mea-surement results.
The interface resistance of the textile electrodes with respect to their unit geometrical areawas in the range of 3 kΩ/cm2 whereas for the metallic electrodes it was in the order of 1MΩ/cm2. For the interface capacitance, the corresponding numbers were 4 µF/cm2 and 180µF/cm2, respectively. Based on these measurement results, the textile electrodes seem to bemore non-polarised than the solid metallic electrodes. On the other hand, the conductivematerial of the textile electrodes was also different, Ag or Cu, whereas for the metallic onesthe interface material was one of the following: Ag, Ag/AgCl, Pt, AISI 316L or Au. Also theeffective area of the textile electrodes is much larger than their geometric area. Therefore thevalues calculated for the components per unit area are not directly comparable.

40 3. Physiological surface measurement devices using electrodes

4. IMPLANTABLE PHYSIOLOGICAL MEASUREMENT DEVICES
4.1 Devices for monitoring purposes
Monitoring and measuring the laboratory animals is a frequently used method in conductingscientific researches, e.g. drug experiments. As the laboratory animals are typically small,rats for example, implantable applications with wireless links to an external reader deviceare in many cases good alternatives for long term measurements thanks to their user friendlyappearance for such purpose. Implantable devices also allow free movement of the animalswithout disturbing wires. In short term studies, the implanted devices are not necessarily thebest choice to be used as physiology measurement devices because of the risks and inconve-nience related to the implantation [86]. Implantable devices with wireless link to the externalreader device are subject to regulations of the allowed radio frequency (RF) radiation in thesubject body. Standard stating the limits for radiation still considered harmless to the body isthe IEEE/ANSI c95.1 – 2005 standard [45]. In the development process of new measurementdevices, the recommendations stated by the standard have to be taken into account. Althoughthe recommendations are given with respect to human exposure of the RF radiation, the samevalues can be successfully applied to the animal applications as well.
Kramers et al. have reported of an experiment with an implantable blood pressure (BP) mea-surement device implanted in mice. Alternative way to measure the blood pressure of thelaboratory mice has been the indirect tail-cuff plethysmography method (surface measure-ment). According to their research, the mice with the implantable devices exhibit lowerstress levels than the mice whose blood pressure is being measured with the traditional tail-cuff method. The greatest individual factor contributing the stress level of the test animals isthe implantation procedure. [56]
In the following sections, a brief review is being introduced regarding implantable applica-tions used for measuring of biopotentials and blood pressure. Biopotential measurement isessentially related to the thesis and implantable devices measuring ECG have been discussedin P3, P4, P5, P8 and P9. The blood pressure devices are taken into account since manyof these also enable measurement of biopotentials and blood pressure measurements havebeen performed with resonance-based measurement devices. A resonance-based measure-ment device is presented in P5 and therefore other resonance-based devices are in relevance

42 4. Implantable physiological measurement devices
to the thesis. The implantable devices are divided into three groups: Battery powered de-vices, sometimes called active implants, inductively powered devices, also known as passiveimplantable devices and resonance-based devices, which are totally passive devices withoutany active electronic components. Fig 4.1 shows a block diagram of the three device groupstogether with the applications related to these groups presented in the text.
Implantable
measurement
devices
Battery
operated
Inductively
poweredResonance-
based
Neural
measurements
ECG
(ILRetc.)
Blood
pressure(BP)
Temperature
measurements
Neuraland
cardiac
BPmeas.
ECG
BP
Humidity
ECG
Fig. 4.1. A block diagram of the three implantable device groups discussed in the text together with theapplications related to these groups.
4.1.1 Battery powered devices
Neural measurements are difficult to be performed with the surface measurement devicespartly due to the applicability of the measurement sensors on the skull surface and partly be-cause of the devices attached to the proximity of the head of the subject disturbing the mea-surements. In his PhD dissertation Ming developed an implantable wireless neural recordingsystem with a system-on-a-chip measurement unit and a receiver unit connected to a com-puter [75]. The developed measurement device was designed to measure electrical neuralsignals, e.g. extracellular neural action potentials and EEG and it was also tested in vivo withrats and found to be functional. The device used 900 MHz link to communicate with themeasurement computer for data transmission.
Detecting heart malfunctions is not an easy task since the malfunctions are not predictable.Also taking patients in to a hospital during the survey period, is not a cost effective option.

4.1. Devices for monitoring purposes 43
An implantable loop recorder (ILR) has been developed to provide possibility to continuouslymeasure the function of the heart and record the events by pressing a button [72]. Accordingto a research by Farwell et al. , the usage of ILR will to some extent increase the overallquality of life of the patients with recurrent heart problems [24]. Krahn et al. have alsoproved the ILR to be a very efficient tool in obtaining clinical cause for the recurrent heartproblems. In their study, 16 patients with the episodes were researched to whose problemsno clinical explanation could be found with the traditional monitoring techniques. With ILRimplanted, 15 of the patients had the episode during the surveillance period and in every casea diagnose was obtained and successful therapy was begun. [55]
From an article by Potkay et al. [94], a comprehensive review of implantable blood pres-sure sensors can be found. For scientific purposes, widely used implantable devices tomeasure the blood pressure are the ones manufactured by Data Sciences International (DSI)(http://www.datasci.com). The variety of the products provided by DSI include devices ableto measure EEG, ECG, temperature and blood pressure. The DSI devices are of the activetype and have battery lifetime up to 12 months. The batteries in the DSI devices are primarybatteries so that they cannot be recharged. The sensors, pressure sensors and electrodes, ofthe measurement devices, can be placed both on the surface of the heart and inside of it. Aresearch conducted by Malpas, however, suggests that devices where the battery can be induc-tively loaded during the research provide more flexibility and longer duration to the research[64]. Implantable devices able to measure the same variables as the previously mentionedDSI devices but which can be inductively recharged are provided by Telemetry Research(http:// www.telemetryresearch.com/).
Valdarstri et al. have reported of an implantable measurement device that is able to measurethe temperature and blood pressure [122]. The device communicates with an external re-ceiver through a ZigBee radio operating at 2.4 GHz, incorporating a horizontal loop antennawhich is found to be the most effective option for a subcutaneous RF-antenna [51]. What issurprising in the results of the research, is that the device was implanted 3–4 cm deep but stillerror less signal was obtained with relatively low transmission power, only 31.6 µW. It hasbeen previously reported that operating at mid-UHF or low-GHz range is needed to be ableto obtain several centimetres penetration of RF-signals in tissues [121].
4.1.2 Remotely powered devices
Passively functioning implantable devices are typically powered up over an inductive linkbetween an external reader device on the surface of the skin and a subcutaneous measurementdevice. The ultrasonic powering of the implantable devices has also been researched but thesensitivity of the transmitted ultrasonic power to the matching of the acoustic impedance ofthe transmitter and the skin limits the applicability of this technique [3].

44 4. Implantable physiological measurement devices
Eggers et al. have presented an implantable device to measure intracranial pressure which ispowered through an inductive coupling [22]. The device is coated with a silicone elastomerand it incorporates an integrated receiver coil with dimensions of 5 x 5 mm that is made ofelectroplated Au layer on a silicon substrate. The telemetry unit was originally developed byDudenbostel et al. [20]. Najafi et al. have also presented a similar kind of an implantableMEMS pressure sensor to measure blood pressure from a vein. The device was tested in vivoin canines [81]. The operating distance being less than 3 cm was found to be too short for theconvenient usage of the device.
Enokawa et al. have presented an implantable measurement device to measure the ECG andthe sympathetic nerve signals of small sized animals [23]. Their measurement device consistsof a PC where the measurement data is stored and analysed, a backpack for controlling theimplant and communicating with the computer and the implantable measurement device. Theimplantable device is powered with a 200 kHz magnetic signal with the aid of two coils, onein the backpack and one in the measurement device. The measurement data is transmittedthrough another inductive link from the implant to the receiver in the backpack. The researchteam have verified the function of the device on rats by in vivo tests and reported them in[23].
The inductive link determines the efficiency and operating range of the implantable measure-ment system. In order to optimise the efficiency of the inductive link, the coils forming thelink should be optimal. There are some fundamental rules for optimal coil geometry, as pre-sented e.g. in [36], but the complete optimisation of the coils is difficult in real life situationsfor example due to movement and therefore changing the distance and possibly also the ge-ometry of the coils. Donaldson et al. have examined the complexity of coil optimisation andreported it successfully in [19]. Ko et al. have presented a design procedure for optimallycoupled coils when certain border conditions related to the geometry of the coils are known[53].
The mutual movement of the resonating coils is a problem in applications where the externaldevice is wished to be portable. The movement between the coils causes variation in thecoupling coefficient of the coil pair and thus also variation in the induced voltage at the im-plantable device. Furthermore, variation causes depth variation in the reflected signal whichdeteriorates the received signal if amplitude coding is being used. Van Schuylenbergh et al.have proposed means to compensate for the mutual movement of the coils to regain optimalsignal over wider range of measurement distances [125]. According to their idea, a secondcoil is introduced in the reader device which senses the load modulated signal reflected fromthe implantable device. The other coil is used for power transmission. A constant tuningof the power supplying frequency is possible because of the two coils used for power anddata transmission and the link can be held functional from longer distances than without thetuning circuitry. Van Schuylenbergh et al. used 1 MHz frequency in their experiments and

4.1. Devices for monitoring purposes 45
obtained operation distances up to 70 mm for reliable data transmission. Zierhofer et al. havereported on enhanced coupling coefficients between two inductive coils when the coils arenot concentrated on the circumferences of the coils but are distributed over the radius of thecoils [135, 136].
An important and interesting method to construct coils for applications where the appliedfrequencies are in the order of tens of megahertz, is constructing the coil on the substrate ofthe device. The substrate may be a printed circuit board (PCB) or a silicon substrate. Yueet al. have published a paper on the modelling of spiral inductors made on silicon substrate[133]. Sunderarajan has also successfully presented methods to mathematically calculateand simulate on-chip inductors in his PhD thesis [112]. He also designed optimal spiral coilstructures functioning at 2 and 3 GHz. With a careful design of the resonating coils, veryhigh power can be transferred wireless. Kurs et al. have reported of powering up an 60 Wincandescent lamp from a 2 m distance utilising four coils [57].
4.1.3 Resonance-based devices
The measurement principle in the resonance-based devices is relying on an inductive couplingbetween an external detector and a sensor. The sensor can be either on the skin surface or itmay be implanted. The two devices are inductively coupled with each other through the coilson the devices. The sensor does not contain any active electronic components, but it consistsonly of an LC-tank with a resonance frequency f0. The LC-tank is constructed of capacitiveand inductive components with at least one whose value is able to vary as a function ofthe measured quantity. The inductive connection between the reader device and the sensortogether with the reflected impedance from the sensor is shown in Fig 4.2.
R1 R2
M
C2L2L1Ztot C1
R1
L1
X2
SensorDetector
Sensor
Fig. 4.2. Schematic figure of the measurement principle with the resonance sensor. One of the sec-ondary circuit (sensor) components, C2, L2 or R2, may change as a function of the measure-ment quantity.
The changes in the measured quantity may change the value of one of the passive components,C2, L2 or R2, at the sensor. While one of the values change, the others remain fixed. Thechanges in the component values at the sensor will alter the reflected impedance of the sensor.The right hand side of Fig 4.2 illustrates how the impedance of the sensor will be reflectedand seen at the detector. The equations to calculate value for X2 can be found e.g. in [1, 36,

46 4. Implantable physiological measurement devices
39] and from P5. When the reflected impedance of the sensor changes, it also changes theresonance frequency of the detector circuit. By measuring the resonance frequency of thedetector, the value of the reflected impedance, and hence the value of the varied componentat the sensor can be calculated. The signal transmission method is called load shift keying(LSK) and it is handled in more detail in an article by Tang et al. [117].
The resonance frequency of such a system is typically set to several megahertz due to smallerphysical dimensions of the coils at these frequencies [121]. Harpster et al. present in theirarticle a good illustration about the influence of different geometrical and electrical factors tothe depth of the resonance [39].
A passive humidity sensor based on the resonance effect between a reader device and a sep-arate LC-tank has been presented by Harpster et al. in [39]. A capacitive humidity sensor isbeing used in the application as the frequency shifting component in the sensor. The reso-nance frequency of the system was set to lie between 17–18 MHz and the signal was possibleto read only from a very close proximity of the sensor. The measurement distance with aferrite core coil was only 1 cm. The humidity sensor was tested in vivo in guinea pigs tomonitor the hermeticity of the implanted package [38].
A resonance-based pressure sensor has been developed and presented by Akar et al. in [1].The pressure is measured by using a capacitive pressure sensor made of silicon. The operatingfrequency of the device is at 70–75 MHz. Takahata et al. have designed an implantableresonant pressure sensor which is implanted with an angioplasty stent [115]. The stent itselfis made of 50 µm thick stainless steel foil by laser cutting and the structure is designed so thatcontrolled fractions will occur at certain places thus forming a coil as the angioplasty balloonis inflated. The operating frequency of the device is around 201 MHz when it is operated ina liquid ambient.
All the resonance-based devices presented so far have been based on measurement of me-chanical quantity, the blood pressure. However, also biopotentials can be measured utilisingthe resonance sensing technique. Towe has presented in his paper [121] a measurement devicebased on the resonance effect where the secondary circuit values are changed by a varactor,i.e. a variable capacitance diode. The operating frequency of the sensor was 300 MHz. Thevoltage difference between the electrodes connected to the test person is used to variate thecapacitance of the varactor and the biopotential can be measured. In his paper, Towe demon-strated the functionality of the measurement device by measuring the ECG signal. The samekind of measurement device has been constructed and presented in P5 yet various detectionmethods are presented in more detail in the latter paper.
Karilainen et al. have presented an alternative approach to measure the biopotentials using avaractor. The measurement system proposed in [48] is based on the same kind of a loadingcircuit as discussed earlier, whose impedance can be changed by a potential coupled betweenelectrodes that are connected over a varactor. The coupling between the sensor and the reader

4.2. Material considerations for implantable applications 47
device of the proposed measurement system is, however, different from the ones presented inP5 and [121]. The coupling of the sensor to the reader, or interrogation device, is realised byinterdigital transducers (IDT). The IDT of the sensor is coupled to a surface acoustic wave(SAW) delay line which also contains two other IDT. The first of these two IDT is used asreference to compensate for the transmission line effects and it can also be used to distinguishbetween several separate sensors. One interrogation unit is capable of reading six sensors ata time. The second IDT at the end of the delay line will reflect back the incoming signalmodified by the varying impedance of the load circuit. The biopotential can be read at theinterrogation unit from the reflected signal. The sensor structure and optimisation are alsopresented in [49] and the design and properties of the interrogation unit in [25].
4.2 Material considerations for implantable applications
The implantable devices meet a very challenging environment. The materials to be used inthe devices have to be such that the tissue response evoked by them remains minimal. When amaterial shows a minimal tissue response, it is called a biocompatible material. Geddes et al.have listed four important factors to be taken into account with the implantable (electrode)materials: 1) tissue response, 2) allergic response, 3) electrode-tissue impedance, and 4)radiographic visibility. [32]
The measurement and stimulation devices meant either for biopotential measurement or stim-ulation of muscles based on biopotential data, both traditionally need a galvanic contact to bebuilt between the device and the tissue. The device itself must be hermetically coated with abiocompatible material and but the electrodes shall remain uncoated. The electrode materialhas to be chosen so that it is biocompatible with the tissue.
Some of the electrode materials that are suitable for surface measurements are not suitablefor implantable applications. Good examples of such materials are e.g. Ag/AgCl whichis widely used in surface electrodes and Ag. The AgCl-layer is found to dissolve into thetissues causing severe inflammation in the tissue surrounding it [77]. Pure silver has beenwidely used as antibacterial material in many applications [50]. However, pure silver hasalso been proved to be extremely toxic to the tissues when implanted [99].
Collias et al. conducted an extensive research on implantable electrode materials [15]. Inthe research, they implanted several electrodes made of stainless steel into the brains of cats.Their study consisted of many phases where they studied the tissue reactions caused by theelectrodes. After four months of implantation, all the electrodes were tightly surrounded bya thick, dense fibrotic capsule. Despite the fibrotic capsule formation, stainless steel wasregarded as biocompatible material suitable for long term implantation. Stainless steel hasalso been widely used in other, often mechanical applications that are implanted, e.g. inscrews closing the sternum after an open-heart operation [47].

48 4. Implantable physiological measurement devices
In addition to stainless steel, also gold (Au) and platinum (Pt) have been found to be bio-compatible [10, 99, 110]. Pt and Au show good biocompatibility when used in measurementpurposes. When the stimulation of nerves or muscles is desired, Au will easily be corrodeddue to high current density at the interface. Pt show better stimulation capability due to itscapability of not being corroded under high current density. [10]
Titanium (Ti) is a widely used material in the cans of the implantable devices, e.g. pacemak-ers. Ti has an excellent compatibility with the tissues. It also forms an oxide layer on thesurface which makes the material even more susceptible to corrosion [10, 21, 111]. Zhang etal. have presented in their paper that the TiO2 material has also properties that are favourablein blood contact. The TiO2 coated low-temperature isotropic pyrolytic carbon showed muchless trombus on itself than the uncoated material [134]. Ti electrodes are not widely usedbut as in all measurement applications, the current density on the electrode surface remainssmall, which corresponds to almost a static or non-electric application where the corrosiontolerance of Ti is known to be excellent.
4.3 Inductively powered ECG monitor: Device characterisation
An inductively powered, implantable measurement device for continuous, wireless, one chan-nel ECG measurement was designed and constructed at TUT. Altogether, four different pro-totypes were constructed that were tested in vivo in cows. The number of test animals variedbetween the in vivo tests from four to eight. All the in vivo experiments were done undera valid animal experiment licence granted to the MTT Agrifood Research Finland by theFinnish animal experiments committee.
The first prototype of the device is presented in detail in P4. P8 also partly presents prototypenumber one, yet some enhancements were done to the first in vivo tested prototype, P4, e.g.the coil was changed from a commercial coil to a handmade coil to enhance the coupling.P9 presents the third prototype of the implantable ECG device. The third prototype was con-structed on flexible PCB utilising folded-flex structure. The folded-flex structure enabled theminiaturisation of the developed device. Fig 4.3 shows a photograph of the four prototypestested in vivo in cows.
During the development process of the devices, several metallic materials to be used as elec-trodes were under test to find out their electrochemical properties when in contact with aliquid electrolyte. The solution simulated the implantation conditions. These studies werediscussed in more detail in Section 3.3.2. Also the biocompatibilty issues of the electrodematerials were of interest and were studied during the process. These issues were discussedfrom the material science point of view in Section 4.2. The designed and realised prototypesof the implantable ECG measurement devices will be shortly revised in this section.

4.3. Inductively powered ECG monitor: Device characterisation 49
Fig. 4.3. In vivo tested implantable ECG monitoring devices realised at TUT. First prototype at the highleft corner, consecutive versions running row-wise.
The implantable ECG measurement device was designed to be used in monitoring of cows’well-being. The manufacturing process of the implantable device faced two border condi-tions. The first constraint was that the design and the prototype construction process shouldnot demand any special facilities or process steps. This both speeds up the prototyping andlowers the costs of the prototypes. Second border condition was that the device was to beinductively powered from an external reader device and the same link was to be used for thedata transmission. The operating frequency of the link was set at 125 kHz. The relativelylow operating frequency of the link, for comparison see e.g. [46, 57], was used because acommercial transponder integrated circuit (IC) by Atmel (U3280M) was used in the devicewhich had a specified operating frequency at 125 kHz. The chosen transponder componentwas used due to its internal voltage regulation possibility. The internal regulation capabilityof the transponder decreased the number of components and current consumption of the pro-totype device. An alternative solution would have been to use either a fixed reference diodeor an adjustable voltage regulator.
The low operating frequency of the device introduced challenges in the coil design and op-timisation. Low operation frequency means great dimensions of the coil but the coil in theimplant could, however, be made to meet the size demands set by the implantation conditions.The coils were designed to be flat as suggested by Zierhofer et al. in [135] to get optimal cou-pling between the reader and the implantable device. Operation distances in the air for thefour versions varied between 38–70 mm (first and fourth prototype).
The electrode material used in the prototype versions number one and three was AISI 316L,a.k.a. surgeon steel, in prototype number two Au and in prototype number four Ti. The

50 4. Implantable physiological measurement devices
electrodes were arranged so that the outermost electrodes were the two potential sensing i.e.measuring, electrodes and the electrode in the middle was used to set the zero potential ofthe measurement device. The distance between the middle points of the measuring electrodesvaried between 43–60 mm, being the shortest in the first prototype and longest in the fourthprototype. The mutual electrode configuration was the same in every prototype.
4.3.1 In vitro tests of the implantable ECG monitors and results
Prior entering the in vivo tests with the implantable ECG-measurement devices, some in vitrotests were being made. The tests were done with the first prototype but since the schematicof the electronics design of the third and fourth prototype was the same as with the firstprototype, there was no need to repeat the tests with the other prototypes.
The first in vitro tests were carried out in a plastic container filled with saline. The tests arereported in detail in P4 where also the result graphs are shown. The conduction and resultsof the tests are reviewed here. The ECG monitoring device was fixed at the edge of thecontainer and a sinusoidal signal was fed into the solution using two wire electrodes made ofAg and the response measured by the implantable device was measured from the outside ofthe container. This test served two purposes:
1. Prior to the implantation of the device into cows, it was needed to show that the mea-surement of potential fields is possible when the measurement device is immersed in ahighly conducting media and completely surrounded by it.
2. By using a sinusoidal input with frequency 20 Hz, it is possible to see how muchdistortion the finite sampling rate ( fs = 237 Hz) of the measurement device will causeto the measurement signal. The input frequency of the test signal was chosen to lieon the half-way of the information band of the human ECG signal [114]. Based onthe knowledge gained from previous experiments with surface measurement deviceson cows, the information in the cow-ECG was known to approximately lie on the sameinterval.
The second in vitro test was performed with the measurement device placed on the skin ofa test person. The test was almost an in vivo test with realistic human-ECG signal yet thedevice was not implanted. The second in vitro test was done to find out the performance ofthe device with ECG-signal and to compare the signal quality given by the electrodes usedto their commercial counterparts. The measurement device was held on the test person’sskin surface at the midclavicular line extending over the second and fourth rib bones. Theplace is identical with the implantation site of the Medtronic Reveal Plus ILR. Measuringthe ECG with the proposed measurement device at the same place gave a good indication ofthe performance of the device. The measurement device used electrodes made of surgeon
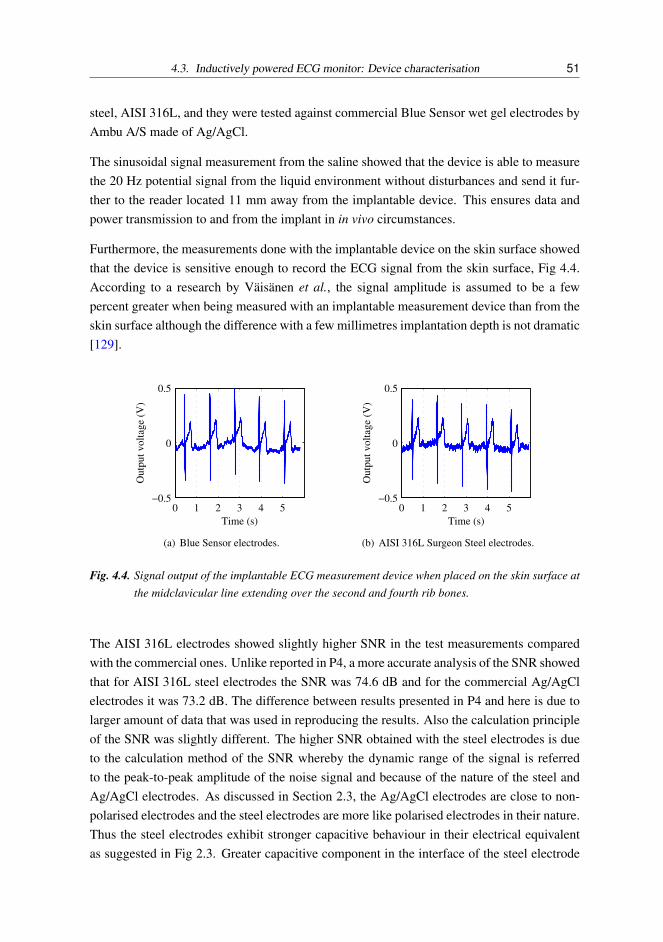
4.3. Inductively powered ECG monitor: Device characterisation 51
steel, AISI 316L, and they were tested against commercial Blue Sensor wet gel electrodes byAmbu A/S made of Ag/AgCl.
The sinusoidal signal measurement from the saline showed that the device is able to measurethe 20 Hz potential signal from the liquid environment without disturbances and send it fur-ther to the reader located 11 mm away from the implantable device. This ensures data andpower transmission to and from the implant in in vivo circumstances.
Furthermore, the measurements done with the implantable device on the skin surface showedthat the device is sensitive enough to record the ECG signal from the skin surface, Fig 4.4.According to a research by Väisänen et al., the signal amplitude is assumed to be a fewpercent greater when being measured with an implantable measurement device than from theskin surface although the difference with a few millimetres implantation depth is not dramatic[129].
0 1 2 3 4 5−0.5
0
0.5
Time (s)
Outp
ut
volt
age
(V)
(a) Blue Sensor electrodes.
0 1 2 3 4 5−0.5
0
0.5
Time (s)
Outp
ut
volt
age
(V)
(b) AISI 316L Surgeon Steel electrodes.
Fig. 4.4. Signal output of the implantable ECG measurement device when placed on the skin surface atthe midclavicular line extending over the second and fourth rib bones.
The AISI 316L electrodes showed slightly higher SNR in the test measurements comparedwith the commercial ones. Unlike reported in P4, a more accurate analysis of the SNR showedthat for AISI 316L steel electrodes the SNR was 74.6 dB and for the commercial Ag/AgClelectrodes it was 73.2 dB. The difference between results presented in P4 and here is due tolarger amount of data that was used in reproducing the results. Also the calculation principleof the SNR was slightly different. The higher SNR obtained with the steel electrodes is dueto the calculation method of the SNR whereby the dynamic range of the signal is referredto the peak-to-peak amplitude of the noise signal and because of the nature of the steel andAg/AgCl electrodes. As discussed in Section 2.3, the Ag/AgCl electrodes are close to non-polarised electrodes and the steel electrodes are more like polarised electrodes in their nature.Thus the steel electrodes exhibit stronger capacitive behaviour in their electrical equivalentas suggested in Fig 2.3. Greater capacitive component in the interface of the steel electrode

52 4. Implantable physiological measurement devices
will function as a high-pass filter which lets the QRS-complex to be recorded with higheramplitude than with the non-polarised, almost completely resistive Ag/AgCl-electrodes.
4.3.2 In vivo tests of the implantable ECG monitor and results
In vivo experiments were conducted with all of the four presented prototypes of the im-plantable ECG measurement device shown in Fig 4.3. In every in vivo measurement, theimplantable devices were implanted into the left side of the cow into a subdermal pocketwhich was sutured with two sutures. The length of the implantation periods varied from 24hours to 15 days. More specific measurement setup and results of the first in vivo experimentsare reported in P4. The effect of the orientation of the measurement device was studied underthe first in vivo experiments. There were in total four different alignment possibilities for theimplantable device:
1. Electrode array positioned horizontally, parallel to the cow spine, electrodes towardsthe body of the cow, antenna coil towards the skin of the cow.
2. Electrode array positioned horizontally, parallel to the cow spine, electrodes towardsthe skin of the cow, antenna coil towards the body of the cow.
3. Electrode array positioned vertically, orthogonal to the cow spine, electrodes towardsthe body of the cow, antenna coil towards the skin of the cow.
4. Electrode array positioned vertically, orthogonal to the cow spine, electrodes towardsthe skin of the cow, antenna coil towards the body of the cow.
Based on the measurement results presented in P4, orientation number 1 was considered asthe best due to the highest SNR although the R-spike amplitude was highest with orientationnumber 3. The difference between the SNR of orientations 3 and 4 was negligible but be-tween orientations 1 and 3 substantial (7 dB). Alignment possibility number 2 was not testedsince the results from alignments 3 and 4 suggested the SNR to remain the same but the R-spike amplitude would be halved compared to the amplitude of measurement with alignmentnumber 1. Hence, in the consecutive in vivo tests, alignment number 1 was used for all theimplanted measurement devices.
The second in vivo experiments were unfortunately unsuccessful. The power and data trans-mission to and from the implantable device was functioning perfectly but the device did notmeasure the ECG signal. The reason for this was later found out to be the conductive adhe-sive used to fixate the Au-electrodes onto the PCB of the device. The adhesive was slightlyout of date but was regarded to be in sufficiently good condition to be used in the prototypeto create the electrical connection between the electrodes and the PCB. This deduction was
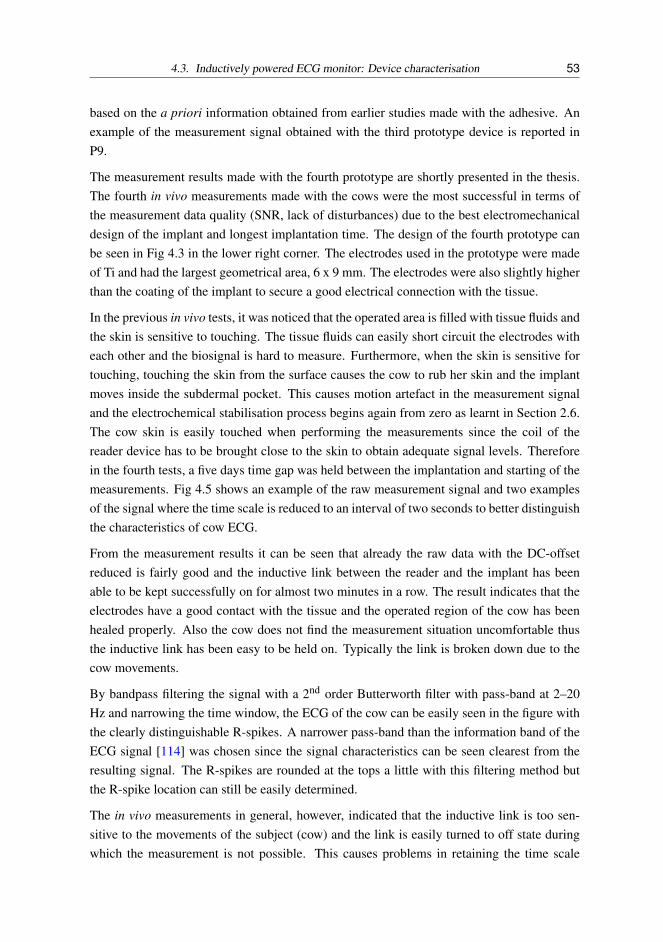
4.3. Inductively powered ECG monitor: Device characterisation 53
based on the a priori information obtained from earlier studies made with the adhesive. Anexample of the measurement signal obtained with the third prototype device is reported inP9.
The measurement results made with the fourth prototype are shortly presented in the thesis.The fourth in vivo measurements made with the cows were the most successful in terms ofthe measurement data quality (SNR, lack of disturbances) due to the best electromechanicaldesign of the implant and longest implantation time. The design of the fourth prototype canbe seen in Fig 4.3 in the lower right corner. The electrodes used in the prototype were madeof Ti and had the largest geometrical area, 6 x 9 mm. The electrodes were also slightly higherthan the coating of the implant to secure a good electrical connection with the tissue.
In the previous in vivo tests, it was noticed that the operated area is filled with tissue fluids andthe skin is sensitive to touching. The tissue fluids can easily short circuit the electrodes witheach other and the biosignal is hard to measure. Furthermore, when the skin is sensitive fortouching, touching the skin from the surface causes the cow to rub her skin and the implantmoves inside the subdermal pocket. This causes motion artefact in the measurement signaland the electrochemical stabilisation process begins again from zero as learnt in Section 2.6.The cow skin is easily touched when performing the measurements since the coil of thereader device has to be brought close to the skin to obtain adequate signal levels. Thereforein the fourth tests, a five days time gap was held between the implantation and starting of themeasurements. Fig 4.5 shows an example of the raw measurement signal and two examplesof the signal where the time scale is reduced to an interval of two seconds to better distinguishthe characteristics of cow ECG.
From the measurement results it can be seen that already the raw data with the DC-offsetreduced is fairly good and the inductive link between the reader and the implant has beenable to be kept successfully on for almost two minutes in a row. The result indicates that theelectrodes have a good contact with the tissue and the operated region of the cow has beenhealed properly. Also the cow does not find the measurement situation uncomfortable thusthe inductive link has been easy to be held on. Typically the link is broken down due to thecow movements.
By bandpass filtering the signal with a 2nd order Butterworth filter with pass-band at 2–20Hz and narrowing the time window, the ECG of the cow can be easily seen in the figure withthe clearly distinguishable R-spikes. A narrower pass-band than the information band of theECG signal [114] was chosen since the signal characteristics can be seen clearest from theresulting signal. The R-spikes are rounded at the tops a little with this filtering method butthe R-spike location can still be easily determined.
The in vivo measurements in general, however, indicated that the inductive link is too sen-sitive to the movements of the subject (cow) and the link is easily turned to off state duringwhich the measurement is not possible. This causes problems in retaining the time scale

54 4. Implantable physiological measurement devices
0 20 40 60 80 100 120−1
0
1Rawsignals
Vre
(mV
)
Rawsignal
DC−offset filtered
24 24.5 25 25.5 26−0.06
−0.02
0.02
DC−offset removed
Vre
(mV
)
24 24.5 25 25.5 26
−0.02
0
0.02
Bandpass filtered signal
Vre
(mV
)
Time (s)
Fig. 4.5. Measurement result of cow ECG with implantable ECG measurement device prototype numberfour. At the top the raw signal is shown with the raw signal where the DC-offset has beenremoved, the raw signal with reduced time interval in the middle and signal filtered with 2nd
order Butterworth filter with pass-band at 2–20 Hz at the bottom. ’Vre’ is an abbreviationfrom ’Voltage reduced to electrodes’.
constant throughout the measurement which is crucial with respect to the analysis of theECG signal, e.g. heart rate variability (HRV) analysis. Therefore the measurement systemand setup as such are not reliable or usable enough to perform large scale in vivo tests withanimals. Modifications regarding the design of the inductive coils to enhance their mutualcoupling coefficient and misalignment tolerance should be made if not completely go over tobattery powered devices with radio links. The electrode setup (size, material and position-ing) of the fourth prototype was found to be the very functional and together with the longeroperation–measurement interval, the measurements were easier to perform and the resultswere also more reliable than in the previous in vivo tests.
4.4 Resonance-based passive biopotential (ECG) measurement device:characterisation
In addition to using an inductive link to power up measurement devices from a distance,Section 4.1.2, the link can also be used in accordance with resonance-based measurementdevices, Section 4.1.3. The measurement schemes presented here can be used both in im-plantable applications and in surface measurements.
A measurement device based on the change of the resonance frequency of an LC-tank that is

4.4. Resonance-based passive biopotential (ECG) measurement device: characterisation 55
able to measure biopotentials either from the skin surface or as implanted, has been realisedat TUT, P5. Towe has also published a paper about a similar measurement device [121]. P5provides, however, more insight into the measurement techniques related to the detection ofthe varying resonance frequency and reflected impedance of the LC-tank than discussed in[121].
The realised measurement device is based on the operation principle shown in Fig 4.2. Thereare at least two possibilities to construct the sensor circuitry. The two alternative ways ofconstructing the measurement circuitry mostly differ from each other in the number of var-actors used in the sensors. Fig 4.6 illustrates the two possible schematics of the resonancesensor where BBY40 varactor by Philips Semiconductors. The BBY40 was chosen becauseaccording to the data sheet it was specified to be able to operate around zero volts whichis the case for ECG measurements and a PSpice simulation model was also provided whichenabled theoretical simulations to be run for the measurement setup. The version shown in
VBIO
C1
C2
R1
R2
D
Ck
L
100k
100k
100u
100u
147n
120p
~40p
(a) Version with one BBY40 variable capacitancediode.
VBIO
C1
C3
R1
R3
D2Ck
L
100k
100k
100u
100u
147n
120p
~40p
D1~40p C2R2
100k 100u
(b) Version with two BBY40 variable capacitancediodes.
Fig. 4.6. Schematic figure of the sensing unit with BBY40 variable capacitance diodes.
Fig 4.6(b) has the advantage that the relative total capacitance change of the sensor circuit islarger than for the sensor shown in Fig 4.6(a) in the case where the capacitance of the varactoris changed by the biopotential. The difference will not be great, yet substantial, so that theusage of the circuit shown in Fig 4.6(b) is encouraged.
Reading of the signal (reflected impedance) at the reader device has been realised using twodifferent kind of measurement devices. First of these devices was a slope detector that wassimpler to implement than the second reader device where the sensing principle relied onphase-locked detection.
The detection principle in the slope detector was to measure the impedance magnitude ofthe reader device at some definite frequency. Changes in the capacitance of the varactor willchange the impedance of the sensor and the total impedance of the reader device will changedue to the changes in the reflected impedance. The magnitude of the total impedance willreflect the potential that has been measured at the sensor. The schematics of the realisedslope detector is illustrated in Fig 4.7(a).
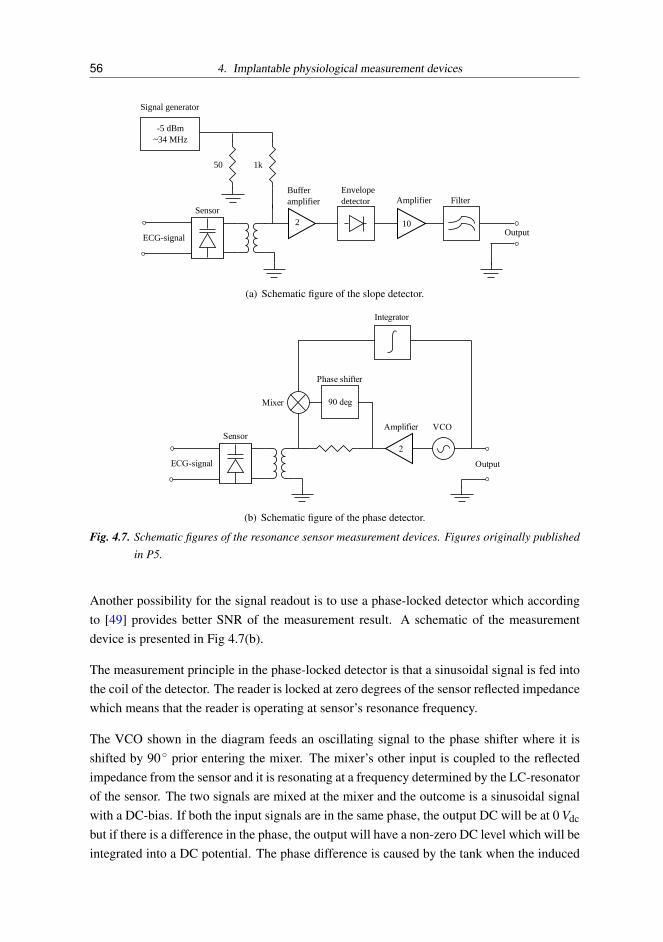
56 4. Implantable physiological measurement devices
Signal generator
-5 dBm~34 MHz
2
Buffer amplifier
Envelopedetector Amplifier Filter
Output
Sensor
ECG-signal
10
50 1k
(a) Schematic figure of the slope detector.
Sensor
ECG-signal
Amplifier
2
Output
VCO
Mixer
Phase shifter
Integrator
90 deg
(b) Schematic figure of the phase detector.
Fig. 4.7. Schematic figures of the resonance sensor measurement devices. Figures originally publishedin P5.
Another possibility for the signal readout is to use a phase-locked detector which accordingto [49] provides better SNR of the measurement result. A schematic of the measurementdevice is presented in Fig 4.7(b).
The measurement principle in the phase-locked detector is that a sinusoidal signal is fed intothe coil of the detector. The reader is locked at zero degrees of the sensor reflected impedancewhich means that the reader is operating at sensor’s resonance frequency.
The VCO shown in the diagram feeds an oscillating signal to the phase shifter where it isshifted by 90 prior entering the mixer. The mixer’s other input is coupled to the reflectedimpedance from the sensor and it is resonating at a frequency determined by the LC-resonatorof the sensor. The two signals are mixed at the mixer and the outcome is a sinusoidal signalwith a DC-bias. If both the input signals are in the same phase, the output DC will be at 0 Vdc
but if there is a difference in the phase, the output will have a non-zero DC level which will beintegrated into a DC potential. The phase difference is caused by the tank when the induced

4.4. Resonance-based passive biopotential (ECG) measurement device: characterisation 57
frequency is different from the resonance frequency of the tank. DC-voltage will be usedto control the VCO which together with the feedback loop will try to retain the input of theintegrator at 0 V which means that the VCO is kept at the resonance frequency of the sensor.The resonance frequency of the secondary circuit, the sensor part, can be deduced from thecontrol voltage of the VCO hence the output of the sensor system is the control voltage of theVCO.
4.4.1 Measurement results
The resonance measurement device was tested by attaching commercial surface electrodes(Blue Sensor by Ambu A/S) on the skin of a test person. Both detector devices presented inSection 4.4 were used in the measurements and the measurement results were in the first stagereferred to results given by a battery-powered biopotential amplifier. The two measurementelectrodes were placed on the upper thorax and the measurement lead was directed so that itwas parallel to the electrical axis of the heart. Placing the electrodes this way maximises theR-spike strength (amplitude). One of the electrodes was placed just beneath the clavicula onthe right side of the thorax and the other was placed on the left side of the thorax in the 7th
rib bone gap. The electrode configuration was very close to being the aVR-lead led from theEinthoven’s triangle [63]. The electrodes were connected to the sensor unit with unshieldedcables. The coil used in the detector device had an average diameter of 25.5 mm and thesensor coil had an average diameter of 13.5 mm.
The measurement results compared against the results given by the reference device clearlyindicated that the device and both the detectors are working properly and are able to mea-sure the ECG signal reliably. The performance of the detectors was then further tested as afunction of coaxial distance between the detector and sensor coils and also as a function ofthe coaxial misalignment between the coils. Fig 4.8 shows the measurement results obtainedwith the slope detector and Fig 4.9 presents the results of the measurements obtained with thephase detector when the coaxial distance between the coils was altered. The slope detectorwas not able to measure the ECG above measurement distances of 50 mm. The phase detec-tor was, however, able to measure the ECG up to 55 mm. The measurements clearly indicatethat the quality of the signal measured with the slope detector is not as good as with the phasedetector when the coaxial distance between the coils varies. Table 4.1 further indicates theproblems the slope detector is suffering: The SNR of the signal measured with the slope de-tector varies dramatically as a function of the coaxial distance being highest at 23 mm and40 mm, which lie on the interval on which the coils electrical matching is optimal. The SNRdoes gradually alter in both ends of the measurement range. The phase detector signal doesnot suffer from remarkable degradation as a function of the coaxial distance, instead the SNRremains almost constant throughout the measurement range.

58 4. Implantable physiological measurement devices
0 1 2 3 4 5−0.05
0.05
Measurement distance 15 mm
Vol
tage
(V
)
0 1 2 3 4 5
−0.05
0.05
Measurement distance 23 mm
0 1 2 3 4 5
−0.02
0.05
Measurement distance 40 mm
Time (s)
Vol
tage
(V
)
0 1 2 3 4 5−0.01
0.01
Measurement distance 50 mm
Time (s)
Fig. 4.8. Measurement result of ECG obtained with the slope detector when the coaxial distance be-tween the detector and the sensor coils is altered. Figure originally published in P5.
0 1 2 3 4 5−0.05
0
0.05
Measurement distance 5 mm
Out
put v
olta
ge (
V)
0 1 2 3 4 5−0.05
0
0.05
Measurement distance 21 mm
0 1 2 3 4 5−0.05
0
0.05
Measurement distance 40 mm
Out
put v
olta
ge (
V)
Time (s)0 1 2 3 4 5
−0.05
0
0.05
Measurement distance 55 mm
Time (s)
Fig. 4.9. Measurement result of ECG obtained with the phase detector when the coaxial distance be-tween the detector and the sensor coils is altered. Figure originally published in P5.
The coaxial misalignment tolerance of the detection devices was also under research. Theresults showed the same tendency than those measured with the different coaxial separations:

4.4. Resonance-based passive biopotential (ECG) measurement device: characterisation 59
Table 4.1. SNR of the measurements done with the slope and phase detectors. The results include bothcoaxial and lateral separation of the coils. Data originally published in P5.
Slope detector Phase detectorCoaxial separation
Distance (mm) SNR (dB) Distance (mm) SNR (dB)15 36 5 5923 65 21 5940 56 40 6250 33 55 56
Lateral misalignmentMisalignment (mm) SNR (dB) Misalignment (mm) SNR (dB)
10 61 10 5835 38 25 57
The slope detector suffers from a gradual degradation of the measurement signal quality,hence also poorer SNR, as the misalignment is increased.

60 4. Implantable physiological measurement devices

5. DISCUSSION AND CONCLUSIONS
Electrode characteristic properties have been studied and reported. Theoretical backgroundhas been provided to the interface properties of the electrode–electrolyte interface. The inter-face properties have also been researched experimentally with measurements. The measure-ment setups and results have been presented in detail in P1, P2, P6 and P7.
The measurement of the electrode–electrolyte interface properties is essential in acquiringknowledge about the electrochemical behaviour of the electrode. The measurement resultsalso serve as a guideline in determining suitable electrodes for the current purpose. Theproperties that influence the suitability of an electrode material are e.g. electrochemical noisearising from the interface and the electrical equivalent component values of the interface.These issues have been researched in P1 and P2 for metallic electrodes that have been im-mersed in different electrolytes. Also, P7 reports measurement results obtained from similarkind of measurement setups. P6 discusses the RMS-noise arising from the interface togetherwith the impedance measurements of textile based electrodes.
Results of the RMS-measurements with metallic electrodes immersed in various electrolytes,P2, showed that the electrolyte conductivity and constituents have their effect on the sensedelectrochemical noise arising from the interface. The Ag/AgCl electrodes that are tradition-ally regarded as stable and low noise electrodes showed surprisingly higher electrochemicalnoise in almost all electrolytes than AISI 316L electrodes with equal area.
The textile electrodes are an interesting type of electrodes thanks to their good integrabilityinto garments. Four textile-based electrodes made of different materials were studied on topof an Agar-block whose conductivity was fixed to meet that of a wet human skin. The con-ductive material of three of the electrodes was Ag and in the fourth the conductive materialwas Cu and Ag. The impedance of the Agar-block was in the order of 500 Ω at 100 Hz whichis in the order of values that Grimnes has reported in [35] for the impedance of human tissues.The impedance of the skin should be much higher if it was not prepared, e.g. scratched, asreported by Rosell et al. in [101]. The RMS-noise measurements were performed as a func-tion of time to obtain a reliable measure of the stabilisation time of the electrode–electrolyteinterface. It seemed that 10 minutes after the application of the electrode on the subject, theinterface is stabilised at its long-term low-noise level. The preliminary conditioning of theelectrode materials was also under research. Three different scenarios were tested: uncon-

62 5. Discussion and Conclusions
ditioned electrodes, hydrogel membrane enhanced electrodes and electrodes moistened withPBS. The measurements showed that the PBS moistened electrodes provided the most stablemeasurements and shortest stabilisation times despite the material.
The impedance measurements were performed in P1 and P6 with the square wave methodpresented in detail in Section 2.8. The method enables the determination of the componentvalues of the electrical equivalent circuit of the interface, e.g. in Fig 2.4(a), without the needfor expensive laboratory equipment such as an EIS device. First the measurements wereperformed on the metallic electrodes immersed in liquid electrolytes. The results showedthat the measurement method is applicable to the measurement of the electrode–electrolyteinterface component values and the results it gives are in line with those obtained by otherscientists. The same measurement method was applied to the textile electrodes and foundto give correct results also there. Comparison between the component values between themetallic and textile electrodes revealed that the textile electrodes were more non-polarisedelectrodes than the metallic ones partly due to their material (Ag or Cu) and partly becausetheir effective area is much higher than for the metallic electrodes. Higher effective arealowers the interface resistance value calculated for one geometric-cm2.
The knowledge about the electrodes can be applied to the measurement devices presentedin P3, P4, P5, P8 and P9. All the publications mentioned discuss the biopotential measure-ment devices that need electrodes to be able to measure the signals. Knowledge is especiallyneeded in the implantable applications where the electrode material has to be biocompati-ble and thus, harmless to the tissue. In addition to this it should not attenuate or filter thebiosignal drastically.
An implantable, inductively powered ECG measurement device has been introduced for thefirst time in P8 and both in vitro and in vivo measurement results are reported in P3, P4 and P9together with technical data about the various versions of the devices. The devices have beenproved to be implantable and causing no inflammations to the cows where the devices havebeen implanted. With such an implantable device it is possible to collect long term data fromthe animals where traditionally the surface electrodes have been a problem. The reliabilityof the inductive link in the devices should be, however, enhanced to be able to record longerperiods of ECG data from the animals.
In publication P5 an alternative way to construct a biopotential measurement device has beenpresented. The device is based on an LC-tank whose resonance frequency can be adjustedby modulating its capacitance with a varactor with electrodes connected over varactor ends.When the electrodes sense a biopotential, the capacitance value of the varactor is changedand, thus, also the resonance frequency of the sensor alters. The change can be detected witha detection device and transformed into equivalent voltage. The device has been constructedand tested with surface electrodes attached to a human skin. The measurement results werepromising but the device still suffers from artefacts caused by the alternating distance between

63
the sensor and the detector. Compensation circuitry should be designed to compensate for themovements. The measurement device is extremely simple and inexpensive to manufactureand, thus, it would be an optimal choice to be used as a disposable sensor. The advantage thesensor has lies in its wireless and simple nature. The subject of measurement can be totallyfree of measurement wires, only the electrodes connected to the sensor and the sensor itselfhave to be attached to the subject. Also, if the measurement device is to be implanted, theextremely simple structure of the sensor enables it to be placed in places where the size ofthe sensor is an issue.
Implantable devices and resonance-based devices will certainly be available for the massesin the future. There are, however, some issues that have to be solved before the technology isready to be commercialised. In the implantable devices, more attention has to be paid on thedesign and functionality of the inductive link. The link has to be more reliable for portableapplications than it nowadays is. The reliability of the link also means longer operationdistance. One option to overcome the challenges in the design of the link is to go over touse battery operated devices. The resonance-based device has to be enhanced in its ability toreject artefact arising from the varying distance between the sensor and the detector device.The distance variation could be compensated e.g. with a fixed LC-tank whose value wouldreveal the changes in the link properties.

64 5. Discussion and Conclusions

BIBLIOGRAPHY
[1] O. Akar, T. Akin, and K. Najafi. A wireless batch sealed absolute capacitive pressuresensor. Sensors and Actuators A, 95:29–38, 2001.
[2] S. Aronson and L. A. Geddes. Electrode potential stability. IEEE Transactions onbiomedical engineering, BME–32(11):987–989, November 1985.
[3] S. Arra, J. Leskinen, J. Heikkilä, and J. Vanhala. Ultrasonic power and data link forwireless implantable applications. 2nd International Symposium on Wireless PervasiveComputing, 2007. ISWPC ’07, pages 567–571, February 2007.
[4] O. Aumala, H. Ihalainen, H. Jokinen, and J. Kortelainen. Mittaussignaalien käsittely.Pressus Oy, 1998. 323 p.
[5] A. K. Barros, A. Mansour, and N. Ohnishi. Removing artifacts from electrocardio-graphic signals using independent component analysis. Neurocomputing, 22:173–186,1998.
[6] L. Beckmann, S. Kim, H. Dückers, R. Lückhardt, N. Zimmermann, T. Gries, andS. Leonhardt. Characterization of textile electrodes for bioimpedance spectroscopy.Smart Textiles–Technology and Design –Ambience08, pages 79–83, 2008.
[7] S. C. Bera, S. Chattopadhyay, and B. Chakraborty. An experimental analysis of thenon-linear behaviour of a bio-electrode polarisation impedance with excitation fre-quency. Measurement, 35:363–370, 2004.
[8] G. D. Bergland. A guided tour of the fast fourier transform. IEEE Spectrum, 6(7):41–52, July 1969.
[9] J. Bronzino. Biomedical Engineering and Instrumentation: Basic concepts and appli-cations. PWS Publishers, 1986. 481 p.
[10] P. K. Campbell and K. E. Jones. Materials for Implantable Electrodes and ElectronicDevices, volume 14 of Materials Science and Technology, A Comperensive Treatment:Medical and Dental Materials, chapter 10, pages 345–372. Weinheim:VCH, 1992.

66 BIBLIOGRAPHY
[11] O. Casas and R. Pallas-Arény. Electrostatic interference in contactless biopotentialmeasurements. IEEE Engineering in Medicine and Biology 29th Annual Conference,pages 2655–2658, 2007.
[12] M. F. Chimeno and R. Pallàs-Areny. A comprehensive model for power line interfer-ence in biopotential measurements. IEEE Transactions on Instrumentation and Mea-surement, 49(3):535–540, June 2000.
[13] I. I. Christov and I. K. Daskalov. Filtering of electromyogram artifacts from the elec-trocardiogram. Medical Engineering & Physics, (21):731–736, 1999.
[14] R. Cobbold. Transducers for Biomedical Measurements. John Wiley & Sons, 1974.486 p.
[15] J. C. Collias and E. E. Manuelidis. Histopathological changes produced by implantedelectrodes in cat brains. Journal of Neurosurgery, 14(3):302–328, 1957.
[16] A. Cömert, M. Honkala, M. Puurtinen, and M. Perhonen. The suitability of silver yarnelectrodes for mobile EKG monitoring. 14th Nordic-Baltic Conference on BiomedicalEngineering and Medical Physics NBC 2008, pages 198–201, June 2008.
[17] H. de Talhouet and J. G. Webster. The origin of skin-stretch-caused motion artifactsunder electrodes. Physiolgical Measurements, 17:81–93, 1996.
[18] T. Degen and H. Jäckel. Continuous monitoring of electrode–skin impedance mis-match during bioelectric recordings. IEEE Transactions on Biomedical Engineering,55(6):1711–1715, 2008.
[19] N. Donaldson and T. A. Perkins. Analysis of resonant coupled coils in the design ofradio frequency transcutaneous links. Journal of Medical and Biological Engineeringand Computing, 21:612–627, 1983.
[20] D. Dudenbostel, K.-L. Krieger, C. Candler, and R. Laur. A new passive CMOS teleme-try chip to receive power and transmit data for a wide range of sensor applications.Proceedings of TRANSDUCERS 97, 2:995–998, 1997.
[21] A. M. Dymond, L. E. Kaechele, J. M. Jurist, and P. H. Crandall. Brain tissue reactionto some chronically implanted metals. Journal of Neurosurgery, 33(5):574–580, 1970.
[22] T. Eggers, C. Marschner, U. Marschner, B. Clasbrummel, R. Laur, and J. Binder.Advanced hybrid integrated low-power telemetric pressure monitoring system forbiomedical applications. Proceedings of IEEE Micro Electro Mechanical Systems(MEMS), pages 329–334, 2000.

BIBLIOGRAPHY 67
[23] C. Enokawa, Y. Yonezawa, H. Maki, and M. Aritomo. A microcontroller-based im-plantable telemetry system for sympathetic nerve activity and ECG measurement.Proceedings of the 19th International Conference of IEEE/EMBS, pages 2232–2234,1997.
[24] D. J. Farwell, N. Freemantle, and N. Sulke. The clinical impact of implantable looprecorders in patients with syncope. European Heart Journal, 27:351–356, 2006.
[25] T. Finnberg, A. Karilainen, and J. Müller. Mobile interrogation unit for passive SAW-sensors in long-term ECG-monitoring. Proceedings of the 3rd European Medical andBiological Engineering Conference, Prague, Czech Rep., Nov 20-25, 11(1), 2005.
[26] P. Fitch. Signal/noise ratio in the recording of human nerve-action potentials. Medicaland Biological Engineering, pages 146–154, March 1973.
[27] W. Franks, I. Schenker, P. Schmutz, and A. Hierlemann. Impedance characteriza-tion and modeling of electrodes for biomedical applications. IEEE Transactions onBiomedical Engineering, 52(7):1295–1302, 2005.
[28] L. Geddes and L. Baker. Principles of applied biomedical instrumentation. Wiley,1975. 616 p.
[29] L. A. Geddes. Electrodes and the Measurements of Bioelectric Events. Wiley, 1972.364 p.
[30] L. A. Geddes. Historical evolution of circuit models for the electrode–electrolyte in-terface. Annals of Biomedical Engineering, 25:1–14, 1997.
[31] L. A. Geddes and L. E. Baker. The relationship between input impedance and electrodearea in recording the ecg. Medical and Biological Engineering, 4:439–450, 1966.
[32] L. A. Geddes and R. Roeder. Criteria for the selection of materials for implantedelectrodes. Annals for Biomedical Engineering, 31:879–890, 2003.
[33] C. Gondran, E. Siebert, S. Yacoub, and E. Novakow. Noise of surface bio-potentialelectrodes based on NASICON ceramic and Ag-AgCl. Medical & Biological Engi-neering & Computing, 34:460–466, 1996.
[34] D. H. Gordon. Triboelectric interference in the ECG. IEEE Transactions on Biomedi-cal Engineering, BME-22(3):252–255, May 1975.
[35] S. Grimnes. Impedance measurement of individual surface electrodes. Medical &Biological Engineering & Computing, 21:750–755, 1983.
[36] F. W. Grover. Inductance Calculations – Working Formulas and Tables. D. van Nos-trand Company, Inc., New York, 1946.

68 BIBLIOGRAPHY
[37] C. J. Harland, T. D. Clark, and R. J. Prance. High resolution ambulatory electrocar-diographic monitoring using wrist-mounted electric potential sensors. MeasurementScience and Technology, 14:923–928, 2003.
[38] T. J. Harpster, S. Hauvespre, M. R. Dokmeci, and K. Najafi. A passive humiditymonitoring system for in situ remote wireless testing of micropackages. Journal ofMicroelectromechanical Systems, 11(1):61–67, February 2002.
[39] T. J. Harpster, B. Stark, and K. Najafi. A passive wireless integrated humidity sensor.Sensors and Actuators A, 95:100–107, 2002.
[40] T. Hilbel, T. M. Helms, G. Mikus, H. A. Katus, and C. Zugck. Telemetry in the clinicalsetting. Herzschrittmacherther Electrophysiol., 19(3):146–154, 2008.
[41] J. W. Horton and A. C. van Ravenswaay. Electrical impedance of the human body. J.Franklin Inst., (220):557–572, 1935.
[42] J. C. Huhta and J. G. Webster. 60-Hz interference in electrocardiography. IEEE Trans-actions, BME-20:91–101, 1973.
[43] E. Huigen, A. Peper, and C. A. Grimbergen. Investigation into the origin of the noiseof surface electrodes. Journal of Medical and Biological Engineering and Computing,40:332–338, 2002.
[44] J. Hännikäinen, T. Vuorela, and J. Vanhala. Physiological measurements in smartclothing: A case study of total body water estimation with bioimpedance. Transactionsof the Institute of Measurement and Control, 2007.
[45] IEEE/ANSI c95.1 – 2005. IEEE standard for safety levels with respect to humanexposure to radio frequency electromagnetic fields, 3 kHz to 300 GHz. Standard,2005.
[46] P. Irazoqui-Pastor, I. Mody, and J. W. Judy. In-vivo EEG recording using a wireless im-plantable neural transceiver. IEEE Engineering in Medicine and Biology 25th AnnualConference, 2003.
[47] R. S. Jutley, D. E. Shepherd, D. W. Hukins, and R. R. Jeffrey. Preliminary evaluation ofthe sternum screw: a novel method for improved sternal closure to prevent dehiscence.Cardiovascular Surgery 2003 Feb;11(1):85-9, 11(1):85–89, February 2003.
[48] A. Karilainen, T. Finnberg, T. Uelzen, K. Dembowski, and J. Müller. Mobile patientmonitoring based on impedance-loaded SAW-sensors. IEEE Transactions on Ultra-sonics, Ferroelectrics and Frequency Control, 51(11):1464–1469, November 2004.

BIBLIOGRAPHY 69
[49] A. Karilainen, T. Finnberg, and J. Müller. Wireless passive sensor for measuring ECGand other biopotentials in impedance loaded SAW technology. Proceedings of the 3rdEuropean Medical and Biological Engineering Conference, Prague, Czech Rep., Nov20-25, 11(1), 2005.
[50] M. Kawashita, S. Tsuneyama, F. Miyaji, T. Kokubo, H. Kozuka, and K. Yamamoto.Antibacterial silver-containing silica glass prepared by sol-gel method. Biomaterials,21:393–398, 2000.
[51] J. Kim and R.-S. Yahya. Electromagnetic interactions between biological tissues andimplantable biotelemetry systems. Microwave Symposium Digest, 2005 IEEE MTT-SInternational, pages 1801–1804, 2005.
[52] W. Ko. Biomedical Transducers, chapter 1, pages 3–72. Academic Press Inc., 1988.In book Kline, Jacob (editor): Handbook of Biomedical Engineering, 733 p.
[53] W. H. Ko, P. Liang, Sheau, and C. D. F. Fung. Design of radio-frequency poweredcoils for implant measurements. Journal of Medical and Biological Engineering andComputing, 15(6):634–640, November 1977.
[54] G. T. A. Kovacs. Enabling Technologies for Cultured Neural Networks, chapter In-troduction to the theory, design and modeling of thin-film microelectrodes for neuralinterfaces, pages 121–165. Academic, London, U.K., 1994.
[55] A. D. Krahn, G. J. Klein, C. Norris, and R. Yee. The etiology of syncope in patientswith negative tilt table and electrophysiological testing. Circulation, 92(7):1819–1824,October 1995.
[56] K. Kramer, H.-P. Voss, J. A. Grimbergen, P. A. Mills, D. Huetteman, L. Zwiers, andB. Brockway. Telemetric monitoring of blood pressure in freely moving mice: a pre-liminary study. Laboratory Animals, 34:272–280, 2000.
[57] A. Kurs, A. Karalis, R. Moffatt, J. Joannopoulos, P. Fisher, and M. Soljacic. Wirelesspower transfer via strongly coupled magnetic resonances. Science, 317(83):83–86.
[58] J. Lario-García and R. Pallas-Arèny. Measurement of three independent componentsin impedance sensors using a single square wave. Sensors and Actuators A, (110):164–170, 2004.
[59] J. Lario-García and R. Pallas-Arèny. Constant-phase element identification in conduc-tivity sensors using a single square wave. Sensors and Actuators A, (132):122–128,2006.

70 BIBLIOGRAPHY
[60] J. Lario-García and R. Pallàs-Areny. Analysis of a three–component impedance us-ing two sine waves. IEEE Instrumentation and Measurement Technology Conference,pages 1282–1284, 2003.
[61] R. Laukkanen and P. Virtanen. Heart rate monitors - state of the art. Journal of SportsSciences, 16:S3–S7, 1998.
[62] G. Loriga, N. Taccini, D. De Rossi, and R. Paradiso. Textile sensing interfaces forcardiopulmonary signs monitoring. IEEE Engineering in Medicine and Biology 27thAnnual Conference, September 2005.
[63] J. Malmivuo and R. Plonsey. Bioelectromagnetism - Principles and Applications ofBioelectric and Biomagnetic Fields. Oxford University Press, New York, 1995. 456 p.
[64] S. Malpas. A novel implantable blood pressure telemetry device; comparison betweendata sciences and telemetry research systems. Journal of Pharmacological and Toxi-cological Methods, 60(2):235, 2009.
[65] E. McAdams and J. Jossinet. Electrode–electrolyte interface impedance: The limitcurrent of linearity. Annual International Conference of the IEEE Engineering inMedicine and Biology Society, 13(4):1728–1729, 1991.
[66] E. T. McAdams and J. Jossinet. Tissue impedance: a historical overview. PhysiologicalMeasurements, 16:A1–A13, 1995.
[67] E. T. McAdams, J. Jossinet, A. Lackermeier, and F. Risacher. Factors affectingelectrode-gel-skin interface impedance in electrical impedance tomography. Medical& Biological Engineering & Computing, 34:397–408, 1996.
[68] E. T. McAdams, J. Jossinet, R. Subramanian, and R. G. E. McCauley. Characterizationof gold electrodes in phosphate buffered saline solution by impedance and noise mea-surements for biological applications. Proceedings of the 28th IEEE EMBS AnnualInternational Conference, pages 4594–4597, 2006.
[69] G. Medrano, L. Beckmann, N. Zimmermann, T. Grundmann, T. Gries, and S. Leon-hardt. Bioimpedance spectroscopy with textile electrodes for a continuous monitoringapplication. 4th International Workshop on Wearable and Implantable Body SensorNetworks (BSN 2007), 13:23–28, 2007.
[70] G. Medrano, A. Ubl, N. Zimmermann, T. Gries, and S. Leonhardt. Skin electrodeimpedance of textile electrodes for bioimpedance spectroscopy. Proceedings of 13thInternational Conference on Electrical Bioimpedance and the 8th Conference on Elec-trical Impedance Tomography, 17:260–263, 2007.

BIBLIOGRAPHY 71
[71] G. Medrano, L. Beckmann, M. Gube, R. Kasim, S. Kim, T. Kraus, and S. Leon-hardt. Continuous hand-to-foot and segmental bioimpedance spectroscopy measure-ments within a period of five days. Proceedings of World Congress on Medical Physicsand Biomedical Engineering, pages 122–125, 2009.
[72] Medtronic Inc. Reveal R© DX insertable cardiac monitor (ICM). Website. URLhttp://www.medtronic.com/physician/reveal/index.html. Ac-cessed 20.10.2009.
[73] A. C. Metting van Rijn, A. Peper, and C. A. Grimbergen. High-quality recording ofbioelectric events - part 1. Medical & Biological Engineering & Computing, 28(5):389–397, 1990.
[74] A. C. Metting van Rijn, A. P. Kuiper, T. E. Dankers, and C. A. Grimbergen. Low-cost active electrode improves the resolution in biopotential recordings. 18th AnnualInternational Conference of the IEEE Engineering in Medicine and Biology Society,pages 101–102, 1996.
[75] Y. Ming. A Multi-Channel Wireless Implantable Neural Recording System. PhD thesis,North Carolina State University, 2009.
[76] C. D. Motchenbacher and F. C. Fitchen. Low-Noise Electronic Design. John Wiley &Sons, 1973. 358 p.
[77] F. Moussy and D. J. Harrison. Prevention of the rapid degradation of subcutaneouslyimplanted Ag/AgCl reference electrodes using polymer coatings. Analytical Chem-istry, 66:674–679, 1994.
[78] J. Mühlsteff and O. Such. Dry electrodes for monitoring of vital signs in functionaltextiles. IEEE Engineering in Medicine and Biology 26th Annual Conference, pages2212–2215, 2004.
[79] J. Mühlsteff, O. Such, R. Schmidt, M. Perkuhn, H. Reiter, J. Lauter, J. Thijs, G. Müsch,and M. Harris. Wearable approach for continuous ECG – and activity patient-monitoring. IEEE Engineering in Medicine and Biology 26th Annual Conference,pages 2184–2187, September 1-5 2004.
[80] J. H. Nagel. The Biomedical Engineering Handbook, chapter Biopotential Amplifiers.CRC Press LLC, 2nd edition, 2000.
[81] N. Najafi and A. Ludomirsky. Initial animal studies of a wireless, batteryless, MEMSimplant for cardiovascular applications. Biomedical Microdevices, 6(1):61–65, 2004.
[82] S. N. Nihtianov, G. P. Sheterev, B. Iliev, and G. C. M. Meijer. A novel technique tomeasure two independent components of impedance sensors with a simple relaxation

72 BIBLIOGRAPHY
oscillator. Instrumentation and Measurement Technology Conference, 2000. IMTC2000, pages 674–678, 2000.
[83] S. Nishimura, Y. Tomita, and T. Horiuchi. Clinical application of an active electrodeusing an operational amplifier. IEEE Transactions on Biomedical Engineering, 39(10):1096–1099, 1992.
[84] N. Noury, A. Dittmar, C. Corroy, R. Baghai, J. L. Weber, D. Blanc, F. Klefstat, A. Bli-novska, S. Vaysse, and CometB. A smart cloth for ambulatory telemonitoring of physi-ological parameters and activity: The VTAMN project. IEEE Engineering in Medicineand Biology 26th Annual Conference, pages 155–160, 2004.
[85] S. Oh, J. Lee, K. Jeong, and L. Lee. Minimization of electrode polarization effectby nanogap electrodes for biosensor applications. IEEE The Sixteenth Annual Inter-national Conference on Micro Electro Mechanical Systems, 2003. MEMS-03 Kyoto.,pages 52–55, 2003.
[86] N. B. Olivier, E. Nolan, B. Olivier, and D. Singer. A comparative study of surfacetelemetry and implantable telemetry. Journal of Pharmacological and ToxicologicalMethods, 56(2):e57, 2007.
[87] J. Ottenbacher, S. Römer, C. Kunze, U. Großmann, and W. Stork. Integration of a blue-tooth based ECG system into clothing. Eighth International Symposium on WearableComputers (ISWC’04), 2004.
[88] R. Paradiso. Knitted textile for the monitoring of vital signals. United Stated PatentApplication Publication number WO2005053532, April 2007.
[89] R. Paradiso and D. De Rossi. Advances in textile technologies for unobtrusive monitor-ing of vital parameters and movements. Proceedings of the 28th IEEE EMBS AnnualInternational Conference, pages 392–395, 2006.
[90] R. Paradiso, G. Loriga, and N. Taccini. A wearable health care system based on knittedintegrated sensors. IEEE Transactions on Information Technology in Biomedicine, 9(3):337–344, September 2005.
[91] R. Paradiso, G. Loriga, N. Taccini, A. Gemignani, and B. Ghelarducci. WEALTHY – awearable healthcare system: new frontier on e-textile. Journal of Telecommunicationsand Information Technology, (4):105–113, 2005.
[92] R. Parsons. The Encyclopedia of Electrochemistry. Reinhold, New York, 1964. 1206p.
BIBLIOGRAPHY 73
[93] T. Pawar, N. S. Anantakrishnan, and S. Chaudhuri. Transition detection in body move-ment activities for wearable ECG. IEEE Transactions on Biomedical Engineering, 54(6):1149–1152, June 2007.
[94] J. A. Potkay. Long term, implantable blood pressure monitoring systems. BiomedicalMicrodevices, 10:379–392, 2008.
[95] M. Puurtinen, S. Komulainen, P. Kauppinen, and J. Malmivuo. Measurement of noiseand impedance of dry and wet textile electrodes, and textile electrodes with hydrogel.Proceedings of the 28th IEEE EMBS Annual International Conference, pages 6012–6015, August 2006.
[96] M. Qu, Y. Zhang, J. G. Webster, and W. J. Tompkins. Motion artifact from spot andband electrodes during impedance cardiography. IEEE Transactions on biomedicalengineering, BME–33(11):1029–1036, November 1986.
[97] J. E. Randles. Kinetics of rapid electrode reactions. Discussions of Faraday Society 1,11:11–19, 1947.
[98] R. W. Revie, editor. Uhlig’s Corrosion Handbook. John Wiley & Sons, Inc., 2ndedition, 2000. 1340 p.
[99] F. R. Robinson and M. T. Johnson. Histopathological studies of tissue reactions tovarious metals implanted in cat brains. Aeronautical Systems Div Wright-PattersonAFB Ohio Aerospace Medical Div, October 1961.
[100] G. Rondelli, P. Torricelli, M. Fini, and R. Giardino. In vitro corrosion study by EIS ofa nickel-free stainless steel for orthopaedic applications. Biomaterials, (26):739–744,2004.
[101] J. Rosell, J. Colominas, P. Riu, R. Pallàs-Areny, and J. G. Webster. Skin impedancefrom 1 Hz to 1 MHz. IEEE Transactions on Biomedical Engineering, 35(8):649–651,August 1988.
[102] E. M. Schmidt, J. S. McIntosh, and M. J. Bak. Long-term implants of parylene-ccoated microelectrodes. Medical and Biological Engineering and Computing, 26:96–101, 1988.
[103] H. P. Schwan. Linear and nonlinear electrode polarization and biological materials.Annals of Biomedical Engineering, 20:269–288, 1992.
[104] H. P. Schwan. Electrode polarization impedance and measurements in biological ma-terials. Annals of the New York Academy of Sciences, 148:191–209, 1968.
[105] A. S. Sedra and K. C. Smith. Microelectronic Circuits. Oxford University Press, 4thedition, 1998. 1237 p.

74 BIBLIOGRAPHY
[106] V.-P. Seppä, J. Väisänen, P. Kauppinen, J. Malmivuo, and J. Hyttinen. Measuring res-pirational parameters with wearable bioimpedance device. Proceedings of 13th Inter-national Conference on Electrical Bioimpedance and the 8th Conference on ElectricalImpedance Tomography, 17:663–666, 2007.
[107] V.-P. Seppä, O. Lahtinen, J. Väisänen, and J. Hyttinen. Assessment of breathing param-eters during running with a wearable bioimpedance device. 4th European Conferenceof the International Federation for Medical and Biological Engineering ECIFMBE2008, 22:1088–1091, November 2008.
[108] V.-P. Seppä, J. Viik, A. Naveed, J. Väisänen, and J. Hyttinen. Signal waveform agree-ment between spirometer and impedance pneumography of six chest band electrodeconfigurations. Proceedings of World Congress on Medical Physics and BiomedicalEngineering, pages 689–692, 2009.
[109] M. Spinelli, N. H. Martínez, and M. A. Mayosky. A transconductance driven-right-legcircuit. IEEE Transactions on Biomedical Engineering, 46(12):1466–1470, December1999.
[110] S. S. Stensaas and L. J. Stensaad. Histopathological evaluation of materials implantedin the cerebral cortex. Acta Neuropathologica, 41:145–155, 1978.
[111] Y.-T. Sul, C. B. Johansson, Y. Jeong, and T. Albrektsson. The electrochemical oxidegrowth behaviour on titanium in acid and alkaline electrolytes. Medical Engineering& Physics, 23(5):329–346, 2001.
[112] S. M. Sunderarajan. Design, modeling and optimization of on-chip inductor and trans-former circuits. PhD thesis, Stanford University, 1999.
[113] H. Suzuki, T. Hirakawa, S. Sasaki, and I. Karube. An integrated three-electrode sys-tem with a micromachined liquid-junction Ag/AgCl reference electrode. AnalyticaChimica Acta, 387:103–112, 1999.
[114] L. Sörnmo and P. Laguna. Bioelectrical Signal Processing in Cardiac and Neurologi-cal Applications. Elsevier Inc., London, UK, 2005. 688 p.
[115] K. Takahata, A. DeHennis, K. D. Wise, and Y. B. Gianchandani. Stentenna: A micro-machined antenna stent for wireless monitoring of implantable microsensors. IEEEEngineering in Medicine and Biology 25th Annual Conference, pages 3360–3363,2003.
[116] P. Talonen. A More Natural Approach to Nerve Stimulation in Electrophrenic Respi-ration. PhD thesis, Tampere University of Technology, 1990.
BIBLIOGRAPHY 75
[117] Z. Tang, B. Smith, J. H. Schild, and P. H. Peckham. Data transmission from animplantable biotelemeter by load-shift keying using circuit configuration modulator.IEEE Transactions on Biomedical Engineering, 42(5):524–528, 1995.
[118] Texas Instruments. INA333 micro-power (50µA), zerø-drift, rail-to-rail out instrumen-tation amplifier. Data Sheet, 2008.
[119] N. V. Thakor and J. G. Webster. Ground-free ECG recording with two electrodes. IEEETransactions on Biomedical Engineering, BME-27(12):699–704, December 1980.
[120] N. V. Thakor and J. G. Webster. The origin of skin potential and its variations. Pro-ceedings of the 31st Annual Conference on Engineering in Biology and Medicine, 20,1978. 212 p.
[121] B. C. Towe. Passive backscatter biotelemetry for neural interfacing. IEEE EMBSConference on Neural Engineering, pages 144–147, May 2007.
[122] P. Valdastri, S. Rossi, A. Menciassi, V. Lionetti, F. Bernini, F. A. Recchia, and P. Dario.An implantable ZigBee ready telemetric platform for in vivo monitoring of physiolog-ical parameters. Sensors and Actuators A, (142):369–378, 2008.
[123] M. E. Valentinuzzi, J.-P. Morucci, and C. J. Felice. Critical Reviews in BiomedicalEngineering, volume 24, chapter Bioelectrical Impedance Techniques in Medicine;Part II: Monitoring of Physiological Events by Impedance, pages 353–466. BegellHouse Inc., 1996.
[124] K. van Kuyck, M. Welkenhuysen, L. Arckens, R. Sciot, and B. Nuttin. Histologicalalterations induced by electrode implantation and electrical stimulation in the humanbrain: A review. Neuromodulation: Technology at the Neural Interface, 10(3):244–261, 2007.
[125] K. Van Schuylenbergh and R. Puers. Self-tuning inductive powering for implantabletelemetric monitoring systems. Sensors and Actuators A, 52:1–7, 1996.
[126] K. J. Vetter. Elektrochemische Kinetik. Springer-Verlag, 1961. 698 p.
[127] T. Vuorela, V.-P. Seppä, J. Vanhala, and J. Hyttinen. Two portable long-term measure-ment devices for ECG and bioimpedance. Proceedings of the second InternationalConference on Pervasive Computing Technologies for Healthcare 2008, pages 169–172, January 2008.
[128] T. Vuorela, V.-P. Seppä, J. Vanhala, and J. Hyttinen. Design and implementation of aportable long-term physiological signal recorder. Transactions on Information Tech-nology in BioMedicine, 2009. Submitted June 30th 2009.

76 BIBLIOGRAPHY
[129] J. Väisänen, J. Hyttinen, M. Puurtinen, P. Kauppinen, and J. Malmivuo. Prediction ofimplantable ECG lead systems by using thorax models. IEEE Engineering in Medicineand Biology 26th Annual Conference, pages 809–812, September 1-5 2004.
[130] D. E. Watson and D. M. Yee. Behaviour of Ag/AgCl electrodes in solutions containingboth Cl− and I−. Electrochimica Acta, 14:1143–1153, 1969.
[131] B. B. Winter and J. G. Webster. Driven-right-leg circuit design. IEEE Transactions onBiomedical Engineering, BME-30:62–66, 1983.
[132] D. E. Wood, D. J. Ewins, and W. Balachandran. Comparative analysis of power-line interference between two-or three-electrode biopotential amplifiers. Medical &Biological Engineering & Computing, 33:63–68, 1995.
[133] C. Yue, Patric and S. Wong, Simon. Physical modeling of spiral inductors on silicon.IEEE Transactions on Electron Devices, 47(3):560–568, March 2000.
[134] F. Zhang, Z. Zheng, Y. Chen, X. Liu, A. Chen, and Z. Jiang. In vivo investigation ofblood compatibility of titanium oxide films. Journal of Biomedical Material Research,42:128–133, 1998.
[135] C. M. Zierhofer and E. S. Hochmair. Geometric approach for coupling enhancementof magnetically coupled coils. IEEE Transactions on biomedical engineering, 43(7):708–714, July 1996.
[136] C. M. Zierhofer and E. S. Hochmair. Coil design for improved power transfer effi-ciency in inductive links. Proceedings of 18th Annual International Conference of theIEEE Engineering in Medicine and Biology Society, pages 1538–1539, 1996.
[137] S. Ödman. Changes in skin potentials induced by skin compression. Medical & Bio-logical Engineering & Computing, 27:390–393, 1989.

PUBLICATION P1
Riistama, J. and Lekkala, J. “Electrode-electrolyte Interface Properties in Implantation Con-ditions,” in Proceedings of the 28th Annual International Conference of the IEEE Engineer-ing in Medicine and Biology Society – EMBC. Engineering Revolution in Biomedicine, NewYork City, New York, USA. p. 6021–6024. 30 August–3 September, 2006.
c©2006 IEEE. Reprinted, with permission from Proceedings of the 28th Annual Interna-tional Conference of the IEEE Engineering in Medicine and Biology Society (EMBC 2006),Electrode-electrolyte Interface Properties in Implantation Conditions, Riistama J. and Lekkala J.


PUBLICATION P2
Riistama, J. and Lekkala, J. “Electrochemical noise properties of different electrode materialsin different electrolytes”, in Leonhardt, S., Falck, T. & Mähönen, P. (Eds.). IFMBE Proceed-ings. Volume 13. 4th International Workshop on Wearable and Implantable Body SensorNetworks (BSN 2007), RWTH Aachen University, Germany, pp. 149–154, March 26–28,2007.
c©2007 Springer. Reprinted, with permission from IFMBE Proceedings. Volume 13. 4thInternational Workshop on Wearable and Implantable Body Sensor Networks (BSN 2007),Electrochemical noise properties of different electrode materials in different electrolytes,Riistama J. and Lekkala J.


PUBLICATION P3
Riistama, J., Väisänen, J., Heinisuo, S., Lekkala, J. and Kaihilahti, J. “Evaluation of an im-plantable ECG monitoring device in vitro and in vivo”, in Proceedings of the 29th AnnualInternational Conference of the IEEE EMBS Engineering in Medicine and Biology Societyin conjunction with the Biennial Conference of the French Society of Biological and MedicalEngineering (SFGBM), Lyon, France. pp. 5703–5706, August 23–26, 2007.
c©2007 IEEE. Reprinted, with permission from Proceedings of the 29th Annual InternationalConference of the IEEE EMBS Engineering in Medicine and Biology Society (EMBC 2007),Evaluation of an implantable ECG monitoring device in vitro and in vivo, Riistama J., Väisänen,J., Heinisuo, S., Lekkala, J. and Kaihilahti, J.


PUBLICATION P4
Riistama, J., Väisänen, J., Heinisuo, S., Harjunpää, H., Arra, S., Kokko, K., Mäntylä, M.,Kaihilahti, J., Heino, P., Kellomäki, M., Vainio, O., Vanhala, J., Lekkala, J. and Hyttinen,J. “Wireless and inductively powered implant for measuring electrocardiogram”, Medical &Biological Engineering & Computing 45:1163–1174, 2007.
c©2007, Springer. Reprinted, with permission Medical & Biological Engineering & Computing,Vol. 45:1163–1174, Wireless and inductively powered implant for measuring electrocardiogram,Riistama, J., Väisänen, J., Heinisuo, S., Harjunpää, H., Arra, S., Kokko, K., Mäntylä, M.,Kaihilahti, J., Heino, P., Kellomäki, M., Vainio, O., Vanhala, J., Lekkala, J. and Hyttinen, J.


PUBLICATION P5
Riistama, J., Aittokallio, E., Verho, J. and Lekkala, J. “Totally passive wireless biopotentialmeasurement sensor by utilizing inductively coupled resonance circuits”, Sensors and Actu-ators A – Physical 157(2):313–321, 2010.
c©2010, Elsevier. Reprinted, with permission Sensors and Actuators A – Physical, Vol.157(2):313–321, Totally passive wireless biopotential measurement sensor by utilizing inductivelycoupled resonance circuits, Riistama, J., Aittokallio, E., Verho, J. and Lekkala, J.


PUBLICATION P6
Riistama, J., Röthlingshöfer, L., Leonhardt, S. and Lekkala, J. “Noise and interface impedanceof textile electrodes on simulated skin interface”, Medical & Biological Engineering & Com-puting, 2010, submitted.
