chapters 1-2. economics the effort to satisfy unlimited wants with limited means choice needs wants
TRANSCRIPT
The Principals of Economics
Chapters 1-2

EconomicsThe effort to satisfy unlimited wants with
limited meansChoice
NeedsWants

ValueEverything has value
GoodsServices
Scarcity defines valueAll goods and services
have scarcity High Scarcity = High
Value Low Scarcity = Low
ValueScarcity v. Shortage
Example-The US Dollar
Inflation
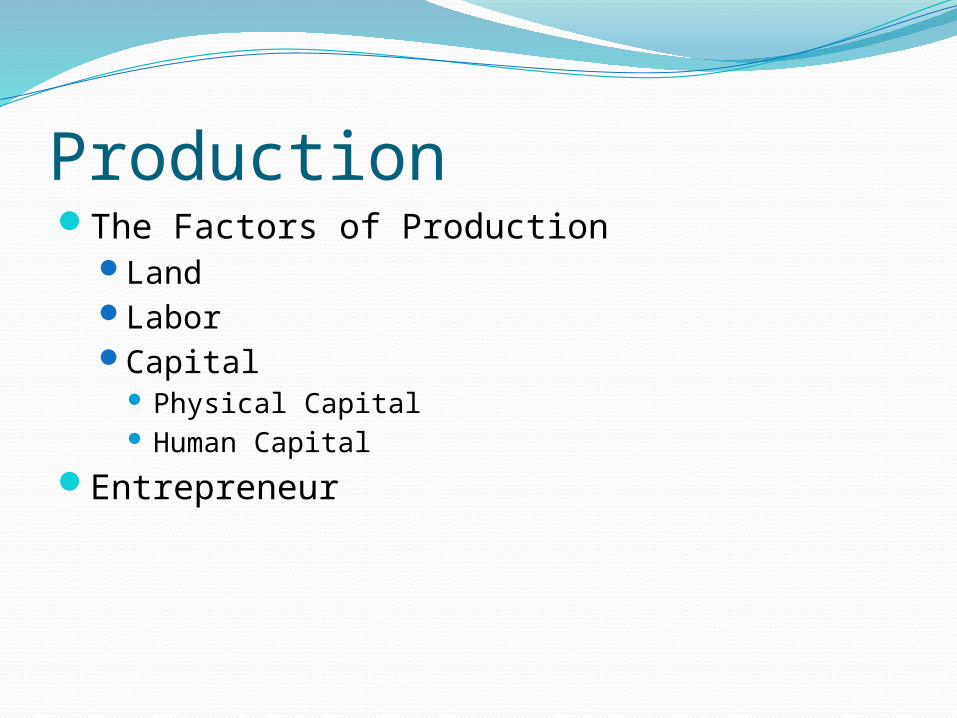
ProductionThe Factors of Production
LandLaborCapital
Physical Capital Human Capital
Entrepreneur

CostDecisions have ramifications:
CostOpportunity Cost
Trade-OffsExample: Guns or Butter
Cost-Benefit AnalysisDecision
Benefits Cost Opportunity Cost Benefits Forgone
Thinking at the Margins

Maximizing ProductivityProduction Possibilities Curve
Frontier
Watermelons (millions of
tons)
Shoes(millions of
pairs)
Sh
oes
(mil
lion
s of
pair
s)
25
20
15
10
5
0 252015105
Production Possibilities Graph
Watermelons (millions of tons)
0
a (0,15)
15
8 14b (8,14)
14
18
20
21
12
9
5
0
A productionpossibilities frontier
c (14,12)
d (18,9)
e (20,5)
f (21,0)

CostThe Law of Increasing Costs
Watermelons (millions of
tons)
Shoes(millions of
pairs)
Sh
oes
(mil
lion
s of
pair
s)
25
20
15
10
5
0 252015105
Production Possibilities Graph
Watermelons (millions of tons)
14
18
20
21
12
9
5
0
0 15
8 14
c (14,12)
d (18,9)

Efficiency and Underutilization
Sh
oes
(mil
lion
s of
pair
s)25
20
15
10
5
0 252015105
Watermelons (millions of tons)
Production Possibilities Graph
g (5,8)
A point of underutilization
c (14,12)
d (18,9)
e (20,5)
f (21,0)
a (0,15)b (8,14)
S

The Future FrontierIncreases in Land,
Labor or Capital
Sh
oes
(mil
lion
s of
pair
s)
25
20
15
10
5
0 252015105
Watermelons (millions of tons)
Production Possibilities Graph
T
Future productionPossibilities frontier
c (14,12)
d (18,9)
e (20,5)
f (21,0)
a (0,15)b (8,14)
S
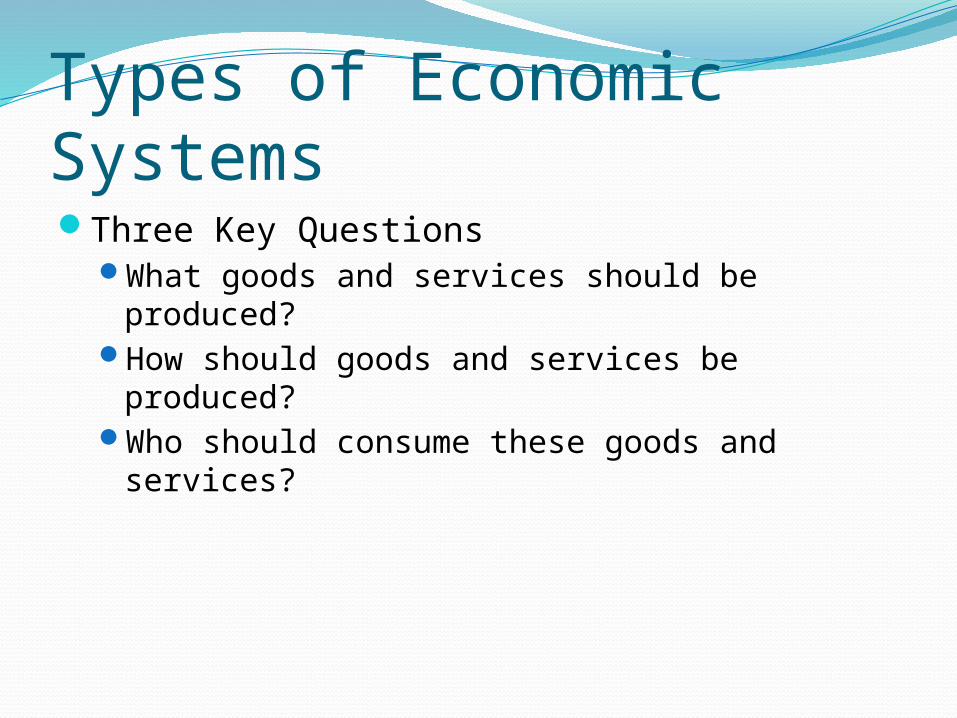
Types of Economic SystemsThree Key Questions
What goods and services should be produced?How should goods and services be produced?Who should consume these goods and
services?

Economic GoalsEconomic efficiencyEconomic freedomEconomic security and predictabilityEconomic equityEconomic growth and innovationOther goals
Ex- Environmental Protection, National Security

The Four Economic SystemsTraditionalMarketCommandMixed

The Market
ALL ACTIONS ARE SELFISH ACTIONS

The Self-Regulating MarketSelf-InterestCompetition
IncentivesThe Invisible Hand

Market EconomicsActors
HouseholdsFirms
MarketsFactor MarketsProduct Markets

The Circular Flow of the Market
monetary flow
physical flow
monetary flow
physical flow
Circular Flow Diagram of a Market Economy
Households
Firms
Product market
Factor market
Households pay firms for goods and services.
Firms supply households with goods and services.
Households supply firms with land, labor, and capital.
Firms pay households for land, labor, and capital.

Advantages of the Free MarketEfficiencyFreedomGrowthConsumer SovereigntyWidest possible array of goods and services

Command EconomicsThe “Central Planners” make the decisions
SocialismCommunism
Mandated EqualityLack of Incentives

Ex- The Two St. JeansCapitalist CommunistABCDF
B

The USSRMarxist-LeninistCollective Farming
Peasant ControlGovernment Goals
Failure 5-year plans
Heavy IndustrySoviet Consumers
ShortagesThe “Black Market”

The Mixed MarketLimits of Laissez Faire
Market FailuresPrivate Property vs. Public PropertyCatch-up Time
Control vs. Freedom

Circular Flow of the Mixed Market
monetary flow
physical flow
monetary flow
physical flow
Circular Flow Diagram of a Mixed Economy
Households Firms
Product market
Factor market
Government expendituresexpenditures
gover
nmen
t
-owned
fact
ors
taxes
taxesgove
rnm
ent
purchas
es

The Continuum of Mixed MarketsTransitions
Privatization Ex: Margret Thatcher and GB
Nationalization Ex: Fidel Castro and Cuba
Continuum of Mixed Economies
Centrally planned Free market
Source: 1999 Index of Economic Freedom, Bryan T. Johnson, Kim R. Holmes, and Melanie Kirkpatrick
Iran
North Korea
Cuba
China
Russia Greece Peru United States
South Africa France United Kingdom
Botswana Canada Singapore
Hong Kong