chapter6 visualperception - illinoisvr.cs.uiuc.edu/vrch6.pdf · visual perception this chapter...
TRANSCRIPT

Chapter 6
Visual Perception
Steven M. LaValle
University of Oulu
Copyright Steven M. LaValle 2019
Available for downloading at http://vr.cs.uiuc.edu/

Chapter 6
Visual Perception
This chapter continues where Chapter 5 left off by transitioning from the phys-
iology of human vision to perception. If we were computers, then this transitionmight seem like going from low-level hardware to higher-level software and algo-rithms. How do our brains interpret the world around us so effectively in spite ofour limited biological hardware? To understand how we may be fooled by visualstimuli presented by a display, you must first understand how our we perceive orinterpret the real world under normal circumstances. It is not always clear whatwe will perceive. We have already seen several optical illusions. VR itself can beconsidered as a grand optical illusion. Under what conditions will it succeed orfail?
Section 6.1 covers perception of the distance of objects from our eyes, whichis also related to the perception of object scale. Section 6.2 explains how weperceive motion. An important part of this is the illusion of motion that weperceive from videos, which are merely a sequence of pictures. Section 6.3 coversthe perception of color, which may help explain why displays use only three colors(red, green, and blue) to simulate the entire spectral power distribution of light(recall from Section 4.1). Finally, Section 6.4 presents a statistically based modelof how information is combined from multiple sources to produce a perceptualexperience.
6.1 Perception of Depth
This section explains how humans judge the distance from their eyes to objects inthe real world using vision. The perceived distance could be metric, which meansthat an estimate of the absolute distance is obtained. For example, a house mayappear to be about 100 meters away. Alternatively, the distance information couldbe ordinal, which means that the relative arrangement of visible objects can beinferred. For example, one house appears to be closer than another if it is partiallyblocking the view of the further one.
153
154 S. M. LaValle: Virtual Reality
Figure 6.1: This painting uses a monocular depth cue called a texture gradient toenhance depth perception: The bricks become smaller and thinner as the depthincreases. Other cues arise from perspective projection, including height in the vi-sual field and retinal image size. (“Paris Street, Rainy Day,” Gustave Caillebotte,1877. Art Institute of Chicago.)
(a) (b)
Figure 6.2: Even simple line drawings provide significant cues. (a) The Ponzoillusion: The upper yellow bar appears to be longer, but both are the same length.(b) The Muller-Lyer illusion: The lower horizontal segment appears to be shorterthan the one above, but they are the same length.
6.1. PERCEPTION OF DEPTH 155
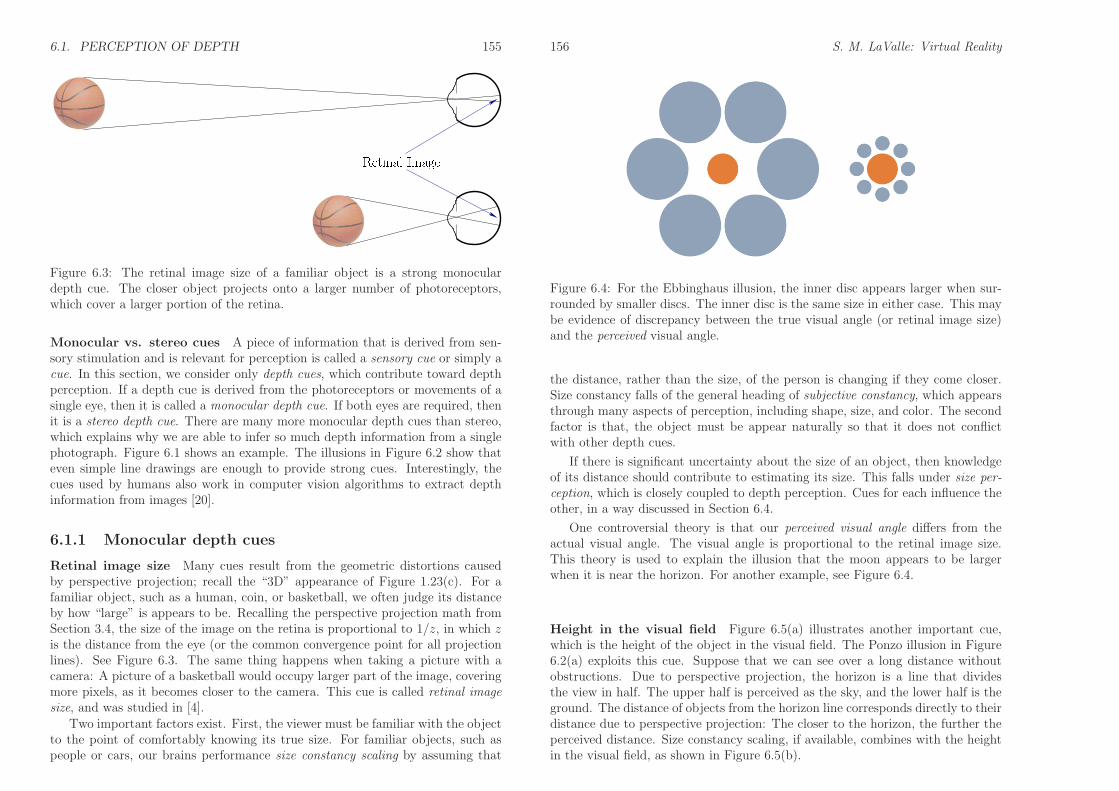
Figure 6.3: The retinal image size of a familiar object is a strong monoculardepth cue. The closer object projects onto a larger number of photoreceptors,which cover a larger portion of the retina.
Monocular vs. stereo cues A piece of information that is derived from sen-sory stimulation and is relevant for perception is called a sensory cue or simply acue. In this section, we consider only depth cues, which contribute toward depthperception. If a depth cue is derived from the photoreceptors or movements of asingle eye, then it is called a monocular depth cue. If both eyes are required, thenit is a stereo depth cue. There are many more monocular depth cues than stereo,which explains why we are able to infer so much depth information from a singlephotograph. Figure 6.1 shows an example. The illusions in Figure 6.2 show thateven simple line drawings are enough to provide strong cues. Interestingly, thecues used by humans also work in computer vision algorithms to extract depthinformation from images [20].
6.1.1 Monocular depth cues
Retinal image size Many cues result from the geometric distortions causedby perspective projection; recall the “3D” appearance of Figure 1.23(c). For afamiliar object, such as a human, coin, or basketball, we often judge its distanceby how “large” is appears to be. Recalling the perspective projection math fromSection 3.4, the size of the image on the retina is proportional to 1/z, in which zis the distance from the eye (or the common convergence point for all projectionlines). See Figure 6.3. The same thing happens when taking a picture with acamera: A picture of a basketball would occupy larger part of the image, coveringmore pixels, as it becomes closer to the camera. This cue is called retinal image
size, and was studied in [4].Two important factors exist. First, the viewer must be familiar with the object
to the point of comfortably knowing its true size. For familiar objects, such aspeople or cars, our brains performance size constancy scaling by assuming that
156 S. M. LaValle: Virtual Reality
Figure 6.4: For the Ebbinghaus illusion, the inner disc appears larger when sur-rounded by smaller discs. The inner disc is the same size in either case. This maybe evidence of discrepancy between the true visual angle (or retinal image size)and the perceived visual angle.
the distance, rather than the size, of the person is changing if they come closer.Size constancy falls of the general heading of subjective constancy, which appearsthrough many aspects of perception, including shape, size, and color. The secondfactor is that, the object must be appear naturally so that it does not conflictwith other depth cues.
If there is significant uncertainty about the size of an object, then knowledgeof its distance should contribute to estimating its size. This falls under size per-
ception, which is closely coupled to depth perception. Cues for each influence theother, in a way discussed in Section 6.4.
One controversial theory is that our perceived visual angle differs from theactual visual angle. The visual angle is proportional to the retinal image size.This theory is used to explain the illusion that the moon appears to be largerwhen it is near the horizon. For another example, see Figure 6.4.
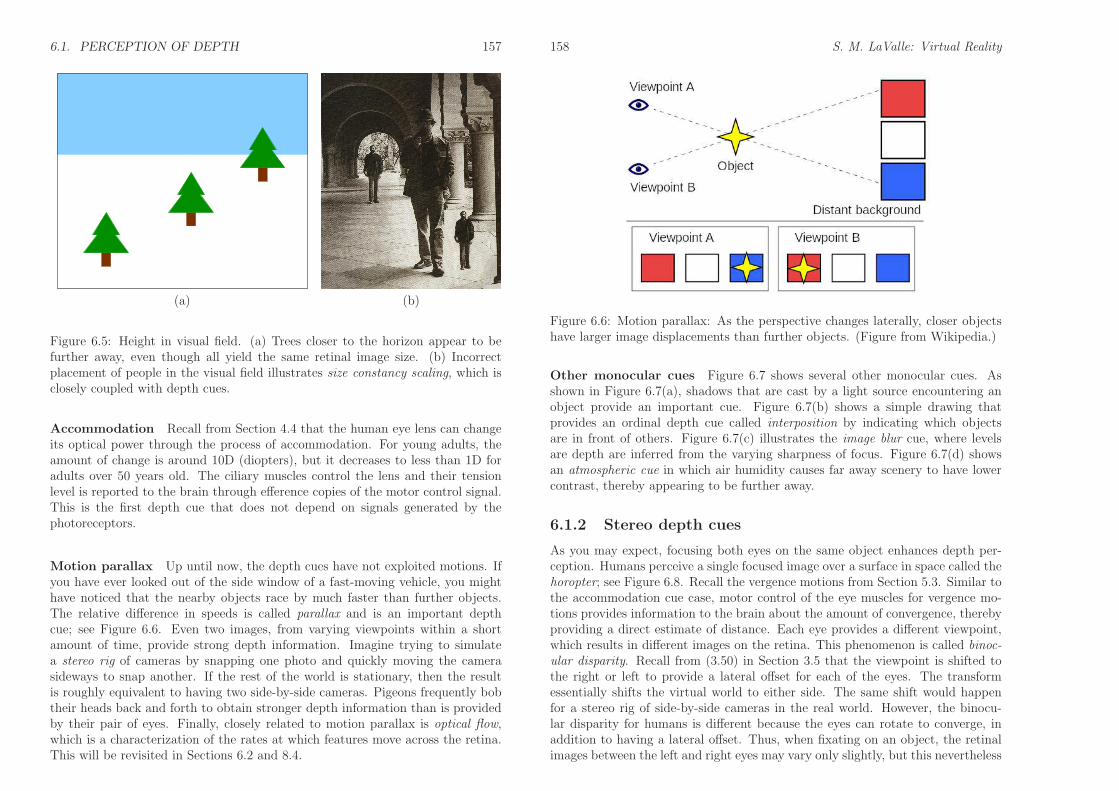
Height in the visual field Figure 6.5(a) illustrates another important cue,which is the height of the object in the visual field. The Ponzo illusion in Figure6.2(a) exploits this cue. Suppose that we can see over a long distance withoutobstructions. Due to perspective projection, the horizon is a line that dividesthe view in half. The upper half is perceived as the sky, and the lower half is theground. The distance of objects from the horizon line corresponds directly to theirdistance due to perspective projection: The closer to the horizon, the further theperceived distance. Size constancy scaling, if available, combines with the heightin the visual field, as shown in Figure 6.5(b).
6.1. PERCEPTION OF DEPTH 157
(a) (b)
Figure 6.5: Height in visual field. (a) Trees closer to the horizon appear to befurther away, even though all yield the same retinal image size. (b) Incorrectplacement of people in the visual field illustrates size constancy scaling, which isclosely coupled with depth cues.
Accommodation Recall from Section 4.4 that the human eye lens can changeits optical power through the process of accommodation. For young adults, theamount of change is around 10D (diopters), but it decreases to less than 1D foradults over 50 years old. The ciliary muscles control the lens and their tensionlevel is reported to the brain through efference copies of the motor control signal.This is the first depth cue that does not depend on signals generated by thephotoreceptors.
Motion parallax Up until now, the depth cues have not exploited motions. Ifyou have ever looked out of the side window of a fast-moving vehicle, you mighthave noticed that the nearby objects race by much faster than further objects.The relative difference in speeds is called parallax and is an important depthcue; see Figure 6.6. Even two images, from varying viewpoints within a shortamount of time, provide strong depth information. Imagine trying to simulatea stereo rig of cameras by snapping one photo and quickly moving the camerasideways to snap another. If the rest of the world is stationary, then the resultis roughly equivalent to having two side-by-side cameras. Pigeons frequently bobtheir heads back and forth to obtain stronger depth information than is providedby their pair of eyes. Finally, closely related to motion parallax is optical flow,which is a characterization of the rates at which features move across the retina.This will be revisited in Sections 6.2 and 8.4.
158 S. M. LaValle: Virtual Reality
Figure 6.6: Motion parallax: As the perspective changes laterally, closer objectshave larger image displacements than further objects. (Figure from Wikipedia.)
Other monocular cues Figure 6.7 shows several other monocular cues. Asshown in Figure 6.7(a), shadows that are cast by a light source encountering anobject provide an important cue. Figure 6.7(b) shows a simple drawing thatprovides an ordinal depth cue called interposition by indicating which objectsare in front of others. Figure 6.7(c) illustrates the image blur cue, where levelsare depth are inferred from the varying sharpness of focus. Figure 6.7(d) showsan atmospheric cue in which air humidity causes far away scenery to have lowercontrast, thereby appearing to be further away.
6.1.2 Stereo depth cues
As you may expect, focusing both eyes on the same object enhances depth per-ception. Humans perceive a single focused image over a surface in space called thehoropter; see Figure 6.8. Recall the vergence motions from Section 5.3. Similar tothe accommodation cue case, motor control of the eye muscles for vergence mo-tions provides information to the brain about the amount of convergence, therebyproviding a direct estimate of distance. Each eye provides a different viewpoint,which results in different images on the retina. This phenomenon is called binoc-
ular disparity. Recall from (3.50) in Section 3.5 that the viewpoint is shifted tothe right or left to provide a lateral offset for each of the eyes. The transformessentially shifts the virtual world to either side. The same shift would happenfor a stereo rig of side-by-side cameras in the real world. However, the binocu-lar disparity for humans is different because the eyes can rotate to converge, inaddition to having a lateral offset. Thus, when fixating on an object, the retinalimages between the left and right eyes may vary only slightly, but this nevertheless

6.1. PERCEPTION OF DEPTH 159
(a) (b)
(c) (d)
Figure 6.7: Several more monocular depth cues: (a) Shadows resolve ambiguousdepth in the ball and shadow illusion. (b) The interposition of objects provides anordinal depth cue. (c) Due to image blur, one gnome appears to be much closerthan the others. (d) This scene provides an atmospheric cue: Some scenery isperceived to be further away because it has lower contrast.
160 S. M. LaValle: Virtual Reality
Figure 6.8: The horopter is the loci of points over which the eyes can convergeand focus on a single depth. The T curve shows the theoretical horopter basedon simple geometry. The E curve shows the empirical horopter, which is muchlarger and correspond to the region over which a single focused image is perceived.(Figure by Rainer Zenz.)
6.1. PERCEPTION OF DEPTH 161
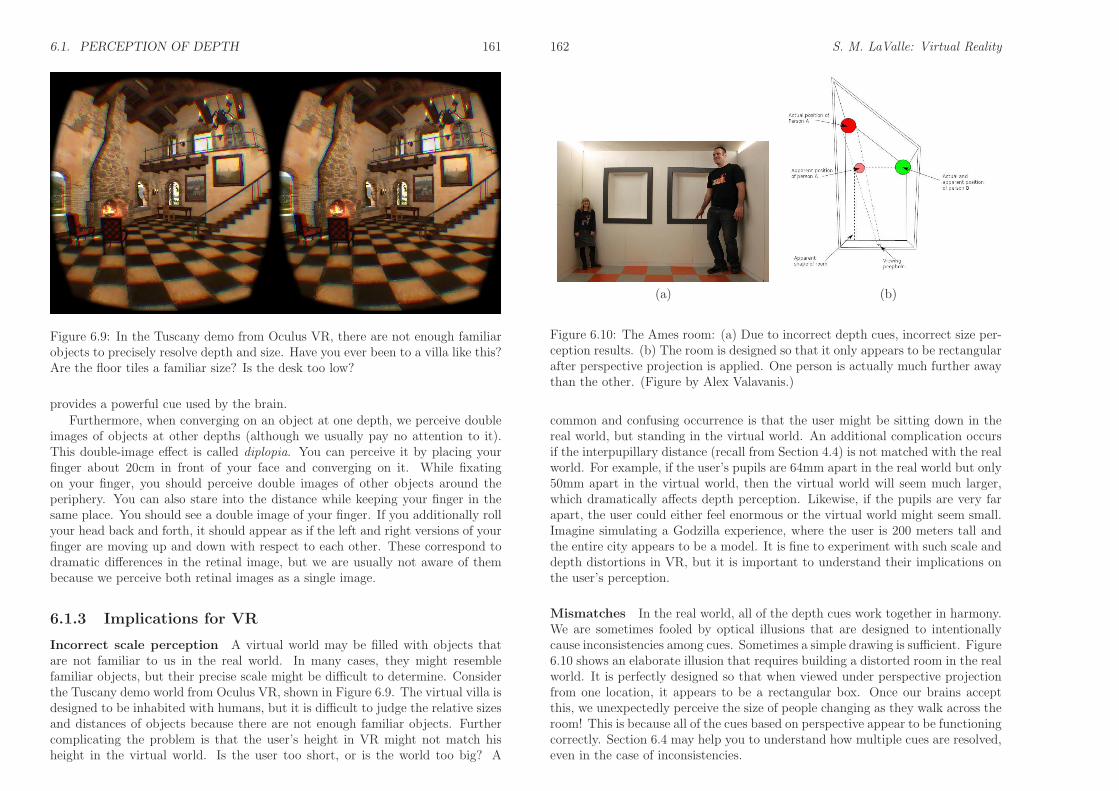
Figure 6.9: In the Tuscany demo from Oculus VR, there are not enough familiarobjects to precisely resolve depth and size. Have you ever been to a villa like this?Are the floor tiles a familiar size? Is the desk too low?
provides a powerful cue used by the brain.
Furthermore, when converging on an object at one depth, we perceive doubleimages of objects at other depths (although we usually pay no attention to it).This double-image effect is called diplopia. You can perceive it by placing yourfinger about 20cm in front of your face and converging on it. While fixatingon your finger, you should perceive double images of other objects around theperiphery. You can also stare into the distance while keeping your finger in thesame place. You should see a double image of your finger. If you additionally rollyour head back and forth, it should appear as if the left and right versions of yourfinger are moving up and down with respect to each other. These correspond todramatic differences in the retinal image, but we are usually not aware of thembecause we perceive both retinal images as a single image.
6.1.3 Implications for VR
Incorrect scale perception A virtual world may be filled with objects thatare not familiar to us in the real world. In many cases, they might resemblefamiliar objects, but their precise scale might be difficult to determine. Considerthe Tuscany demo world from Oculus VR, shown in Figure 6.9. The virtual villa isdesigned to be inhabited with humans, but it is difficult to judge the relative sizesand distances of objects because there are not enough familiar objects. Furthercomplicating the problem is that the user’s height in VR might not match hisheight in the virtual world. Is the user too short, or is the world too big? A
162 S. M. LaValle: Virtual Reality
(a) (b)
Figure 6.10: The Ames room: (a) Due to incorrect depth cues, incorrect size per-ception results. (b) The room is designed so that it only appears to be rectangularafter perspective projection is applied. One person is actually much further awaythan the other. (Figure by Alex Valavanis.)
common and confusing occurrence is that the user might be sitting down in thereal world, but standing in the virtual world. An additional complication occursif the interpupillary distance (recall from Section 4.4) is not matched with the realworld. For example, if the user’s pupils are 64mm apart in the real world but only50mm apart in the virtual world, then the virtual world will seem much larger,which dramatically affects depth perception. Likewise, if the pupils are very farapart, the user could either feel enormous or the virtual world might seem small.Imagine simulating a Godzilla experience, where the user is 200 meters tall andthe entire city appears to be a model. It is fine to experiment with such scale anddepth distortions in VR, but it is important to understand their implications onthe user’s perception.
Mismatches In the real world, all of the depth cues work together in harmony.We are sometimes fooled by optical illusions that are designed to intentionallycause inconsistencies among cues. Sometimes a simple drawing is sufficient. Figure6.10 shows an elaborate illusion that requires building a distorted room in the realworld. It is perfectly designed so that when viewed under perspective projectionfrom one location, it appears to be a rectangular box. Once our brains acceptthis, we unexpectedly perceive the size of people changing as they walk across theroom! This is because all of the cues based on perspective appear to be functioningcorrectly. Section 6.4 may help you to understand how multiple cues are resolved,even in the case of inconsistencies.

6.1. PERCEPTION OF DEPTH 163
In a VR system, it is easy to cause mismatches and in many cases they areunavoidable. Recall from Section 5.4 that vergence-accommodation mismatchoccurs in VR headsets. Another source of mismatch may occur from imperfecthead tracking. If there is significant latency, then the visual stimuli will not appearin the correct place at the expected time. Furthermore, many tracking systemstrack the head orientation only. This makes it impossible to use motion parallaxas a depth cue if the user moves from side to side without any rotation. Topreserve most depth cues based on motion, it is important to track head position,in addition to orientation; see Section 9.3. Optical distortions may cause evenmore mismatch.
Monocular cues are powerful! A common misunderstanding among the gen-eral public is that depth perception enabled by stereo cues alone. We are bom-barded with marketing of “3D” movies and stereo displays. The most commoninstance today is the use of circularly polarized 3D glasses in movie theaters sothat each eye receives a different image when looking at the screen. VR is noexception to this common misunderstanding. CAVE systems provided 3D glasseswith an active shutter inside so that alternating left and right frames can bepresented to the eyes. Note that this cuts the frame rate in half. Now that wehave comfortable headsets, presenting separate visual stimuli to each eye is muchsimpler. One drawback is that the rendering effort (the subject of Chapter 7) isdoubled, although this can be improved through some context-specific tricks.
As you have seen in this section, there are many more monocular depth cuesthan stereo cues. Therefore, it is wrong to assume that the world is perceivedas “3D” only if there are stereo images. This insight is particularly valuable forleveraging captured data from the real world. Recall from Section 1.1 that thevirtual world may be synthetic or captured. It is generally more costly to createsynthetic worlds, but it is then simple to generate stereo viewpoints (at a higherrendering cost). On the other hand, capturing panoramic, monoscopic imagesand movies is fast and inexpensive (examples were shown in Figure 1.9). Thereare already smartphone apps that stitch pictures together to make a panoramicphoto, and direct capture of panoramic video is likely to be a standard feature onsmartphones within a few years. By recognizing that this content is sufficiently“3D” due to the wide field of view and monocular depth cues, it becomes apowerful way to create VR experiences. There are already hundreds of millions ofimages in Google Street View, shown in Figure 6.11, which can be easily viewedusing Google Cardboard or other headsets. They provide a highly immersiveexperience with substantial depth perception, even though there is no stereo.There is even strong evidence that stereo displays cause significant fatigue anddiscomfort, especially for objects at a close depth [13, 14]. Therefore, one shouldthink very carefully about the use of stereo. In many cases, it might be moretime, cost, and trouble than it is worth to obtain the stereo cues when there mayalready be sufficient monocular cues for the VR task or experience.
164 S. M. LaValle: Virtual Reality
Figure 6.11: In Google Cardboard and other VR headsets, hundreds of millions ofpanoramic Street View images can be viewed. There is significant depth percep-tion, even when the same image is presented to both eyes, because of monoscopicdepth cues.
6.2 Perception of Motion
We rely on our vision to perceive motion for many crucial activities. One useis to separate a moving figure from a stationary background. For example, acamouflaged animal in the forest might only become noticeable when moving.This is clearly useful whether humans are the hunter or the hunted. Motion alsohelps people to assess the 3D structure of an object. Imagine assessing the valueof a piece of fruit in the market by rotating it around. Another use is to visuallyguide actions, such as walking down the street or hammering a nail. VR systemshave the tall order of replicating these uses in a virtual world in spite of limitedtechnology. Just as important as the perception of motion is the perception of non-motion, which we called perception of stationarity in Section 2.3. For example, ifwe apply the VOR by turning our heads, then do the virtual world objects movecorrectly on the display so that they appear to be stationary? Slight errors intime or image position might inadvertently trigger the perception of motion.
6.2.1 Detection mechanisms
Reichardt detector Figure 6.12 shows a neural circuitry model, called a Re-
ichardt detector, which responds to directional motion in the human vision system.Neurons in the ganglion layer and LGN detect simple features in different spots inthe retinal image. At higher levels, motion detection neurons exist that respond

6.2. PERCEPTION OF MOTION 165
Figure 6.12: The neural circuitry directly supports motion detection. As theimage feature moves across the retina, nearby feature detection neurons (labeleda and b) activate in succession. Their outputs connect to motion detection neurons(labeled c). Due to different path lengths from a and b to c, the activation signalarrives at different times. Thus, c activates when the feature was detected by aslightly before being detected by b.
when the feature moves from one spot on the retina to another nearby spot. Themotion detection neuron activates for a feature speed that depends on the differ-ence in path lengths from its input neurons. It is also sensitive to a particulardirection of motion based on the relative locations of the receptive fields of theinput neurons. Due to the simplicity of the motion detector, it can be easilyfooled. Figure 6.12 shows a feature moving from left to right. Suppose that atrain of features moves from right to left. Based on the speed of the features andthe spacing between them, the detector may inadvertently fire, causing motion tobe perceived in the opposite direction. This is the basis of the wagon-wheel effect,for which a wheel with spokes or a propeller may appear to be rotating in theopposite direction, depending on the speed. The process can be further disruptedby causing eye vibrations from humming [17]. This simulates stroboscopic condi-tions, which discussed in Section 6.2.2. Another point is that the motion detectorsare subject to adaptation. Therefore, several illusions exist, such as the waterfall
illusion [1] and the spiral aftereffect, in which incorrect motions are perceived dueto aftereffects from sustained fixation [1, 9].
From local data to global conclusions Motion detectors are local in thesense that a tiny portion of the visual field causes each to activate. In mostcases, data from detectors across large patches of the visual field are integrated
to indicate coherent motions of rigid bodies. (An exception would be staring atpure analog TV static.) All pieces of a rigid body move through space according
166 S. M. LaValle: Virtual Reality
Figure 6.13: Due to local nature of motion detectors, the aperture problem results.The motion of the larger body is ambiguous when perceived through a small holebecause a wide range of possible body motions could produce the same effectinside of the hole. An incorrect motion inference usually results.
to the equations from Section 3.2. This coordinated motion is anticipated by ourvisual system to match common expectations. If too much of the moving bodyis blocked, then the aperture problem results, which is shown in Figure 6.13. Aclean mathematical way to describe the global motions across the retina is by avector field, which assigns a velocity vector at every position. The global result iscalled the optical flow, which provides powerful cues for both object motion andself motion. The latter case results in vection, which is a leading cause of VRsickness; see Sections 8.4 and 10.2 for details.
Distinguishing object motion from observer motion Figure 6.14 showstwo cases that produce the same images across the retina over time. In Figure6.14(a), the eye is fixed while the object moves by. In Figure 6.14(b), the situationis reversed: The object is fixed, but the eye moves. The brain uses several cuesto differentiate between these cases. Saccadic suppression, which was mentionedin Section 5.3, hides vision signals during movements; this may suppress motiondetectors in the second case. Another cue is provided by proprioception, whichis the body’s ability to estimate its own motions due to motor commands. Thisincludes the use of eye muscles in the second case. Finally, information is providedby large-scale motion. If it appears that the entire scene is moving, then the brainassumes the most likely interpretation, which is that the user must be moving.This is why the haunted swing illusion, shown in Figure 2.20, is so effective.

6.2. PERCEPTION OF MOTION 167
(a) (b)
Figure 6.14: Two motions that cause equivalent movement of the image on theretina: (a) The eye is fixed and the object moves; (b) the eye moves while theobject is fixed. Both of these are hard to achieve in practice due to eye rotations(smooth pursuit and VOR).
Figure 6.15: The zoetrope was developed in the 1830s and provided stroboscopicapparent motion as images became visible through slits in a rotating disc.
168 S. M. LaValle: Virtual Reality
Figure 6.16: The phi phenomenon and beta movement are physiologically distincteffects in which motion is perceived [22, 19]. In the sequence of dots, one isturned off at any give time. A different dot is turned off in each frame, followinga clockwise pattern. At a very low speed (2 FPS), beta movement triggers amotion perception of each on dot directly behind the off dot. The on dot appearsto jump to the position of the off dot. At a higher rate, such as 15 FPS, thereinstead appears to be a moving hole; this corresponds to the phi phenomenon.
6.2.2 Stroboscopic apparent motion
Nearly everyone on Earth has seen a motion picture, whether through a TV,smartphone, or movie screen. The motions we see are an illusion because a se-quence of still pictures is being flashed onto the screen. This phenomenon is calledstroboscopic apparent motion; it was discovered and refined across the 19th cen-tury. The zoetrope, shown in Figure 6.15 was developed around 1834. It consistsof a rotating drum with slits that allow each frame to be visible for an instantwhile the drum rotates. In Section 1.3, Figure 1.24 showed the Horse in Motionfilm from 1878.
Why does this illusion of motion work? An early theory, which has largelybeen refuted in recent years, is called persistence of vision. The theory states thatimages persist in the vision system during the intervals in between frames, therebycausing them to be perceived as continuous. One piece of evidence against thistheory is that images persist in the visual cortex for around 100ms, which impliesthat the 10 FPS (Frames Per Second) is the slowest speed that stroboscopic appar-ent motion would work; however, it is also perceived down to 2 FPS [19]. Anotherpiece of evidence against the persistence of vision is the existence of stroboscopicapparent motions that cannot be accounted for by it. The phi phenomenon andbeta movement are examples of motion perceived in a sequence of blinking lights,rather than flashing frames (see Figure 6.16). The most likely reason that stro-boscopic apparent motion works is that it triggers the neural motion detectioncircuitry illustrated in Figure 6.12 [8, 11].

6.2. PERCEPTION OF MOTION 169
FPS Occurrence2 Stroboscopic apparent motion starts10 Ability to distinguish individual frames is lost16 Old home movies; early silent films24 Hollywood classic standard25 PAL television before interlacing30 NTSC television before interlacing48 Two-blade shutter; proposed new Hollywood standard50 Interlaced PAL television60 Interlaced NTSC television; perceived flicker in some displays72 Three-blade shutter; minimum CRT refresh rate for comfort90 Modern VR headsets; no more discomfort from flicker1000 Ability to see zipper effect for fast, blinking LED5000 Cannot perceive zipper effect
Figure 6.17: Various frame rates and comments on the corresponding strobo-scopic apparent motion. Units are in Frames Per Second (FPS).
Frame rates How many frames per second are appropriate for a motion picture?The answer depends on the intended use. Figure 6.17 shows a table of significantframe rates from 2 to 5000. Stroboscopic apparent motion begins at 2 FPS.Imagine watching a security video at this rate. It is easy to distinguish individualframes, but the motion of a person would also be perceived. Once 10 FPS isreached, the motion is obviously more smooth and we start to lose the ability todistinguish individual frames. Early silent films ranged from 16 to 24 FPS. Theframe rates were often fluctuating and were played at a faster speed than theywere filmed. Once sound was added to film, incorrect speeds and fluctuations inthe speed were no longer tolerated because both sound and video needed to besynchronized. This motivated playback at the fixed rate of 24 FPS, which is stillused today by the movie industry. Personal video cameras remained at 16 or 18FPS into the 1970s. The famous Zapruder film of the Kennedy assassination in1963 was taken at 18.3 FPS. Although 24 FPS may be enough to perceive motionssmoothly, a large part of cinematography is devoted to ensuring that motions arenot so fast that jumps are visible due to the low frame rate.
Such low frame rates unfortunately lead to perceptible flicker as the im-ages rapidly flash on the screen with black in between. This motivated severalworkarounds. In the case of movie projectors, two-blade and three-blade shutterswere invented so that they would show each frame two or three times, respec-tively. This enabled movies to be shown at 48 FPS and 72 FPS, thereby reducingdiscomfort from flickering. Analog television broadcasts in the 20th century wereat 25 (PAL standard) or 30 FPS (NTSC standard), depending on the country.To double the frame rate and reduce perceived flicker, they used interlacing todraw half the image in one frame time, and then half in the other. Every other
170 S. M. LaValle: Virtual Reality
horizontal line is drawn in the first half, and the remaining lines are drawn in thesecond. This increased the frames rates on television screens to 50 and 60 FPS.The game industry has used 60 FPS standard target for smooth game play.
As people started sitting close to giant CRT monitors in the early 1990s, theflicker problem became problematic again because sensitivity to flicker is strongerat the periphery. Furthermore, even when flicker cannot be directly perceived, itmay still contribute to fatigue or headaches. Therefore, frame rates were increasedto even higher levels. A minimum acceptable ergonomic standard for large CRTmonitors was 72 FPS, with 85 to 90 FPS being widely considered as sufficientlyhigh to eliminate most flicker problems. The problem has been carefully studiedby psychologists under the heading of flicker fusion threshold; the precise rates atwhich flicker is perceptible or causes fatigue depends on many factors in additionto FPS, such as position on retina, age, color, and light intensity. Thus, the actuallimit depends on the kind of display, its size, specifications, how it is used, andwho is using it. Modern LCD and LED displays, used as televisions, computerscreens, and smartphone screens, have 60, 120, and even 240 FPS.
The story does not end there. If you connect an LED to a pulse generator(put a resistor in series), then flicker can be perceived at much higher rates. Setthe pulse generator to produce a square wave at several hundred Hz. Go to a darkroom and hold the LED in your hand. If you wave it around so fast that youreyes cannot track it, then the flicker becomes perceptible as a zipper pattern. Letthis be called the zipper effect. This happens because each time the LED pulseson, it is imaged in a different place on the retina. Without image stabilization, itappears as an array of lights. The faster the motion, the further apart the imageswill appear. The higher the pulse rate (or FPS), the closer together the imageswill appear. Therefore, to see the zipper effect at very high speeds, you need tomove the LED very quickly. It is possible to see the effect for a few thousandFPS.
6.2.3 Implications for VR
Unfortunately, VR systems require much higher display performance than usual.We have already seen in Section 5.4 that much higher resolution is needed so thatpixels and aliasing artifacts are not visible. The next problem is that higher framerates are needed in comparison to ordinary television or movie standards of 24FPS or even 60 FPS. To understand why, see Figure 6.18. The problem is easiestto understand in terms of the perception of stationarity, which was mentionedin Section 2.3. Fixate on a nearby object and yaw your head to the left. Youreyes should then rotate to the right to maintain the object in a fixed locationon the retina, due to the VOR (Section 5.3). If you do the same while wearinga VR headset and fixating on an object in the virtual world, then the image ofthe object needs to shift across the screen while you turn your head. Assumingthat the pixels instantaneously change at each new frame time, the image of the

6.3. PERCEPTION OF COLOR 171
Figure 6.18: A problem with perception of stationarity under stroboscopic appar-ent motion: The image of a feature slips across the retina in a repeating patternas the VOR is performed.
virtual object will slip across the retina as shown in Figure 6.18. The result is akind of judder in which the object appears to be wobbling from side to side withhigh frequency but small amplitude.
The problem is that each feature is fixed on the screen for too long whenideally it should be moving continuously across the screen. At 60 FPS, it is fixedfor 16.67ms during each frame (in an idealized setting, which ignores scanoutissues from Section 5.4). If the screen is instead turned on for only one or twomilliseconds for each frame, and then made black during the remaining times,then the amount of retinal image slip is greatly reduced. This display mode iscalled low persistence, and is shown in Figure 6.19(a). The short amount of timethat the display is illuminated is sufficient for the photoreceptors to collect enoughphotons to cause the image to be perceived. The problem is that at 60 FPS in low-persistence mode, flicker is perceived, which can lead to fatigue or headaches. Thiscan be easily perceived at the periphery in a bright scene in the Samsung GearVR headset. If the frame rate is increased to 90 FPS or above, then the adverseside effects of flicker subside for nearly everyone. If the frame rate is increased to500 FPS or beyond, then it would not even need to flicker, as depicted in Figure6.19(b).
One final point is that fast pixel switching speed is implied in the Figure 6.19.In a modern OLED display panel, the pixels can reach their target intensity valuesin less than 0.1ms. However, many LCD displays change pixel values much moreslowly. The delay to reach the target intensity may be as long as 20ms, dependingon the amount and direction of intensity change. In this case, a fixed virtual objectappears to smear or blur in the direction of motion. This was easily observable inthe Oculus Rift DK1, which used an LCD display panel.
172 S. M. LaValle: Virtual Reality
(a) (b)
Figure 6.19: An engineering solution to reduce retinal image slip: (a) Using low
persistence, the display is lit for a short enough time to trigger photoreceptors(t1 − t0) and then blanked for the remaining time (t2 − t1). Typically, t1 − t0 isaround one to two milliseconds. (b) If the frame rate were extremely fast (at least500 FPS), then the blank interval would not be needed.
Figure 6.20: In 2014, this dress photo became an Internet sensation as peoplewere unable to agree upon whether it was “blue and black” or “white and gold”,which are strikingly different perceptions of color.

6.3. PERCEPTION OF COLOR 173
6.3 Perception of Color
What makes an object “purple”, “pink”, or “gray”? Color perception is unusualbecause it is purely the result of our visual physiology and neural structures, ratherthan something that can be measured in the physical world. In other words, “It’sall in your head.” If two people have comparable color perception systems, thenthey can discuss colors using commonly agreed upon names while they perceivean object as having the same color. This contrasts other perception topics suchas motion, depth, and scale, all of which correspond to measurable quantities inthe surrounding world. The size of an object or the speed of its motion relativeto some frame could be determined by instrumentation. Humans would be forcedto agree on the numerical outcomes regardless of how their individual perceptualsystems are functioning.
The dress Figure 6.20 illustrates this point with the dress color illusion. It wasworn by Cecilia Bleasdale and became an Internet meme when millions of peoplequickly began to argue about the color of the dress. Based on the precise combina-tion of colors and lighting conditions, its appearance fell on the boundary of whathuman color perceptual systems can handle. About 57% perceive it as blue andblack (correct), 30% percent perceive it as white and gold, 10% perceive blue andbrown, and 10% could switch between perceiving any of the color combinations[6].
Dimensionality reduction Recall from Section 4.1 that light energy is a jum-ble of wavelengths and magnitudes that form the spectral power distribution.Figure 4.6 provided an illustration. As we see objects, the light in the environ-ment is reflected off of surfaces in a wavelength-dependent way according to thespectral distribution function (Figure 4.7). As the light passes through our eyesand is focused onto the retina, each photoreceptor receives a jumble of light en-ergy that contains many wavelengths. Since the power distribution is a functionof wavelength, the set of all possible distributions is a function space, which isgenerally infinite-dimensional. Our limited hardware cannot possibly sense theentire function. Instead, the rod and cone photoreceptors sample it with a biastoward certain target wavelengths, as was shown in Figure 5.3 of Section 5.1. Theresult is a well-studied principle in engineering called dimensionality reduction.Here, the infinite-dimensional space of power distributions collapses down to a 3Dcolor space. It is no coincidence that human eyes have precisely three types ofcones, and that our RGB displays target the same colors as the photoreceptors.
Yellow = Green + Red To help understand this reduction, consider the per-ception of “yellow”. According to the visible light spectrum (Figure 4.5), yellowhas a wavelength of about 580nm. Suppose we had a pure light source that shineslight of exactly 580nm wavelength onto our retinas with no other wavelengths.
174 S. M. LaValle: Virtual Reality
Figure 6.21: One representation of the HSV color space, which involves threeparameters: hue, saturation, and value (brightness). (Figure by Wikipedia userSharkD.)
The spectral distribution function would have a spike at 580nm and be zero ev-erywhere else. If we had a cone with peak detection at 580nm and no sensitivityto other wavelengths, then it would perfectly detect yellow. Instead, we perceiveyellow by activation of both green and red cones because their sensitivity regions(Figure 5.3) include 580nm. It should then be possible to generate the samephotoreceptor response by sending a jumble of light that contains precisely twowavelengths: 1) Some “green” at 533nm, and 2) some “red” at 564nm. If themagnitudes of green and red are tuned so that the green and red cones activatein the same way as they did for pure yellow, then it becomes impossible for ourvisual system to distinguish the green/red mixture from pure yellow. Both areperceived as “yellow”. This matching of colors from red, green and blue com-ponents is called metamerism. Such a blending is precisely what is done on aRGB display to produce yellow. Suppose the intensity of each color ranges from0 (dark) to 255 (bright). Red is produced by RGB= (255, 0, 0), and green isRGB= (0, 255, 0). These each activate one LED (or LCD) color, thereby produc-ing a pure red or green. If both are turned on, then yellow is perceived. Thus,yellow is RGB= (255, 255, 0).
Color spaces For convenience, a parameterized color space is often defined.One of the most common in computer graphics is called HSV, which has thefollowing three components (Figure 6.21):
• The hue, which corresponds directly to the perceived color, such as “red” or“green”.

6.3. PERCEPTION OF COLOR 175
Figure 6.22: 1931 CIE color standard with RGB triangle. This representationis correct in terms of distances between perceived colors. (Figure by Jeff Yurek,Nanosys.)
176 S. M. LaValle: Virtual Reality
• The saturation, which is the purity of the color. In other words, how muchenergy is coming from wavelengths other than the wavelength of the hue?
• The value, which corresponds to the brightness.
There are many methods to scale the HSV coordinates, which distort the colorspace in various ways. The RGB values could alternatively be used, but aresometimes more difficult for people to interpret.
It would be ideal to have a representation in which the distance between twopoints corresponds to the amount of perceptual difference. In other words, astwo points are further apart, our ability to distinguish them is increased. Thedistance should correspond directly to the amount of distinguishability. Visionscientists designed a representation to achieve this, resulting in the 1931 CIE
color standard shown in Figure 6.22. Thus, the CIE is considered to be undistortedfrom a perceptual perspective. It is only two-dimensional because it disregardsthe brightness component, which is independent of color perception according tocolor matching experiments [8].
Mixing colors Suppose that we have three pure sources of light, as in thatproduced by an LED, in red, blue, and green colors. We have already discussedhow to produce yellow by blending red and green. In general, most perceptiblecolors can be matched by a mixture of three. This is called trichromatic theory
(or Young-Helmholtz theory). A set of colors that achieves this is called primary
colors. Mixing all three evenly produces perceived white light, which on a displayis achieved as RGB= (255, 255, 255). Black is the opposite: RGB= (0, 0, 0). Suchlight mixtures follow a linearity property. Suppose primary colors are used toperceptually match power distributions of two different light sources. If the lightsources are combined, then their intensities of the primary colors need only tobe added to obtain the perceptual match for the combination. Furthermore, theoverall intensity can be scaled by multiplying the red, green, and blue compo-nents without affecting the perceived color. Only the perceived brightness maybe changed.
The discussion so far has focused on additive mixtures. When mixing paints orprinting books, colors mix subtractively because the spectral reflectance functionis being altered. When starting with a white canvass or sheet of paper, virtuallyall wavelengths are reflected. Painting a green line on the page prevents all wave-lengths other than green from being reflected at that spot. Removing all wave-lengths results in black. Rather than using RGB components, printing presses arebased on CMYK, which correspond to cyan, magenta, yellow, and black. The firstthree are pairwise mixes of the primary colors. A black component is included toreduce the amount of ink wasted by using the other three colors to subtractivelyproduce black. Note that the targeted colors are observed only if the incominglight contains the targeted wavelengths. The green line would appear green underpure, matching green light, but might appear black under pure blue light.

6.3. PERCEPTION OF COLOR 177
(a) (b)
Figure 6.23: (a) The perceived hot air balloon colors are perceived the same re-gardless of the portions that are in direct sunlight or in a shadow. (Figure byWikipedia user Shanta.) (b) The checker shadow illusion from Section 2.3 is ex-plained by the lightness constancy principle as the shadows prompt compensationof the perceived lightness. (Figure by Adrian Pingstone; original by Edward H.Adelson.)
Constancy The dress in Figure 6.20 showed an extreme case that results incolor confusion across people due to the strange lighting conditions. Ordinarily,human color perception is surprisingly robust to the source of color. A red shirtappears to be red whether illuminated under indoor lights at night or in directsunlight. These correspond to vastly different cases in terms of the spectral powerdistribution that reaches the retina. Our ability to perceive an object as havingthe same color over a wide variety of lighting conditions is called color constancy.Several perceptual mechanisms allow this to happen. One of them is chromatic
adaptation, which results in a shift in perceived colors due to prolonged exposureto specific colors. Another factor in the perceived color is the expectation fromthe colors of surrounding objects. Furthermore, memory about how objects areusually colored in the environment biases our interpretation.
The constancy principle also appears without regard to particular colors. Ourperceptual system also maintains lightness constancy so that the overall bright-ness levels appear to be unchanged, even after lighting conditions are dramaticallyaltered; see Figure 6.23(a). Under the ratio principle theory, only the ratio of re-flectances between objects in a scene are perceptually maintained, whereas theoverall amount of reflected intensity is not perceived. Further complicating mat-ters, our perception of object lightness and color are maintained as the scenecontains uneven illumination. A clear example is provided from shadows cast byone object onto another. Our perceptual system accounts for the shadow andadjusts our perception of the object shade or color. The checker shadow illusionshown in Figure 6.23 is caused by this compensation due to shadows.
178 S. M. LaValle: Virtual Reality
Figure 6.24: Gamma correction is used to span more orders of magnitude in spiteof a limited number of bits. The transformation is v′ = cvγ, in which c is constant(usually c = 1) and γ controls the nonlinearity of the correction or distortion.
Display issues Displays generally use RGB lights to generate the palette ofcolors and brightness. Recall Figure 4.36, which showed the subpixel mosaic ofindividual component colors for some common displays. Usually, the intensity ofeach R, G, and B value is set by selecting an integer from 0 to 255. This is asevere limitation on the number of brightness levels, as stated in Section 5.4. Onecannot hope to densely cover all seven orders of magnitude of perceptible lightintensity. One way to enhance the amount of contrast over the entire range is toperform gamma correction. In most displays, images are encoded with a gammaof about 0.45 and decoded with a gamma of 2.2.
Another issue is that the set of all available colors lies inside of the triangleformed by R, G, and B vertices. This limitation is shown for the case of the sRGB
standard in Figure 6.22. Most the CIE is covered, but many colors that humansare capable of perceiving cannot be generated on the display.
6.4 Combining Sources of Information
Throughout this chapter, we have seen perceptual processes that combine infor-mation from multiple sources. These could be cues from the same sense, as inthe numerous monocular cues used to judge depth. Perception may also com-bine information from two or more senses. For example, people typically combineboth visual and auditory cues when speaking face to face. Information from bothsources makes it easier to understand someone, especially if there is significantbackground noise. We have also seen that information is integrated over time,as in the case of saccades being employed to fixate on several object features.Finally, our memories and general expectations about the behavior of the sur-

6.4. COMBINING SOURCES OF INFORMATION 179
rounding world bias our conclusions. Thus, information is integrated from priorexpectations and the reception of many cues, which may come from differentsenses at different times.
Statistical decision theory provides a useful and straightforward mathematicalmodel for making choices that incorporate prior biases and sources of relevant, ob-served data. It has been applied in many fields, including economics, psychology,signal processing, and computer science. One key component is Bayes’ rule, whichspecifies how the prior beliefs should be updated in light of new observations, toobtain posterior beliefs. More formally, the “beliefs” are referred as probabilities.If the probability takes into account information from previous information, it iscalled a conditional probability. There is no room to properly introduce probabilitytheory here; only the basic ideas are given to provide some intuition without therigor. For further study, find an online course or classic textbook (for example,[16]).
Let
H = {h1, h2, . . . , hn} (6.1)
be a set of hypotheses (or interpretations). Similarly, let
C = {c1, c2, . . . , cm} (6.2)
C be a set of possible outputs of a cue detector. For example, the cue detectormight output the eye color of a face that is currently visible. In this case C is theset of possible colors:
C = {brown,blue,green,hazel}. (6.3)
Modeling a face recognizer, H would correspond to the set of people familiar tothe person.
We want to calculate probability values for each of the hypotheses in H. Eachprobability value must lie between 0 to 1, and the sum of the probability valuesfor every hypothesis in H must sum to one. Before any cues, we start with anassignment of values called the prior distribution, which is written as P (h). The“P” denotes that it is a probability function or assignment; P (h) means that anassignment has been applied to every h in H. The assignment must be made sothat
P (h1) + P (h2) + · · ·+ P (hn) = 1, (6.4)
and 0 ≤ P (hi) ≤ 1 for each i from 1 to n.The prior probabilities are generally distributed across the hypotheses in a dif-
fuse way; an example is shown in Figure 6.25(a). The likelihood of any hypothesisbeing true before any cues is proportional to its frequency of occurring naturally,based on evolution and the lifetime of experiences of the person. For example, ifyou open your eyes at a random time in your life, what is the likelihood of seeinga human being versus a wild boar?
180 S. M. LaValle: Virtual Reality
(a) (b)
(c) (d)
Figure 6.25: Example probability distributions: (a) A possible prior distribution.(b) Preference for one hypothesis starts to emerge after a cue. (c) A peakeddistribution, which results from strong, consistent cues. (d) Ambiguity may resultin two (or more) hypotheses that are strongly favored over others; this is the basisof multistable perception.
6.4. COMBINING SOURCES OF INFORMATION 181
Under normal circumstances (not VR!), we expect that the probability forthe correct interpretation will rise as cues arrive. The probability of the correcthypothesis should pull upward toward 1, effectively stealing probability mass fromthe other hypotheses, which pushes their values toward 0; see Figure 6.25(b). A“strong” cue should lift the correct hypothesis upward more quickly than a “weak”cue. If a single hypothesis has a probability value close to 1, then the distribution isconsidered peaked, which implies high confidence; see Figure 6.25(c). In the otherdirection, inconsistent or incorrect cues have the effect of diffusing the probabilityacross two or more hypotheses. Thus, the probability of the correct hypothesismay be lowered as other hypotheses are considered plausible and receive highervalues. It may also be possible that two alternative hypotheses remain strong dueto ambiguity that cannot be solved from the given cues; see Figure 6.25(d).
To take into account information from a cue, a conditional distribution is de-fined, which is written as P (h | c). This is spoken as “the probability of hgiven c.” This corresponds to a probability assignment for all possible combi-nations of hypotheses and cues. For example, it would include P (h2 | c5), ifthere are at least two hypotheses and five cues. Continuing our face recognizer,this would look like P (Barack Obama | brown), which should be larger thanP (Barack Obama | blue) (he has brown eyes).
We now arrive at the fundamental problem, which is to calculate P (h | c) afterthe cue arrives. This is accomplished by Bayes’ rule:
P (h | c) =P (c | h)P (h)
P (c). (6.5)
The denominator can be expressed as
P (c) = P (c | h1)P (h1) + P (c | h2)P (h2) + · · ·+ P (c | hn)P (hn), (6.6)
or it can be ignored it as a normalization constant, at which point only relativelikelihoods are calculated instead of proper probabilities.
The only thing accomplished by Bayes’ rule was to express P (h | c) in terms ofthe prior distribution P (h) and a new conditional distribution P (c | h). The newconditional distribution is easy to work with in terms of modeling. It characterizesthe likelihood that each specific cue will appear given that the hypothesis is true.
What if information arrives from a second cue detector? In this case, (6.5) isapplied again, but P (h | c) is now considered the prior distribution with respectto the new information. Let D = {d1, d2, . . . , dk} represent the possible outputsof the new cue detector. Bayes’ rule becomes
P (h | c, d) =P (d | h)P (h | c)
P (d|c). (6.7)
Above, P (d | h) makes what is called a conditional independence assumption:P (d | h) = P (d | h, c). This is simpler from a modeling perspective. More
182 S. M. LaValle: Virtual Reality
(a) (b)
Figure 6.26: (a) The Necker cube, studied in 1832 by Swiss crystallographer LouisAlbert Necker. (b) The rabbit duck illusion, from the 23 October 1892 issue ofFliegende Blatter.
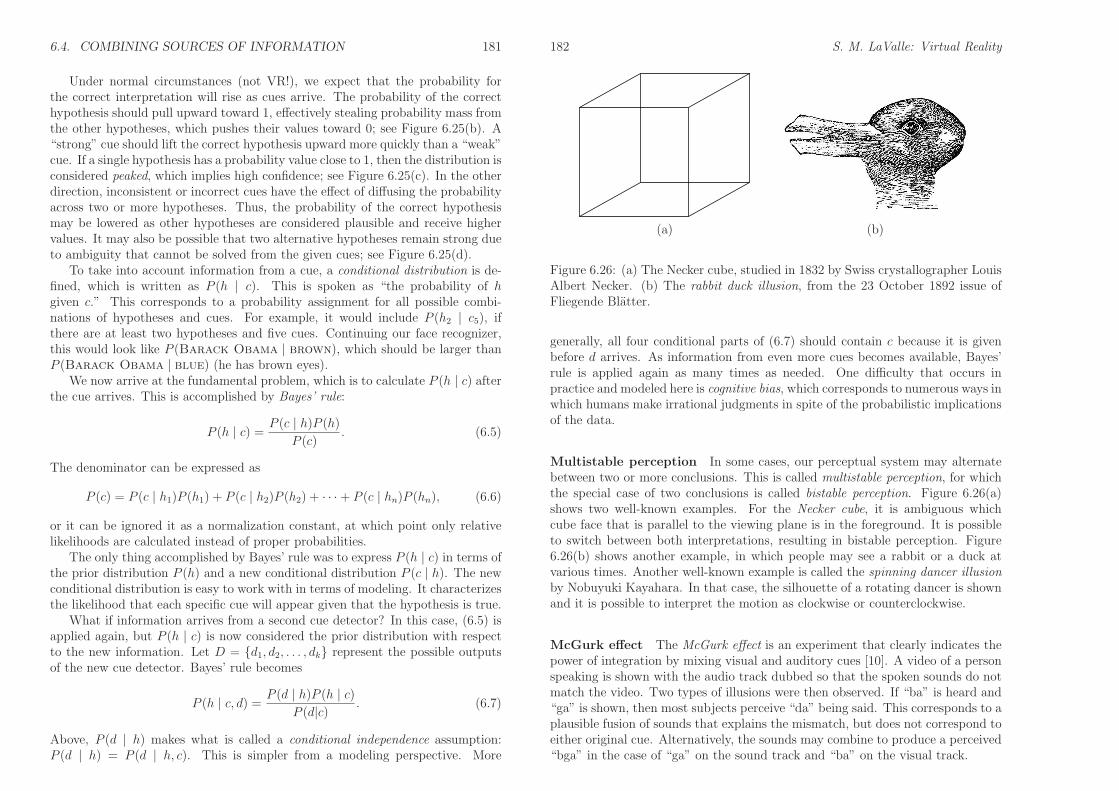
generally, all four conditional parts of (6.7) should contain c because it is givenbefore d arrives. As information from even more cues becomes available, Bayes’rule is applied again as many times as needed. One difficulty that occurs inpractice and modeled here is cognitive bias, which corresponds to numerous ways inwhich humans make irrational judgments in spite of the probabilistic implicationsof the data.
Multistable perception In some cases, our perceptual system may alternatebetween two or more conclusions. This is called multistable perception, for whichthe special case of two conclusions is called bistable perception. Figure 6.26(a)shows two well-known examples. For the Necker cube, it is ambiguous whichcube face that is parallel to the viewing plane is in the foreground. It is possibleto switch between both interpretations, resulting in bistable perception. Figure6.26(b) shows another example, in which people may see a rabbit or a duck atvarious times. Another well-known example is called the spinning dancer illusion
by Nobuyuki Kayahara. In that case, the silhouette of a rotating dancer is shownand it is possible to interpret the motion as clockwise or counterclockwise.
McGurk effect The McGurk effect is an experiment that clearly indicates thepower of integration by mixing visual and auditory cues [10]. A video of a personspeaking is shown with the audio track dubbed so that the spoken sounds do notmatch the video. Two types of illusions were then observed. If “ba” is heard and“ga” is shown, then most subjects perceive “da” being said. This corresponds to aplausible fusion of sounds that explains the mismatch, but does not correspond toeither original cue. Alternatively, the sounds may combine to produce a perceived“bga” in the case of “ga” on the sound track and “ba” on the visual track.

6.4. COMBINING SOURCES OF INFORMATION i
Implications for VR Not all senses are taken over by VR. Thus, conflict willarise because of mismatch between the real and virtual worlds. As stated severaltimes, the most problematic case of this is vection, which is a sickness-causingconflict between visual and vestibular cues arising from apparent self motion inVR while remaining stationary in the real world; see Section 8.4. As anotherexample of mismatch, the user’s body may sense that it is sitting in a chair, butthe VR experience may involve walking. There would then be a height mismatchbetween the real and virtual worlds, in addition to mismatches based on propri-oception and touch. In addition to mismatches among the senses, imperfectionsin the VR hardware, software, content, and interfaces cause inconsistencies incomparison with real-world experiences. The result is that incorrect or untendedinterpretations may arise. Even worse, such inconsistencies may increase fatigueas human neural structures use more energy to interpret the confusing combina-tion. In light of the McGurk effect, it is easy to believe that many unintendedinterpretations or perceptions may arise from a VR system that does not provideperfectly consistent cues.
VR is also quite capable of generating new multistable perceptions. One ex-ample, which actually occurred in the VR industry, involved designing a popupmenu. Suppose that users are placed into a dark environment and a large menucomes rushing up to them. A user may perceive one of two cases: 1) the menuapproaches the user, or 2) the user is rushing up to the menu. The vestibular senseshould be enough to resolve whether the user is moving, but the visual sense isoverpowering. Prior knowledge about which is happening helps yield the correctperception. Unfortunately, if the wrong interpretation is made, then VR sicknessin increased due to the sensory conflict. This, our perceptual system could bytricked into an interpretation that is worse for our health! Knowledge is one ofmany VR sickness factors discussed in Section 12.3.
Further Reading
As with Chapter 5, much of the material from this chapter appears in textbooks onsensation and perception [5, 8, 23] For a collection of optical illusions and their expla-nations, see [12]. For more on motion detection, see Chapter 7 of [8]. Related to this isthe history of motion pictures [3, 2].
To better understand the mathematical foundations of combining cues from multiplesources, look for books on Bayesian analysis and statistical decision theory. For example,see [15] and Chapter 9 of [7]. An important issue is adaptation to VR system flawsthrough repeated use [18, 21]. This dramatically effects the perceptual results andfatigue from mismatches, and is a form of perceptual learning, which will be discussedin Section 12.1.
ii S. M. LaValle: Virtual Reality
Bibliography
[1] H. B. Barlow and R. M. Hill. Evidence for a physiological explanation of thewaterfall illusion. Nature, 200:1345–1347, 1963.
[2] D. Bordwell and K. Thompson. Film History: An Introduction, 3rd Ed.
McGraw-Hill, New York, NY, 2010.
[3] K. Brown. Silent films: What was the right speed? Sight and Sound,49(3):164–167, 1980.
[4] W. C. Gogel. An analysis of perceptions from changes in optical size. Per-
ception and Psychophysics, 60(5):805–820, 1998.
[5] E. B. Goldstein. Sensation and Perception, 9th Ed. Wadsworth, Belmont,CA, 2014.
[6] R. Lafer-Sousa, K. L. Hermann, and B. R. Conway. Striking individual dif-ferences in color perception uncovered by the dress photograph. Current
Biology, 25(13):R545–R546, 2015.
[7] S. M. LaValle. Planning Algorithms. Cambridge University Press, Cambridge,U.K., 2006. Available at http://planning.cs.uiuc.edu/.
[8] G. Mather. Foundations of Sensation and Perception. Psychology Press,Hove, UK, 2008.
[9] G. Mather, F. Verstraten, and S. Anstis. The motion aftereffect: A modern
perspective. MIT Press, Boston, MA, 1998.
[10] H. McGurk and J. MacDonald. Hearing lips and seeing voices. Nature,264:746–748, 1976.
[11] A. Mikami, W. T. Newsome, and R. H. Wurtz. Motion selectivity in macaquevisual cortex. II. Spatiotemporal range of directional interactions in MT andV1. Journal of Neurophysiology, 55:1328–1339, 1986.
[12] J. Ninio. The Science of Illusions. Cornell University Press, Ithaca, NY,2001.
iii
iv BIBLIOGRAPHY
[13] E. Peli. The visual effects of head-mounted display (HMD) are not dis-tinguishable from those of desk-top computer display. Vision Research,38(13):2053–2066, 1998.
[14] E. Peli. Optometric and perceptual issues with head-mounted displays. InP. Mouroulis, editor, Visual instrumentation : optical design and engineering
principles. McGraw-Hill, New York, NY, 1999.
[15] C. P. Robert. The Bayesian Choice, 2nd. Ed. Springer-Verlag, Berlin, 2001.
[16] S. Ross. A First Course in Probability, 9th Ed. Pearson, New York, NY,2012.
[17] W. Rushton. Effect of humming on vision. Nature, 216:1173–1175, 2009.
[18] A. R. Seitz, J. E. Nanez, S. R. Halloway, and T. Watanabe. Perceptual learn-ing of motion leads to faster-flicker perception. Journal of Vision, 6(6):158,2015.
[19] R. M. Steinman, Z. Pizlo, and F. J. Pizlo. Phi is not beta, and whyWertheimer’s discovery launched the Gestalt revolution. Vision Research,40(17):2257–2264, 2000.
[20] R. Szeliski. Computer Vision: Algorithms and Applications. Springer-Verlag,Berlin, 2010.
[21] R. B. Welch and B. J. Mohler. Adapting to virtual environments. In K. S.Hale and K. M. Stanney, editors, Handbook of Virtual Environments, 2nd
Edition. CRC Press, Boca Raton, FL, 2015.
[22] M. Wertheimer. Experimentelle Studien uber das Sehen von Bewegung (Ex-perimental Studies on the Perception of Motion). Zeitschrift fur Psychologie,61:161–265, 1912.
[23] J. M. Wolfe, K. R. Kluender, and D. M. Levi. Sensation and Perception, 4th
Ed. Sinauer, Sunderland, MA, 2015.