chapter 2coastal.ohiodnr.gov/portals/coastal/pdfs/.../ch2_coastal_awareness.pdf · water quality,...
TRANSCRIPT

Chapter 2

�
The narrow coastal fringe that comprises 17 percent of the nation’s contiguous land
area is home to more than half of its population. (Population density values exclude Alaska because its extensive coastal land area dilutes the national average). In 2003, approximately 153 million people (53 percent of the nation’s popu-lation of approximately 290 mil-lion people) lived in the 673 U.S. coastal counties, an increase of 33 million people since 1980. There are 30 coastal states in the United States containing 673 coastal coun-ties, boroughs, parishes or county equivalents. The National Oceanic and Atmospheric Administration’s (NOAA) Special Projects office defines a county as coastal if one of the following criteria is met: (1) at a minimum, 15 percent of the county’s total land area is located within a coastal watershed or (2) a portion of or an entire county accounts for at least 15 percent of a coastal catalog-ing unit. NOAA determines coastal watersheds as those with cataloging units (i.e. 8-digit Hydrologic Unit Codes) that are adjacent to ocean and Great Lakes coasts.
Coastal counties average 300 persons per square mile, much higher than the national average of 98 persons per square mile. By the year 2008, coastal county population is expected to increase by approxi-mately 7 million for a total of 160 million. These numbers do not
include seasonal population increases due to summer homes and vacationers attracted to the coastal region.
While U.S. coastal areas are home to a wealth of natural and economic resources, they are also some of the most developed areas in the nation. Population increase and coastal development produce numerous economic benefits; how-ever, they also may result in the loss of critical habitat, green space and biodiversity. Because the nation’s coastal and ocean resources are under increasing pressure from population growth and development, there is an increased need for sound coastal management.
What is coastal management?
Coastal management is a cooperative effort by federal and state agencies, political subdivisions, local groups and individuals who are dedicated to the comprehensive management of the nation’s coastal resources. This includes monitoring activities that affect the resources, and ensuring resource protection while balancing often competing national economic, cultural and environmental interests.
Where does coastal management take place?
Coastal management occurs not only in Ohio, but also in 34 other coastal U.S. states and territories with coasts on the oceans and Great Lakes.
What is the federal CZMA?
In recognition of the increasing pres-sures of development on the nation’s coastal resources, Congress enacted the Coastal Zone Management Act (CZMA) in 1972. The Act has been amended several times, and is found in U.S. Code Title 16 Chapter 33, Section 1451 through Section 1465.
The CZMA defines coastal man-agement as:
“Achieving the wise use of the land and water resources of the coastal zone giving full consider-ation to ecological, cultural, historic and aesthetic values and the need for compatible economic development.”
The CZMA encourages states to develop state-specific programs to preserve, protect, develop, and, where possible, restore and enhance valuable natural coastal resources such as wetlands, floodplains, estuaries, beaches, dunes, barrier islands and coral reefs, as well as the fish and wildlife using those habi-tats. Approved state programs are expected to consider or undertake the following: • Protecting natural resources. • Managing development in high
hazard areas. • Managing development to achieve
good water quality within coastal waters.
• Giving development priority to coastal-dependent uses.
• Having orderly processes for the siting of major facilities.
• Locating new commercial and industrial development in, or adjacent to, developed areas.
• Providing public access for active and passive recreation.
• Redeveloping urban waterfronts and ports, and preserving and restoring historic, cultural and esthetic coastal features.
• Simplifying and expediting gov-ernment decision-making actions.
• Coordinating state and federal actions.
• Giving adequate consideration to the views of federal agencies.
• Assuring the public and local governments have a say in coastal decision-making.
• Comprehensively planning for and managing living marine resources The CZMA entrusts day-to-day
management decisions to states and territories containing the 95,376 U.S. shoreline miles (99.9 percent) managed by coastal programs. Participation in the coastal program is voluntary. To encourage
�4
Coastal Awareness
Eighteen percent of the U.S.’s coastal population lives in Great Lakes coastal counties. Map 5 GIS data citation in Appendices
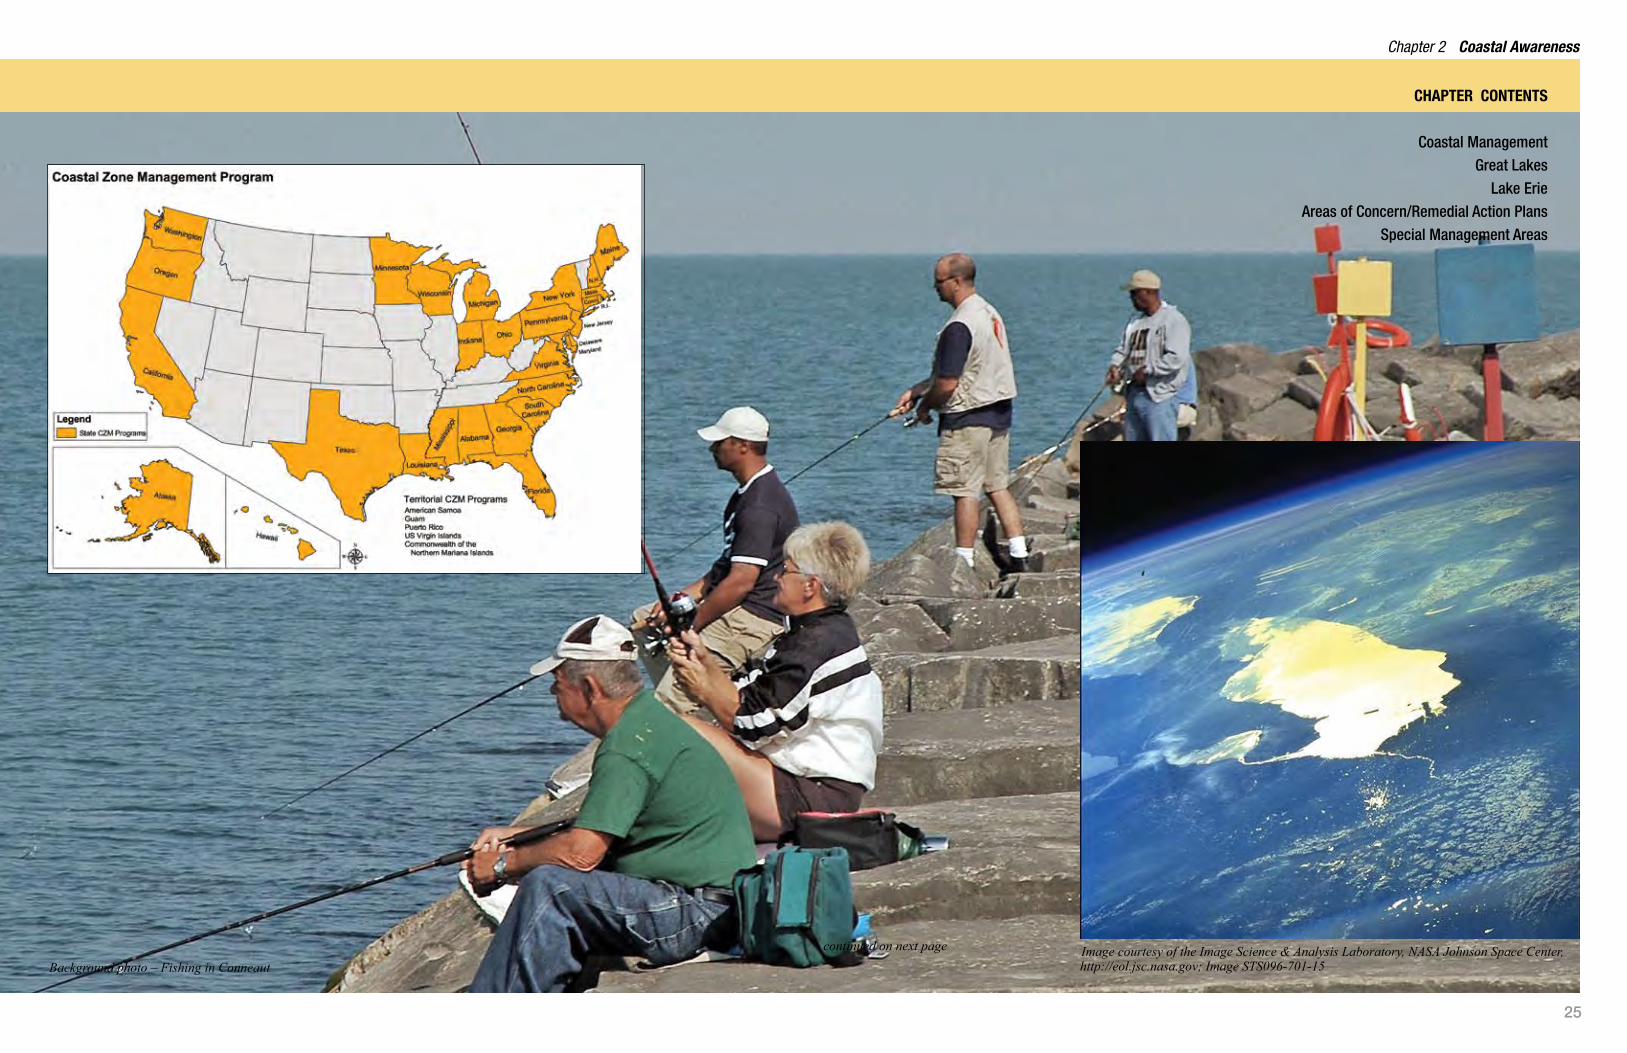
Table of ContentsChapter 2 Coastal Awareness
involvement, the CZMA makes fed-eral financial assistance available to coastal states and territories. Seven of the eight Great Lakes states have developed and are implementing a comprehensive coastal management program.
Who administers the federal CZMA?
The Secretary of Commerce del-egated the administration of the CZMA to the National Oceanic and Atmospheric Administration (NOAA). NOAA’s National Ocean Service (NOS) Office of Ocean and Coastal Resource Management (OCRM) Coastal Programs Division
(CPD) oversees individual state Coastal Zone Management Programs (CZMP).
What is Federal Consistency under the CZMA?
The CZMA requires that federal agency activities which have reason-ably foreseeable effects on any land or water use or natural resource of the state’s designated coastal area must be consistent to the maximum extent practicable with the enforceable poli-cies of the state’s federally approved Coastal Management Program. (Federal agency activities are activi-ties and development projects per-
formed by a federal agency or by a contrac-tor for the benefit of a federal agency.)
Federal license and permit activities and federal financial assistance activities that have reasonably foreseeable coastal effects must also be fully consistent with the enforceable poli-cies of state coastal management programs. (Federal license and permit activities are activities requiring federal authorization which are proposed by a non-federal appli-cant. Federal financial
assistance activities are proposed by state agencies or local governments applying for federal funds for activi-ties with coastal effects.) Federal consistency reviews are performed by the lead state agency responsible for implementing or coordinating the state’s federally approved coastal management program.
CoAstAl MAnAgeMent In ohIo Why is coastal management needed in ohio?
Lake Erie has influenced the growth of Ohio through productive agricul-tural lands, industries, international
harbors and as a recreational desti-nation. However, human pressures have left their mark on the Lake Erie environment.
Much has changed since American colonists found seas of grassy savannahs supporting wild oats 10-feet high and lake waters brimming with sturgeon and white-fish. Millions of acres of woodlands have been cleared, savannahs burned and wetlands tiled and drained.
Prior to the passage of the Clean Water Act, Lake Erie was the recipi-ent of pollutants from raw sewage, chemical works, oil wells, mines, lumber yards and tanneries. Of the 300,000 acres of wetlands that once stretched from Sandusky to Toledo, only an estimated 30,000 acres remain (see Chapter 7: Habitat). Much of the destruction of these wetlands is attributed to drainage practices associated with agricul-ture, filling and dredging, and urban development.
Development has left 85 percent of the Lake Erie shore armored in an unnatural state. Shore erosion has dramatically shrunk the once expansive beaches lining the coast that were used as a means to tra-verse northern Ohio (see Chapter 11: Engineering, Sand Resources, Nearshore Substrates). Additionally, invasive species have played a role in forever changing Lake Erie’s water and coast (see Chapter 6: Lake Science). Because of the significant alteration to
ChApter Contents
Coastal Management Great Lakes
Lake ErieAreas of Concern/Remedial Action Plans
Special Management Areas
Background photo – Fishing in ConneautImage courtesy of the Image Science & Analysis Laboratory, NASA Johnson Space Center, http://eol.jsc.nasa.gov; Image STS096-701-15
�5
continued on next page

Coastal Management
the coast, it is now necessary to better manage the lake’s resources and activi-ties along the coast in an effort to pro-tect, restore and enhance what remains. Coastal management seeks to bal-ance the forces competing for limited resources and find solutions to problems affecting the Lake Erie coastal region. This is accomplished in part by examin-ing the big picture of Ohio’s entire coast and helping communities and residents undertake individual improvements that contribute to the economic welfare of the coast while preserving and enhancing coastal resources.
When was the ohio Coastal Management program developed? Practices of coastal management have existed in Ohio since the United States and Canada joined to sign the Boundary Waters Treaty of 1909. The treaty recog-nized that degradation of the Great Lakes by any state, province or nation could have widespread effects upon the lakes and coastal residents. The International Joint Commission (IJC) is an indepen-dent bi-national organization established by the Boundary Waters Treaty. Today the IJC continues to help prevent and
resolve disputes relating to the use and quality of Great Lakes’ boundary waters. Within Ohio law, the 1917 passage of the Fleming Act marked the first time coastal policies regarding the Lake Erie Public Trust were written in the books.
After passage of the federal Coastal Zone Management Act and the Clean Water Act, in 1972, Ohio Governor James Rhodes placed the responsibil-ity for developing a coastal manage-ment program with ODNR. Grants from the federal Office of Ocean and Coastal Resource Management helped ODNR accomplish this task. During
the program’s development process, ODNR listened intently to the concerns and suggestions of thousands of Ohio residents and professional experts, inte-grating their comments into the plan. In 1988, the Coastal Management Law was unanimously approved by Ohio’s legis-lature. The Ohio Coastal Management Program was given federal approval by the Department of Commerce’s National Oceanic and Atmospheric Administration in 1997.
What is included in the ohio Coastal Management program? The Ohio Coastal Management Program defines the Ohio Coastal Management Area; describes state and federal coastal legislation and management polices for Lake Erie; links state programs, regula-tions and laws from various state agen-cies in a coastal network; and organizes state laws and regulations into nine issue areas including: 1. Coastal Erosion and Flooding, 2. Water Quality,
Office of Coastal Management, Sandusky
Lakeshore Park, Conneaut
East Harbor State Park, Ottawa County
Point Park, Ashtabula
�6
Map 6 GIS data citation in Appendices

Table of ContentsChapter 2 Coastal Awareness
3. Wetlands and other Ecologically Sensitive Resources, 4. Ports and Shoreline Development,5. Recreation and Cultural Resources, 6. Fish and Wildlife Management, 7. Environmental Quality, 8. Energy and Mineral Resources, and 9. Water Quantity.
What is the ohio Coastal Management Area? Ohio’s designated Coastal Management
Area is defined in Ohio Revised Code Chapter 1506.01 as the waters of Lake Erie, the islands in the lake, the lands under and adjacent to the lake, including transitional areas, wetlands and beaches and extending in Lake Erie to the inter-national boundary line and extending landward only to the extent necessary to include shorelands, the use of which have a direct and significant impact on coastal waters as determined by the director of natural resources.
What is the importance of ohio’s Coastal Management Area? The Coastal Management Area is impor-tant for a variety of reasons including being eligible for sources of federal Coastal Management funding. The coastal management area is also subject to coastal management program poli-cies and to federal and state consistency requirements. Coastal Management Assistance Grant projects must be located entirely within the Coastal
Management Area or must demonstrate that the project will have direct substan-tial benefits to lands within the Area. All Coastal Management Assistance Grants for construction and acquisition projects must be within the Coastal Management Area boundary.
When/Why was the office of Coastal Management created? Since the approval of the Ohio Coastal Management Program, ODNR has con-tinued to listen to concerns of coastal residents and decision makers and, when possible, adjust the Coastal Management Program and its administration to better serve Ohioans and protect Lake Erie. One important step was creating the Office of Coastal Management in July 2002. The coastal office, the only ODNR division or office to be headquartered outside of Columbus, was located in Sandusky to be able to better serve con-stituents and care for coastal resources.
What does the office of Coastal Management do? The Office of Coastal Management is responsible for administering the Ohio Coastal Management Program, perform-ing federal consistency reviews, admin-istering Ohio law and administrative code regarding coastal management, and executing numerous initiatives targeted toward improving the region. Prior to the formation of the Office of Coastal Management, various divisions within ODNR shared these responsibilities. The Office of Coastal Management also annually administers grants from the fed-eral government to assist state and local agencies, communities and nonprofits with improving the Lake Erie Coastal Region.
For more information/Sources:
ODNR Office of Coastal Management 105 W. Shoreline Drive Sandusky OH 44870 Tel: 888-64-om/coastal
U.S. Department of Commerce Web: commerce.gov
National Oceanic and Atmospheric Administration (NOAA) Web: noaa.gov
NOAA National Ocean Service (NOS) Web: oceanservice.noaa.gov
NOAA NOS Office of Ocean and Coastal Resource Management (OCRM) N/ORM 10th floor SSMC4 1305 East-West Highway Silver Spring MD 20910 Web: coastalmanagement.noaa.gov
NOAA NOS OCRM Coastal Programs Division Web: coastalmanagement.noaa.gov/cpd
NOAA Coastal Zone Management Program Web: coastalmanagement.noaa.gov/czm
Department of Energy, Environmental Policy and Guidance Web: homer.ornl.gov/oepa
Coastal Zone Management Act Of 1972 as amended through P.L. 104-150, The Coastal Zone Protection Act of 1996 § 1451 to § 1465.
Population Trends Along the Coastal United States (1990-2008), NOAA NOS Management and Budget Office, Special Projects 2004 Web: oceanservice.noaa.gov/programs/mb/supp_cstl_population.html
Coastal Management
Office of Coastal Management
MISSIONAchieve a balance between use and preservation of Lake Erie’s coastal resources in collaboration with our partners, by effectively administering the Ohio Coastal Management Program.
VISION: Working with our public and private partners, we will attain a healthy Lake Erie region with vital ecosystems and prosperous coastal communities.
How far is 312 miles?The approximate straight-line distance between the easternmost point of the Ohio-Michigan boundary and the northernmost point of the Ohio-Pennsylvania boundary is 152 miles. However the actual ‘line’ connecting the two points, Ohio’s Lake Erie coast, is anything but straight. Ohio’s coast, including islands, bays, peninsulas and other diverse features, is 312-miles* long. This distance, if stretched into a straight line, would link Cleveland with locations as far away as Washington, DC, Chicago, Syracuse, New York, Louisville, Kentucky, Roanoke, Virginia and Traverse City, Michigan. If extended from Toledo, the 312-mile straight line would reach Green Bay or Madison, Wisconsin.
*Ohio’s 312-mile coast was derived by NOAA under a study performed in 1975 and under previous studies by the U.S. Department of Commerce in 1953 and 1970.
�7
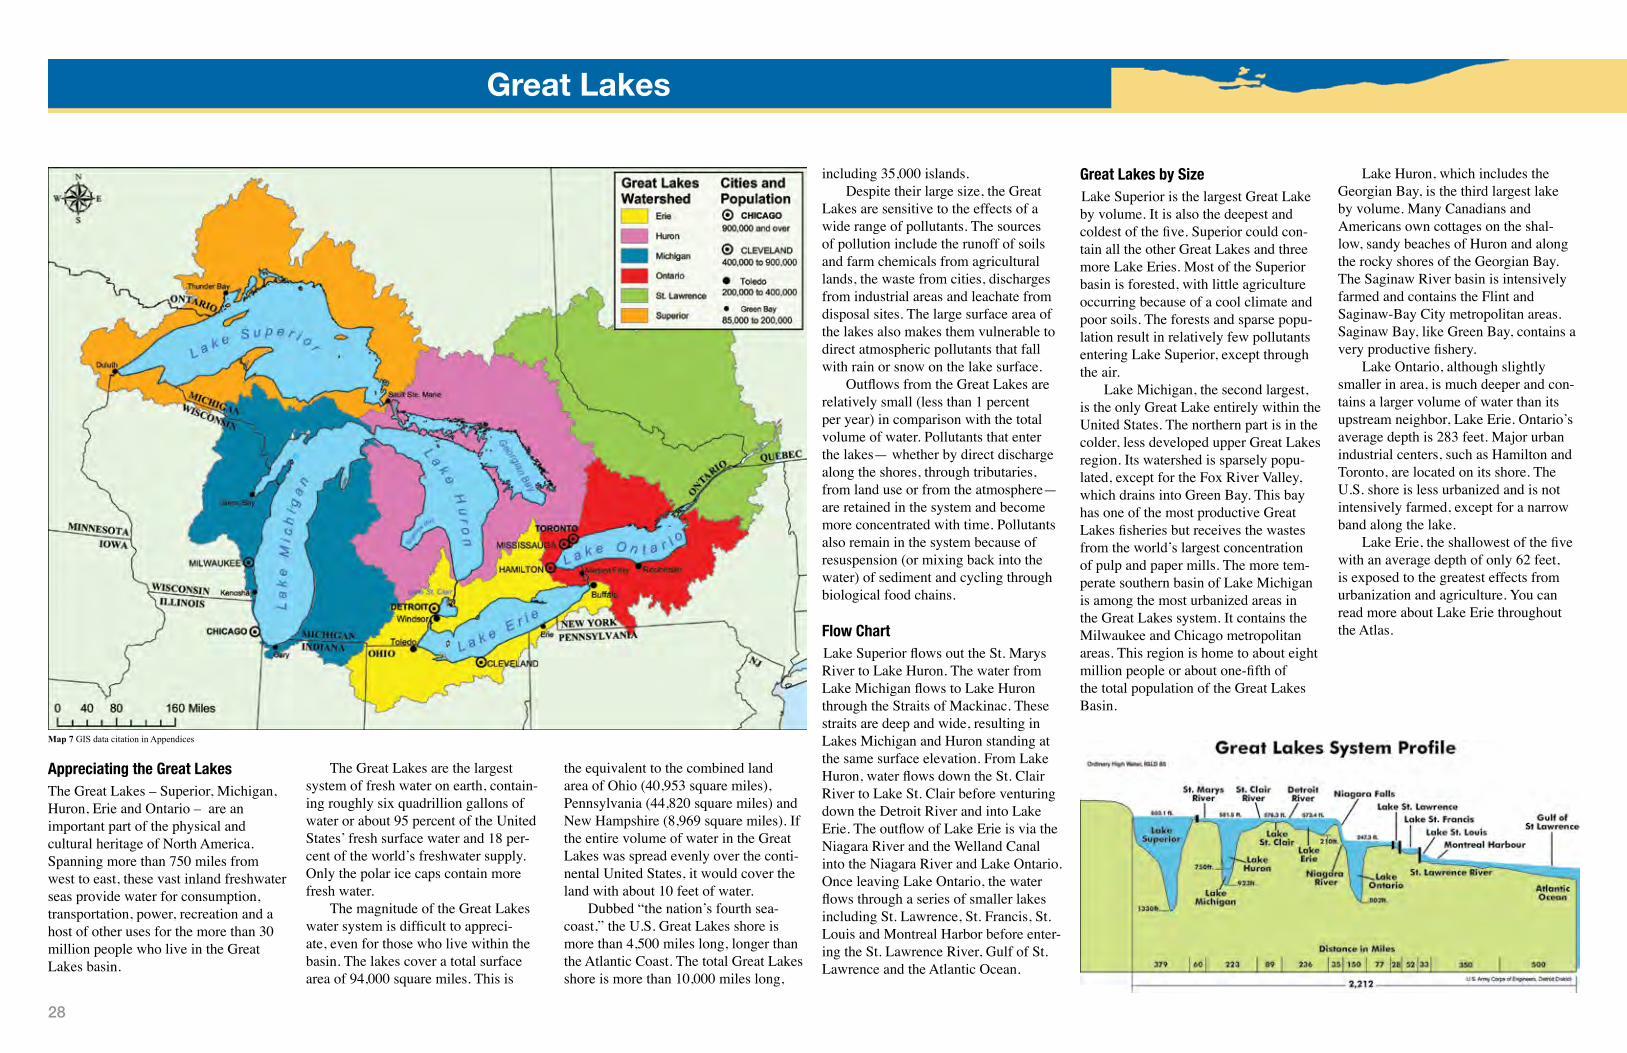
Appreciating the great lakesThe Great Lakes – Superior, Michigan, Huron, Erie and Ontario – are an important part of the physical and cultural heritage of North America. Spanning more than 750 miles from west to east, these vast inland freshwater seas provide water for consumption, transportation, power, recreation and a host of other uses for the more than 30 million people who live in the Great Lakes basin.
The Great Lakes are the largest system of fresh water on earth, contain-ing roughly six quadrillion gallons of water or about 95 percent of the United States’ fresh surface water and 18 per-cent of the world’s freshwater supply. Only the polar ice caps contain more fresh water.
The magnitude of the Great Lakes water system is difficult to appreci-ate, even for those who live within the basin. The lakes cover a total surface area of 94,000 square miles. This is
the equivalent to the combined land area of Ohio (40,953 square miles), Pennsylvania (44,820 square miles) and New Hampshire (8,969 square miles). If the entire volume of water in the Great Lakes was spread evenly over the conti-nental United States, it would cover the land with about 10 feet of water.
Dubbed “the nation’s fourth sea-coast,” the U.S. Great Lakes shore is more than 4,500 miles long, longer than the Atlantic Coast. The total Great Lakes shore is more than 10,000 miles long,
including 35,000 islands.Despite their large size, the Great
Lakes are sensitive to the effects of a wide range of pollutants. The sources of pollution include the runoff of soils and farm chemicals from agricultural lands, the waste from cities, discharges from industrial areas and leachate from disposal sites. The large surface area of the lakes also makes them vulnerable to direct atmospheric pollutants that fall with rain or snow on the lake surface.
Outflows from the Great Lakes are relatively small (less than 1 percent per year) in comparison with the total volume of water. Pollutants that enter the lakes— whether by direct discharge along the shores, through tributaries, from land use or from the atmosphere— are retained in the system and become more concentrated with time. Pollutants also remain in the system because of resuspension (or mixing back into the water) of sediment and cycling through biological food chains.
Flow Chart Lake Superior flows out the St. Marys River to Lake Huron. The water from Lake Michigan flows to Lake Huron through the Straits of Mackinac. These straits are deep and wide, resulting in Lakes Michigan and Huron standing at the same surface elevation. From Lake Huron, water flows down the St. Clair River to Lake St. Clair before venturing down the Detroit River and into Lake Erie. The outflow of Lake Erie is via the Niagara River and the Welland Canal into the Niagara River and Lake Ontario. Once leaving Lake Ontario, the water flows through a series of smaller lakes including St. Lawrence, St. Francis, St. Louis and Montreal Harbor before enter-ing the St. Lawrence River, Gulf of St. Lawrence and the Atlantic Ocean.
great lakes by size Lake Superior is the largest Great Lake by volume. It is also the deepest and coldest of the five. Superior could con-tain all the other Great Lakes and three more Lake Eries. Most of the Superior basin is forested, with little agriculture occurring because of a cool climate and poor soils. The forests and sparse popu-lation result in relatively few pollutants entering Lake Superior, except through the air.
Lake Michigan, the second largest, is the only Great Lake entirely within the United States. The northern part is in the colder, less developed upper Great Lakes region. Its watershed is sparsely popu-lated, except for the Fox River Valley, which drains into Green Bay. This bay has one of the most productive Great Lakes fisheries but receives the wastes from the world’s largest concentration of pulp and paper mills. The more tem-perate southern basin of Lake Michigan is among the most urbanized areas in the Great Lakes system. It contains the Milwaukee and Chicago metropolitan areas. This region is home to about eight million people or about one-fifth of the total population of the Great Lakes Basin.
Lake Huron, which includes the Georgian Bay, is the third largest lake by volume. Many Canadians and Americans own cottages on the shal-low, sandy beaches of Huron and along the rocky shores of the Georgian Bay. The Saginaw River basin is intensively farmed and contains the Flint and Saginaw-Bay City metropolitan areas. Saginaw Bay, like Green Bay, contains a very productive fishery.
Lake Ontario, although slightly smaller in area, is much deeper and con-tains a larger volume of water than its upstream neighbor, Lake Erie. Ontario’s average depth is 283 feet. Major urban industrial centers, such as Hamilton and Toronto, are located on its shore. The U.S. shore is less urbanized and is not intensively farmed, except for a narrow band along the lake.
Lake Erie, the shallowest of the five with an average depth of only 62 feet, is exposed to the greatest effects from urbanization and agriculture. You can read more about Lake Erie throughout the Atlas.
Great Lakes
�8
Map 7 GIS data citation in Appendices

Table of ContentsChapter 2 Coastal Awareness
Great Lakes Facts
• The Great Lakes contain about six quadrillion gallons of water, approximately 95 percent of the United States’ total fresh water.
• The Great Lakes provide drinking water for more than 40 million people in the United States and
Canada. If distributed evenly, Great Lakes water could cover the entire contiguous United States in 10-feet of water.
• Lake Michigan is the only Great Lake entirely within the United States. Each of the four other lakes is shared with the Canadian province of Ontario.
• At 31,700 square miles, Lake Superior is the world’s largest freshwater lake by total surface area. It contains as much water as all the other Great Lakes combined plus three extra Lake Eries.
• From a hydrological standpoint, Lake Michigan and Lake Huron are essentially two giant lobes of one single lake. They are separated by the five-mile wide Strait of Mackinac and both have the same surface elevation of 581.5 feet IGLD85.
• Lake Huron boasts more than 30,000 islands, more than any other Great Lake. These include Manitoulin Island, Ontario, the largest freshwater island in the world.
• The oldest lighthouse on the American Great Lakes side sits at Fort Niagara, N.Y. along Lake Ontario. It was built in 1818. The oldest lighthouse in
continuous operation is the Marblehead Lighthouse on Lake Erie at Marblehead, Ohio. It has been in operation since 1822.
• Gordon Lightfoot’s 1976 song “Wreck of the Edmond Fitzgerald,” which reached number two on the Billboard charts, tells the story of the most famous Great Lake maritime disaster. The 729-foot long, 75-foot wide freighter and its crew left Superior, Wisconsin carrying 26,000 tons of iron ore pellets, bound for Detroit when they became victims of an immense storm on Nov.10, 1975, in Lake Superior.
• Middle Island, situated between Kelleys Island, Ohio, to the south and Pelee Island, Ontario, to the north in Lake Erie, marks the southernmost Canadian point.
Sources: www.yourexpedition.com/umbrella pages/pressroom/gl facts.shtmlwww.glerl.noaa.gov/pr/ourlakes/www.census.gov/main/www/cen2000.htmlwww12.statcan.ca/english/census01/home/index.cfm
Great Lakes
The shaded relief map illustrates the terrain of the Great Lakes region. (U.S. Geological Survey EROS Data Center)
The nighttime lights map of the Great Lakes region shows cities, towns, indus-trial sites and momentary events such as fires (if any) as seen from space. (U.S. Geological Survey, 1996-1997)
Great Lakes Water Surface Area vs. U.S. States Total (land and water) Surface Area
Lake Ontario: 7,340 sq. mi. ≈ Connecticut 48th (5,544 sq. mi.) and Rhode Island 50th (1,545 sq. mi.)
Lake Erie: 9,910 sq. mi. ≈ Vermont 45th (9,623 sq. mi.)
Lake Huron: 23,000 sq. mi. ≈ West Virginia 41st (24,230 sq. mi.)
Lake Michigan: 22,300 sq. mi. ≈ Massachusetts 44th (10,555 sq. mi.) and Maryland 42nd (12,407 sq. mi.)
Lake Superior: 31,700 sq. mi. ≈ South Carolina 40th (32,020 sq. mi.)
Nighttime Lights
Shaded Relief
�9

Cleveland West Pierhead Lighthouse, Cleveland
Maumee Bay State Park, Lucas County
Middle Bass Island, Ottawa County
Geneva State Park, Geneva-on-the-Lake
Lake Erie
Lake Erie Basics
Elevation: 573.4 feet IGLD 1985
Length: 241 miles
Breadth: 57 miles
Coast Length: 871 miles
Ohio’s Coast: 312 miles
Average Depth: 62 feet
Maximum Depth: 210 feet
Volume: 116 cubic miles
Water Area: 9,910 sq. mi.
Land Drainage Area: 30,140 sq. mi.
Retention Time: 2.6 years
Outlet: Niagara River & Welland Canal
30 Map 8 GIS data citation in Appendices

Table of ContentsChapter 2 Coastal Awareness
Lake Erie
Details of Lake Erie’s bathymetry are shown on this map. The bathymetry
map serves to extend the theme of surface topography into Lake Erie, which is the shallowest, southern-most, warmest, most biologically diverse and most productive of the five Great Lakes. Although smallest by volume, Erie is the fourth largest Great Lake in total surface area and is in the top 15 largest lakes in the world. Erie has the shortest retention time of the Great Lakes, with water moving through the lake in roughly 2.6 years. With an average depth of only 62 feet, the lake warms rapidly in the spring and summer and fre-quently freezes in winter.
The Western Basin, extending from Toledo to Huron, comprises about one-fifth of the lake and is very shallow with an average depth of 30 feet and a maximum depth of 62 feet. The Central Basin, extending from Huron to Erie, Pennsylvania, has an average depth of 60 feet. At the western end of the Central Basin, the Pelee-Lorain ridge separates the Sandusky Sub-basin from the rest of the Central Basin. The remainder of the lake comprises the Eastern Basin with an average depth of 80 feet and con-tains the deepest point of 212 feet off the tip of Long Point, Canada. Ohio’s portion of Lake Erie includes the shallower Western Basin and part of the deeper Central Basin.
Lake Erie was the first modern Great Lake to form after the retreat of the glaciers. Of the Great Lakes, Erie is exposed to the great-est effects from urbanization and agriculture. Because of the fertile soils surrounding the lake, the area
is intensively farmed. The lake receives runoff from the agricultural area of southwestern Ontario and parts of Ohio, Indiana and Michigan. Seventeen metropolitan areas with populations over 50,000 are located within the Lake Erie basin, making it the second most densely populated Great Lake behind shores of Lake Michigan in the Chicago area.
Lake Erie is a dynamic body of water noted for the ferocity of its storm waves and the havoc they wreak along the shore. Waves, cur-rents, shore erosion and flooding are all problems that must be dealt with in coastal areas.
Because Lake Erie is shallow, the effects of storm-driven waves are amplified. The axis of the lake runs from southwest to northeast, corresponding to the direction of prevailing winds. Strong winds can push water toward one end of Lake Erie (setup) and may create a dif-ference in elevation of more than 15 feet from Toledo to Buffalo. When the wind stops, the water will rebound (seiche effect) causing the water to move back and forth across the lake. Strong winds or northeast-ers can also be a problem, driving storm waves opposite their normal path.
Lake Erie is subject to annual, seasonal and periodic lake level fluctuations, elevations that have been recorded since the 1860s. Seasonal fluctuations are related to spring rains and water entering the basin raising lake levels and to evaporation from late summer until the lake freezes. During the early fall, evaporation can exceed more than one inch of water per week. Researchers estimate that one inch
of water on the lake is approxi-mately 23 billion gallons.
The annual average water level of Lake Erie from 1918-2002 was 571.33 feet IGLD85. However, Erie’s monthly average has topped the Ordinary High Water Mark ele-vation of 573.4 feet IGLD85 more than 40 times since the 1970s.
Annual water level fluctua-tions, like seasonal changes, relate to how much water is flowing into Lake Erie from both its watershed and from the upper Great Lakes and how much water is evaporating. It is estimated that 80 to 95 percent of the water in Erie comes from the upper Great Lakes. When the Great Lakes Basin has colder winters, the upper Great Lakes will freeze and not as much water will evaporate. Increased snowfall rates in the upper Great Lakes also result in more water flowing into Lake Erie from the Detroit River in the spring. Over periods of time, the annual water level fluctuations have their highs and lows, with low periods occur-ring during the 1930s, followed by higher water in the 1950s, lower water in the 1960s, and higher water followed by slightly lower levels in the ‘70s, ‘80s and ‘90s.
Lake Erie is unmatched as a rec-reational and sport-fishing location, with more fish caught each year in Lake Erie than the other four Great Lakes combined. Annually, numer-ous national fishing tournaments are held here. In fact, the Western Basin city of Port Clinton claims to be the walleye capital of the world and holds an annual New Year’s Eve party complete with a giant fiberglass walleye fish drop over the town’s square.
The special climate created by Lake Erie in nearshore areas makes the coast an ideal location for culti-vation of grapes and peaches. Many communities along the coast can trace their heritage to the cultivation of these and other crops. In the early days of the nation, during the 1700s and 1800s, Lake Erie was also a quick means of transportation for men engaged in the fur trade as well as settlers hoping to improve their fortunes in the Ohio Country. Erie’s importance grew during the 1810s and 1820s as Americans began to build canals. The completion of the Erie Canal, connecting the Hudson River in New York with Lake Erie, provided the first navigable water route from the Atlantic Ocean to the upper Midwest.
During the War of 1812, both the English and the American mili-taries hoped to gain exclusive con-trol over the lake to have an easier time sending troops and supplies in an invasion of the other’s territory. On September 10, 1813, the Battle of Lake Erie occurred just northwest of Put-in-Bay Harbor. An American fleet under the command of Oliver Hazard Perry defeated a British fleet, securing control of the water-way for the United States and help-ing the United States win the war.
Today 11.5 million people live in the entire Lake Erie watershed with the majority (10 million) living in the United States. In Ohio, 4.65 million people (41 percent of Ohio’s population) live in the state’s por-tion of the Lake Erie Watershed. Of those, 2.6 million people (23 per-cent) live in the coastal counties.
31Map 8 GIS data citation in Appendices

Areas of Concern and Remedial Action Plans
Areas of Concern and remedial Action plans
Ohio Coastal Management Program: “It is the policy of the State of Ohio to coordinate the development and implementation of Remedial Action Plans for Ohio’s four Lake Erie Basin Areas of Concern as identified in the International Joint Commission’s reports on Great Lakes water quality.”
Areas of Concern For decades, many of the same river seg-ments were repeatedly identified as the most contaminated tributaries around the Great Lakes. The adoption and imple-mentation of environmental laws and regulations significantly reduced the discharge of pollutants, but these areas continued to experience severe environ-mental degradation.
In 1974, the Water Quality Board of the International Joint Commission (IJC) began identifying problem areas along the Great Lakes in its reports on Great Lakes water quality. Then in 1985, the IJC Board designated specific loca-tions as Areas of Concern (AOCs) and recommended the development of com-prehensive remedial action plans (RAPs) to concentrate on the cleanup and resto-ration of beneficial uses to these areas. This request became a requirement of the Great Lakes Water Quality Agreement in 1987 and a statutory requirement under the Great Lakes Critical Act amendment 33 U.S. Code 1268 to the 1990 Clean Water Act.
Forty-three Areas of Concern were identified in the Great Lakes Basin: 26 located within the United States; 12 located in Canada; and five shared by both countries as illustrated on this map. Two Canadian locations in the Georgian Bay have been delisted.
Ashtabula port facilities, Ashtabula
Black River, Lorain
Maumee River, Toledo
Cuyahoga River, Cleveland
3�
Map 9 GIS data citation in Appendices

Table of ContentsChapter 2 Coastal Awareness
Areas of Concern and Remedial Action Plans
remedial Action plansRemedial Action Plans are in various stages of development and implementa-tion for each of these Areas of Concern to address impairments to any one of 14 beneficial uses. An impaired beneficial use means a change in the chemical, physical or biological integrity of the Great Lakes system sufficient to cause any of the following:
1. Restrictions on fish and wildlife consumption
2. Tainting of fish and wildlife flavor 3. Degradation of fish and wildlife
populations 4. Fish tumors or other deformities 5. Bird or animal deformities or
reproduction problems 6. Degradation of benthos 7. Restrictions on dredging activities 8. Eutrophication or undesirable algae 9. Restrictions on drinking water
consumption, or taste and odor problems
10. Beach closings 11. Degradation of aesthetics 12. Added costs to agriculture or
industry 13. Degradation of phytoplankton and
zooplankton populations 14. Loss of fish and wildlife habitat
The Ohio EPA is responsible for the preparation of Remedial Action Plans for Ohio’s four Areas of Concern. These areas include the lower Maumee, Black, Cuyahoga and Ashtabula rivers and harbors.
Remedial Action Plans are devel-oped and implemented through an eco-system based, multi-media approach for assessing and remediating impaired uses. The Remedial Action Plan process is a model of grassroots environmental democracy, stressing empowerment of the affected public within Areas of
Concern. In Ohio, significant local com-munity involvement is critical to the Remedial Action Plan process. The affected community, which is closest to and most directly affected by the resource, in concert with other stake-holders, is empowered to create a future vision for the Area of Concern.
Ohio’s Remedial Action Plan devel-opment and implementation teams include representatives from local, state and federal government agencies, elected officials, industry and business, nonprof-its, academia and the general public.
Remedial Action Plans are devel-oped in three stages: Stage I identifies and assesses use impairments, and iden-tifies the sources of the stresses from all media in the Area of Concern; Stage II identifies proposed remedial actions and their method of implementation; and Stage III documents evidence that uses have been restored. It is important to note that, in practice, these stages often overlap, and that the Remedial Action Plans often become iterative documents, representing the current state of knowl-edge, planning and remedial activity in the Area of Concern.
Ohio’s teams have all completed Stage I Remedial Action Plan reports and are now in various Stage II and III activi-ties. The U.S. Environmental Protection Agency hosts a website for each of the Areas of Concern in the United States with information on Remedial Action Plan progress. Links to the site for Ohio’s Areas of Concern are: Ashtabula River (Ashtabula County) – www.epa.gov/glnpo/aoc/ashtabula.html Black River (Lorain County) – www.epa.gov/glnpo/aoc/blackriver.html Cuyahoga River (Cuyahoga County) – www.epa.gov/glnpo/aoc/cuyahoga.html Maumee River (Lucas County) – www.epa.gov/glnpo/aoc/maumee.html
It is important to note that solu-tions for problems in Areas of Concern and other local, geographically focused efforts do not fall into the “one size fits all” category. Each of these areas will have a unique blend of circumstances and solutions based upon the complexi-ties of the issues that must be addressed. The success of the Remedial Action Plans will ultimately be measured by the degree to which all beneficial uses in the Area of Concern are restored and protected. Progress is celebrated with the completion of each of the individual implementation projects.
Sources:
U.S. EPA – www.epa.gov/glnpo/aoc/rap.html and www.epa.gov/glnpo/aoc/index.html Ohio Coastal Management Program DocumentInternational Joint Commission’s Special Status Report of Restoration Activities in Great Lakes Areas of Concern (2003) www.ijc.org
Ohio EPA’s Delisting Targets for Ohio’s Areas of Concern (2005) epa.state.oh.us/dsw/rap/DelistingTargetsOhioAOC_Final_June20-2005.pdf
Environment Canada www.on.ec gc.ca/water/raps/intro_e.html
the ohio Coastal Management program recognizes various coastal areas for the special conditions that exist in these natural resource sites. Some of these are site specific others are broad groups of coastal areas facing similar problems for which general use priorities can be devised.
The table on this page organizes the Special Management Areas recognized in Part II Chapter 6 of the Ohio Coastal Management Program document.
special Management Area (sMA) designation provides the basis for prioritizing local, state and federal government actions concerning the special needs of certain areas.
Areas of particular Concern (ApC) designations are areas for which the Ohio Coastal Management Program provides for the establishment of use priorities for a broad range of similar or generic areas. Specific sites may also be designated as APCs, but all initial Ohio Coastal Management Program designated areas are generic.
Area for preservation and restoration (Apr) designation is used for specific sites requiring aggressive management to preserve or restore their conservation, historical, recreational, ecological or aesthetic values. Federal funds available pursuant to the Coastal Zone Management Act may be used for construction, restoration or acquisition purposes for designated APRs.
Special Management Areas
Dupont Marsh State Nature Preserve, Erie County
33