chapter – vi factors influencing mutual funds investment...
TRANSCRIPT

167
CHAPTER – VI
FACTORS INFLUENCING MUTUAL FUNDS
INVESTMENT DECISION MAKING
One of the main objectives of the study is to identify factors
influencing mutual funds investment decision making and bring out profile of
the mutual funds investors
A decision to invest or not to invest in a particular mutual fund scheme
is not solely guided by consideration of maximisation of expected return. It is
an outcome of several factors like awareness of mutual funds, sources of
investment, investment time frame, sponsors of mutual funds and expected
rate of return. The investor services provided by the mutual funds may also
yield great influence on investment decision.
Hence in this chapter perception of mutual fund investors are collected
and analysed with statistical tools such as percentage and chi-square
technique. The null hypothesis is also framed and tested wherever required.

168
TABLE 6.1
AGE OF MUTUAL FUND INVESTORS
S.No Age No. of Respondents Percent
1.
2.
3.
4.
Below 25
25 - 40
40 - 55
55 and above
32
50
80
138
10.66
16.67
26.67
46.00
Total
300
100
Source : Primary Data
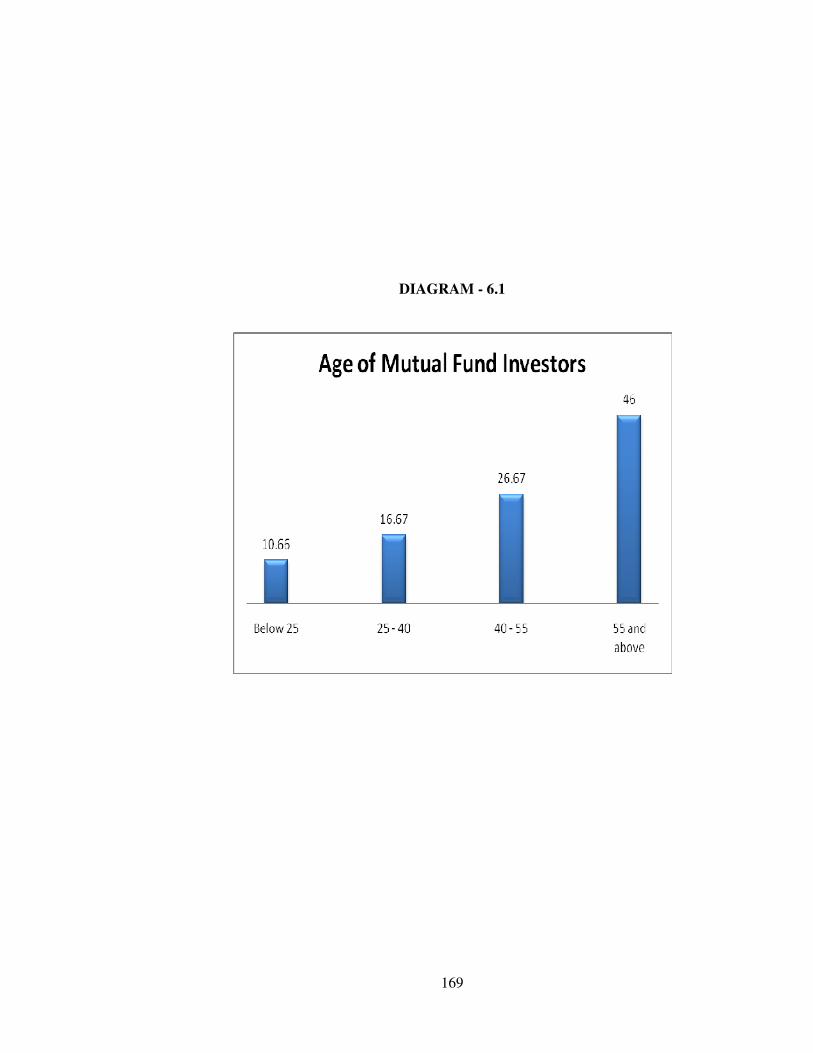
Age is an important factor while investing in different types of Mutual
Funds. Hence age of the respondent is collected and presented in this table. It
reveals that three fourth of total Mutual Fund investors of 72.67 percent
belong to above 40 years category and the remaining one fourth of the
investors i.e. 27.33 percent belong to below 40 years age category. Among
the investors 46.00 percent Mutual Fund investors belong to 55 and above
year’s category. Within this age group they have a lot of personal and family
commitment. Hence they tend to save in Mutual Funds which attract high
return with low risk category. This finding is supporting the previous studies
that aged customer prefer to avoid risk but expect high return by investing in
Mutual Funds. The Mutual Fund organisations consider the finding and target
the age group in future for promoting Mutual Funds. This should be
represented in the following chart.
169
DIAGRAM - 6.1

170
TABLE 6.2
GENDER STATUS OF MUTUAL FUND INVESTORS
S.No Gender No. of Respondents Percent
1.
2.
Male
Female
240
60
80
20
Total
300
100
Source: Primary Data
The gender status of Mutual funds investors was collected and
presented in the table. It is cleared from the table that the most of 80 percent
investors belong to male gender and only 20 percent of the total investor
belongs to female gender. The male gender is dominating than the female. The
Mutual Funds organizations take note of this and formulate Mutual Funds
accordingly.
DIAGRAM -6.2

171
TABLE 6.3
EDUCATIONAL QUALIFICATION OF THE RESPONDENTS
S.No Educational
Qualification No. of Respondents Percent
1.
2.
3.
4.
5.
Up to +2
Graduate
Post Graduate
Professional
Any Others
42
63
87
60
48
14
21
29
20
16
Total
300
100
Source : Primary Data
Educational qualification is important criteria in deciding Mutual
Funds investment. Hence the qualification of the respondents were collected
and presented in this table. The table exhibits that majority of the Mutual Fund
investors i.e 70 percent belong to higher qualified of which graduate 21
percent, post graduate 29 percent and professional 20 percent. Others belong
to 16 percent and up to plus two qualified people belong to 14 percent of total
respondents. Well qualified people prefer Mutual Funds than other qualified
people. It is evident from the table that graduates, post graduates and
professional qualified investors prefer Mutual Funds in larger proportion to
others. This finding is also supporting previous literature that qualification is
positively influencing the Mutual Fund investment. Mutual Fund
organizations take note of this and target the Mutual Funds to qualified
investors. It is shown in the following chart.

172
DIAGRAM -6.3
173
TABLE 6.4
OCCUPATION OF THE RESPONDENTS
S.No Occupation No. of Respondents Percent
1.
2.
3.
4.
5.
6.
Self employed
Govt. Service
Private Service
Business
Professional
Pensioners
38
70
56
36
60
40
12.67
23.33
18.67
12.00
20.00
13.33
Total
300
100
Source : Primary Data
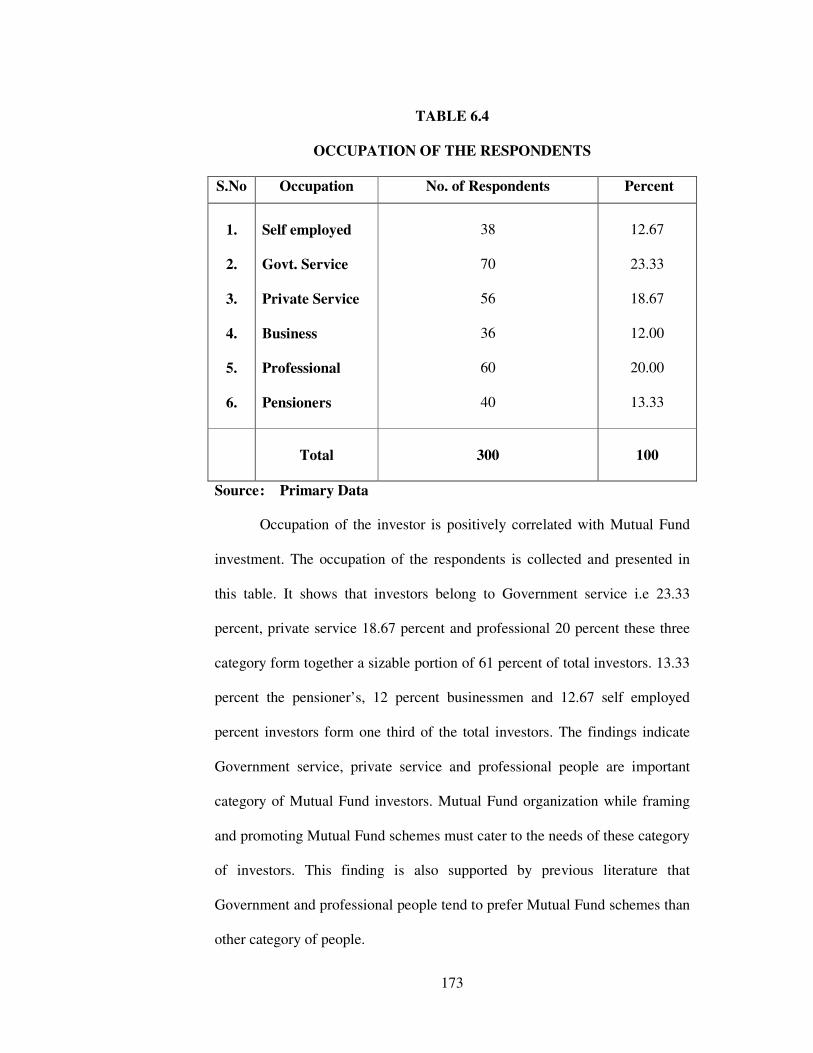
Occupation of the investor is positively correlated with Mutual Fund
investment. The occupation of the respondents is collected and presented in
this table. It shows that investors belong to Government service i.e 23.33
percent, private service 18.67 percent and professional 20 percent these three
category form together a sizable portion of 61 percent of total investors. 13.33
percent the pensioner’s, 12 percent businessmen and 12.67 self employed
percent investors form one third of the total investors. The findings indicate
Government service, private service and professional people are important
category of Mutual Fund investors. Mutual Fund organization while framing
and promoting Mutual Fund schemes must cater to the needs of these category
of investors. This finding is also supported by previous literature that
Government and professional people tend to prefer Mutual Fund schemes than
other category of people.
174
DIAGRAM - 6.4

175
TABLE 6.5
INCOME WISE DISTRIBUTION OF THE RESPONDENTS
S.No Annual Income No. of Respondents Percent
1.
2.
3.
4.
5.
Below Rs 200000
Rs.200000 - 400000
Rs. 400000 - 600000
Rs.600000 - 800000
Rs.800000 and above
32
70
94
56
48
10.67
23.33
31.33
18.67
16.00
Total
300
100
Source : Primary Data
Level of income of investors is significantly influencing in investment
of Mutual Funds. Accordingly income size of the respondents is collected and
presented in this table. The table explains that two third i.e. 66 percent of the
investors belong to above Rs.400000 income group and one third i.e. 33
percent of the investors belong to below Rs. 400000 income group. The
investors belong to Rs. 400000 to Rs.600000 income group accounted for
31.33 percent. Thus the Mutual Funds target these income level of investors
and promote the Mutual Funds aggressively than other income group of
investors. This finding is supported by previous literature. It shown in the
following diagram.

176
DIAGRAM 6.5

177
TABLE 6.6
INVESTMENTS PREFERENCE OF THE RESPONDENTS
S.No. Investment Avenues Ranking by Respondents
Total
Respondents
I II III IV V VI VII
1.
Bank Deposit
98
54
45
35
30
24
15
300
2.
Shares & Securities
50
43
70
35
64
28
10
300
3.
Mutual Funds
80
57
45
34
32
28
24
300
4.
Land & Buildings
92
40
63
47
25
21
12
300
5.
Gold, Silver etc
75
60
48
35
40
26
16
300
6.
Govt. Schemes
40
62
54
40
47
34
23
300
7.
Chit Funds / NB FC’s
35
54
50
44
32
50
35
300
Source : Primary Data
Investment preference of investors vary from person to person based
on their perception about risk and return benefits of particular investment. In
this study, the preference pattern of investors was collected, analysed and
presented in this table. The choice of 7 popular types of investment is taken
and investors are asked to rank from first to last in the order of their
preference. The preference of the investors is totaled and scored on the basis
of high score to low score. The ranking of preference of investment is
computed using Garret ranking technique.

178
TABLE 6.7
RANKING OF VARIOUS INVESTMENT AVENUES
Sl. No Investment Avenue Total
Score
Mean
Score
Garrett’s
Ranking
1.
2.
3.
4.
5.
6.
7.
Bank Deposit
Shares & Debentures
Mutual Funds
Land & Building
Gold, Silver etc
Govt. Schemes
Chit Funds / NBFC’s
17983
14720
17151
17831
17103
16007
15240
59.94
49
57.17
59.43
57
53.36
50.8
I
VII
III
II
IV
V
VI
Source : Primary Data
The Garret ranking result shows that bank deposit is preferred by all
investors as rank I (mean score 59.94) followed by land and Building Rank II
(59.43), Mutual Funds rank III (57.17), Gold, Silver Rank IV (57.00),
Government scheme Rank V (53.36) chit funds and shares, debentures are
ranked VI and VII. Most of the investors preferred Mutual Funds ranked third
in order of preference, as it gives higher return and guarded risk compared to
other type of investments. Mutual Fund organizations take note of this ranking
of investments and formulate Mutual Fund schemes according to needs and
wants of the investor.
179
TABLE 6.8
AGE OF THE RESPONDENTS AND THE MOST PREFERRED
INVESTMENT
Age
Group
Most Preferred Investment
Bank Deposit &
Govt Schemes
Shares, Debentures
& Chits
Mutual
Funds
Gold, Land
& Buildings
Total
Below 40
40 – 55
Above 55
22
29
56
26
10
12
19
22
29
15
19
41
82
80
138
Total 107 48 70 75 300
Source : Primary Data
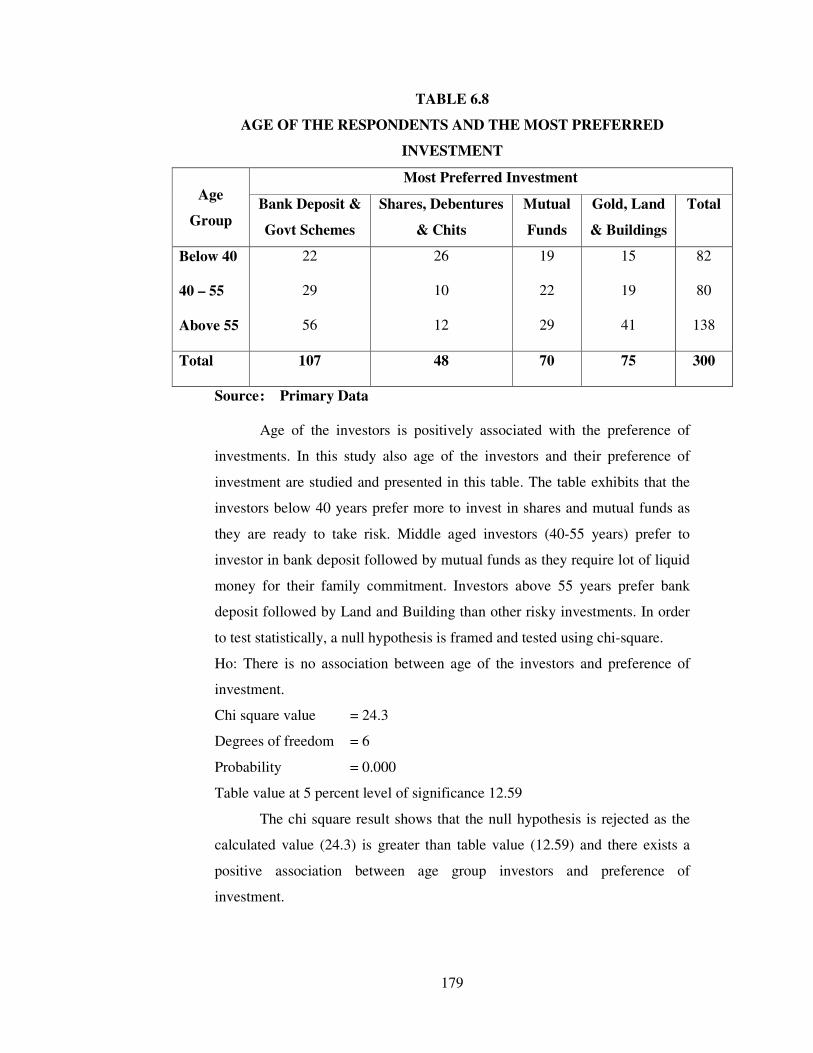
Age of the investors is positively associated with the preference of
investments. In this study also age of the investors and their preference of
investment are studied and presented in this table. The table exhibits that the
investors below 40 years prefer more to invest in shares and mutual funds as
they are ready to take risk. Middle aged investors (40-55 years) prefer to
investor in bank deposit followed by mutual funds as they require lot of liquid
money for their family commitment. Investors above 55 years prefer bank
deposit followed by Land and Building than other risky investments. In order
to test statistically, a null hypothesis is framed and tested using chi-square.
Ho: There is no association between age of the investors and preference of
investment.
Chi square value = 24.3
Degrees of freedom = 6
Probability = 0.000
Table value at 5 percent level of significance 12.59
The chi square result shows that the null hypothesis is rejected as the
calculated value (24.3) is greater than table value (12.59) and there exists a
positive association between age group investors and preference of
investment.
180
TABLE 6.9
EDUCATIONAL LEVEL OF RESPONDENTS AND THE MOST
PREFERRED INVESTMENT
Education &
Qualification
Most Preferred Investment
Bank Deposit
& Govt
Schemes
Shares,
Debentures
& Chits
Mutual
Funds
Gold,
Land &
Buildings
Total
Up to + 2
Graduate
Others
20
60
10
5
30
6
6
55
8
11
65
24
42
210
48
Total 90 41 69 100 300
Source: Primary Data
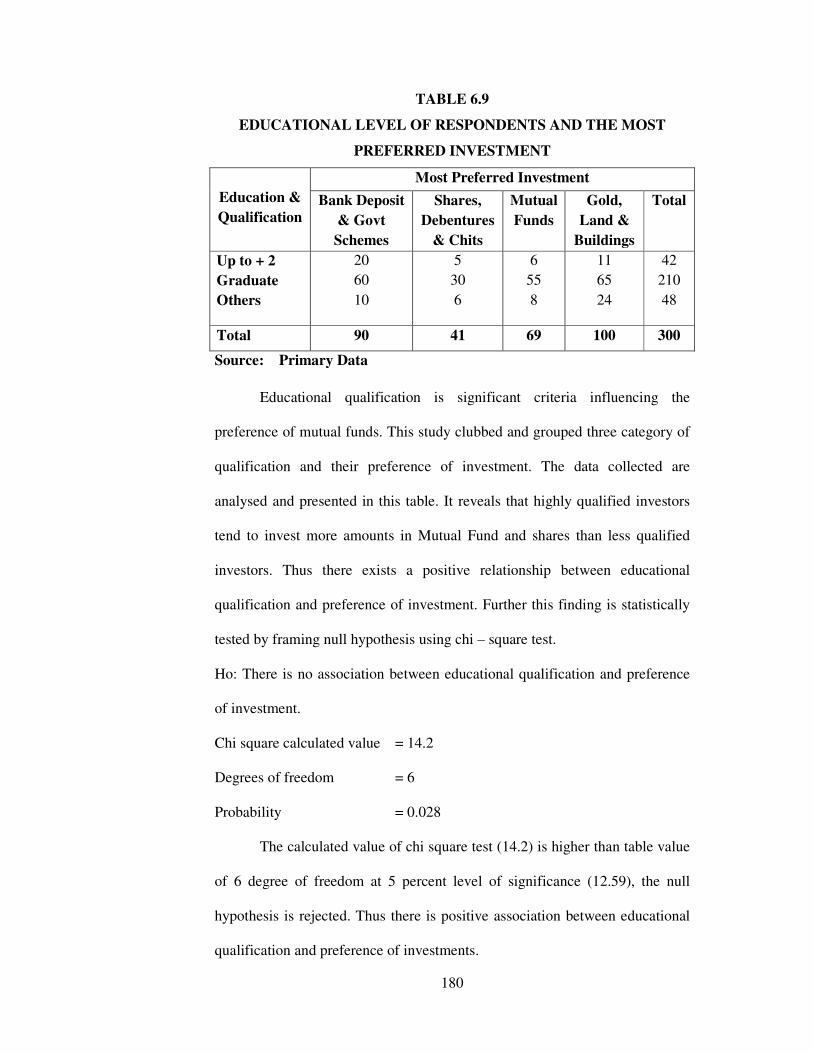
Educational qualification is significant criteria influencing the
preference of mutual funds. This study clubbed and grouped three category of
qualification and their preference of investment. The data collected are
analysed and presented in this table. It reveals that highly qualified investors
tend to invest more amounts in Mutual Fund and shares than less qualified
investors. Thus there exists a positive relationship between educational
qualification and preference of investment. Further this finding is statistically
tested by framing null hypothesis using chi – square test.
Ho: There is no association between educational qualification and preference
of investment.
Chi square calculated value = 14.2
Degrees of freedom = 6
Probability = 0.028
The calculated value of chi square test (14.2) is higher than table value
of 6 degree of freedom at 5 percent level of significance (12.59), the null
hypothesis is rejected. Thus there is positive association between educational
qualification and preference of investments.

181
TABLE 6.10
OCCUPATION OF THE RESPONDENTS AND THE MOST
PREFERRED INVESTMENTS
Occupation
Most Preferred Investment
Bank Deposit
& Govt
Schemes
Shares
& Chits
Mutual
Funds
Gold, Land
&
Buildings
Total
Govt. services &
Pensioners
Private services
& Self employed
Business &
Others
35
48
25
10
9
11
25
17
23
40
20
37
110
94
96
Total 108 30 65 97 300
Source : Primary Data
Occupational pattern of investors strongly related to preference of
investment. In this study the occupation of investors is studied, analysed with
preference of investment and presented in this table. It explains that majority
of the investors prefer bank deposit, Government schemes followed by Gold,
Land & Building. A sizable portion of Government serviced investors prefer
Mutual Funds and shares along with the other type of investment. Private and
business investors prefer bank deposit and Gold, Land and Building with
moderate interest on Mutual funds and shares.
The findings of the study are tested with statistics using chi-square by
framing null hypothesis.

182
Ho: There is no association between occupation and preference of investment.
Chi – square Result
Chi square calculated value 15.5
Degrees of freedom = 6
Probability = -0.017
Table value at 5 percent Level of significance 12.59
As calculated value of chi-square (15.5) is higher than table value
(12.59) at 5 percent level of significance for 6 degree of freedom the null
hypothesis is rejected and proved that there is a positive association between
occupation and preference of investment by investors.

183
TABLE 6.11
ANNUAL INCOME AND THE MOST PREFERRED INVESTMENTS
OF THE RESPONDENTS
Income
Most Preferred Investment
Bank Deposit
& Govt
Schemes
Shares
& Chits
Mutual
Funds
Gold, Land
& Buildings
Total
Below 4 Lakh
4 Lakh to 6 Lakh
Above 6 Lakh
20
24
41
15
14
17
21
21
22
46
35
24
102
94
104
Total 85 46 64 105 300
Source: Primary Data
Annual income of the investors is a valuable factor in preference of
investment. This table explains how the different income categories of
investors prefer the different type of investments. Majority of the investors
prefer Gold, Land and Building followed by bank deposit. Mutual Fund is
preferred by all categories of investors because of higher return and liquidity
to other investment. Further the finding is tested by statistically using chi-
square by framing the null hypothesis. There is no association between income
and preference of investment.
Calculated chi square value = 15.0
Degree of freedom = 6
Probability = 0.020
Table value at 5 percent Level of significance = 12.59
Ho: There is no association between annual income of the investors and
preference of investment.
As the calculated value of chi- square (15.0) is greater than table value
(12.59) at 5 percent level of significance for 6 degree of freedom, the null
hypothesis is rejected and proved that annual income of the investors
positively influence the preference of invest.

184
TABLE 6.12
SOURCES OF INVESTMENTS
SL.No. Sources No. of Respondents Percent
1.
2.
3.
4.
Savings from Income
Personal/Bank Loan
Sale of other assets
Gifts and Others
234
35
21
10
78
11.67
7
3.33
Total 300 100
Source: Primary Data
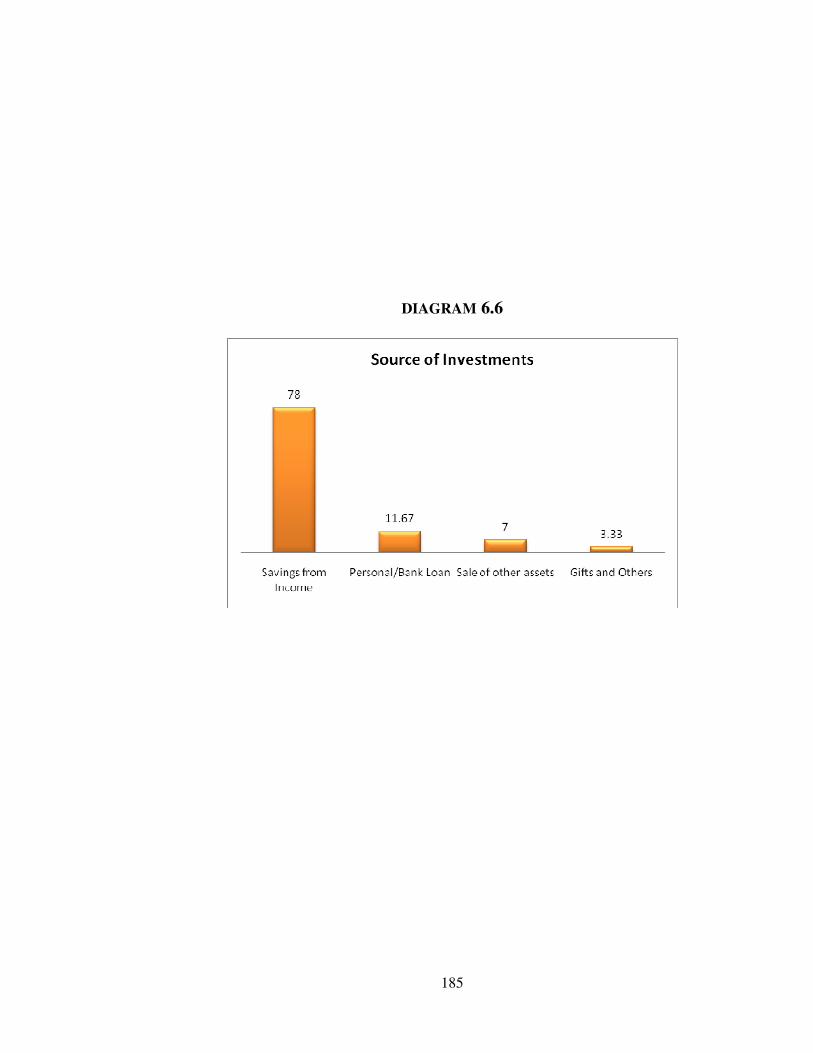
Investors are asked to indicate the different sources through which
investments are made. The different sources of investment are collected and
presented in this table. It shows that majority of the investors 78 percent made
investment through savings from income. Only 11.67 percent of the investors
borrow money for investment. Small number of investors sale their assets 7
percent to invest in different types of investment. Very few investors stated
they made investment through gifts from others (3.33)
185
DIAGRAM 6.6

186
TABLE 6.13
PREFERENCE PATTERN OF MUTUAL FUND INVESTORS
SL. NO. Mutual Funds No. of. Respondents Percent
1.
2.
3.
UTI
Other Public Sector
Private Sector
54
90
156
18
30
52
Total 300 100
Source : Primary Data
Investor’s preference pattern of mutual fund is collected and presented
in this table. It indicates that more than half of the total respondents 52 percent
prefer private sector Mutual Fund followed by other public sector 30 percent
and UTI 18 percent. The reason for the preference of private sector mutual
fund are the service provided by them at doorstep with quicker processing
time. Further these private sector mutual funds have collaboration with
reputed foreign fund manager with lot of experience in this field. It was shown
in the chart.

187
DIAGRAM 6.7

188
TABLE 6.14
CHOICE OF MUTUAL FUNDS BASED ON SAFETY BY
THE RESPONDENTS
SL. NO. Mutual Funds No. of. Respondents Percent
1.
2.
3.
UTI
Other Public Sector
Private Sector
94
146
60
31.33
48.67
20.00
Total 300 100
Source: Primary Data
Investors are asked to indicate the preference of Mutual fund sector
from safety point of view. Their views are collected and presented in this
table. It reveals that nearly half of the respondents 48.67 percent preferred
private sector Mutual Fund from safety point of view. Overall, 80 percent of
the investor preferred public sector & UTI Mutual fund from safety point of
view i.e. less risk.
DIAGRAM 6.8

189
TABLE 6.15
CHOICE OF MUTUAL FUNDS IN TERMS OF
LIQUIDITY BY THE RESPONDENTS
SL. NO. Mutual Funds No. of.
Respondents Percent
1.
2.
3.
UTI
Other Public Sector
Private Sector
40
70
190
13.33
23.33
63.34
Total 300 100
Source: Primary Data
Liquidity factor is an important criteria in deciding Mutual Funds
investment. Hence investors’ opinion about liquidity aspect of mutual fund
was collected and presented in this table. It exhibits that almost two third of
respondents i.e. 63.34 percent preferred private sector mutual funds as more
liquidity than others followed by public sector i.e. 23.33 percent and UTI
13.33 percent. The main reason is the private sector mutual funds have their
branches, collaborating branch in major cities and towns which promoted the
investors to convert their investment into cash within the short time. It was
shown in the diagram.

190
DIAGRAM -6.9

191
TABLE 6.16
CHOICE OF MUTUAL FUNDS IN TERMS OF PROFITABILITY
BY THE RESPONDENTS
SL. NO. Mutual Funds No. of.
Respondents Percent
1.
2.
3.
UTI
Other Public Sector
Private Sector
65
80
155
21.67
26.67
51.66
Total 300 100
Source: Primary Data
Profitability is the significant criteria in any investment. In Mutual
Funds also the perception of investors about profitability was collected and
presented in this table. It stated that majority of the investors i.e.51.66 percent
preferred private sector Mutual Funds than public sector Mutual Funds,
because these generate more income. The main reason is that the private sector
mutual funds invest minimum amount of corpus in Government securities and
major part invested in industries like IT, Infrastructure and debt oriented
sector. It was shown in the diagram.

192
DIAGRAM 6.10

193
TABLE 6.17
PREFERENCE OF SCHEME OF MUTUAL FUNDS
OF THE RESPONDENTS
SL. NO. Scheme of Mutual
Funds
No. of.
Respondents Percent
1.
2.
3.
Open Ended
Closed Ended
Interval
210
60
30
70
20
10
Total 300 100
Source : Primary Data
Respondents have been asked to indicate the preference of different
type of Mutual Funds schemes. This information were collected and presented
in this table. It explains that majority of the investor prefer open ended fund
i.e. 70 percent followed by closed ended fund 20 percent and interval fund 10
percent. The reason for preference of open ended fund is providing instant
liquidity to the Mutual Funds investors. It was shown in the chart.

194
DIAGRAM 6.11

195
TABLE 6.18
PREFERANCE OF THE TYPE OF MUTUAL FUNDS BY THE
RESPONDENTS
SL. NO. Type of Schemes No. of. Respondents Percent
1.
2.
3.
4.
5.
6.
Growth
Income
Balanced (I/G)
Tax Savings (ELSS)
Sector Specific Funds
Others
72
108
45
40
12
23
24
36
15
13.33
4
7.67
Total 300 100
Source: Primary Data
Investors give attention to preference of particular type of mutual
funds. The data was collected and analysed in this table. It shows that one
third of total Mutual Funds investors i.e. 36 percent prefer income scheme
followed by growth scheme 24 percent, balanced scheme 15 percent and tax
savings scheme 13.33 percent. Few investors prefer sector specific funds i.e. 4
percent and other funds 7.67 percent. From investor’s point of view income,
Growth, Balanced and Tax savings funds are more popular and preferable than
other type of funds schemes. It was shown in the diagram.

196
DIAGRAM 6.12
S

197
TABLE 6.19
CONVENIENT MODE OF BUYING MUTUAL FUNDS
OF THE RESPONDENTS
SL.
NO. Mode of Buying Mutual funds
No. of.
Respondents Percent
1.
2.
Initial public offer
Through stock market
195
105
65
35
Total 300 100
Source: Primary Data
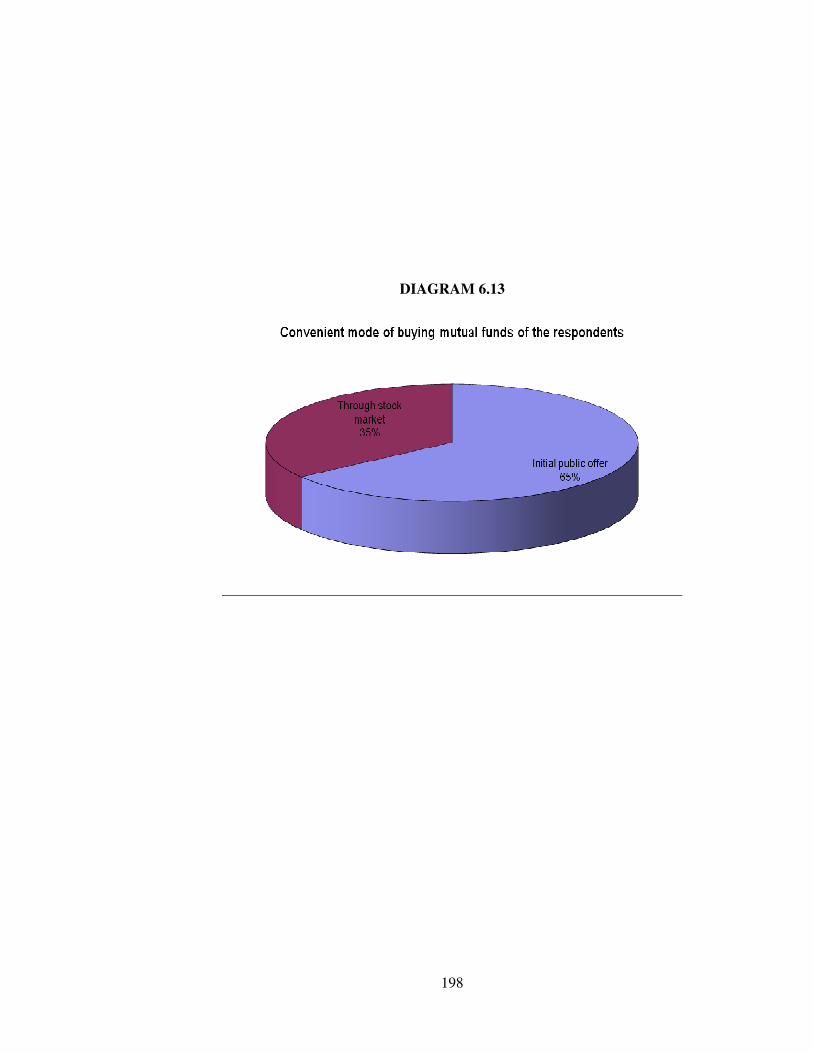
Mode of buying mutual fund is another important factor influencing
the mutual funds investors. These data were collected and presented in this
table. It reveals that majority of the investors i.e.65 percent buys Mutual Funds
through initial public offer than the stock market of 35 percent. Investors
prefer initial public offer because the fund value will be Rs. 10 per unit and
carry good appreciation. It was shown in the chart.
198
DIAGRAM 6.13

199
TABLE6.20
DESIRED LIQUIDITY ROUTE OF MUTUAL FUNDS OF THE
RESPONDENTS
SL. NO. Desired Liquidity Route No. of. Respondents Percent
1.
2.
3.
4.
5.
Listed in stock Exchanges
Buy back option
Switching over
Roll over option
Pledging
180
60
24
15
21
60
20
8
5
7
Total 300 100
Source : Primary Data
Investors are asked to specify the desired liquidity route through which
they convert their mutual fund into money. These data were gathered and
presented in the table. It explains that majority of them opted Mutual Funds
which listed in stock exchange i.e.60 percent followed by buy back option 20
percent. One fifth of total investors preferred the following routes such as
switching over 8 percent, rollover option 5 percent and pledging 7 percent.
Majority of the Mutual Fund investors preferred listing in stock exchanges
because these funds can be converted at any time whenever they require. It
was shown in the diagram.

200
DIAGRAM 6.14
201
TABLE 6.21
SOURCES OF INFORMATION OF MUTUAL FUNDS DEPENDED BY
THE RESPONDENTS
SL. NO. Sources of Information No. of.
Respondents Percent
1.
2.
3.
4.
5.
Stock Exchange Prices quoted
in Newspapers
Periodicals / Bulletins published
by Mutual Funds
Direct enquiry from the Mutual
Funds
Brokers and market
Intermediaries
Online (Internet)
130
40
24
70
36
43.33
13.34
8.00
23.33
12.00
Total 300 100
Source : Primary Data
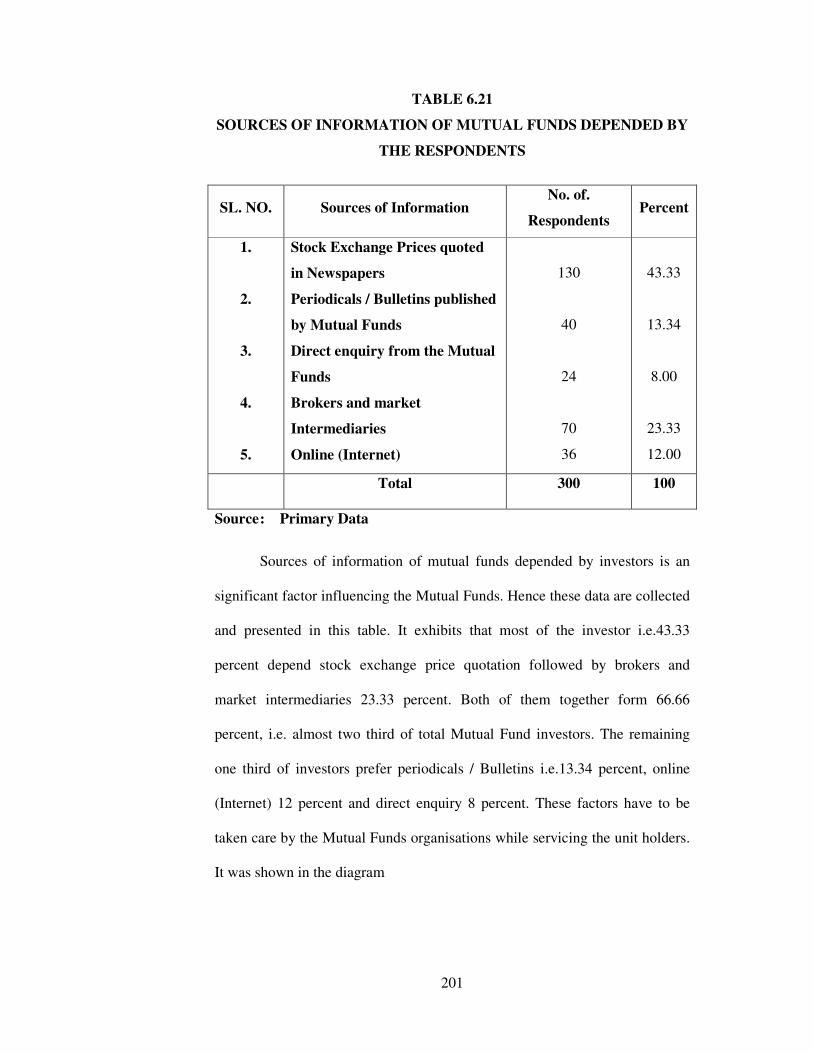
Sources of information of mutual funds depended by investors is an
significant factor influencing the Mutual Funds. Hence these data are collected
and presented in this table. It exhibits that most of the investor i.e.43.33
percent depend stock exchange price quotation followed by brokers and
market intermediaries 23.33 percent. Both of them together form 66.66
percent, i.e. almost two third of total Mutual Fund investors. The remaining
one third of investors prefer periodicals / Bulletins i.e.13.34 percent, online
(Internet) 12 percent and direct enquiry 8 percent. These factors have to be
taken care by the Mutual Funds organisations while servicing the unit holders.
It was shown in the diagram

202
DIAGRAM 6.15

203
TABLE 6.22
BASIS OF BUYING AND SELLING DECISION OF THE
RESPONDENTS
SL. NO. Basis of Decision No. of.
Respondents Percent
1.
2.
3.
4.
5.
Self assessment of the scheme
Information through Journals &
periodicals
Advice of Brokers
Past performance of Mutual Funds
Counseling with knowledgeable
friends in Stock market
24
40
94
114
28
8
13.33
31.33
38.00
9.34
Total 300 100
Source: Primary Data
Buying and selling decisions of investments are based on self
assessment or through others. In this study also the perception of investors
about buying and selling decisions and was collected and presented in this
table. It is cleared from the table that two third of investors buy and sell
Mutual Funds based on past performance results i.e.38 percent and advice of
brokers 31.33 percent. The remaining one third of total Mutual Fund investors
decide based on information through journals 13.33 percent, counseling with
friends 9.34 percent and self assessment 8 percent. It was shown in the chart.

204
DIAGRAM 6.16

205
TABLE 6.23
EXTENT OF INTEREST IN KNOWING NEW
MUTUAL FUNDS SCHEMES BY THE RESPONDENTS
SL. NO. Extent of Interest No. of.
Respondents Percent
1.
2.
3.
Very much
To some extent
Not at all
77
83
40
59
27.67
13.33
Total 300 100
Source: Primary Data
The extent of investor’s interest in knowing new Mutual Funds was
collected by the researcher and presented in this table. It shows that most of
the investors i.e.59 percent are very much interested in knowing new Mutual
Funds, and followed by to some extent 27.63 percent. Only 13.33 percent of
investors are not interested in knowing new Mutual Funds. It was shown in the
chart.
DIAGRAM 6.17

206
TABLE 6.24
MINIMUM PERIOD OF INVESTMET IN MUTUAL FUNDS
PERFERRED BY THE RESPONDENTS
SL.
NO. Minimum Period
No. of.
Respondents Percent
1.
2.
3.
4.
5.
Below 1 Year
1 Year – 2 Years
2 Years - 3 Years
3 Years – 4 Years
4 Years & Above
48
85
125
30
12
16.00
28.33
41.67
10.00
4.00
Total 300 100
Source: Primary Data
Holding period of Mutual Funds is an important factor in buying and
selling of Mutual Funds. The perception of investors about minimum holding
period is collected from Mutual Fund investors and presented in the table. It
clearly explains that most of the investors i.e.41.67 percent prefer to hold
Mutual Funds for 2 – 3 year’s period followed by 1 – 2 years 28.33 percent.
Both these groups prefer 1 – 3 years as holding period, that constitutes two
third of the total Mutual Fund investors. The remaining 14 percent of the
investors prefer above 3 years. It was shown in the chart.

207
DIAGRAM 6.18
208
TABLE 6.25
AMOUNT OF INVESTMENT PREFERRED BY THE RESPONDENTS
IN A SINGLE MUTUAL FUNDS SCHEMES
SL. NO. Amount of Investment No. of.
Respondents Percent
1.
2.
3.
4.
5.
Below Rs. 2000
Rs. 2000 – Rs. 4000
Rs.4000 – Rs.6000
Rs.6000 – Rs. 8000
Rs. 8000 and Above
30
40
110
70
50
10.00
13.33
36.67
23.33
16.67
Total 300 100
Source: Primary Data
Amount of investment made in a single Mutual Fund schemes by the
Mutual Fund investors was collected and presented in this table. It explains
that 60 percent of total investors invest below Rs. 6000 and 40 percent of the
investors invest above Rs. 6000 in a single scheme. Among the slab 36.67
percent of investors invest Rs. 4000 – 6000 and followed by Rs. 6000 – 8000.
The majority of investors save Rs. 4000 or more in a single Mutual Fund
schemes. It was shown in the chart.

209
DIAGRAM 6.19

210
TABLE 6.26
AMOUNT OF SAVINGS OF INVESTMENTS IN MUTUAL FUNDS
BY THE RESPONDENTS
Source: Primary Data
The savings pattern of investments in Mutual Funds by the Mutual
funds investors was shown in the above table. The data was collected and
analysed. It shows that the majority of the Mutual Funds investors invest there
savings of Rs. 5000 – Rs. 10000 i.e.40 percent in Mutual Funds followed by
Rs. 10000 – Rs. 15000 26.67 percent and above Rs. 15, 000 only 10 percent.
It is found that the majority of the Mutual Funds investors invested there
savings below Rs. 10,000. It was shown in the chart.
DIAGRAM 6.20
SL. NO. Amount of savings in
Mutual Funds No. of. Respondents Percent
1.
2.
3.
4.
5.
Below Rs. 5000
Rs.5000 – Rs. 10000
Rs.10000 – Rs. 15000
Rs.15000 – Rs. 20000
Rs. 20000 and above
46
120
80
33
21
15.33
40.00
26.67
11.00
7.00
Total 300 100

211
TABLE 6.27
PART OF THE YEAR PREFERRED BY MUTUAL FUNDS
INVESTORS
SL. NO. Part of the Year No. of.
Respondents Percent
1.
2.
3.
4.
January to March
April to June
July to September
October to December
125
30
45
100
41.67
10.00
15.00
33.33
Total 300 100
Source: Primary Data
The month and part of the year desired by Mutual Fund investors for
investing the money in Mutual Funds is collected and analysed in this table.
The table reveals that most of the investors i.e.41.67 percent preferred January
to March period followed by October to December period 33.33 percent. Both
these two period together form 75 percent of total Mutual Fund investors.
Only the remaining 25 percent of the investors prefer April to June and July to
September period. It was shown in the chart.

212
DIAGRAM 6.21

213
TABLE 6.28
PERCENTAGE OF INVESTMENT IN MUTUAL FUNDS
BY THE RESPONDENTS
SL. NO. Percentage of Investments No. of.
Respondents Percent
1.
2.
3.
4.
Up to 10 percent
10 percent – 20 percent
20 percent - 30 percent
30 percent and Above
60
110
90
40
20.00
36.67
30.00
13.33
Total 300 100
Source: Primary Data
Investors are asked to mention the percentage of their income in
investment of Mutual Funds and this information was collected and presented
in the table. It exhibits that two third of the investors stated they invest 10
percent to 20 percent of income i.e.36.67 percent and 20 percent to 30 percent
of income 30 percent in Mutual Funds. One third of the total investor only
stated they invest up to 10 percent of their income i.e.13.33 percent in Mutual
Funds. It is found that majority of the investors save up to 30 percent of their
income in Mutual Funds hoping that it deliver good return at reduced risk
level. It was shown in the chart.

214
DIAGRAM 6.22

215
TABLE 6.29
SATISFACTION OF CUSTOMER’S SERVICE PROVIDED
BY MUTUAL FUNDS
SL. NO. Satisfaction Level No. of.
Respondents Percent
1.
2.
3.
Highly Satisfied
Satisfied
Not Satisfied
75
165
60
25
55
20
Total 300 100
Source: Primary Data
Satisfaction of investor’s customer service is prime factors influencing
any type of investment. In this study also satisfaction level of Mutual Funds
investors was collected and presented in this table. It explains that most of the
investors i.e.80 percent stated either satisfied 55 percent or highly satisfied 25
percent with customers’ services provided by Mutual Fund organization. Only
one fifth of the investors are not satisfied with the customer services provided
by these organisations. It was shown in the diagram.

216
DIAGRAM 6.23

217
TABLE 6.30
WATCHING OF NAV OF MUTUAL FUNDS
BY THE RESPONDENTS
Yes / No No. of. Respondents Percent
Yes
No
220
80
73.33
26.67
Total 300 100
Source: Primary Data
Net Asset value (NAV) is the decisive factor to hold or sell the Mutual
Funds. Watching of these NAV is an important from Mutual Fund investor’s
point of view. Hence these data also collected and presented in the table. It is
clear from the table that most of the investors i.e.73.33 percent stated yes i.e.
they watch the NAV movement regularly and remaining 26.67 percent of the
investors stated they do not watch the NAV regularly. It was shown in the
chart.
DIAGRAM 6.24

218
TABLE 6.31
MODE OF WATCHING OF NAV BY THE RESPONDENTS
SL. NO. Mode No. of.
Respondents Percent
1.
2.
3.
4.
News paper
Periodicals
TV
Online / Email / Mobile
70
30
20
100
31.82
13.64
9.10
45.44
Total 220 100
Source: Primary Data
Mutual Funds investors are further asked to specify what mode through
which NAV of Mutual Funds is watched. These data are collected and
presented in the table. It shows that many of the investors track NAV of
Mutual Fund through online / E Mail / Mobile i.e.45.44 percent followed by
news paper 31.82 percent remaining investors watch NAV either through
periodicals 13.64 percent or through TV 9.10 percent. It is found that online
and News papers are popular media through which NAV of Mutual Fund is
watched by investors.
DIAGRAM 6.25
219
TABLE 6.32
AWARENESS OF MUTUAL FUNDS REGULATION BY SEBI
SL. NO. Awareness Level No. of.
Respondents Percent
1.
2.
3.
Awareness
Less Awareness
No Awareness
175
95
30
58.33
31.67
10.00
Total 300 100
Source: Primary Data
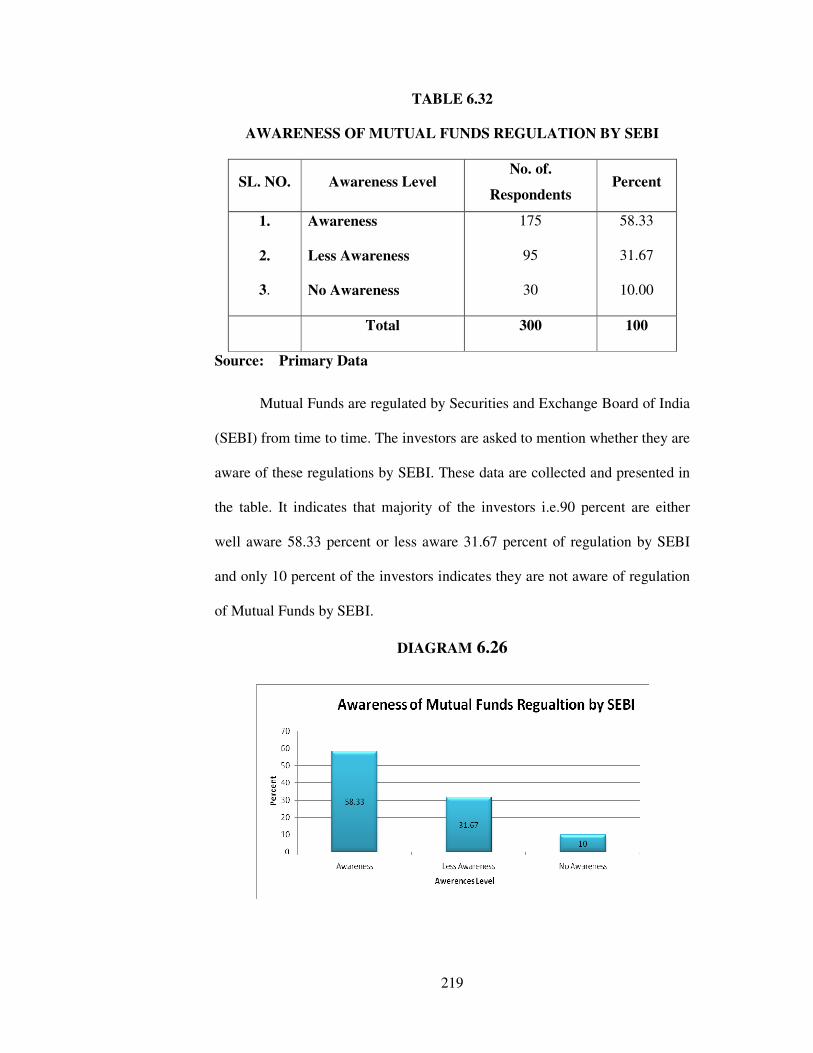
Mutual Funds are regulated by Securities and Exchange Board of India
(SEBI) from time to time. The investors are asked to mention whether they are
aware of these regulations by SEBI. These data are collected and presented in
the table. It indicates that majority of the investors i.e.90 percent are either
well aware 58.33 percent or less aware 31.67 percent of regulation by SEBI
and only 10 percent of the investors indicates they are not aware of regulation
of Mutual Funds by SEBI.
DIAGRAM 6.26