chapter sixnrgalassi.org/eece490a/textbook ver 5/chapter6_product... · 2019-08-26 · product...
TRANSCRIPT

Product Specifications
91
C H A P T E R S I X
Courtesy of Specialized Bicycle Components
EXHIBIT 6-1One of Specialized’s existing mountain bikes with a suspension fork.
uLr04772_ch06_091-116.indd Page 91 3/28/11 9:04 PM F-501uLr04772_ch06_091-116.indd Page 91 3/28/11 9:04 PM F-501 208/MHBR233/uLr04772_disk1of1/0073404772/uLr04772_pagefiless208/MHBR233/uLr04772_disk1of1/0073404772/uLr04772_pagefiless

92 Chapter 6
Specialized Bicycle Components was interested in developing a new front suspension fork for the mountain bike market. Although the firm was already selling suspension forks on its bicycles (Exhibit 6-1), it was interested in exploring designs that would pro-vide higher value for the recreational cyclist.
The development team had spent a great deal of time identifying customer needs. In addition to logging many hours of riding on suspended bikes themselves, the members of the team had interviewed lead users at mountain bike races and recreational cyclists on local trails, and they also had spent time working with dealers in their stores. As a re-sult of this process they had assembled a list of customer needs. They now faced several challenges:
• How could the relatively subjective customer needs be translated into precise targets for the remaining development effort?
• How could the team and its senior management agree on what would constitute suc-cess or failure of the resulting product design?
• How could the team develop confidence that its intended product would garner a sub-stantial share of the suspension fork market?
• How could the team resolve the inevitable trade-offs among product characteristics like cost and weight?
This chapter presents a method for establishing product specifications. We assume that the customer needs are already documented as described in Chapter 5, Identifying Cus-tomer Needs. The method employs several simple information systems, all of which can be constructed using conventional spreadsheet software.
What Are Specifications?
Customer needs are generally expressed in the “language of the customer.” The primary customer needs for the suspension fork are listed in Exhibit 6-2. Customer needs such as “the suspension is easy to install” or “the suspension enables high-speed descents on bumpy trails” are typical in terms of the subjective quality of the expressions. However, while such expressions are helpful in developing a clear sense of the issues of interest to customers, they provide little specific guidance about how to design and engineer the product. They simply leave too much margin for subjective interpretation. For this reason, development teams usually establish a set of specifications, which spell out in precise, measurable detail what the product has to do. Product specifications do not tell the team how to address the customer needs, but they do represent an unambiguous agreement on what the team will attempt to achieve in order to satisfy the customer needs. For example, in contrast to the customer need that “the suspension is easy to install,” the corresponding specification might be that “the average time to assemble the fork to the frame is less than 75 seconds.”
We intend the term product specifications to mean the precise description of what the product has to do. Some firms use the terms “product requirements” or “engineering characteristics” in this way. Other firms use “specifications” or “technical specifications” to refer to key design variables of the product such as the oil viscosity or spring constant of the suspension system. These are just differences in terminology. For clarity, let us be
uLr04772_ch06_091-116.indd Page 92 3/28/11 9:04 PM F-501uLr04772_ch06_091-116.indd Page 92 3/28/11 9:04 PM F-501 208/MHBR233/uLr04772_disk1of1/0073404772/uLr04772_pagefiless208/MHBR233/uLr04772_disk1of1/0073404772/uLr04772_pagefiless

Product Specifications 93
precise about a few definitions. A specification (singular) consists of a metric and a value. For example, “average time to assemble” is a metric, while “less than 75 seconds” is the value of this metric. Note that the value may take on several forms, including a particular number, a range, or an inequality. Values are always labeled with the appropriate units (e.g., seconds, kilograms, joules). Together, the metric and value form a specification. The product specifications (plural) are simply the set of the individual specifications.
When Are Specifications Established?
In an ideal world, the team would establish the product specifications once early in the development process and then proceed to design and engineer the product to exactly meet those specifications. For some products, such as soap or soup, this approach works quite well; the technologists on the team can reliably concoct a formulation that satis-fies almost any reasonable specifications. However, for technology-intensive products this is rarely possible. For such products, specifications are established at least twice. Immediately after identifying the customer needs, the team sets target specifications. These specifications represent the hopes and aspirations of the team, but they are estab-lished before the team knows what constraints the product technology will place on what
EXHIBIT 6-2Customer needs for the suspension fork and their relative importance (shown in a convenient spreadsheet format).
No. Need Imp.
1 The suspension reduces vibration to the hands. 3
2 The suspension allows easy traversal of slow, difficult terrain. 2
3 The suspension enables high-speed descents on bumpy trails. 5
4 The suspension allows sensitivity adjustment. 3
5 The suspension preserves the steering characteristics of the bike. 4
6 The suspension remains rigid during hard cornering. 4
7 The suspension is lightweight. 4
8 The suspension provides stiff mounting points for the brakes. 2
9 The suspension fits a wide variety of bikes, wheels, and tires. 5
10 The suspension is easy to install. 1
11 The suspension works with fenders. 1
12 The suspension instills pride. 5
13 The suspension is affordable for an amateur enthusiast. 5
14 The suspension is not contaminated by water. 5
15 The suspension is not contaminated by grunge. 5
16 The suspension can be easily accessed for maintenance. 3
17 The suspension allows easy replacement of worn parts. 1
18 The suspension can be maintained with readily available tools. 3
19 The suspension lasts a long time. 5
20 The suspension is safe in a crash. 5
uLr04772_ch06_091-116.indd Page 93 3/28/11 9:04 PM F-501uLr04772_ch06_091-116.indd Page 93 3/28/11 9:04 PM F-501 208/MHBR233/uLr04772_disk1of1/0073404772/uLr04772_pagefiless208/MHBR233/uLr04772_disk1of1/0073404772/uLr04772_pagefiless

can be achieved. The team’s efforts may fail to meet some of these specifications and may exceed others, depending on the product concept the team eventually selects. For this reason, the target specifications must be refined after a product concept has been se-lected. The team revisits the specifications while assessing the actual technological con-straints and the expected production costs. To set the final specifications, the team must frequently make hard trade-offs among different desirable characteristics of the product. For simplicity, we present a two-stage process for establishing specifications, but we note that in some organizations specifications are revisited many times throughout the development process.
The two stages in which specifications are established are shown as part of the concept development process in Exhibit 6-3. Note that the final specifications are one of the key elements of the development plan, which is usually documented in the project’s contract book. The contract book (described in Chapter 18, Managing Projects) specifies what the team agrees to achieve, the project schedule, the required resources, and the economic implications for the business. The list of product specifications is also one of the key information systems used by the team throughout the development process.
This chapter presents two methods: the first is for establishing the target specifications and the second is for setting the final specifications after the product concept has been selected.
Establishing Target Specifications
As Exhibit 6-3 illustrates, the target specifications are established after the customer needs have been identified but before product concepts have been generated and the most promising one(s) selected. An arbitrary setting of the specifications may not be techni-cally feasible. For example, in designing a suspension fork, the team cannot assume in ad-vance that it will be able to achieve simultaneously a mass of 1 kilogram, a manufacturing cost of $30, and the best descent time on the test track, as these are three quite aggressive specifications. Actually meeting the specifications established at this point is contingent upon the details of the product concept the team eventually selects. For this reason, such preliminary specifications are labeled “target specifications.” They are the goals of the development team, describing a product that the team believes would succeed in the mar-ketplace. Later these specifications will be refined based on the limitations of the product concept actually selected.
94 Chapter 6
IdentifyCustomer
Needs
EstablishTarget
Specifications
GenerateProduct
Concepts
SelectProduct
Concept(s)
TestProduct
Concept(s)
SetFinal
Specifications
PlanDownstreamDevelopment
DevelopmentPlan
MissionStatement
Build and Test Models and Prototypes
Benchmark Competitive Products
Perform Economic Analysis
EXHIBIT 6-3 The concept development process. The target specifications are set early in the process, but setting the final specifications must wait until after the product concept has been selected.
uLr04772_ch06_091-116.indd Page 94 3/28/11 9:04 PM F-501uLr04772_ch06_091-116.indd Page 94 3/28/11 9:04 PM F-501 208/MHBR233/uLr04772_disk1of1/0073404772/uLr04772_pagefiless208/MHBR233/uLr04772_disk1of1/0073404772/uLr04772_pagefiless

The process of establishing the target specifications contains four steps:
1. Prepare the list of metrics.
2. Collect competitive benchmarking information.
3. Set ideal and marginally acceptable target values.
4. Reflect on the results and the process.
Step 1: Prepare the List of MetricsThe most useful metrics are those that reflect as directly as possible the degree to which the product satisfies the customer needs. The relationship between needs and metrics is central to the entire concept of specifications. The working assumption is that a translation from cus-tomer needs to a set of precise, measurable specifications is possible and that meeting specifi-cations will therefore lead to satisfaction of the associated customer needs.
A list of metrics is shown in Exhibit 6-4. A good way to generate the list of metrics is to contemplate each need in turn and to consider what precise, measurable characteristic of the product will reflect the degree to which the product satisfies that need. In the ideal case, there is one and only one metric for each need. In practice, this is frequently not possible.
For example, consider the need that the suspension be “easy to install.” The team may conclude that this need is largely captured by measuring the time required for assembly of the fork to the frame. However, note the possible subtleties in this translation. Is assembly time really identical to ease of installation? The installation could be extremely fast but require an awkward and painful set of finger actions, which ultimately may lead to worker injury or dealer frustration. Because of the imprecise nature of the translation process, those establishing the specifications should have been directly involved in identifying the customer needs. In this way the team can rely on its understanding of the meaning of each need statement derived from firsthand interactions with customers.
The need for the fork to reduce vibration to the user’s hands may be even more difficult to translate into a single metric, because there are many different conditions under which vibration can be transmitted, including small bumps on level roads and big bumps on rough trails. The team may conclude that several metrics are required to capture this need, including, for example, the metrics “attenuation from dropout to handlebar at 10 Hz” and “maximum value from the Monster.” (The “Monster” is a suspension test developed by Mountain Bike magazine.)
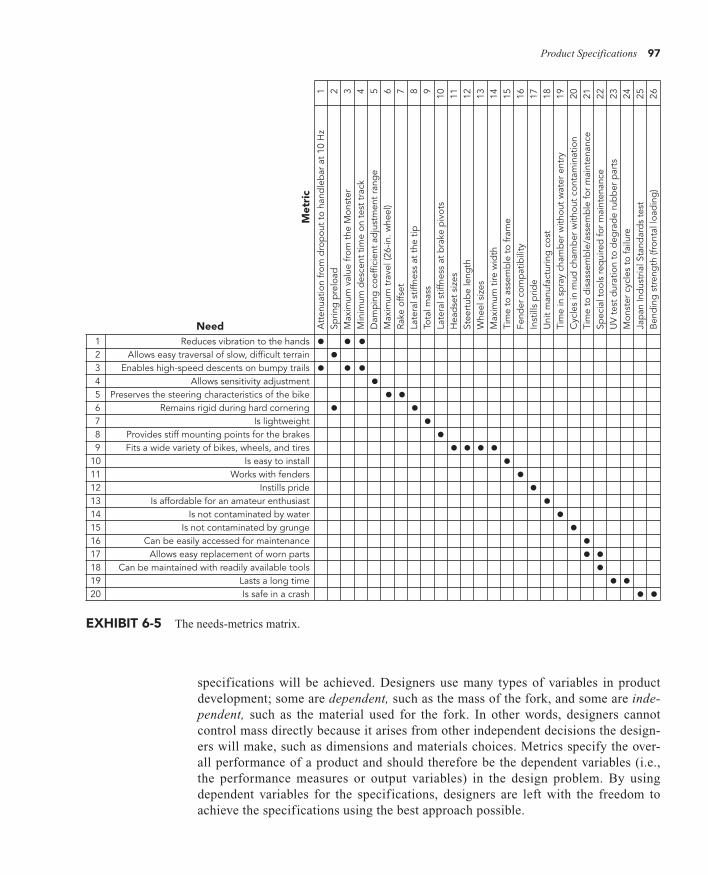
A simple needs-metrics matrix represents the relationship between needs and metrics. An example needs-metrics matrix is shown in Exhibit 6-5. The rows of the matrix cor-respond to the customer needs, and the columns of the matrix correspond to the metrics. A mark in a cell of the matrix means that the need and the metric associated with the cell are related; performance relative to the metric will influence the degree to which the product satisfies the customer need. This matrix is a key element of the House of Quality, a graphical technique used in Quality Function Deployment, or QFD (Hauser and Claus-ing, 1988). In many cases, we find the information in the needs-metrics matrix is just as easily communicated by listing the numbers of the needs related to each metric alongside the list of metrics (the second column in Exhibit 6-4). There are some cases, however, in which the mapping from needs to metrics is complex, and the matrix can be quite useful for representing this mapping.
Product Specifications 95
uLr04772_ch06_091-116.indd Page 95 3/28/11 9:04 PM F-501uLr04772_ch06_091-116.indd Page 95 3/28/11 9:04 PM F-501 208/MHBR233/uLr04772_disk1of1/0073404772/uLr04772_pagefiless208/MHBR233/uLr04772_disk1of1/0073404772/uLr04772_pagefiless

A few guidelines should be considered when constructing the list of metrics:
• Metrics should be complete. Ideally each customer need would correspond to a single metric, and the value of that metric would correlate perfectly with satisfaction of that need. In practice, several metrics may be necessary to completely reflect a single customer need.
• Metrics should be dependent, not independent, variables. This guideline is a variant of the what-not-how principle introduced in Chapter 5. As do customer needs, specif ications also indicate what the product must do, but not how the
96 Chapter 6
EXHIBIT 6-4 List of metrics for the suspension. The relative importance of each metric and the units for the metric are also shown. “Subj.” is an abbreviation indicating that a metric is subjective.
Metric No. Need Nos. Metric Imp. Units
1 1, 3 Attenuation from dropout to handlebar at 10 Hz 3 dB
2 2, 6 Spring preload 3 N
3 1, 3 Maximum value from the Monster 5 g
4 1, 3 Minimum descent time on test track 5 s
5 4 Damping coefficient adjustment range 3 N-s/m
6 5 Maximum travel (26-in. wheel) 3 mm
7 5 Rake offset 3 mm
8 6 Lateral stiffness at the tip 3 kN/m
9 7 Total mass 4 kg
10 8 Lateral stiffness at brake pivots 2 kN/m
11 9 Headset sizes 5 in.
12 9 Steertube length 5 mm
13 9 Wheel sizes 5 List
14 9 Maximum tire width 5 in.
15 10 Time to assemble to frame 1 s
16 11 Fender compatibility 1 List
17 12 Instills pride 5 Subj.
18 13 Unit manufacturing cost 5 US$
19 14 Time in spray chamber without water entry 5 s
20 15 Cycles in mud chamber without contamination 5 k-cycles
21 16, 17 Time to disassemble/assemble for maintenance 3 s
22 17, 18 Special tools required for maintenance 3 List
23 19 UV test duration to degrade rubber parts 5 hr
24 19 Monster cycles to failure 5 Cycles
25 20 Japan Industrial Standards test 5 Binary
26 20 Bending strength (frontal loading) 5 kN
uLr04772_ch06_091-116.indd Page 96 3/28/11 9:04 PM F-501uLr04772_ch06_091-116.indd Page 96 3/28/11 9:04 PM F-501 208/MHBR233/uLr04772_disk1of1/0073404772/uLr04772_pagefiless208/MHBR233/uLr04772_disk1of1/0073404772/uLr04772_pagefiless
specifications will be achieved. Designers use many types of variables in product development; some are dependent, such as the mass of the fork, and some are inde-pendent, such as the material used for the fork. In other words, designers cannot control mass directly because it arises from other independent decisions the design-ers will make, such as dimensions and materials choices. Metrics specify the over-all performance of a product and should therefore be the dependent variables (i.e., the performance measures or output variables) in the design problem. By using dependent variables for the specifications, designers are left with the freedom to achieve the specifications using the best approach possible.
Product Specifications 97
EXHIBIT 6-5 The needs-metrics matrix.
Need 1 Reduces vibration to the hands • • • 2 Allows easy traversal of slow, difficult terrain • 3 Enables high-speed descents on bumpy trails • • • 4 Allows sensitivity adjustment • 5 Preserves the steering characteristics of the bike • • 6 Remains rigid during hard cornering • • 7 Is lightweight • 8 Provides stiff mounting points for the brakes • 9 Fits a wide variety of bikes, wheels, and tires • • • •10 Is easy to install •11 Works with fenders •12 Instills pride •13 Is affordable for an amateur enthusiast •14 Is not contaminated by water •15 Is not contaminated by grunge •16 Can be easily accessed for maintenance •17 Allows easy replacement of worn parts • •18 Can be maintained with readily available tools •19 Lasts a long time • •20 Is safe in a crash • •
Met
ric
Att
enua
tion
from
dro
pou
t to
han
dle
bar
at
10 H
z 1
Sprin
g p
relo
ad
2
Max
imum
val
ue fr
om t
he M
onst
er
3
Min
imum
des
cent
tim
e on
tes
t tr
ack
4D
amp
ing
coe
ffici
ent
adju
stm
ent
rang
e 5
Max
imum
tra
vel (
26-in
. whe
el)
6
Rake
offs
et
7
Late
ral s
tiffn
ess
at t
he t
ip
8
Tota
l mas
s
9La
tera
l stif
fnes
s at
bra
ke p
ivot
s
10H
ead
set
size
s
11St
eert
ube
leng
th
12
Whe
el s
izes
13M
axim
um t
ire w
idth
14Ti
me
to a
ssem
ble
to
fram
e
15Fe
nder
com
pat
ibili
ty
16
Inst
ills
prid
e
17U
nit
man
ufac
turin
g c
ost
18
Tim
e in
sp
ray
cham
ber
with
out
wat
er e
ntry
19
Cyc
les
in m
ud c
ham
ber
with
out
cont
amin
atio
n 20
Tim
e to
dis
asse
mb
le/a
ssem
ble
for
mai
nten
ance
21
Spec
ial t
ools
req
uire
d fo
r m
aint
enan
ce
22U
V t
est
dur
atio
n to
deg
rad
e ru
bb
er p
arts
23
Mon
ster
cyc
les
to fa
ilure
24
Jap
an In
dus
tria
l Sta
ndar
ds
test
25B
end
ing
str
eng
th (f
ront
al lo
adin
g)
26
uLr04772_ch06_091-116.indd Page 97 3/28/11 9:04 PM F-501uLr04772_ch06_091-116.indd Page 97 3/28/11 9:04 PM F-501 208/MHBR233/uLr04772_disk1of1/0073404772/uLr04772_pagefiless208/MHBR233/uLr04772_disk1of1/0073404772/uLr04772_pagefiless

• Metrics should be practical. It does not serve the team to devise a metric for a bicycle suspension that can only be measured by a scientific laboratory at a cost of $100,000. Ideally, metrics will be directly observable or analyzable properties of the product that can be easily evaluated by the team.
• Some needs cannot easily be translated into quantifiable metrics. The need that the suspension instills pride may be quite critical to success in the fashion-conscious mountain bike market, but how can pride be quantified? In these cases, the team sim-ply repeats the need statement as a specification and notes that the metric is subjective and would be evaluated by a panel of customers. (We indicate this by entering “Subj.” in the units column.)
• The metrics should include the popular criteria for comparison in the marketplace. Many customers in various markets buy products based on independently published evaluations. Such evaluations are found, for example, in Popular Science, Consumer Reports, on various Internet sites, or, in our case, in Bicycling and Mountain Bike magazines. If the team knows that its product will be evaluated by the trade media and knows what the evaluation criteria will be, then it should include metrics cor-responding to these criteria. Mountain Bike magazine uses a test machine called the Monster, which measures the vertical acceleration (in g’s) of the handlebars as a bicycle equipped with the fork runs over a block 50 millimeters tall. For this reason, the team included “maximum value from the Monster” as a metric. If the team cannot find a relationship between the criteria used by the media and the customer needs it has identified, then it should ensure that a need has not been overlooked and/or should work with the media to revise the criteria. In a few cases, the team may conclude that high performance in the media evaluations is in itself a customer need and choose to include a metric used by the media that has little intrinsic technical merit.
In addition to denoting the needs related to each metric, Exhibit 6-4 contains the units of measurement and an importance rating for each metric. The units of measurement are most commonly conventional engineering units such as kilograms and seconds. However, some metrics will not lend themselves to numerical values. The need that the suspension “works with fenders” is best translated into a specification listing the models of fenders with which the fork is compatible. In this case, the value of the metric is actually a list of fenders rather than a number. For the metric involving the standard safety test, the value is pass/fail. (We indicate these two cases by entering “List” and “Binary” in the units column.)
The importance rating of a metric is derived from the importance ratings of the needs it reflects. For cases in which a metric maps directly to a single need, the importance rating of the need becomes the importance rating of the metric. For cases in which a metric is related to more than one need, the importance of the metric is de-termined by considering the importances of the needs to which it relates and the nature of these relationships. We believe that there are enough subtleties in this process that importance weightings can best be determined through discussion among the team members, rather than through a formal algorithm. When there are relatively few speci-fications and establishing the relative importance of these specifications is critically important, conjoint analysis may be useful. Conjoint analysis is described briefly later in this chapter and publications explaining the technique are referenced at the end of the chapter.
98 Chapter 6
uLr04772_ch06_091-116.indd Page 98 3/28/11 9:04 PM F-501uLr04772_ch06_091-116.indd Page 98 3/28/11 9:04 PM F-501 208/MHBR233/uLr04772_disk1of1/0073404772/uLr04772_pagefiless208/MHBR233/uLr04772_disk1of1/0073404772/uLr04772_pagefiless

Step 2: Collect Competitive Benchmarking InformationUnless the team expects to enjoy a total monopoly, the relationship of the new product to competitive products is paramount in determining commercial success. While the team will have entered the product development process with some idea of how it wishes to compete in the marketplace, the target specifications are the language the team uses to discuss and agree on the detailed positioning of its product relative to existing products, both its own and competitors’. Information on competing products must be gathered to support these positioning decisions.
An example of a competitive benchmarking chart is shown in Exhibit 6-6. The columns of the chart correspond to the competitive products and the rows are the metrics established in step 1. Note that the competitive benchmarking chart can be constructed as a simple appendage to the spreadsheet containing the list of metrics. (This information is one of the “rooms” in the House of Quality, described by Hauser and Clausing.)
The benchmarking chart is conceptually very simple. For each competitive product, the values of the metrics are simply entered down a column. Gathering these data can be very time consuming, involving (at the least) purchasing, testing, disassembling, and estimat-ing the production costs of the most important competitive products. However, this invest-ment of time is essential, as no product development team can expect to succeed without having this type of information. A word of warning: Sometimes the data contained in competitors’ catalogs and supporting literature are not accurate. Where possible, values of the key metrics should be verified by independent testing or observation.
An alternative competitive benchmarking chart can be constructed with rows corre-sponding to the customer needs and columns corresponding to the competitive products (see Exhibit 6-7). This chart is used to compare customers’ perceptions of the relative de-gree to which the products satisfy their needs. Constructing this chart requires collecting customer perception data, which can also be very expensive and time consuming. Some techniques for measuring customers’ perceptions of satisfaction of needs are contained in a book by Urban and Hauser (1993). Both charts can be useful and any discrepancies between the two are instructive. At a minimum, a chart showing the competitive values of the metrics (Exhibit 6-6) should be created.
Step 3: Set Ideal and Marginally Acceptable Target ValuesIn this step, the team synthesizes the available information in order to actually set the target values for the metrics. Two types of target value are useful: an ideal value and a marginally acceptable value. The ideal value is the best result the team could hope for. The marginally acceptable value is the value of the metric that would just barely make the product commercially viable. Both of these targets are useful in guiding the subsequent stages of concept generation and concept selection, and for refining the specifications after the product concept has been selected.
There are five ways to express the values of the metrics:
• At least X: These specifications establish targets for the lower bound on a metric, but higher is still better. For example, the value of the brake mounting stiffness is specified to be at least 325 kilonewtons/meter.
• At most X: These specifications establish targets for the upper bound on a metric, with smaller values being better. For example, the value for the mass of the suspension fork is set to be at most 1.4 kilograms.
Product Specifications 99
uLr04772_ch06_091-116.indd Page 99 3/28/11 9:04 PM F-501uLr04772_ch06_091-116.indd Page 99 3/28/11 9:04 PM F-501 208/MHBR233/uLr04772_disk1of1/0073404772/uLr04772_pagefiless208/MHBR233/uLr04772_disk1of1/0073404772/uLr04772_pagefiless

• Between X and Y: These specifications establish both upper and lower bounds for the value of a metric. For example, the value for the spring preload is set to be between 480 and 800 newtons. Any more and the suspension is harsh; any less and the suspension is too bouncy.
• Exactly X: These specifications establish a target of a particular value of a metric, with any deviation degrading performance. For example, the ideal value for the rake offset metric is set to 38 millimeters. This type of specification is to be avoided if possible because such specifications substantially constrain the design. Often, upon reconsid-eration, the team realizes that what initially appears as an “exactly X” specification can be expressed as a “between X and Y” specification.
• A set of discrete values: Some metrics will have values corresponding to several discrete choices. For example, the headset diameters are 1.000, 1.125, or 1.250 inches. (Industry practice is to use English units for these and several other critical bicycle dimensions.)
100 Chapter 6
Rox Rox GunhillMetric Need ST Maniray Tahx Tahx Tonka HeadNo. Nos. Metric Imp. Units Tritrack 2 Quadra Ti 21 Pro Shox
1 1, 3 Attenuation from dropout to handlebar at 10 Hz 3 dB 8 15 10 15 9 13
2 2, 6 Spring preload 3 N 550 760 500 710 480 680
3 1, 3 Maximum value from the Monster 5 g 3.6 3.2 3.7 3.3 3.7 3.4
4 1, 3 Minimum descent time on test track 5 s 13 11.3 12.6 11.2 13.2 11
5 4 Damping coefficient adjustment range 3 N-s/m 0 0 0 200 0 0
6 5 Maximum travel (26-in. wheel) 3 mm 28 48 43 46 33 38
7 5 Rake offset 3 mm 41.5 39 38 38 43.2 39
8 6 Lateral stiffness at the tip 3 kN/m 59 110 85 85 65 130
9 7 Total mass 4 kg 1.409 1.385 1.409 1.364 1.222 1.100
10 8 Lateral stiffness at brake pivots 2 kN/m 295 550 425 425 325 650
1.000 1.000 1.000 1.125 1.000 1.125 1.00011 9 Headset sizes 5 in. 1.125 1.250 1.125 1.250 1.125 NA
150 150 180 140 150 170 150 210 165 170 190 190 230 190 190 210 21012 9 Steertube length 5 mm 255 215 210 230 220 NA
26 in.13 9 Wheel sizes 5 List 26 in. 26 in. 26 in. 700C 26 in. 26 in.
EXHIBIT 6-6 Competitive benchmarking chart based on metrics.
uLr04772_ch06_091-116.indd Page 100 3/28/11 9:04 PM F-501uLr04772_ch06_091-116.indd Page 100 3/28/11 9:04 PM F-501 208/MHBR233/uLr04772_disk1of1/0073404772/uLr04772_pagefiless208/MHBR233/uLr04772_disk1of1/0073404772/uLr04772_pagefiless

The desirable range of values for one metric may depend on another. In other words, we may wish to express a target as, for example, “the fork tip lateral stiffness is no more than 20 percent of the lateral stiffness at the brake pivots.” In applications where the team feels this level of complexity is warranted, such targets can easily be included, although we recommend that this level of complexity not be introduced until the final phase of the specifications process.
Using these five different types of expressions for values of the metrics, the team sets the target specifications. The team simply proceeds down the list of metrics and assigns both the marginally acceptable and ideal target values for each metric. These decisions are facilitated by the metric-based competitive benchmarking chart shown in Exhibit 6-6. To set the target values, the team has many considerations, including the capability of com-peting products available at the time, competitors’ future product capabilities (if these are predictable), and the product’s mission statement and target market segment. Exhibit 6-8 shows the targets assigned for the suspension fork.
EXHIBIT 6-6 Continued
EXHIBIT 5-6 Continued
Rox Rox GunhillMetric Need ST Maniray Tahx Tahx Tonka HeadNo. Nos. Metric Imp. Units Tritrack 2 Quadra Ti 21 Pro Shox
14 9 Maximum tire width 5 in. 1.5 1.75 1.5 1.75 1.5 1.5
15 10 Time to assemble to frame 1 s 35 35 45 45 35 85
16 11 Fender compatibility 1 List Zefal None None None None All
17 12 Instills pride 5 Subj. 1 4 3 5 3 5
18 13 Unit manufacturing cost 5 US$ 65 105 85 115 80 100
19 14 Time in spray chamber without water entry 5 s 1300 2900 >3600 >3600 2300 >3600
20 15 Cycles in mud chamber without contamination 5 k-cycles 15 19 15 25 18 35
21 16, 17 Time to disassemble/ assemble for maintenance 3 s 160 245 215 245 200 425
22 17, 18 Special tools 3 List Hex Hex Hex Hex Long Hex, required for hex pin maintenance wrench
23 19 UV test duration to degrade rubber parts 5 hr 400+ 250 400+ 400+ 400+ 250
24 19 Monster cycles to failure 5 Cycles 500k+ 500k+ 500k+ 480k 500k+ 330k
25 20 Japan Industrial Standards test 5 Binary Pass Pass Pass Pass Pass Pass
26 20 Bending strength (frontal loading) 5 kN 5.5 8.9 7.5 7.5 6.2 10.2
Product Specifications 101
uLr04772_ch06_091-116.indd Page 101 3/28/11 9:04 PM F-501uLr04772_ch06_091-116.indd Page 101 3/28/11 9:04 PM F-501 208/MHBR233/uLr04772_disk1of1/0073404772/uLr04772_pagefiless208/MHBR233/uLr04772_disk1of1/0073404772/uLr04772_pagefiless

EXHIBIT 5-7
ST Maniray Rox Tahx Rox Tahx Tonka GunhillNo. Need Imp. Tritrack 2 Quadra Ti 21 Pro Head Shox
1 Reduces vibration to the hands 3 • •••• •• ••••• •• •••
2 Allows easy traversal of slow, difficult terrain 2 •• •••• ••• ••••• ••• •••••
3 Enables high-speed descents on bumpy trails 5 • ••••• •• ••••• •• •••
4 Allows sensitivity adjustment 3 • •••• •• ••••• •• •••
5 Preserves the steering characteristics of the bike 4 •••• •• • •• ••••• •••••
6 Remains rigid during hard cornering 4 • ••• • ••••• • •••••
7 Is lightweight 4 • ••• • ••• •••• •••••
8 Provides stiff mounting points for the brakes 2 • •••• ••• ••• ••••• ••
9 Fits a wide variety of bikes, wheels, and tires 5 •••• ••••• ••• ••••• ••• •
10 Is easy to install 1 •••• ••••• •••• •••• ••••• •
11 Works with fenders 1 ••• • • • • •••••
12 Instills pride 5 • •••• ••• ••••• ••• •••••
13 Is affordable for an amateur enthusiast 5 ••••• • ••• • ••• ••
14 Is not contaminated by water 5 • ••• •••• •••• •• •••••
15 Is not contaminated by grunge 5 • ••• • •••• •• •••••
16 Can be easily accessed for maintenance 3 •••• ••••• •••• •••• ••••• •
17 Allows easy replacement of worn parts 1 •••• ••••• •••• •••• ••••• •
18 Can be maintained with readily available tools 3 ••••• ••••• ••••• ••••• •• •
19 Lasts a long time 5 ••••• ••••• ••••• ••• ••••• •
20 Is safe in a crash 5 ••••• ••••• ••••• ••••• ••••• •••••
EXHIBIT 6-7 Competitive benchmarking chart based on perceived satisfaction of needs. (Scoring more “dots” corresponds to greater perceived satisfaction of the need.)
102 Chapter 6
uLr04772_ch06_091-116.indd Page 102 3/28/11 9:04 PM F-501uLr04772_ch06_091-116.indd Page 102 3/28/11 9:04 PM F-501 208/MHBR233/uLr04772_disk1of1/0073404772/uLr04772_pagefiless208/MHBR233/uLr04772_disk1of1/0073404772/uLr04772_pagefiless

Because most of the values are expressed in terms of bounds (upper or lower or both), the team is establishing the boundaries of the competitively viable product space. The team hopes that the product will meet some of the ideal targets but is confident that a product can be commercially viable even if it exhibits one or more marginally acceptable characteristics. Note that these specifications are preliminary because until a product con-cept is chosen and some of the design details are worked out, many of the exact trade-offs are uncertain.
Step 4: Reflect on the Results and the ProcessThe team may require some iteration to agree on the targets. Reflection after each iteration helps to ensure that the results are consistent with the goals of the project. Questions to consider include:
• Are members of the team “gaming”? For example, is the key marketing representative insisting that an aggressive value is required for a particular metric in the hopes that by setting a high goal, the team will actually achieve more than if his or her true, and more lenient, beliefs were expressed?
• Should the team consider offering multiple products or at least multiple options for the product in order to best match the particular needs of more than one market segment, or will one “average” product suffice?
• Are any specifications missing? Do the specifications reflect the characteristics that will dictate commercial success?
Once the targets have been set, the team can proceed to generate solution concepts. The target specifications then can be used to help the team select a concept and will help the team know when a concept is commercially viable. (See Chapter 7, Concept Generation, and Chapter 8, Concept Selection.)
Setting the Final Specifications
As the team finalizes the choice of a concept and prepares for subsequent design and development, the specifications are revisited. Specifications that originally were only targets expressed as broad ranges of values are now refined and made more precise.
Finalizing the specifications is difficult because of trade-offs—inverse relationships between two specifications that are inherent in the selected product concept. Trade-offs frequently occur between different technical performance metrics and almost always occur between technical performance metrics and cost. For example, one trade-off is between brake mounting stiffness and mass of the fork. Because of the basic mechanics of the fork structure, these specifications are inversely related, assuming other factors are held con-stant. Another trade-off is between cost and mass. For a given concept, the team may be able to reduce the mass of the fork by making some parts out of titanium instead of steel. Unfortunately, decreasing the mass in this way will most likely increase the manufactur-ing cost of the product. The difficult part of refining the specifications is choosing how such trade-offs will be resolved.
Product Specifications 103
uLr04772_ch06_091-116.indd Page 103 3/28/11 9:04 PM F-501uLr04772_ch06_091-116.indd Page 103 3/28/11 9:04 PM F-501 208/MHBR233/uLr04772_disk1of1/0073404772/uLr04772_pagefiless208/MHBR233/uLr04772_disk1of1/0073404772/uLr04772_pagefiless

Metric Need Marginal IdealNo. Nos. Metric Imp. Units Value Value
1 1, 3 Attenuation from dropout to handlebar at 10 Hz 3 dB >10 >15
2 2, 6 Spring preload 3 N 480–800 650–700
3 1, 3 Maximum value from the Monster 5 g <3.5 <3.2
4 1, 3 Minimum descent time on test track 5 s <13.0 <11.0
5 4 Damping coefficient adjustment range 3 N-s/m 0 >200
6 5 Maximum travel (26-in. wheel) 3 mm 33–50 45
7 5 Rake offset 3 mm 37–45 38
8 6 Lateral stiffness at the tip 3 kN/m >65 >130
9 7 Total mass 4 kg <1.4 <1.1
10 8 Lateral stiffness at brake pivots 2 kN/m >325 >650
1.000 1.000 1.125 11 9 Headset sizes 5 in. 1.125 1.250
150 150 170 170 190 190 210 12 9 Steertube length 5 mm 210 230
26 in. 13 9 Wheel sizes 5 List 26 in. 700C
14 9 Maximum tire width 5 in. >1.5 >1.75
15 10 Time to assemble to frame 1 s <60 <35
16 11 Fender compatibility 1 List None All
17 12 Instills pride 5 Subj. >3 >5
18 13 Unit manufacturing cost 5 US$ <85 <65
19 14 Time in spray chamber without water 5 s >2300 >3600 entry
20 15 Cycles in mud chamber without 5 k-cycles >15 >35 contamination
21 16, 17 Time to disassemble/assemble 3 s <300 <160 for maintenance
22 17, 18 Special tools required for maintenance 3 List Hex Hex
23 19 UV test duration to degrade rubber parts 5 hr >250 >450
24 19 Monster cycles to failure 5 Cycles >300k >500k
25 20 Japan Industrial Standards test 5 Binary Pass Pass
26 20 Bending strength (frontal loading) 5 kN >7.0 >10.0
EXHIBIT 6-8 The target specifications. Like the other information systems, this one is easily encoded with a spreadsheet as a simple extension to the list of specifications.
104 Chapter 6
uLr04772_ch06_091-116.indd Page 104 3/28/11 9:04 PM F-501uLr04772_ch06_091-116.indd Page 104 3/28/11 9:04 PM F-501 208/MHBR233/uLr04772_disk1of1/0073404772/uLr04772_pagefiless208/MHBR233/uLr04772_disk1of1/0073404772/uLr04772_pagefiless

Here, we propose a five-step process:
1. Develop technical models of the product.
2. Develop a cost model of the product.
3. Refine the specifications, making trade-offs where necessary.
4. Flow down the specifications as appropriate.
5. Reflect on the results and the process.
Step 1: Develop Technical Models of the ProductA technical model of the product is a tool for predicting the values of the metrics for a particular set of design decisions. We intend the term models to refer to both analytical and physical approximations of the product. (See Chapter 14, Prototyping, for further dis-cussion of such models.)
At this point, the team had chosen an oil-damped coil spring concept for the suspen-sion fork. The design decisions facing the team included details such as the materials for the structural components, the orifice diameter and oil viscosity for the damper, and the spring constant. Three models linking such design decisions to the performance metrics are shown in conceptual form in Exhibit 6-9. Such models can be used to predict the product’s performance along a number of dimensions. The inputs to these models are the independent design variables associated with the product concept, such as oil viscosity, orifice diameter, spring constant, and geometry. The outputs of the model are the values of the metrics, such as attenuation, stiffness, and fatigue life.
Ideally, the team will be able to accurately model the product analytically, perhaps by implementing the model equations in a spreadsheet or computer simulation. Such a model allows the team to predict rapidly what type of performance can be expected from a particular choice of design variables, without costly physical experimentation. In most cases, such analytical models will be available for only a small subset of the metrics. For example, the team was able to model attenuation analytically, based on the engineers’ knowledge of dynamic systems.
Several independent models, each corresponding to a subset of the metrics, may be more manageable than one large integrated model. For example, the team developed a separate analytical model for the brake mounting stiffness that was completely independent of the dynamic model used to predict vibration attenuation. In some cases, no analytical models will be available at all. For example, the team was not able to model analytically the fatigue performance of the suspension, so physical models were built and tested. It is generally necessary to actually build a variety of different physical mock-ups or prototypes in order to explore the implications of several combinations of design variables. To reduce the number of models that must be constructed, it is useful to employ design-of-experiments (DOE) techniques, which can minimize the number of experiments required to explore the design space. (See Chapter 15, Robust Design, for a summary of DOE methods.)
Armed with these technical models, the team can predict whether any particular set of specifications (such as the ideal target values) is technically feasible by exploring different combinations of design variables. This type of modeling and analysis prevents the team from setting a combination of specifications that cannot be achieved using the available latitude in the product concept.
Product Specifications 105
uLr04772_ch06_091-116.indd Page 105 3/28/11 9:04 PM F-501uLr04772_ch06_091-116.indd Page 105 3/28/11 9:04 PM F-501 208/MHBR233/uLr04772_disk1of1/0073404772/uLr04772_pagefiless208/MHBR233/uLr04772_disk1of1/0073404772/uLr04772_pagefiless

Note that a technical model is almost always unique to a particular product concept. One of the models illustrated in Exhibit 6-9 is for an oil-damped suspension system; the model would be substantially different if the team had selected a concept employing a rubber suspension element. Thus, the modeling step can only be performed after the concept has been chosen.
Step 2: Develop a Cost Model of the ProductThe goal of this step of the process is to make sure that the product can be produced at the target cost. The target cost is the manufacturing cost at which the company and its distribution partners can make adequate profits while still offering the product to the end customer at a competitive price. The appendix to this chapter provides an explanation of target costing. It is at this point that the team attempts to discover, for example, how much it will have to sacrifice in manufacturing cost to save 50 grams of mass.
For most products, the first estimates of manufacturing costs are completed by draft-ing a bill of materials (a list of all the parts) and estimating a purchase price or fabrication cost for each part. At this point in the development process the team does not generally know all of the components that will be in the product, but the team nevertheless makes an attempt to list the components it expects will be required. While early estimates gen-erally focus on the cost of components, the team will usually make a rough estimate of assembly and other manufacturing costs (e.g., overhead) at this point as well. Efforts to develop these early cost estimates involve soliciting cost estimates from vendors and estimating the production costs of the components the firm will make itself. This process
106 Chapter 6
Fatigue Model ofSuspension Durability
(Physical)
Static Model ofBrake Mounting Stiffness
(Analytical)
Dynamic Model ofSuspension Performance
(Analytical)
Metrics(Model Outputs)
Design Variables(Model Inputs)
Attenuation at 10 Hz
Estimated Monster g's
Lateral Stiffness
Cycles to Failure
Suspended Mass
Unsprung Mass
Orifice Diameter
Spring Constant
Oil Viscosity
Support Geometry
Material Properties
Tube Geometry
Mounting Points
Fork Geometry
Material Properties
Fastening Methods
Suspension Geometry
EXHIBIT 6-9 Models used to assess technical feasibility. Technical models may be analytical or physical approximations of the product concept.
uLr04772_ch06_091-116.indd Page 106 3/28/11 9:04 PM F-501uLr04772_ch06_091-116.indd Page 106 3/28/11 9:04 PM F-501 208/MHBR233/uLr04772_disk1of1/0073404772/uLr04772_pagefiless208/MHBR233/uLr04772_disk1of1/0073404772/uLr04772_pagefiless

is often facilitated by a purchasing expert and a production engineer. A bill-of-materials cost model is shown in Exhibit 6-10 for the suspension fork. (See Chapter 13, Design for Manufacturing, for more details on estimating manufacturing cost.)
A useful way to record cost information is to list figures for the high and low es-timates of each item. This helps the team to understand the range of uncertainty in the estimates. The bill of materials is typically used iteratively: the team performs a “what-if ” cost analysis for a set of design decisions and then revises these decisions based on what it learns. The bill of materials is itself a kind of performance model, but instead of predicting the value of a technical performance metric, it predicts cost performance. The bill of materials remains useful throughout the development process and is updated regularly (as frequently as once each week) to reflect the current status of the estimated manufacturing cost.
At this point in the development process, teams developing complex products contain-ing hundreds or thousands of parts will not generally be able to include every part in the bill of materials. Instead, the team will list the major components and subsystems and place bounds on their costs based on past experience or on the judgment of suppliers.
Product Specifications 107
EXHIBIT 6-10 A bill of materials with cost estimates. This simple cost model allows early cost estimates to facilitate realistic trade-offs in the product specifications.
Qty/ High Low High Total Low TotalComponent Fork ($ ea.) ($ ea.) ($/fork) ($/fork)
Steertube 1 2.50 2.00 2.50 2.00Crown 1 4.00 3.00 4.00 3.00Boot 2 1.00 0.75 2.00 1.50Lower tube 2 3.00 2.00 6.00 4.00Lower tube top cover 2 2.00 1.50 4.00 3.00
Main lip seal 2 1.50 1.40 3.00 2.80Slide bushing 4 0.20 0.18 0.80 0.72Slide bushing spacer 2 0.50 0.40 1.00 0.80Lower tube plug 2 0.50 0.35 1.00 0.70Upper tube 2 5.50 4.00 11.00 8.00
Upper tube top cap 2 3.00 2.50 6.00 5.00Upper tube adjustment knob 2 2.00 1.75 4.00 3.50Adjustment shaft 2 4.00 3.00 8.00 6.00Spring 2 3.00 2.50 6.00 5.00Upper tube orifice cap 1 3.00 2.25 3.00 2.25
Orifice springs 4 0.50 0.40 2.00 1.60Brake studs 2 0.40 0.35 0.80 0.70Brake brace bolt 2 0.25 0.20 0.50 0.40Brake brace 1 5.00 3.50 5.00 3.50Oil (liters) 0.1 2.50 2.00 0.25 0.20
Misc. snap rings, o-rings 10 0.15 0.10 1.50 1.00Decals 4 0.25 0.15 1.00 0.60
Assembly at $20/hr 30 min 20 min 10.00 6.67Overhead at 25% of direct cost 20.84 15.74
Total $104.19 $78.68
uLr04772_ch06_091-116.indd Page 107 3/28/11 9:04 PM F-501uLr04772_ch06_091-116.indd Page 107 3/28/11 9:04 PM F-501 208/MHBR233/uLr04772_disk1of1/0073404772/uLr04772_pagefiless208/MHBR233/uLr04772_disk1of1/0073404772/uLr04772_pagefiless
108 Chapter 6
Step 3: Refine the Specifications, Making Trade-Offs Where NecessaryOnce the team has constructed technical performance models where possible and constructed a preliminary cost model, these tools can be used to develop final specifica-tions. Finalizing specifications can be accomplished in a group session in which feasible combinations of values are determined through the use of the technical models and then the cost implications are explored. In an iterative fashion, the team converges on the specifications that will most favorably position the product relative to the competition, will best satisfy the customer needs, and will ensure adequate profits.
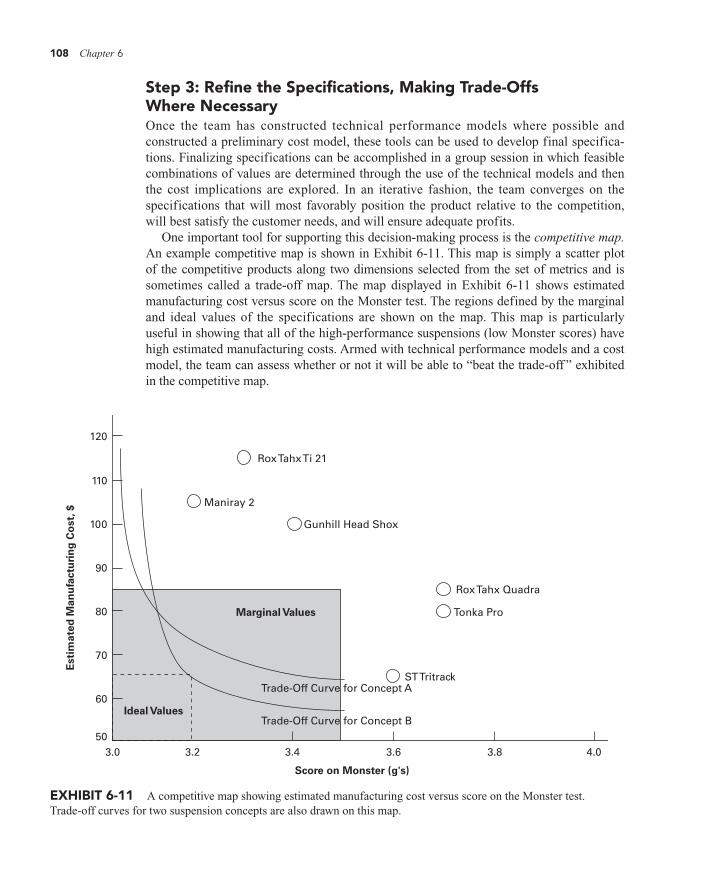
One important tool for supporting this decision-making process is the competitive map. An example competitive map is shown in Exhibit 6-11. This map is simply a scatter plot of the competitive products along two dimensions selected from the set of metrics and is sometimes called a trade-off map. The map displayed in Exhibit 6-11 shows estimated manufacturing cost versus score on the Monster test. The regions defined by the marginal and ideal values of the specifications are shown on the map. This map is particularly useful in showing that all of the high-performance suspensions (low Monster scores) have high estimated manufacturing costs. Armed with technical performance models and a cost model, the team can assess whether or not it will be able to “beat the trade-off ” exhibited in the competitive map.
Marginal Values
Ideal Values
Rox Tahx Ti 21
Maniray 2
Gunhill Head Shox
Rox Tahx Quadra
Tonka Pro
ST TritrackTrade-Off Curve for Concept A
Trade-Off Curve for Concept B
4.03.83.63.43.23.050
60
70
80
90
100
110
120
Est
imat
ed M
anu
fact
uri
ng
Co
st, $
Score on Monster (g's)
EXHIBIT 6-11 A competitive map showing estimated manufacturing cost versus score on the Monster test. Trade-off curves for two suspension concepts are also drawn on this map.
uLr04772_ch06_091-116.indd Page 108 3/28/11 9:04 PM F-501uLr04772_ch06_091-116.indd Page 108 3/28/11 9:04 PM F-501 208/MHBR233/uLr04772_disk1of1/0073404772/uLr04772_pagefiless208/MHBR233/uLr04772_disk1of1/0073404772/uLr04772_pagefiless

These maps can be constructed directly from the data contained in the competitive benchmarking chart using the plotting feature of the spreadsheet software. Generally the team will prepare three or four such maps corresponding to a handful of critical metrics. Additional maps may be created as needed to support subsequent decision making.
The competitive map is used to position the new product relative to the competition. Trade-off curves, showing performance of the product concept for a range of design variables, can be drawn directly on the competitive map, as shown in Exhibit 6-11. Using the technical and cost models of the product and the competitive maps, the team can refine the specifications in order to both satisfy the inherent constraints of the prod-uct concept and make the trade-offs in a way that will provide a performance advantage relative to the competitive products. The final specifications for the suspension fork are shown in Exhibit 6-12.
For relatively mature product categories in which competition is based on performance relative to a handful of well-understood performance metrics, conjoint analysis may be useful in refining product specifications. Conjoint analysis uses customer survey data to construct a model of customer preference. Essentially each respondent in a sample of potential customers is repeatedly asked to evaluate hypothetical products characterized by a set of attributes. These attributes must generally be metrics that are easily understood by customers (e.g., fuel economy and price for automobiles). Subjective attributes (e.g., styl-ing) can be represented graphically. The hypothetical products are constructed using the statistical techniques of experimental design. Using customer responses, conjoint analysis infers the relative importance of each attribute to the customer. These data can then be used to predict which product a customer would choose when offered a hypothetical set of alternatives. By using these predictions for all of the customers in a sample, the market share of each product in the set of alternatives can be forecast. Using this approach, the specification values that maximize market share can be estimated. The details of conjoint analysis are fairly straightforward, but beyond the scope of this chapter. Relevant refer-ences are listed at the end of the chapter.
Step 4: Flow Down the Specifications as AppropriateThis chapter focuses on the specifications for a relatively simple component designed by a single, relatively small development team. Establishing specifications takes on additional importance and is substantially more challenging when developing a highly complex product consisting of multiple subsystems designed by multiple development teams. In such a context, specifications are used to define the development objectives of each of the subsystems as well as for the product as a whole. The challenge in this case is to flow down the overall specifications to specifications for each subsystem. For example, the overall specifications for an automobile contain metrics like fuel economy, 0–100 kilometer/hour acceleration time, and turning radius. However, specifications must also be cre-ated for the several dozen major subsystems that make up the automobile, including the body, engine, transmission, braking system, and suspension. The specifications for the engine include metrics like peak power, peak torque, and fuel consumption at peak efficiency. One challenge in the flow-down process is to ensure that the subsystem specifications in fact reflect the overall product specifications—that if specifications for the subsystems are achieved, the overall product specifications will be achieved. A second challenge is to ensure that certain specifications for different subsystems are equally
Product Specifications 109
uLr04772_ch06_091-116.indd Page 109 3/28/11 9:04 PM F-501uLr04772_ch06_091-116.indd Page 109 3/28/11 9:04 PM F-501 208/MHBR233/uLr04772_disk1of1/0073404772/uLr04772_pagefiless208/MHBR233/uLr04772_disk1of1/0073404772/uLr04772_pagefiless

difficult to meet. That is, for example, that the mass specification for the engine is not inordinately more difficult to meet than is the mass specification for the body. Otherwise, the cost of the product will likely be higher than necessary.
Some overall component specifications can be established through budget allocations. For example, specifications for manufacturing cost, mass, and power consumption can be allocated to subsystems with the confidence that the overall cost, mass, and power con-sumption of the product will simply be the sum of these quantities for each subsystem.
110 Chapter 6
EXHIBIT 6-12The final specifications.
No. Metric Unit Value
1 Attenuation from dropout to handlebar at 10 Hz dB> 12
2 Spring preload N 600–650
3 Maximum value from the Monster g <3.4
4 Minimum descent time on test track s <11.5
5 Damping coefficient adjustment range N-s/m >100
6 Maximum travel (26-in. wheel) mm 43
7 Rake offset mm 38
8 Lateral stiffness at the tip kN/m >75
9 Total mass kg <1.4
10 Lateral stiffness at brake pivots kN/m >425
1.000 11 Headset sizes in. 1.125
150 170 190 210 12 Steertube length mm 230
13 Wheel sizes List 26 in.
14 Maximum tire width in. >1.75
15 Time to assemble to frame s <45
16 Fender compatibility List Zefal
17 Instills pride Subj. >4
18 Unit manufacturing cost US$ <80
19 Time in spray chamber without water entry s >3600
20 Cycles in mud chamber without contamination k-cycles >25
21 Time to disassemble/assemble for maintenance s <200
22 Special tools required for maintenance List Hex
23 UV test duration to degrade rubber parts hr >450
24 Monster cycles to failure Cycles >500k
25 Japan Industrial Standards test Binary Pass
26 Bending strength (frontal loading) kN >10.0
uLr04772_ch06_091-116.indd Page 110 3/28/11 9:04 PM F-501uLr04772_ch06_091-116.indd Page 110 3/28/11 9:04 PM F-501 208/MHBR233/uLr04772_disk1of1/0073404772/uLr04772_pagefiless208/MHBR233/uLr04772_disk1of1/0073404772/uLr04772_pagefiless

To some extent, geometric volume can be allocated this way as well. Other component specifications must be established through a more complex understanding of how subsys-tem performance relates to overall product performance. For example, fuel efficiency is a relatively complex function of vehicle mass, rolling resistance, aerodynamic drag coef-ficient, frontal area, and engine efficiency. Establishing specifications for the body, tires, and engine requires a model of how these variables relate to overall fuel efficiency.
A comprehensive treatment of flowing down specifications for complex products is beyond the scope of this chapter, and in fact is a major focus of the field of systems engi-neering. We refer the reader to several useful books on this subject in the reference list.
Step 5: Reflect on the Results and the ProcessAs always, the final step in the method is to reflect on the outcome and the process. Some questions the team may want to consider are:
• Is the product a winner? The product concept should allow the team to actually set the specifications so that the product will meet the customer needs and excel competi-tively. If not, then the team should return to the concept generation and selection phase or abandon the project.
• How much uncertainty is there in the technical and cost models? If competitive suc-cess is dictated by metrics around which much uncertainty remains, the team may wish to refine the technical or cost models in order to increase confidence in meeting the specifications.
• Is the concept chosen by the team best suited to the target market, or could it be best applied in another market (say, the low end or high end instead of the middle)? The selected concept may actually be too good. If the team has generated a concept that is dramatically superior to the competitive products, it may wish to consider employing the concept in a more demanding, and potentially more profitable, market segment.
• Should the firm initiate a formal effort to develop better technical models of some aspect of the product’s performance for future use? Sometimes the team will discover that it does not really understand the underlying product technology well enough to create useful performance models. In such circumstances, an engineering effort to develop better understanding and models may be useful in subsequent development projects.
SummaryCustomer needs are generally expressed in the “language of the customer.” In order to provide specific guidance about how to design and engineer a product, development teams establish a set of specifications, which spell out in precise, measurable detail what the product has to do to be commercially successful. The specifications must reflect the customer needs, differentiate the product from the competitive products, and be techni-cally and economically realizable.
• Specifications are typically established at least twice. Immediately after identifying the customer needs, the team sets target specifications. After concept selection and testing, the team develops final specifications.
Product Specifications 111
uLr04772_ch06_091-116.indd Page 111 3/28/11 9:04 PM F-501uLr04772_ch06_091-116.indd Page 111 3/28/11 9:04 PM F-501 208/MHBR233/uLr04772_disk1of1/0073404772/uLr04772_pagefiless208/MHBR233/uLr04772_disk1of1/0073404772/uLr04772_pagefiless

• Target specifications represent the hopes and aspirations of the team, but they are es-tablished before the team knows the constraints the product technology will place on what can be achieved. The team’s efforts may fail to meet some of these specifications and may exceed others, depending on the details of the product concept the team even-tually selects.
• The process of establishing the target specifications entails four steps:
1. Prepare the list of metrics.
2. Collect competitive benchmarking information.
3. Set ideal and marginally acceptable target values.
4. Reflect on the results and the process.
• Final specifications are developed by assessing the actual technological constraints and the expected production costs using analytical and physical models. During this refine-ment phase the team must make difficult trade-offs among various desirable character-istics of the product.
• The five-step process for refining the specifications is:
1. Develop technical models of the product.
2. Develop a cost model of the product.
3. Refine the specifications, making trade-offs where necessary.
4. Flow down the specifications as appropriate.
5. Reflect on the results and the process.
• The specifications process is facilitated by several simple information systems that can easily be created using conventional spreadsheet software. Tools such as the list of metrics, the needs-metrics matrix, the competitive benchmarking charts, and the com-petitive maps all support the team’s decision making by providing the team with a way to represent and discuss the specifications.
• Because of the need to utilize the best possible knowledge of the market, the custom-ers, the core product technology, and the cost implications of design alternatives, the specifications process requires active participation from team members representing the marketing, design, and manufacturing functions of the enterprise.
References and BibliographyMany current resources are available on the Internet viawww.ulrich-eppinger.net
The process of translating customer needs into a set of specifications is also accomplished by the Quality Function Deployment (QFD) method. The key ideas behind QFD and the House of Quality are clearly presented by Hauser and Clausing in a popular article.
Hauser, John, and Don Clausing, “The House of Quality,” Harvard Business Review, Vol. 66, No. 3, May–June 1988, pp. 63–73.
Urban and Hauser present several techniques for selecting combinations of product attributes in order to maximize customer satisfaction. Some of these techniques can serve as powerful analytical support for the general method described in this chapter.
112 Chapter 6
uLr04772_ch06_091-116.indd Page 112 3/28/11 9:04 PM F-501uLr04772_ch06_091-116.indd Page 112 3/28/11 9:04 PM F-501 208/MHBR233/uLr04772_disk1of1/0073404772/uLr04772_pagefiless208/MHBR233/uLr04772_disk1of1/0073404772/uLr04772_pagefiless

Urban, Glen, and John Hauser, Design and Marketing of New Products, second edition, Prentice Hall, Englewood Cliffs, NJ, 1993.
Ramaswamy and Ulrich treat the use of engineering models in setting specifications in detail. They also identify some of the weaknesses in the conventional House of Quality method.
Ramaswamy, Rajan, and Karl Ulrich, “Augmenting the House of Quality with Engineering Models,” Research in Engineering Design, Vol. 5, 1994, pp. 70–79.
Most marketing research textbooks discuss conjoint analysis. Here are two references.Aaker, David A., V. Kumar, and George S. Day, Marketing Research, sixth edition, John Wiley & Sons, New York, 1997.
Conjoint Analysis: A Guide for Designing and Interpreting Conjoint Studies, American Marketing Association, June 1992.
Systems engineering and the flow down of specifications are treated comprehensively in the following books.
Hatley, Derek J., and Imtiaz A. Pirbhai, Strategies for Real-Time System Specification, Dorset House, New York, 1998.
Rechtin, Eberhardt, and Mark W. Maier, The Art of Systems Architecting, second edition, CRC Press, Boca Raton, FL, 2000.
More detail on the use of target costing is available in this article by Cooper and Slagmulder.Cooper, Robin, and Regine Slagmulder, “Develop Profitable New Products with Target Costing,” Sloan Management Review, Vol. 40, No. 4, Summer 1999, pp. 23–33.
Exercises1. List a set of metrics corresponding to the need that a pen write smoothly.
2. Devise a metric and a corresponding test for the need that a roofing material last many years.
3. Some of the same metrics seem to be involved in trade-offs for many different prod-ucts. What are some examples of such metrics?
Thought Questions1. How might you establish precise and measurable specifications for intangible needs
such as “the front suspension looks great”?
2. Why are some customer needs difficult to map to a single metric?
3. How might you explain a situation in which customers’ perceptions of the competitive products (as in Exhibit 6-7) are not consistent with the values of the metrics for those same products (as in Exhibit 6-6)?
4. Can poor performance relative to one specification always be compensated for by high performance on other specifications? If so, how can there ever really be a “marginally acceptable” value for a metric?
5. Why should independent design variables not be used as metrics?
Product Specifications 113
uLr04772_ch06_091-116.indd Page 113 3/28/11 9:04 PM F-501uLr04772_ch06_091-116.indd Page 113 3/28/11 9:04 PM F-501 208/MHBR233/uLr04772_disk1of1/0073404772/uLr04772_pagefiless208/MHBR233/uLr04772_disk1of1/0073404772/uLr04772_pagefiless

114 Chapter 6
Appendix
Target CostingTarget costing is a simple idea: set the value of the manufacturing cost specification based on the price the company hopes the end user will pay for the product and on the profit margins that are required for each stage in the distribution channel. For example, assume Specialized wishes to sell its suspension fork to its customers through bicycle shops. If the price it expected the customer to pay was $250 and if bicycle shops normally expect a gross profit margin of 45 percent on components, then Specialized would have to sell its fork to bicycle shops for (1 � 0.45) ¥ 250 = $137.50. If Specialized wishes to earn a gross margin of at least 40 percent on its components, then its unit manufacturing cost must be less than (1 � 0.40) ¥ 137.50 = $82.50.
Target costing is the reverse of the cost-plus approach to pricing. The cost-plus ap-proach begins with what the firm expects its manufacturing costs to be and then sets its prices by adding its expected profit margin to the cost. This approach ignores the realities of competitive markets, in which prices are driven by market and customer factors. Target costing is a mechanism for ensuring that specifications are set in a way that allows the product to be competitively priced in the marketplace.
Some products are sold directly by a manufacturer to end users of the product. Fre-quently, products are distributed through one or more intermediate stages, such as dis-tributors and retailers. Exhibit 6-13 provides some approximate values of gross profit margins for different product categories.
Let M be the gross profit margin of a stage in the distribution channel.
MP C
P= −( )
where P is the price this stage charges its customers and C is the cost this stage pays for the product it sells. (Note that mark-up is similar to margin, but is defined slightly differently as P/C – 1, so that a margin of 50 percent is equivalent to a mark-up of 100 percent.)
Target cost, C, is given by the following expression:
C P Mii
n
= −=Π11( )
where P is the price paid by the end user, n is the number of stages in the distribution channel, and Mi is the margin of the ith stage.
EXAMPLEAssume the end user price, P, equals $250.
If the product is sold directly to the end user by the manufacturer, and the desired gross profit margin of the manufacturer, Mm, equals 0.40, then the target cost is
C = P(1 – Mm) = $250 (1 – 0.40) = $150
uLr04772_ch06_091-116.indd Page 114 3/28/11 9:04 PM F-501uLr04772_ch06_091-116.indd Page 114 3/28/11 9:04 PM F-501 208/MHBR233/uLr04772_disk1of1/0073404772/uLr04772_pagefiless208/MHBR233/uLr04772_disk1of1/0073404772/uLr04772_pagefiless

Product Specifications 115
EXHIBIT 6-13 Approximate margins for manufacturers, wholesalers, distributors, sales representatives, and retailers. Note that these values are quite approximate. Actual margins depend on many idiosyncratic factors, including competitive intensity, the volume of units sold, and the level of customer support required. Sales representatives are paid by commission and are not strictly part of the distribution channel. However, the team may wish to account for commissions in its analysis of target cost.
10 20 30 40 50 60 70 80 Percent
Price 2 CostPrice
Gross Margin
Manufacturers
Automobiles
Computers
Appliances
Consumer electronics
Sporting goods
Industrial equipment
Medical devices
Toys
Branded packaged goods
Consumer software
Retailers
Automobile dealers
Electronics
Mass merchandisers
Department stores
Specialty retailers
Mail order
Independent Sales Representatives
Sporting goods
Industrial products
Toys
Gifts and novelties
Wholesalers/Distributors
Computers
Branded packaged goods
Industrial products—materials, supplies
Industrial products—equipment
Medical devices
uLr04772_ch06_091-116.indd Page 115 3/28/11 9:04 PM F-501uLr04772_ch06_091-116.indd Page 115 3/28/11 9:04 PM F-501 208/MHBR233/uLr04772_disk1of1/0073404772/uLr04772_pagefiless208/MHBR233/uLr04772_disk1of1/0073404772/uLr04772_pagefiless

If the product is sold through a retailer, and the desired gross profit margin for the re-tailer, Mr, equals 0.45, then
C = P(1 – Mm)(1 – Mr)= $250 (1 – 0.40)(1 – 0.45) = $82.50
If the product is sold through a distributor and a retailer, and the desired gross profit margin for the distributor, Md, equals 0.20, then
C = P(1 – Mm)(1 – Md)(1 – Mr) = $250 (1 – 0.40)(1 – 0.20)(1 – 0.45) = $66.00
116 Chapter 6
uLr04772_ch06_091-116.indd Page 116 3/28/11 9:04 PM F-501uLr04772_ch06_091-116.indd Page 116 3/28/11 9:04 PM F-501 208/MHBR233/uLr04772_disk1of1/0073404772/uLr04772_pagefiless208/MHBR233/uLr04772_disk1of1/0073404772/uLr04772_pagefiless