chapter - v analysis and interpretation -...
TRANSCRIPT
87
CHAPTER - V
ANALYSIS AND INTERPRETATION
5.1 INTRODUCTION
In this chapter an attempt has been made to identify the factors that influenced the
purchase of Household Electronic Consumer Products. For this purpose, a field survey
method was employed to collect the first-hand information from 750 sample respondents.
The respondents have been chosen randomly from different parts of the study area. The
data thus collected were arranged into simple tabular form. The level of satisfaction
perceived by the respondents towards household electronic consumer products was
considered as a dependent variable. The independent variables selected for the study were
living place, age, gender, educational qualification, marital status, occupational status,
monthly income of the family, size of the family, nature of family, level of awareness,
number of products used, type of products used, mode of purchase and finally point of
purchase.
The data were analyzed by using some simple statistical tools like Percentage,
Average, Range, Standard Deviation, Two-way tables and Chi-Square test. In addition to
these tests, Multiple Correlation, Multiple Regression, Multi-Discriminant analysis and
Factor analysis were used appropriately. To further ease analysis and understanding seven
methods of tools/techniques are used and discussed.
I. Chi-Square Test
II. Percentage Analysis
III. Henry Garrett Ranking Technique
IV. Multiple Correlation Analysis
V. Multiple Regression Analysis
VI. Multi-Discriminant Analysis and
VII. Factor Analysis

88
1. CHI-SQUARE TEST
The level of satisfaction of consumers who utilized household electronic products
was measured based on their opinion on satisfaction perceived against their opinion in the
following aspects: Promotional offer, price, emotional value, model, convenience, after
sales service, warranty period, social status, standard of living, quality of product, festival
offers, discounts, power consumption, brand image, shop image, design, color, varieties,
availability, hygiene and packing. The respondents’ opinion were measured based on
scale scoring technique. Likert’s five points scaling was employed and the consumers’
level of satisfaction was classified as low (below 75), medium (76-90) and high (91-100)
based on mean and standard deviation.
TABLE NO. 5.1
LEVEL OF SATISFACTION OF THE RESPONDENTS
Sl. No. Category No. of
Respondents Percentage
1. Low (below 75) 115 15.3
2. Medium (76-90) 221 29.5
3. High (91-100) 414 55.2
Total 750 100.0
Source: Computed from Primary Data
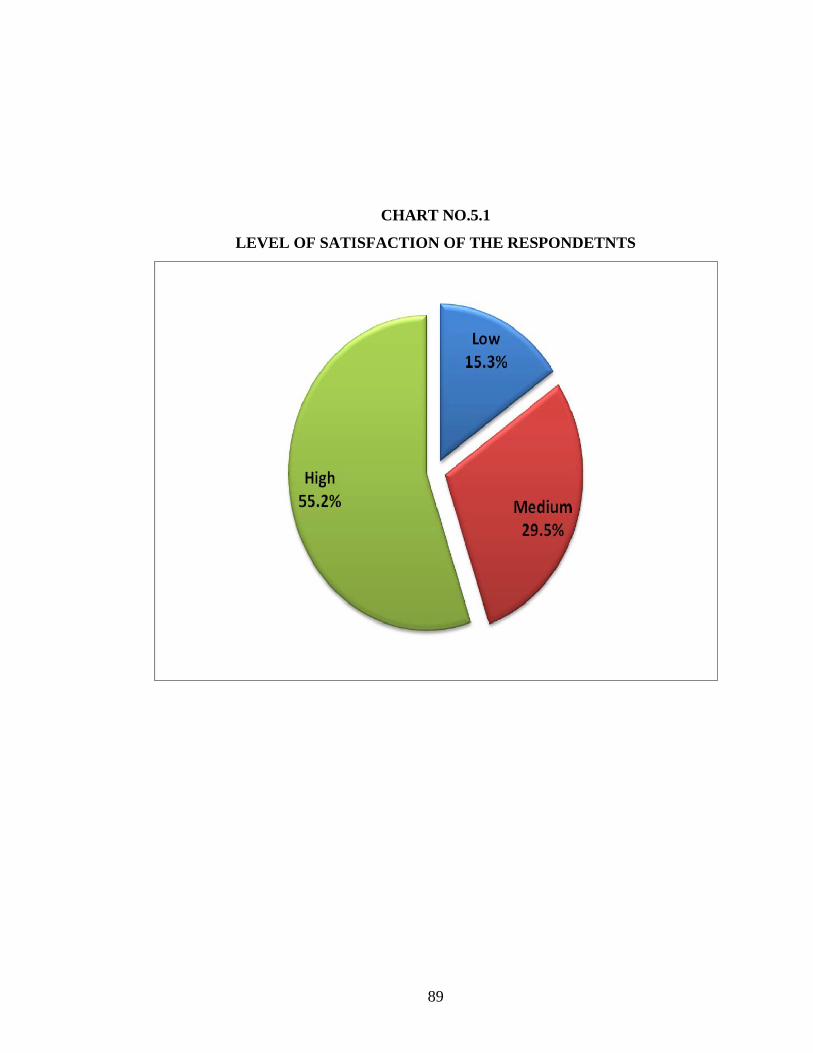
It is observed from the above table that 15.3 percent of the respondents expressed
their level of satisfaction at the low level. It is followed by 29.5 percent at the medium
level and 55.2 percent of the respondents expressed satisfaction at the high level. The two-
way analysis was prepared based on these three strata for data analysis and through this
method chi-square test was employed to test the relationship between the selected
independent variables and dependent variable.
It is concluded that majority (55.2%) of the respondents are highly satisfied with
regard to the household electronic products.
89
CHART NO.5.1
LEVEL OF SATISFACTION OF THE RESPONDETNTS
90
LIVING PLACE AND LEVEL OF SATISFACTION
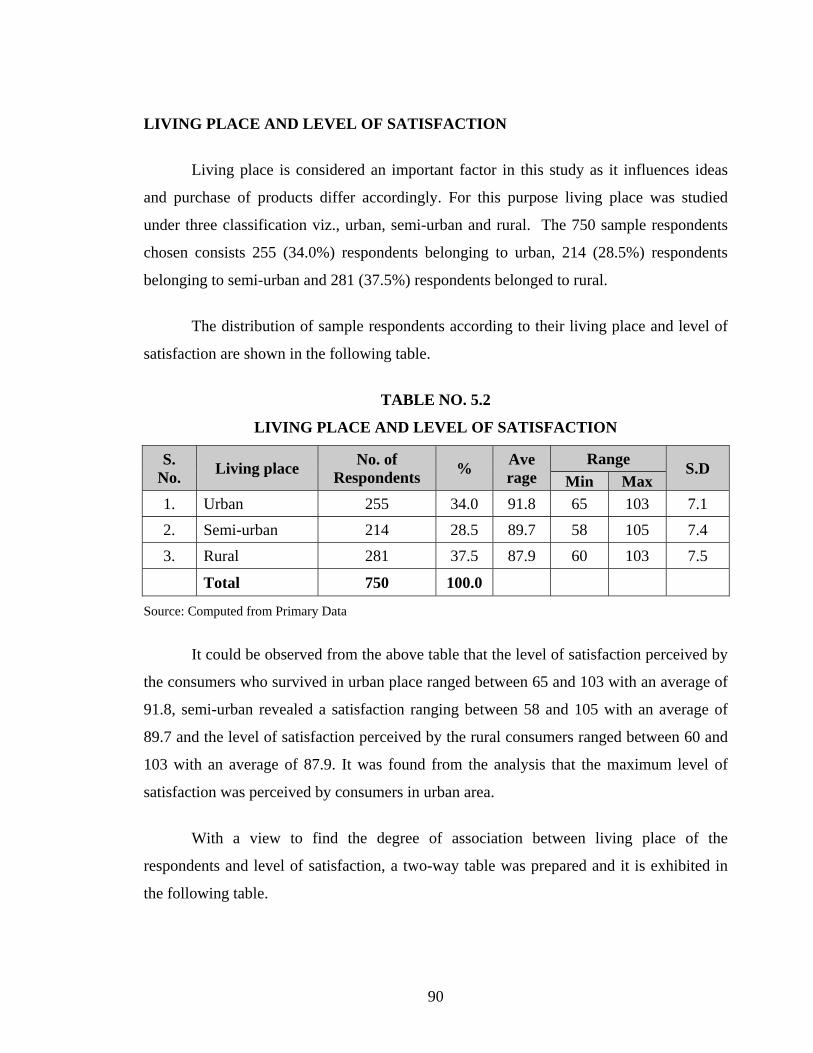
Living place is considered an important factor in this study as it influences ideas
and purchase of products differ accordingly. For this purpose living place was studied
under three classification viz., urban, semi-urban and rural. The 750 sample respondents
chosen consists 255 (34.0%) respondents belonging to urban, 214 (28.5%) respondents
belonging to semi-urban and 281 (37.5%) respondents belonged to rural.
The distribution of sample respondents according to their living place and level of
satisfaction are shown in the following table.
TABLE NO. 5.2
LIVING PLACE AND LEVEL OF SATISFACTION
S. No. Living place No. of
Respondents % Ave rage
Range S.D Min Max
1. Urban 255 34.0 91.8 65 103 7.1 2. Semi-urban 214 28.5 89.7 58 105 7.4 3. Rural 281 37.5 87.9 60 103 7.5
Total 750 100.0
Source: Computed from Primary Data
It could be observed from the above table that the level of satisfaction perceived by
the consumers who survived in urban place ranged between 65 and 103 with an average of
91.8, semi-urban revealed a satisfaction ranging between 58 and 105 with an average of
89.7 and the level of satisfaction perceived by the rural consumers ranged between 60 and
103 with an average of 87.9. It was found from the analysis that the maximum level of
satisfaction was perceived by consumers in urban area.
With a view to find the degree of association between living place of the
respondents and level of satisfaction, a two-way table was prepared and it is exhibited in
the following table.
91
TABLE NO. 5.3
LIVING PLACE AND LEVEL OF SATISFACTION
(TWO-WAY TABLE)
S. No. Living place
Level of satisfaction Total Low Medium High
1. Urban 35
(13.7%)
67
(26.3%)
153
(60.0%) 255
2. Semi-urban 24
(11.2%)
58
(27.1%)
132
(61.7%) 214
3. Rural 56
(19.9%)
96
(34.2%)
129
(45.9%) 281
Total 115 221 414 750
Source: Computed from Primary Data
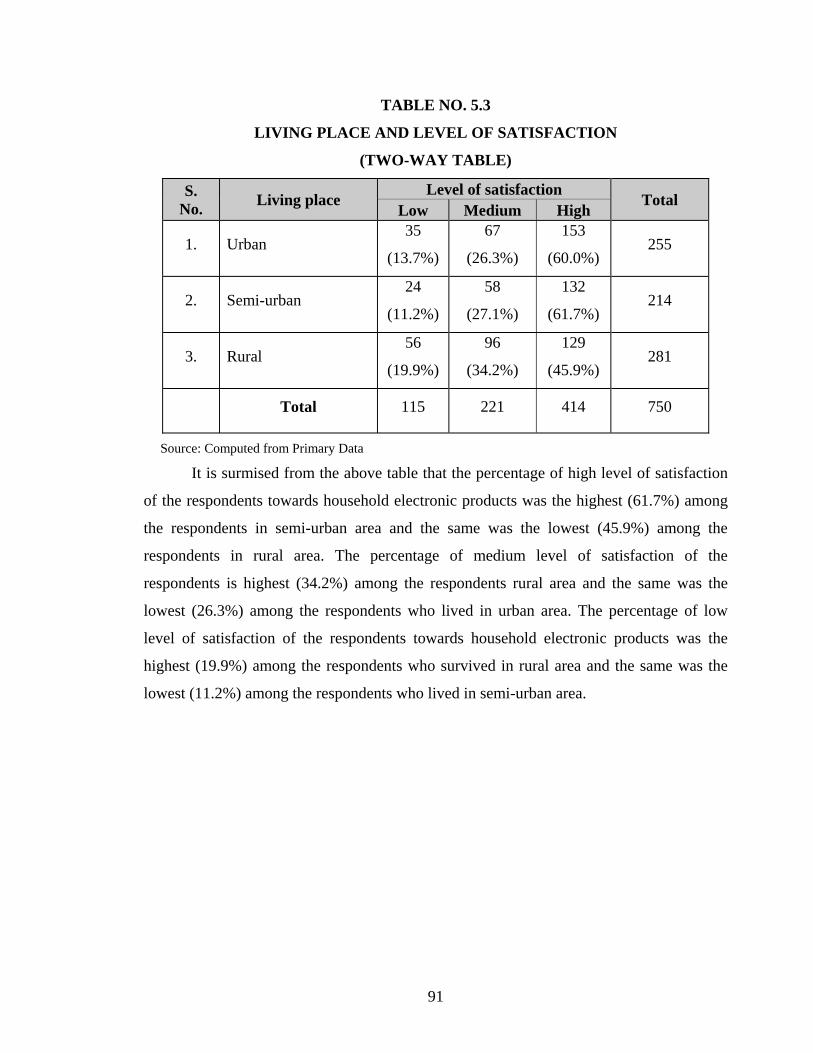
It is surmised from the above table that the percentage of high level of satisfaction
of the respondents towards household electronic products was the highest (61.7%) among
the respondents in semi-urban area and the same was the lowest (45.9%) among the
respondents in rural area. The percentage of medium level of satisfaction of the
respondents is highest (34.2%) among the respondents rural area and the same was the
lowest (26.3%) among the respondents who lived in urban area. The percentage of low
level of satisfaction of the respondents towards household electronic products was the
highest (19.9%) among the respondents who survived in rural area and the same was the
lowest (11.2%) among the respondents who lived in semi-urban area.

92
In order to find the relationship between the living area of the respondents and level
of satisfaction, the following null hypothesis has been framed and tested with the help of
Chi-square test and the result is shown in the following table.
H0 : There is no significant relationship between living place of the respondents
and their level of satisfaction.
H1 : There is a significant relationship between living place of the respondents
and their level of satisfaction.
TABLE NO. 5.4
LIVING PLACE AND LEVEL OF SATISFACTION
(CHI-SQUARE TEST)
Factor Calculated χ2 Value Table Value D.F Remarks
Living place 17.148 13.277 4 Significant at 1%
level
Source: Computed
It is evident from the above table that the calculated chi-square value is greater than
the table value and the result is significant at 1% level. Hence, the hypothesis, viz., “living
place of the respondents and level of satisfaction are not associated”, does not hold good.
From the analysis, it is found that there is a close relationship between the living place of
the respondents and level of satisfaction.

93
AGE AND LEVEL OF SATISFACTION
Age is a prominent factor in deciding the level of satisfaction towards the
household electronic products. For this purpose, age of the consumers was classified into
four groups viz., below 25 years, 26-35 years, 36-45 years and above 45 years. The
sample consists of 193 (25.7%) respondents below 25 years age group, 225 (30.0%)
respondents were of 26-35 years age group, 195 (26.0%) respondents were of 36-45 years
age group and 137 (18.3%) respondents belonged to above 45 years group.
The distribution of sample respondents according to the age of the respondents and
their level of satisfaction are shown in the following table.
TABLE NO. 5.5
AGE AND LEVEL OF SATISFACTION
S. No.
Age (in years)
No. of Respondents % Ave
rage
Range S.D Min Max
1. Below 25 193 25.7 89.8 65 104 7.9 2. 26-35 225 30.0 88.9 58 105 7.8 3. 36-45 195 26.0 90.2 65 103 7.3 4. Above 45 137 18.3 88.3 72 102 6.1 Total 750 100.0
Source: Computed from Primary Data
It could be observed from the above table that the level of satisfaction of the
respondents below 25 years towards household electronic products ranged between 65 and
104 with an average of 89.8. The respondents in the age group between 26 and 35 years
revealed their level of satisfaction ranging between 58 and 105 with an average of 88.9, the
level of satisfaction of the respondents between 36 and 45 years age group ranged between
65 and 103 with an average of 90.2 and respondents in the above 45 years group revealed
their level of satisfaction ranging between 72 and 102 with an average of 88.3. It was
found from the analysis that the maximum level of satisfaction of the respondents towards
household electronic products was among the age group between 36 and 45 years.
94
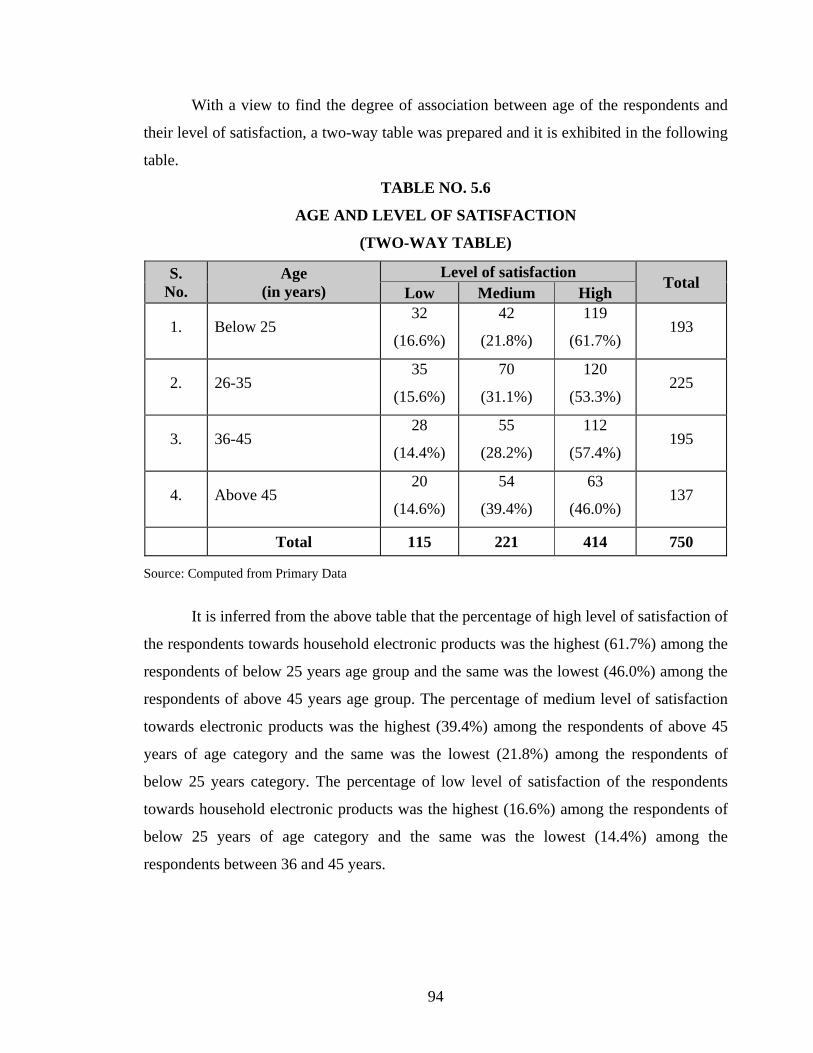
With a view to find the degree of association between age of the respondents and
their level of satisfaction, a two-way table was prepared and it is exhibited in the following
table.
TABLE NO. 5.6
AGE AND LEVEL OF SATISFACTION
(TWO-WAY TABLE)
S. No.
Age (in years)
Level of satisfaction Total Low Medium High
1. Below 25 32
(16.6%)
42
(21.8%)
119
(61.7%) 193
2. 26-35 35
(15.6%)
70
(31.1%)
120
(53.3%) 225
3. 36-45 28
(14.4%)
55
(28.2%)
112
(57.4%) 195
4. Above 45 20
(14.6%)
54
(39.4%)
63
(46.0%) 137
Total 115 221 414 750
Source: Computed from Primary Data
It is inferred from the above table that the percentage of high level of satisfaction of
the respondents towards household electronic products was the highest (61.7%) among the
respondents of below 25 years age group and the same was the lowest (46.0%) among the
respondents of above 45 years age group. The percentage of medium level of satisfaction
towards electronic products was the highest (39.4%) among the respondents of above 45
years of age category and the same was the lowest (21.8%) among the respondents of
below 25 years category. The percentage of low level of satisfaction of the respondents
towards household electronic products was the highest (16.6%) among the respondents of
below 25 years of age category and the same was the lowest (14.4%) among the
respondents between 36 and 45 years.
95
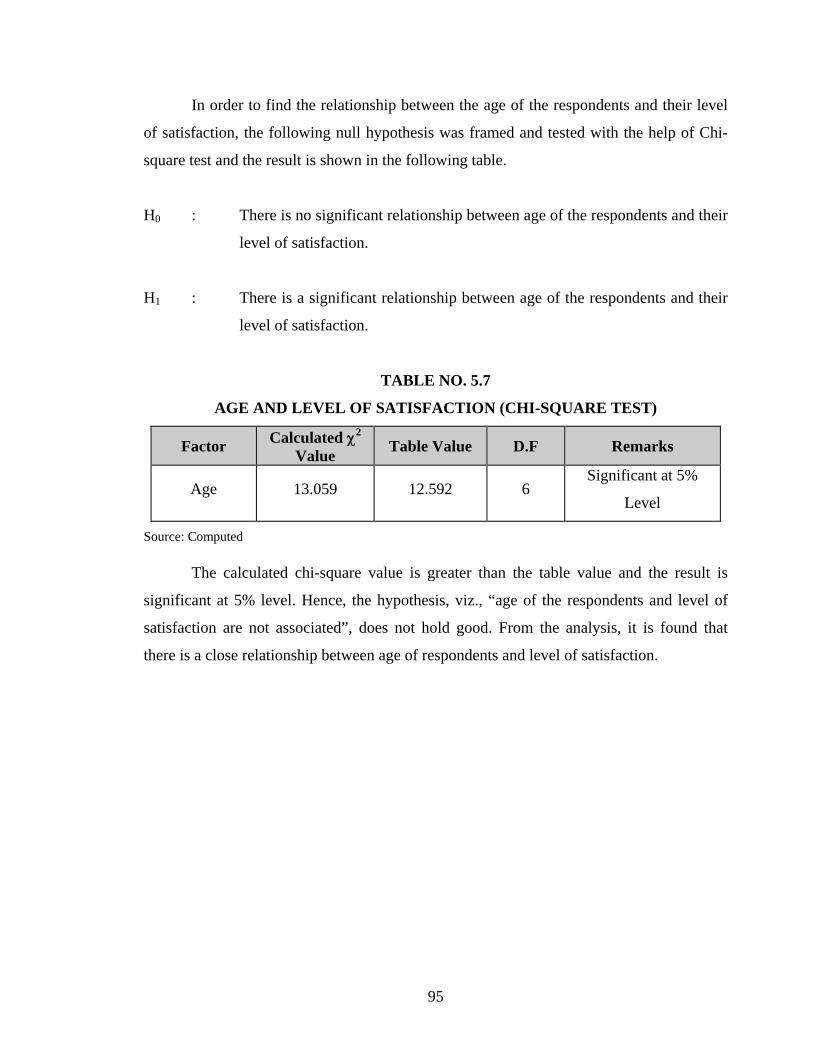
In order to find the relationship between the age of the respondents and their level
of satisfaction, the following null hypothesis was framed and tested with the help of Chi-
square test and the result is shown in the following table.
H0 : There is no significant relationship between age of the respondents and their
level of satisfaction.
H1 : There is a significant relationship between age of the respondents and their
level of satisfaction.
TABLE NO. 5.7
AGE AND LEVEL OF SATISFACTION (CHI-SQUARE TEST)
Factor Calculated χ2 Value Table Value D.F Remarks
Age 13.059 12.592 6 Significant at 5%
Level
Source: Computed
The calculated chi-square value is greater than the table value and the result is
significant at 5% level. Hence, the hypothesis, viz., “age of the respondents and level of
satisfaction are not associated”, does not hold good. From the analysis, it is found that
there is a close relationship between age of respondents and level of satisfaction.
96
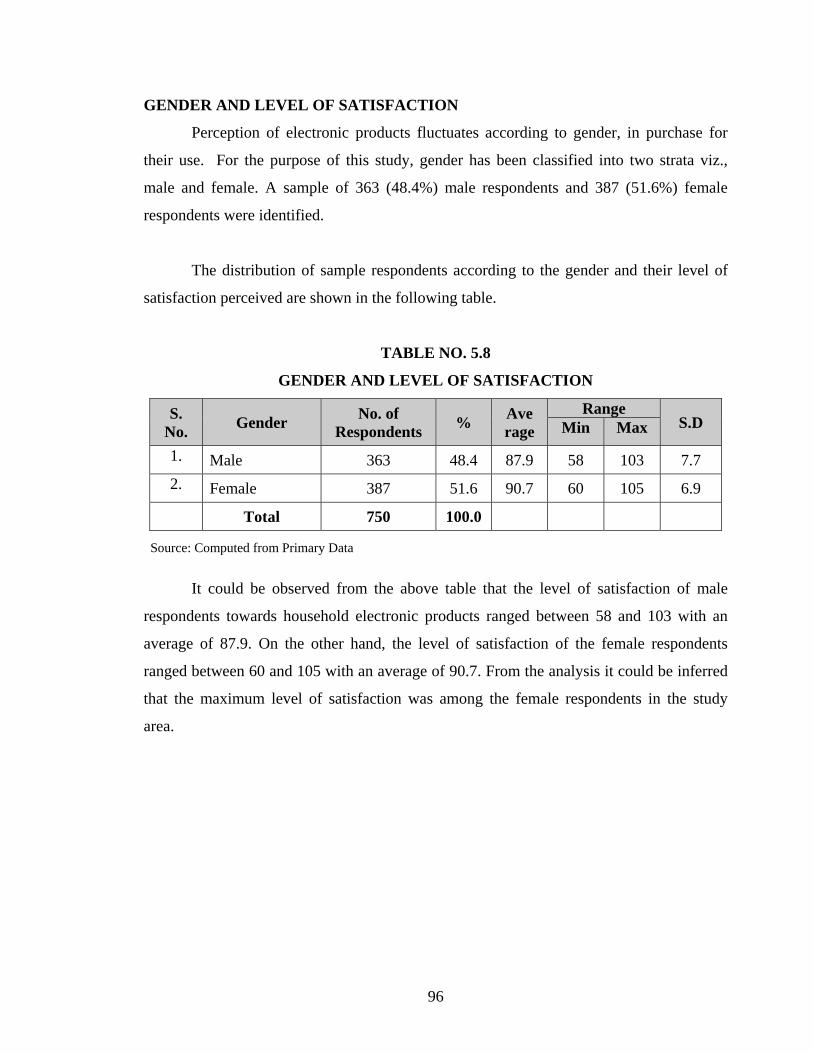
GENDER AND LEVEL OF SATISFACTION
Perception of electronic products fluctuates according to gender, in purchase for
their use. For the purpose of this study, gender has been classified into two strata viz.,
male and female. A sample of 363 (48.4%) male respondents and 387 (51.6%) female
respondents were identified.
The distribution of sample respondents according to the gender and their level of
satisfaction perceived are shown in the following table.
TABLE NO. 5.8
GENDER AND LEVEL OF SATISFACTION
S. No. Gender No. of
Respondents % Ave rage
Range S.D Min Max
1. Male 363 48.4 87.9 58 103 7.7 2. Female 387 51.6 90.7 60 105 6.9 Total 750 100.0
Source: Computed from Primary Data
It could be observed from the above table that the level of satisfaction of male
respondents towards household electronic products ranged between 58 and 103 with an
average of 87.9. On the other hand, the level of satisfaction of the female respondents
ranged between 60 and 105 with an average of 90.7. From the analysis it could be inferred
that the maximum level of satisfaction was among the female respondents in the study
area.
97
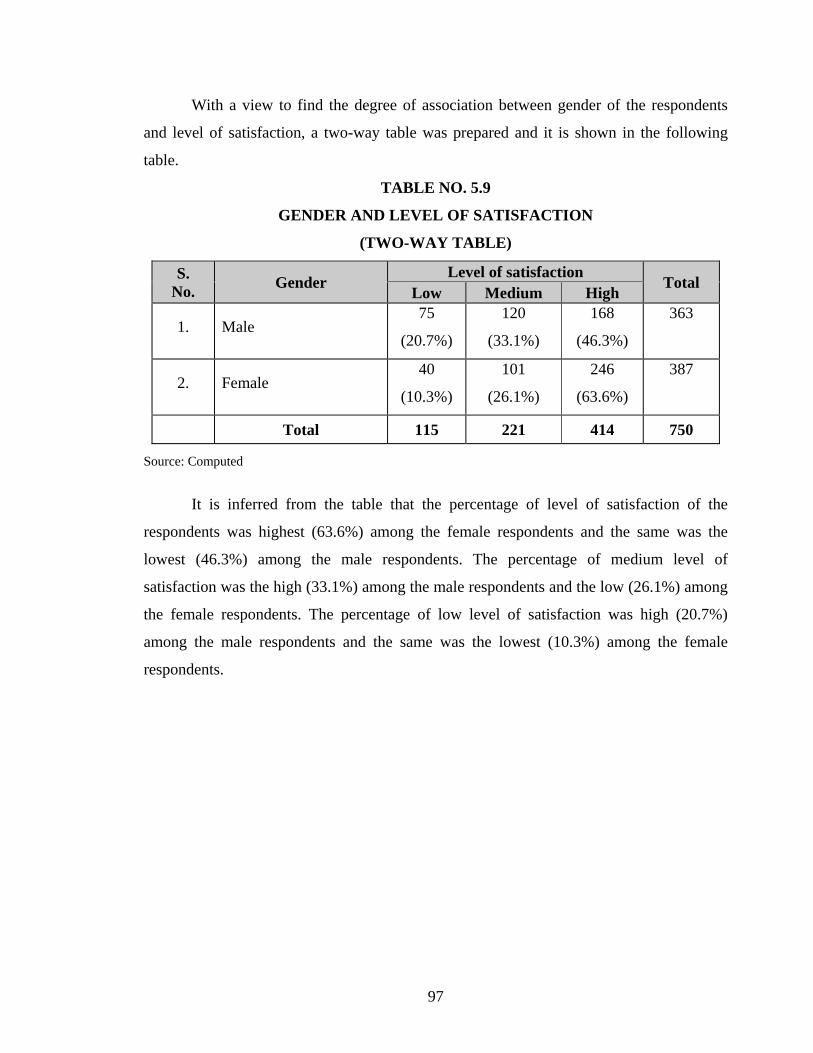
With a view to find the degree of association between gender of the respondents
and level of satisfaction, a two-way table was prepared and it is shown in the following
table.
TABLE NO. 5.9
GENDER AND LEVEL OF SATISFACTION
(TWO-WAY TABLE)
S. No. Gender
Level of satisfaction Total Low Medium High
1. Male 75
(20.7%)
120
(33.1%)
168
(46.3%)
363
2. Female 40
(10.3%)
101
(26.1%)
246
(63.6%)
387
Total 115 221 414 750
Source: Computed
It is inferred from the table that the percentage of level of satisfaction of the
respondents was highest (63.6%) among the female respondents and the same was the
lowest (46.3%) among the male respondents. The percentage of medium level of
satisfaction was the high (33.1%) among the male respondents and the low (26.1%) among
the female respondents. The percentage of low level of satisfaction was high (20.7%)
among the male respondents and the same was the lowest (10.3%) among the female
respondents.
98
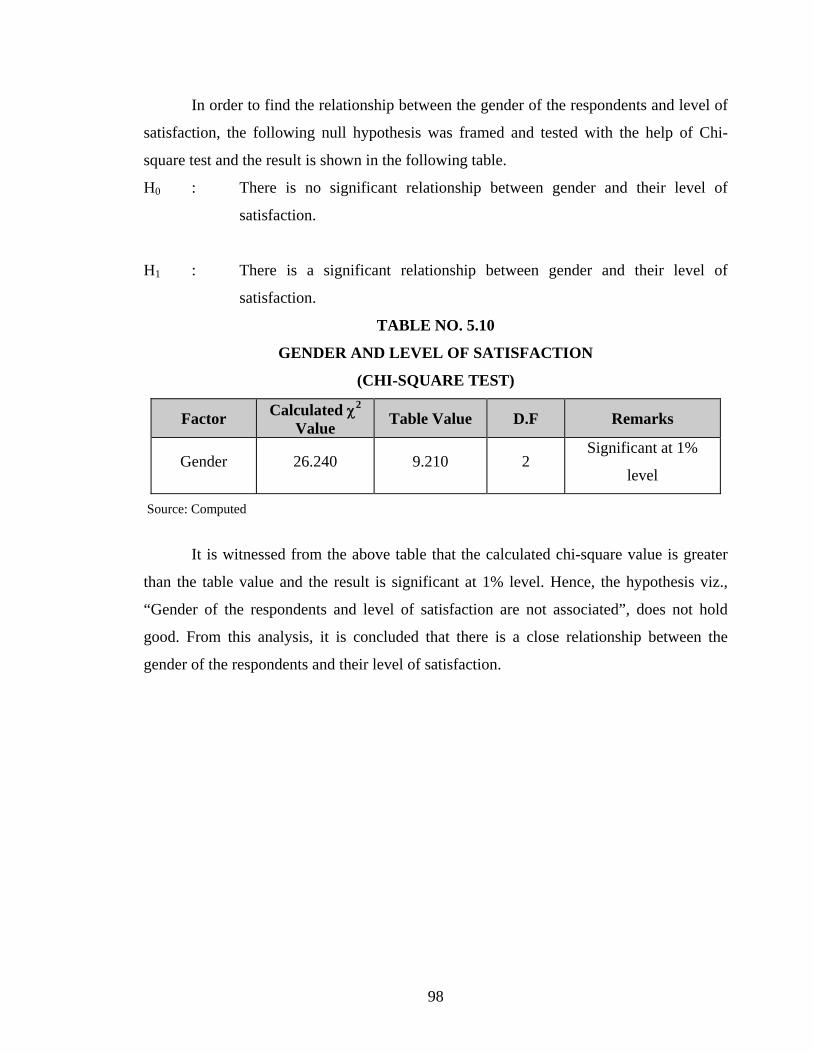
In order to find the relationship between the gender of the respondents and level of
satisfaction, the following null hypothesis was framed and tested with the help of Chi-
square test and the result is shown in the following table.
H0 : There is no significant relationship between gender and their level of
satisfaction.
H1 : There is a significant relationship between gender and their level of
satisfaction.
TABLE NO. 5.10
GENDER AND LEVEL OF SATISFACTION
(CHI-SQUARE TEST)
Factor Calculated χ2 Value Table Value D.F Remarks
Gender 26.240 9.210 2 Significant at 1%
level
Source: Computed
It is witnessed from the above table that the calculated chi-square value is greater
than the table value and the result is significant at 1% level. Hence, the hypothesis viz.,
“Gender of the respondents and level of satisfaction are not associated”, does not hold
good. From this analysis, it is concluded that there is a close relationship between the
gender of the respondents and their level of satisfaction.
99
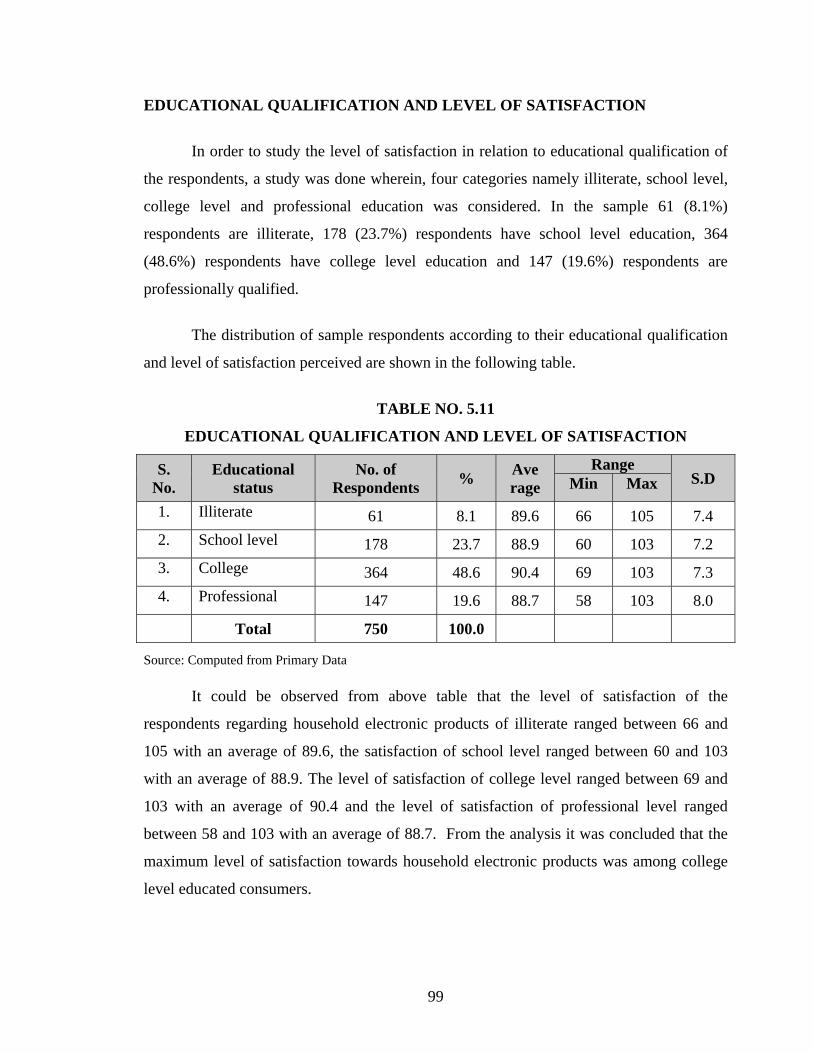
EDUCATIONAL QUALIFICATION AND LEVEL OF SATISFACTION
In order to study the level of satisfaction in relation to educational qualification of
the respondents, a study was done wherein, four categories namely illiterate, school level,
college level and professional education was considered. In the sample 61 (8.1%)
respondents are illiterate, 178 (23.7%) respondents have school level education, 364
(48.6%) respondents have college level education and 147 (19.6%) respondents are
professionally qualified.
The distribution of sample respondents according to their educational qualification
and level of satisfaction perceived are shown in the following table.
TABLE NO. 5.11
EDUCATIONAL QUALIFICATION AND LEVEL OF SATISFACTION
S. No.
Educational status
No. of Respondents % Ave
rage Range
S.D Min Max
1. Illiterate 61 8.1 89.6 66 105 7.4 2. School level 178 23.7 88.9 60 103 7.2 3. College 364 48.6 90.4 69 103 7.3 4. Professional 147 19.6 88.7 58 103 8.0 Total 750 100.0
Source: Computed from Primary Data
It could be observed from above table that the level of satisfaction of the
respondents regarding household electronic products of illiterate ranged between 66 and
105 with an average of 89.6, the satisfaction of school level ranged between 60 and 103
with an average of 88.9. The level of satisfaction of college level ranged between 69 and
103 with an average of 90.4 and the level of satisfaction of professional level ranged
between 58 and 103 with an average of 88.7. From the analysis it was concluded that the
maximum level of satisfaction towards household electronic products was among college
level educated consumers.
100
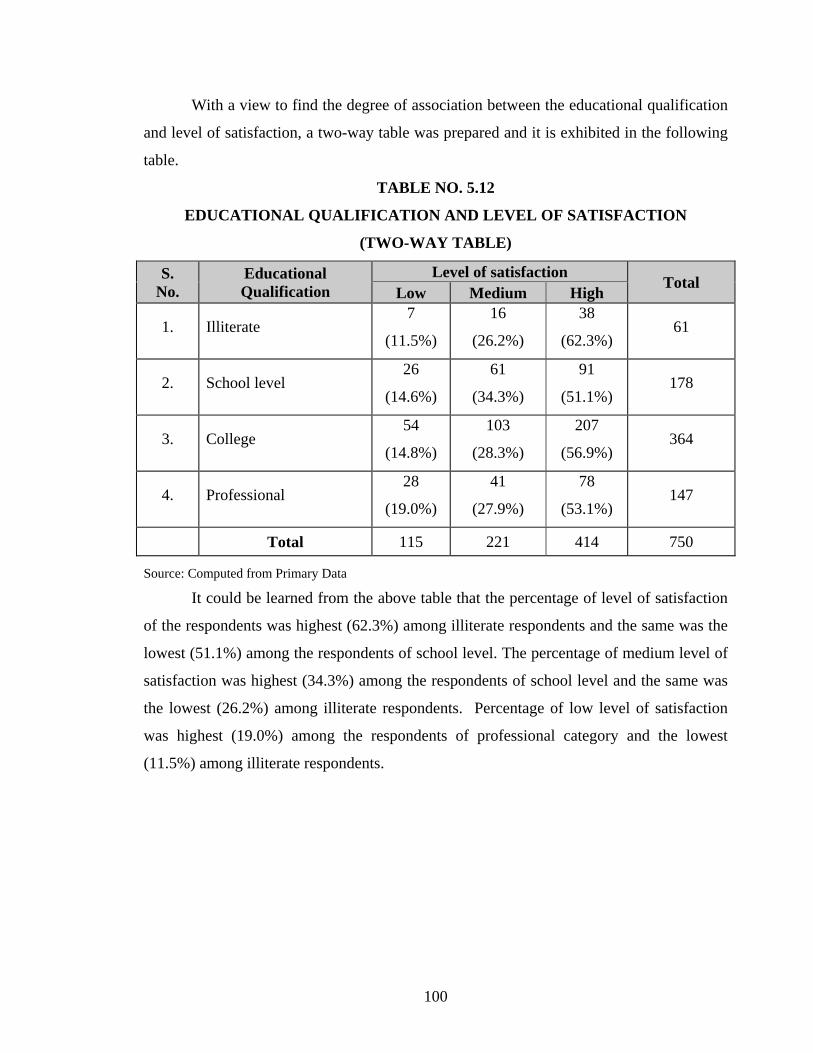
With a view to find the degree of association between the educational qualification
and level of satisfaction, a two-way table was prepared and it is exhibited in the following
table.
TABLE NO. 5.12
EDUCATIONAL QUALIFICATION AND LEVEL OF SATISFACTION
(TWO-WAY TABLE)
S. No.
Educational Qualification
Level of satisfaction Total Low Medium High
1. Illiterate 7
(11.5%)
16
(26.2%)
38
(62.3%) 61
2. School level 26
(14.6%)
61
(34.3%)
91
(51.1%) 178
3. College 54
(14.8%)
103
(28.3%)
207
(56.9%) 364
4. Professional 28
(19.0%)
41
(27.9%)
78
(53.1%) 147
Total 115 221 414 750
Source: Computed from Primary Data
It could be learned from the above table that the percentage of level of satisfaction
of the respondents was highest (62.3%) among illiterate respondents and the same was the
lowest (51.1%) among the respondents of school level. The percentage of medium level of
satisfaction was highest (34.3%) among the respondents of school level and the same was
the lowest (26.2%) among illiterate respondents. Percentage of low level of satisfaction
was highest (19.0%) among the respondents of professional category and the lowest
(11.5%) among illiterate respondents.

101
In order to find the relationship between the educational qualification of the
respondents and level of satisfaction, the following null hypothesis was framed and tested
with the help of Chi-square test and the result is shown in the following table.
H0 : There is no significant relationship between educational qualification and
level of satisfaction.
H1 : There is a significant relationship between educational qualification and
level of satisfaction.
TABLE NO. 5.13
EDUCATIONAL QUALIFICATION AND LEVEL OF SATISFACTION
(CHI-SQUARE TEST)
Factor Calculated χ2 Value Table Value D.F Remarks
Educational
status 5.336 12.592 6 Not Significant
Source: Computed It is divulged from the table that the calculated chi-square value is less than the
table value and the result is not significant. Hence, the hypothesis “education qualification
of the respondents and their level of satisfaction are not associated”, holds good. From the
analysis it is concluded that there is no relationship between educational qualification of
the respondents and level of satisfaction.

102
MARITAL STATUS AND LEVEL OF SATISFACTION
Marital status plays an important role in purchase of household electronic products
and study was conducted to learn their level of satisfaction under two categories namely
married and unmarried. The sample chosen consists 383 (51.1%) married respondents and
367 (48.9%) in unmarried category.
The distribution of sample respondents according to the marital status of the
respondents and level of satisfaction are shown in the following table.
TABLE NO. 5.14
MARITAL STATUS AND LEVEL OF SATISFACTION
S.
No. Marital status No. of
Respondents % Ave rage
Range S.D Min Max
1. Married 383 51.1 89.7 65 105 7.5 2. Unmarried 367 48.9 89.0 58 104 7.3 Total 750 100.0
Source: Computed from Primary Data
It could be inferred from the above table that the level of satisfaction of the
respondents towards household electronic products by the married respondents ranged
between 65 and 105 with an average of 89.7 percent and the level of satisfaction of the
respondents towards household electronic products by the unmarried respondents ranged
between 58 and 104 with an average of 89.0. From the analysis it was concluded that the
maximum level of satisfaction was attained by married consumers towards household
electronic products.
103
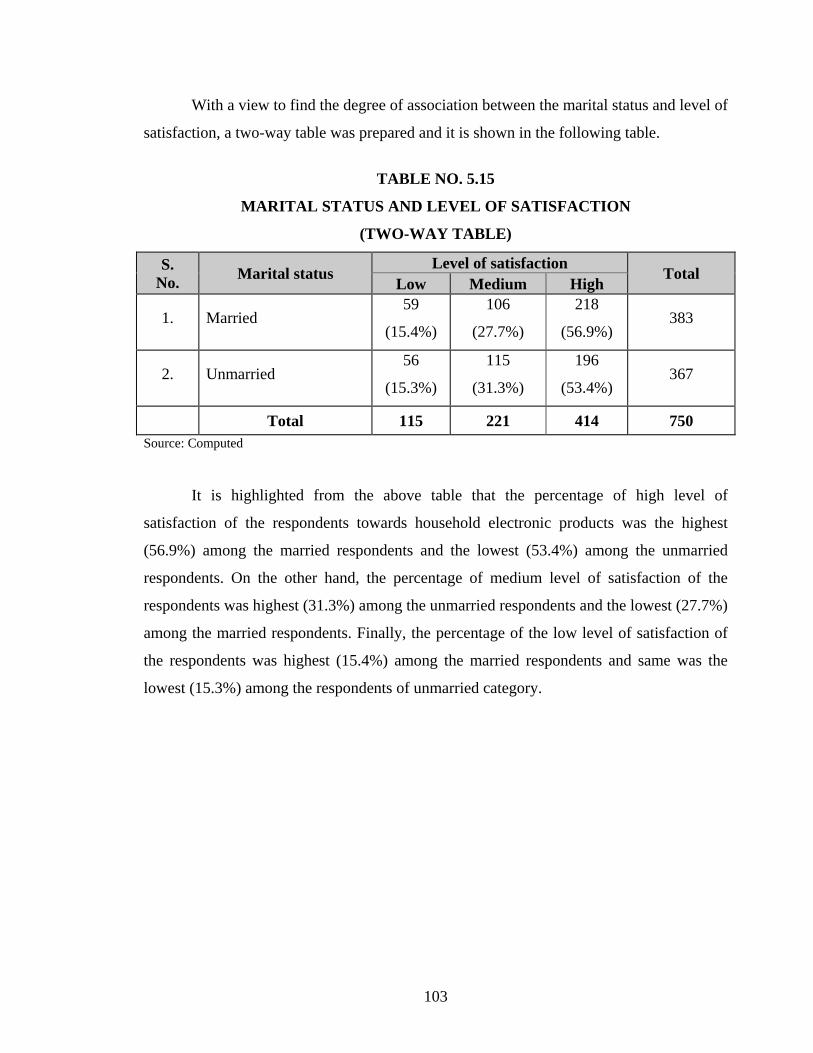
With a view to find the degree of association between the marital status and level of
satisfaction, a two-way table was prepared and it is shown in the following table.
TABLE NO. 5.15
MARITAL STATUS AND LEVEL OF SATISFACTION
(TWO-WAY TABLE)
S. No. Marital status Level of satisfaction Total Low Medium High
1. Married 59
(15.4%)
106
(27.7%)
218
(56.9%) 383
2. Unmarried 56
(15.3%)
115
(31.3%)
196
(53.4%) 367
Total 115 221 414 750 Source: Computed
It is highlighted from the above table that the percentage of high level of
satisfaction of the respondents towards household electronic products was the highest
(56.9%) among the married respondents and the lowest (53.4%) among the unmarried
respondents. On the other hand, the percentage of medium level of satisfaction of the
respondents was highest (31.3%) among the unmarried respondents and the lowest (27.7%)
among the married respondents. Finally, the percentage of the low level of satisfaction of
the respondents was highest (15.4%) among the married respondents and same was the
lowest (15.3%) among the respondents of unmarried category.
104
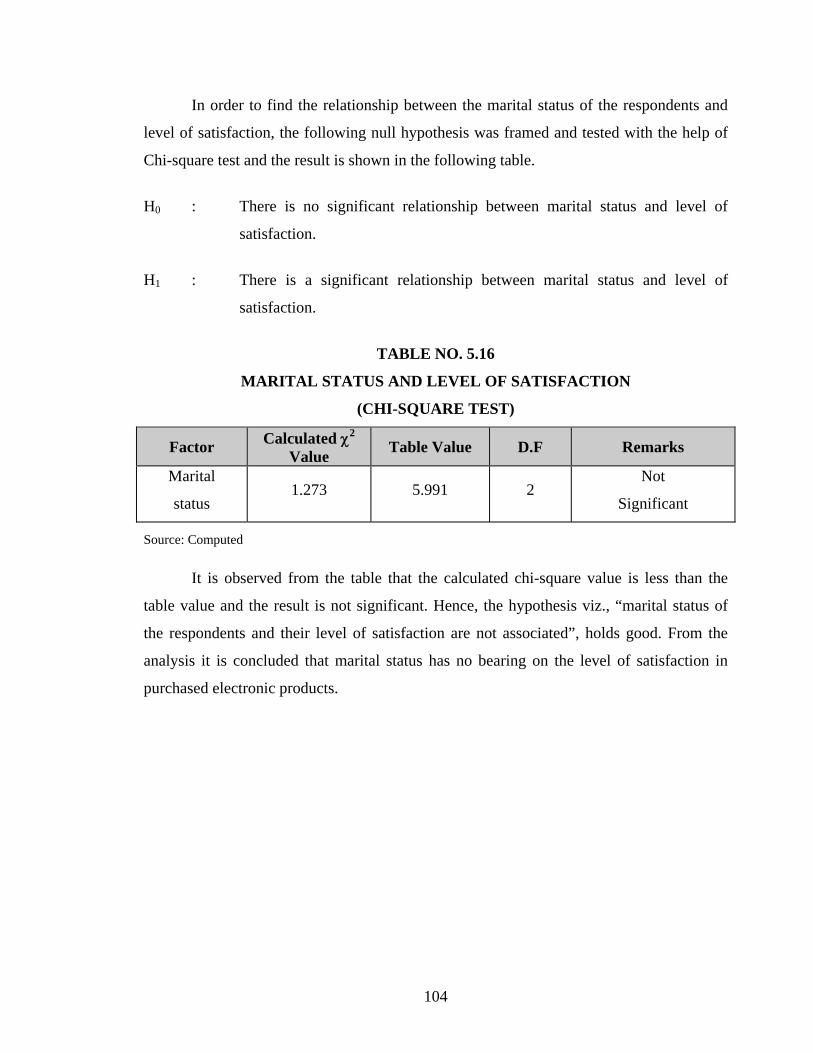
In order to find the relationship between the marital status of the respondents and
level of satisfaction, the following null hypothesis was framed and tested with the help of
Chi-square test and the result is shown in the following table.
H0 : There is no significant relationship between marital status and level of
satisfaction.
H1 : There is a significant relationship between marital status and level of
satisfaction.
TABLE NO. 5.16
MARITAL STATUS AND LEVEL OF SATISFACTION
(CHI-SQUARE TEST)
Factor Calculated χ2 Value Table Value D.F Remarks
Marital
status 1.273 5.991 2
Not
Significant
Source: Computed
It is observed from the table that the calculated chi-square value is less than the
table value and the result is not significant. Hence, the hypothesis viz., “marital status of
the respondents and their level of satisfaction are not associated”, holds good. From the
analysis it is concluded that marital status has no bearing on the level of satisfaction in
purchased electronic products.
105
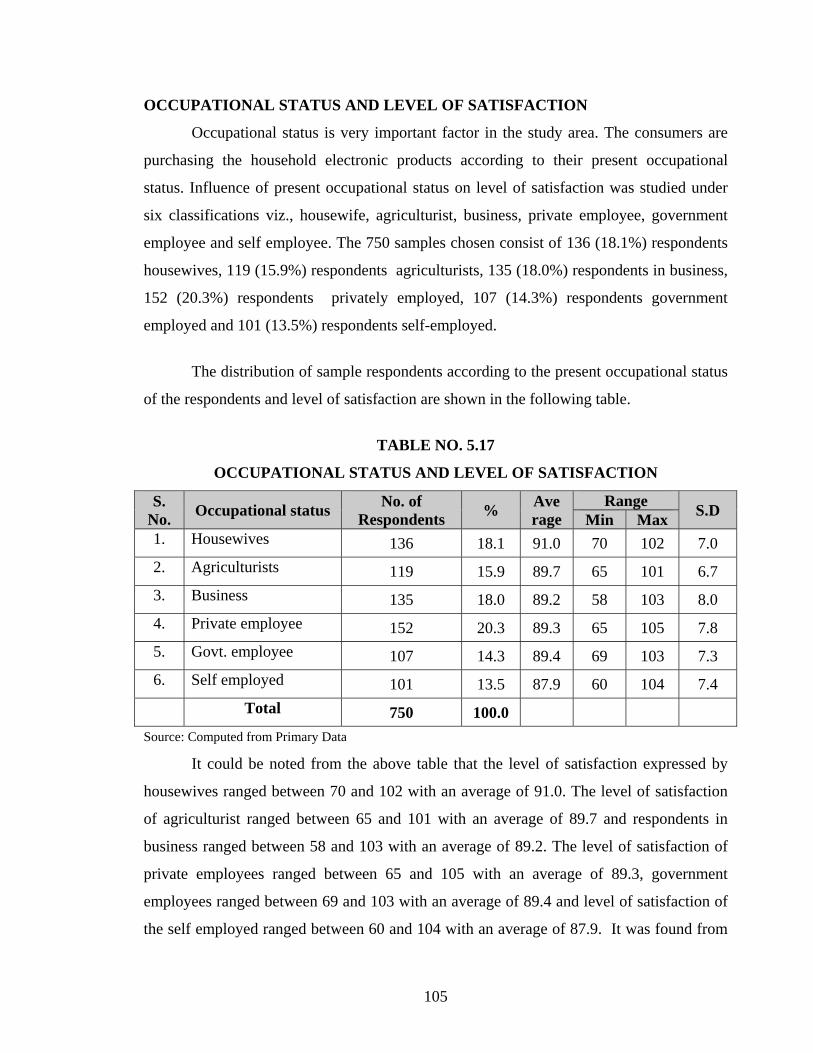
OCCUPATIONAL STATUS AND LEVEL OF SATISFACTION
Occupational status is very important factor in the study area. The consumers are
purchasing the household electronic products according to their present occupational
status. Influence of present occupational status on level of satisfaction was studied under
six classifications viz., housewife, agriculturist, business, private employee, government
employee and self employee. The 750 samples chosen consist of 136 (18.1%) respondents
housewives, 119 (15.9%) respondents agriculturists, 135 (18.0%) respondents in business,
152 (20.3%) respondents privately employed, 107 (14.3%) respondents government
employed and 101 (13.5%) respondents self-employed.
The distribution of sample respondents according to the present occupational status
of the respondents and level of satisfaction are shown in the following table.
TABLE NO. 5.17
OCCUPATIONAL STATUS AND LEVEL OF SATISFACTION
S. No. Occupational status No. of
Respondents % Ave rage
Range S.D Min Max 1. Housewives 136 18.1 91.0 70 102 7.0 2. Agriculturists 119 15.9 89.7 65 101 6.7 3. Business 135 18.0 89.2 58 103 8.0 4. Private employee 152 20.3 89.3 65 105 7.8 5. Govt. employee 107 14.3 89.4 69 103 7.3 6. Self employed 101 13.5 87.9 60 104 7.4 Total 750 100.0
Source: Computed from Primary Data
It could be noted from the above table that the level of satisfaction expressed by
housewives ranged between 70 and 102 with an average of 91.0. The level of satisfaction
of agriculturist ranged between 65 and 101 with an average of 89.7 and respondents in
business ranged between 58 and 103 with an average of 89.2. The level of satisfaction of
private employees ranged between 65 and 105 with an average of 89.3, government
employees ranged between 69 and 103 with an average of 89.4 and level of satisfaction of
the self employed ranged between 60 and 104 with an average of 87.9. It was found from
106
the analysis that the maximum level of satisfaction is perceived by housewives towards
utilizing household electronic products.
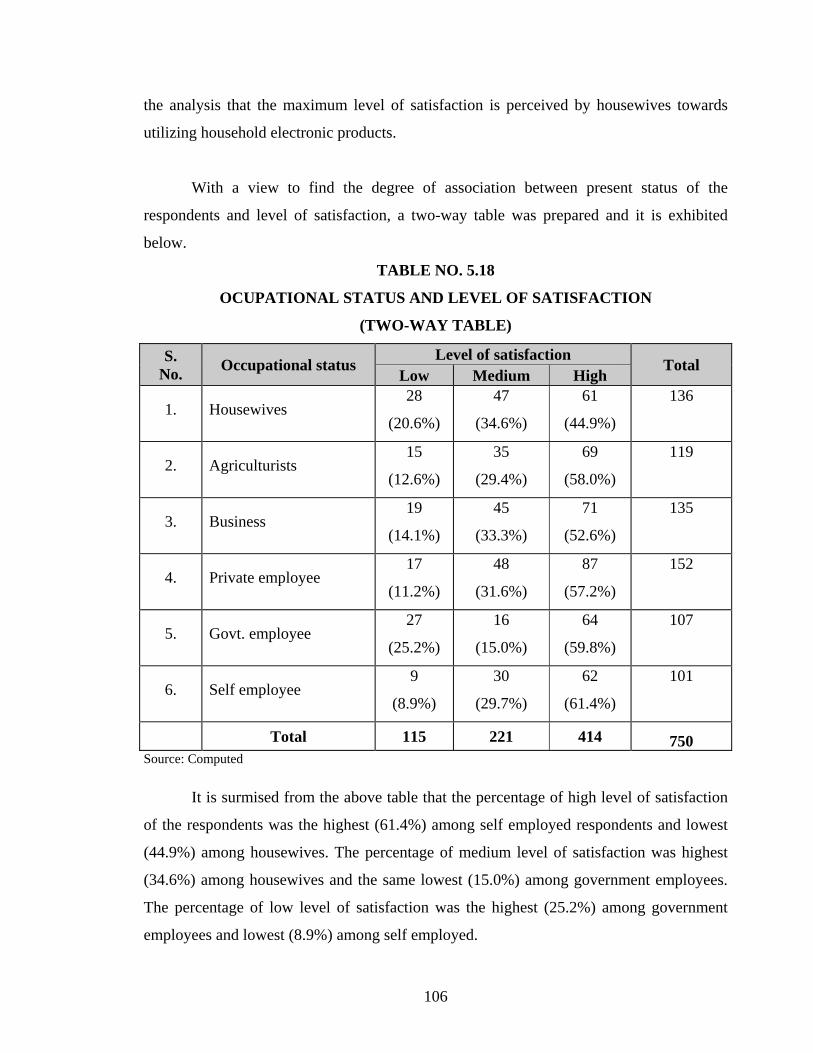
With a view to find the degree of association between present status of the
respondents and level of satisfaction, a two-way table was prepared and it is exhibited
below.
TABLE NO. 5.18
OCUPATIONAL STATUS AND LEVEL OF SATISFACTION
(TWO-WAY TABLE)
S. No. Occupational status Level of satisfaction Total
Low Medium High
1. Housewives 28
(20.6%)
47
(34.6%)
61
(44.9%)
136
2. Agriculturists 15
(12.6%)
35
(29.4%)
69
(58.0%)
119
3. Business 19
(14.1%)
45
(33.3%)
71
(52.6%)
135
4. Private employee 17
(11.2%)
48
(31.6%)
87
(57.2%)
152
5. Govt. employee 27
(25.2%)
16
(15.0%)
64
(59.8%)
107
6. Self employee 9
(8.9%)
30
(29.7%)
62
(61.4%)
101
Total 115 221 414 750 Source: Computed
It is surmised from the above table that the percentage of high level of satisfaction
of the respondents was the highest (61.4%) among self employed respondents and lowest
(44.9%) among housewives. The percentage of medium level of satisfaction was highest
(34.6%) among housewives and the same lowest (15.0%) among government employees.
The percentage of low level of satisfaction was the highest (25.2%) among government
employees and lowest (8.9%) among self employed.
107
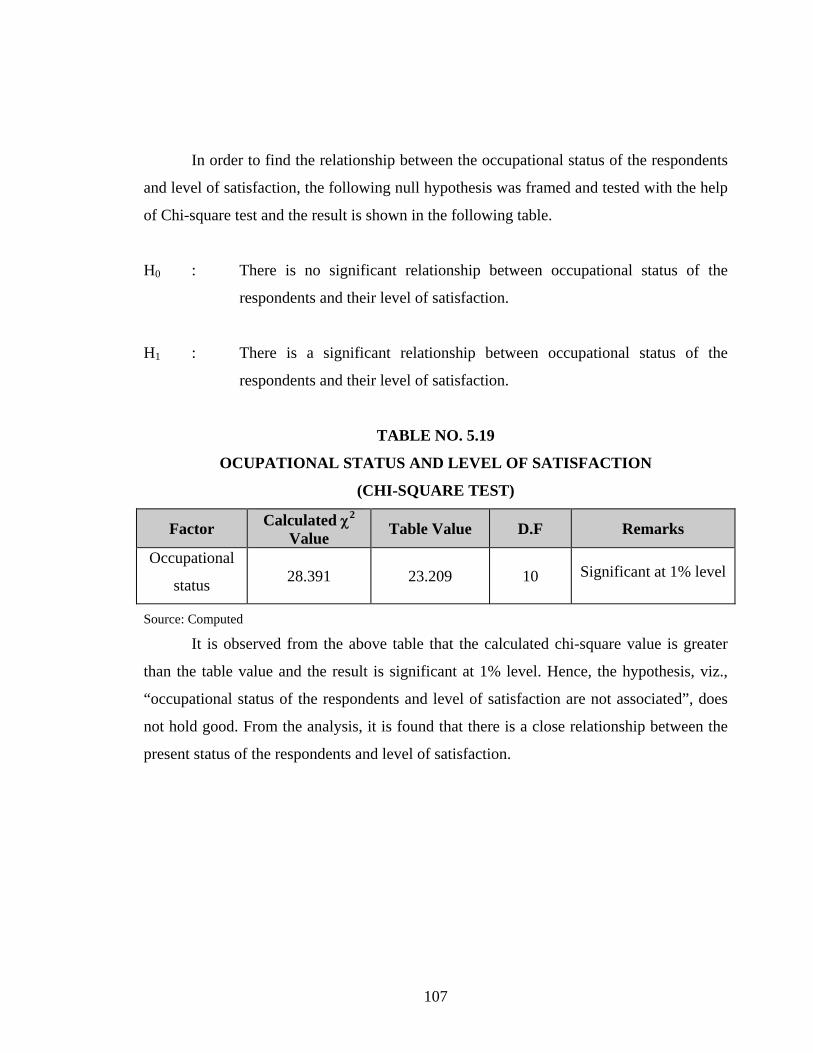
In order to find the relationship between the occupational status of the respondents
and level of satisfaction, the following null hypothesis was framed and tested with the help
of Chi-square test and the result is shown in the following table.
H0 : There is no significant relationship between occupational status of the
respondents and their level of satisfaction.
H1 : There is a significant relationship between occupational status of the
respondents and their level of satisfaction.
TABLE NO. 5.19
OCUPATIONAL STATUS AND LEVEL OF SATISFACTION
(CHI-SQUARE TEST)
Factor Calculated χ2 Value Table Value D.F Remarks
Occupational
status 28.391 23.209 10 Significant at 1% level
Source: Computed
It is observed from the above table that the calculated chi-square value is greater
than the table value and the result is significant at 1% level. Hence, the hypothesis, viz.,
“occupational status of the respondents and level of satisfaction are not associated”, does
not hold good. From the analysis, it is found that there is a close relationship between the
present status of the respondents and level of satisfaction.
108
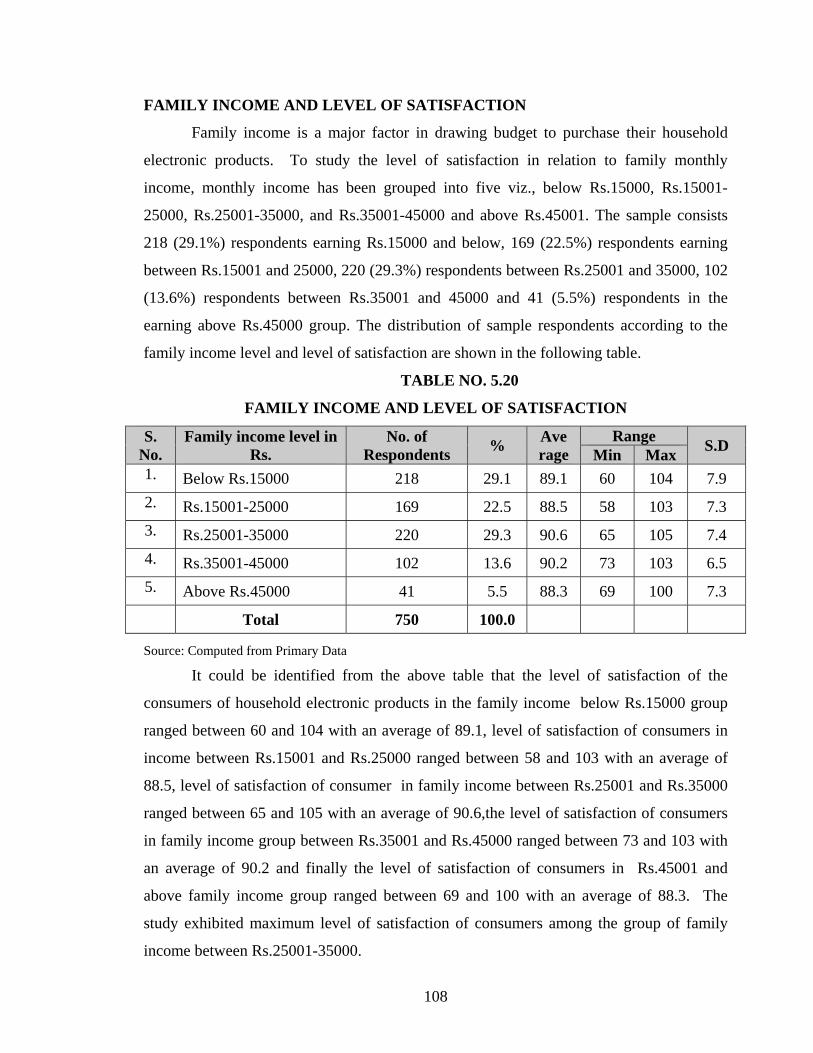
FAMILY INCOME AND LEVEL OF SATISFACTION
Family income is a major factor in drawing budget to purchase their household
electronic products. To study the level of satisfaction in relation to family monthly
income, monthly income has been grouped into five viz., below Rs.15000, Rs.15001-
25000, Rs.25001-35000, and Rs.35001-45000 and above Rs.45001. The sample consists
218 (29.1%) respondents earning Rs.15000 and below, 169 (22.5%) respondents earning
between Rs.15001 and 25000, 220 (29.3%) respondents between Rs.25001 and 35000, 102
(13.6%) respondents between Rs.35001 and 45000 and 41 (5.5%) respondents in the
earning above Rs.45000 group. The distribution of sample respondents according to the
family income level and level of satisfaction are shown in the following table.
TABLE NO. 5.20
FAMILY INCOME AND LEVEL OF SATISFACTION
S. No.
Family income level in Rs.
No. of Respondents % Ave
rage Range S.D Min Max
1. Below Rs.15000 218 29.1 89.1 60 104 7.9 2. Rs.15001-25000 169 22.5 88.5 58 103 7.3 3. Rs.25001-35000 220 29.3 90.6 65 105 7.4 4. Rs.35001-45000 102 13.6 90.2 73 103 6.5 5. Above Rs.45000 41 5.5 88.3 69 100 7.3 Total 750 100.0
Source: Computed from Primary Data
It could be identified from the above table that the level of satisfaction of the
consumers of household electronic products in the family income below Rs.15000 group
ranged between 60 and 104 with an average of 89.1, level of satisfaction of consumers in
income between Rs.15001 and Rs.25000 ranged between 58 and 103 with an average of
88.5, level of satisfaction of consumer in family income between Rs.25001 and Rs.35000
ranged between 65 and 105 with an average of 90.6,the level of satisfaction of consumers
in family income group between Rs.35001 and Rs.45000 ranged between 73 and 103 with
an average of 90.2 and finally the level of satisfaction of consumers in Rs.45001 and
above family income group ranged between 69 and 100 with an average of 88.3. The
study exhibited maximum level of satisfaction of consumers among the group of family
income between Rs.25001-35000.
109
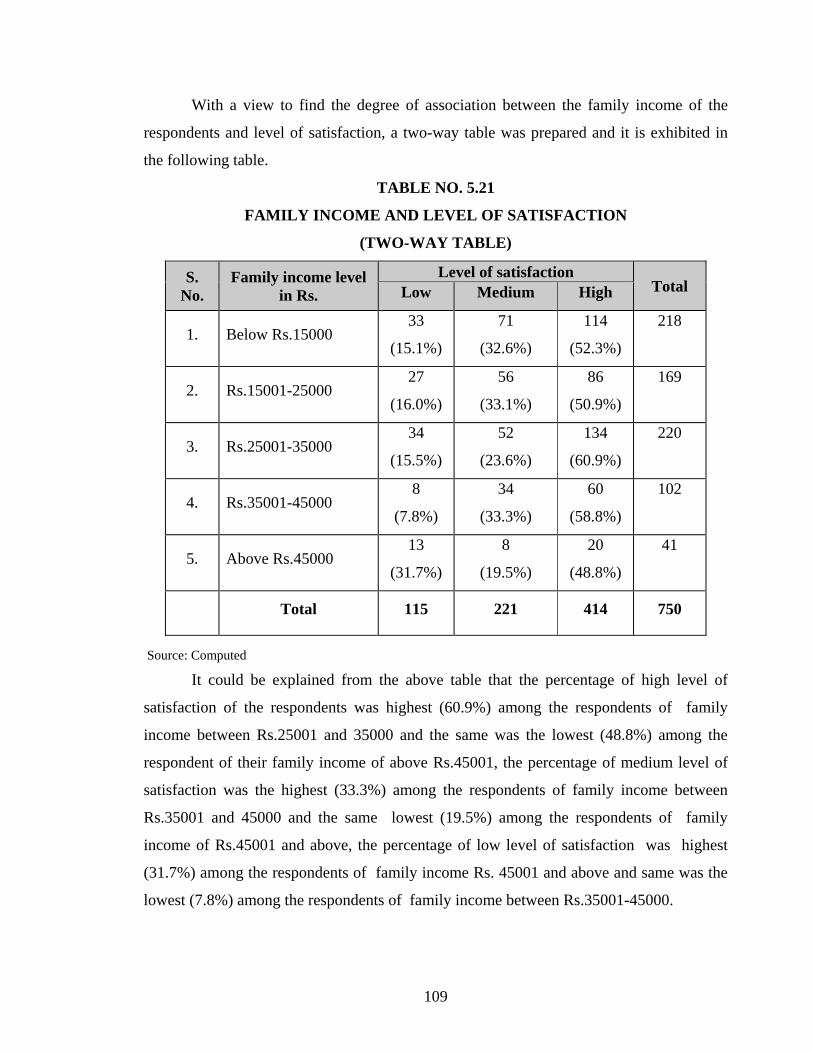
With a view to find the degree of association between the family income of the
respondents and level of satisfaction, a two-way table was prepared and it is exhibited in
the following table.
TABLE NO. 5.21
FAMILY INCOME AND LEVEL OF SATISFACTION
(TWO-WAY TABLE)
S. No.
Family income level in Rs.
Level of satisfaction Total Low Medium High
1. Below Rs.15000 33
(15.1%)
71
(32.6%)
114
(52.3%)
218
2. Rs.15001-25000 27
(16.0%)
56
(33.1%)
86
(50.9%)
169
3. Rs.25001-35000 34
(15.5%)
52
(23.6%)
134
(60.9%)
220
4. Rs.35001-45000 8
(7.8%)
34
(33.3%)
60
(58.8%)
102
5. Above Rs.45000 13
(31.7%)
8
(19.5%)
20
(48.8%)
41
Total 115 221 414 750
Source: Computed
It could be explained from the above table that the percentage of high level of
satisfaction of the respondents was highest (60.9%) among the respondents of family
income between Rs.25001 and 35000 and the same was the lowest (48.8%) among the
respondent of their family income of above Rs.45001, the percentage of medium level of
satisfaction was the highest (33.3%) among the respondents of family income between
Rs.35001 and 45000 and the same lowest (19.5%) among the respondents of family
income of Rs.45001 and above, the percentage of low level of satisfaction was highest
(31.7%) among the respondents of family income Rs. 45001 and above and same was the
lowest (7.8%) among the respondents of family income between Rs.35001-45000.
110
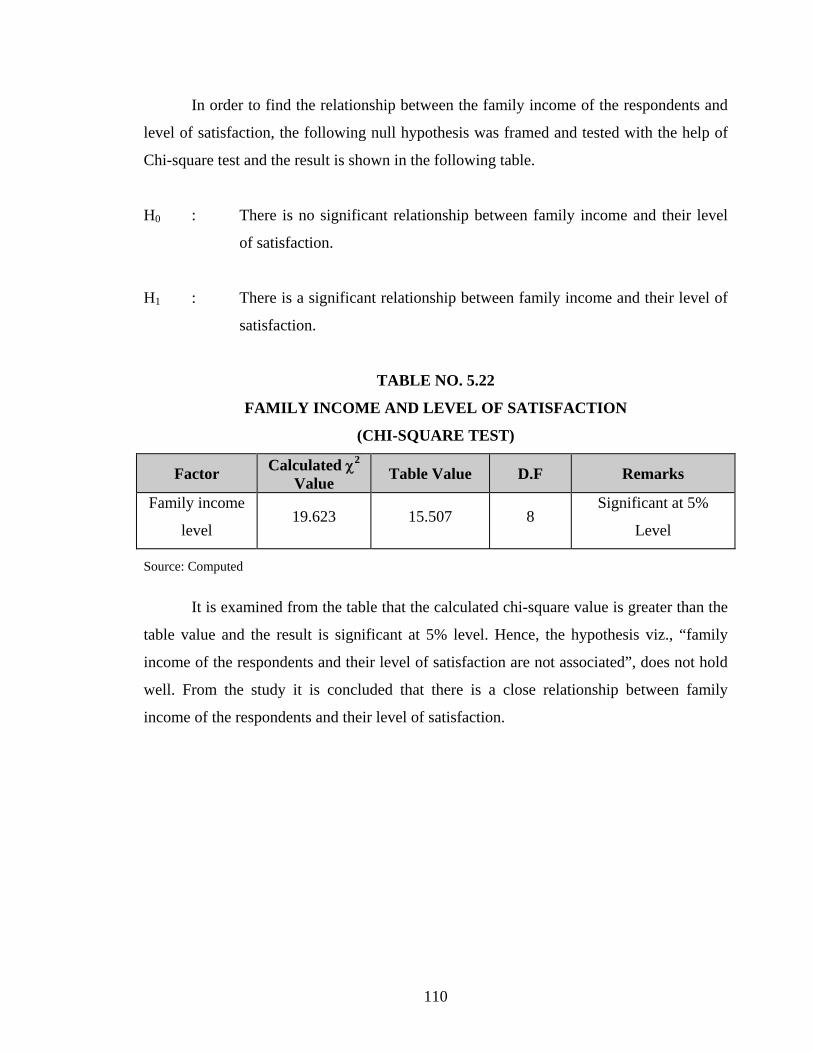
In order to find the relationship between the family income of the respondents and
level of satisfaction, the following null hypothesis was framed and tested with the help of
Chi-square test and the result is shown in the following table.
H0 : There is no significant relationship between family income and their level
of satisfaction.
H1 : There is a significant relationship between family income and their level of
satisfaction.
TABLE NO. 5.22
FAMILY INCOME AND LEVEL OF SATISFACTION
(CHI-SQUARE TEST)
Factor Calculated χ2 Value Table Value D.F Remarks
Family income
level 19.623 15.507 8
Significant at 5%
Level
Source: Computed
It is examined from the table that the calculated chi-square value is greater than the
table value and the result is significant at 5% level. Hence, the hypothesis viz., “family
income of the respondents and their level of satisfaction are not associated”, does not hold
well. From the study it is concluded that there is a close relationship between family
income of the respondents and their level of satisfaction.
111
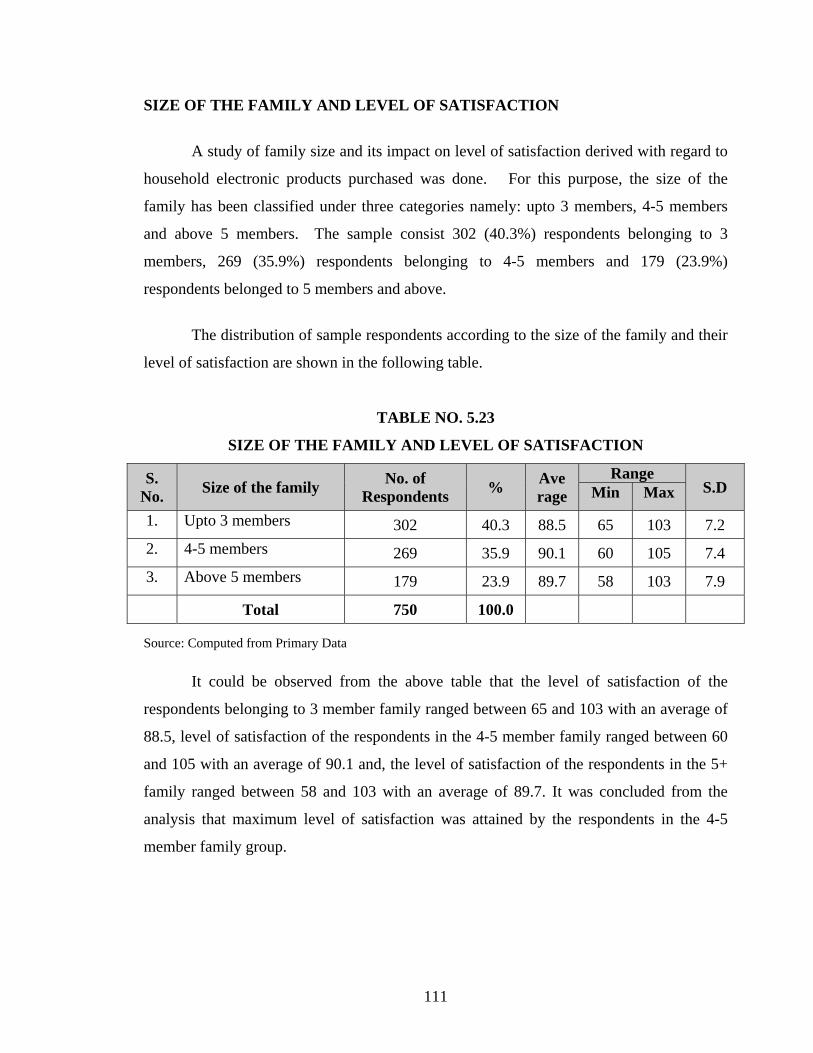
SIZE OF THE FAMILY AND LEVEL OF SATISFACTION
A study of family size and its impact on level of satisfaction derived with regard to
household electronic products purchased was done. For this purpose, the size of the
family has been classified under three categories namely: upto 3 members, 4-5 members
and above 5 members. The sample consist 302 (40.3%) respondents belonging to 3
members, 269 (35.9%) respondents belonging to 4-5 members and 179 (23.9%)
respondents belonged to 5 members and above.
The distribution of sample respondents according to the size of the family and their
level of satisfaction are shown in the following table.
TABLE NO. 5.23
SIZE OF THE FAMILY AND LEVEL OF SATISFACTION
S. No. Size of the family No. of
Respondents % Ave rage
Range S.D Min Max
1. Upto 3 members 302 40.3 88.5 65 103 7.2 2. 4-5 members 269 35.9 90.1 60 105 7.4 3. Above 5 members 179 23.9 89.7 58 103 7.9 Total 750 100.0
Source: Computed from Primary Data
It could be observed from the above table that the level of satisfaction of the
respondents belonging to 3 member family ranged between 65 and 103 with an average of
88.5, level of satisfaction of the respondents in the 4-5 member family ranged between 60
and 105 with an average of 90.1 and, the level of satisfaction of the respondents in the 5+
family ranged between 58 and 103 with an average of 89.7. It was concluded from the
analysis that maximum level of satisfaction was attained by the respondents in the 4-5
member family group.
112
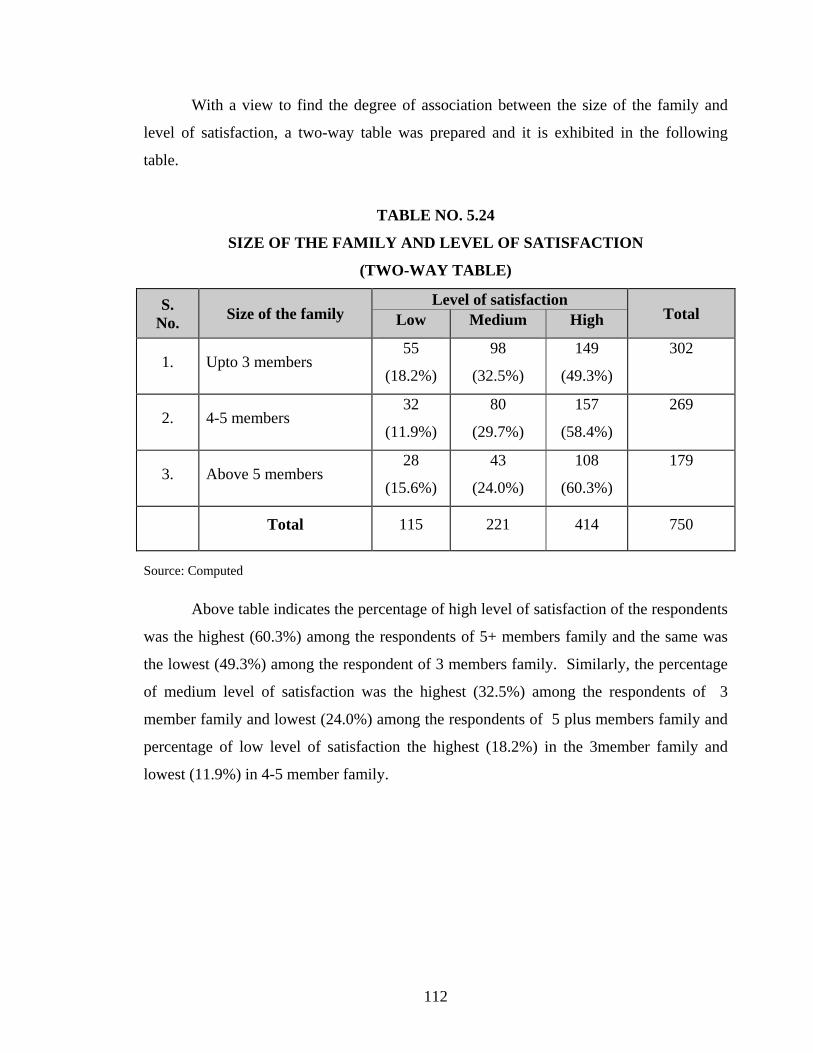
With a view to find the degree of association between the size of the family and
level of satisfaction, a two-way table was prepared and it is exhibited in the following
table.
TABLE NO. 5.24
SIZE OF THE FAMILY AND LEVEL OF SATISFACTION
(TWO-WAY TABLE)
S. No. Size of the family
Level of satisfaction Total Low Medium High
1. Upto 3 members 55
(18.2%)
98
(32.5%)
149
(49.3%)
302
2. 4-5 members 32
(11.9%)
80
(29.7%)
157
(58.4%)
269
3. Above 5 members 28
(15.6%)
43
(24.0%)
108
(60.3%)
179
Total 115 221 414 750
Source: Computed
Above table indicates the percentage of high level of satisfaction of the respondents
was the highest (60.3%) among the respondents of 5+ members family and the same was
the lowest (49.3%) among the respondent of 3 members family. Similarly, the percentage
of medium level of satisfaction was the highest (32.5%) among the respondents of 3
member family and lowest (24.0%) among the respondents of 5 plus members family and
percentage of low level of satisfaction the highest (18.2%) in the 3member family and
lowest (11.9%) in 4-5 member family.
113
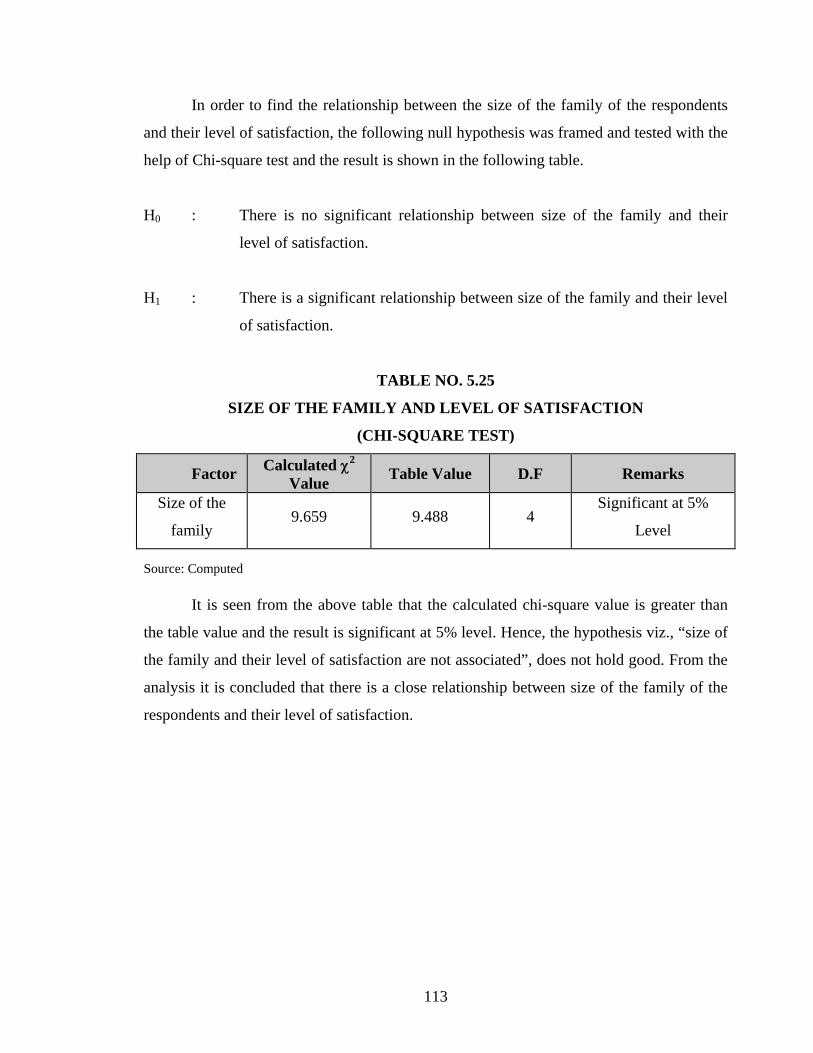
In order to find the relationship between the size of the family of the respondents
and their level of satisfaction, the following null hypothesis was framed and tested with the
help of Chi-square test and the result is shown in the following table.
H0 : There is no significant relationship between size of the family and their
level of satisfaction.
H1 : There is a significant relationship between size of the family and their level
of satisfaction.
TABLE NO. 5.25
SIZE OF THE FAMILY AND LEVEL OF SATISFACTION
(CHI-SQUARE TEST)
Factor Calculated χ2 Value Table Value D.F Remarks
Size of the
family 9.659 9.488 4
Significant at 5%
Level
Source: Computed
It is seen from the above table that the calculated chi-square value is greater than
the table value and the result is significant at 5% level. Hence, the hypothesis viz., “size of
the family and their level of satisfaction are not associated”, does not hold good. From the
analysis it is concluded that there is a close relationship between size of the family of the
respondents and their level of satisfaction.

114
NATURE OF FAMILY AND LEVEL OF SATISFACTION
Household electronic products have become necessary for every family in the
present day lifestyle. The level of perception regarding level of satisfaction is greatly
influenced by the nature of family adopted. The present study is considering the two types
family like nuclear family and joint family. The sample consists of 428 (57.1%)
respondents belonging to nuclear family and 322 (42.9%) joint family.
The distribution of sample respondents in respect to the level of satisfaction is
shown in the table below.
TABLE NO. 5.26
NATURE OF FAMILY AND LEVEL OF SATISFACTION
S. No. Nature of family No. of
Respondents % Ave rage
Range S.D Min Max
1. Nuclear family 428 57.1 89.9 58 105 7.5 2. Joint family 322 42.9 88.6 65 103 7.4 Total 750 100.0
Source: Computed from Primary Data
It could be explained from the above table that the level of satisfaction of the
respondents towards household electronic products of nuclear family ranged between 58
and 105 with an average of 89.9. And the level of satisfaction of the respondents in joint
families ranged between 65 and 103 with an average of 88.6. It was concluded from the
analysis that maximum level of satisfaction is attained by the nuclear family respondents.
115
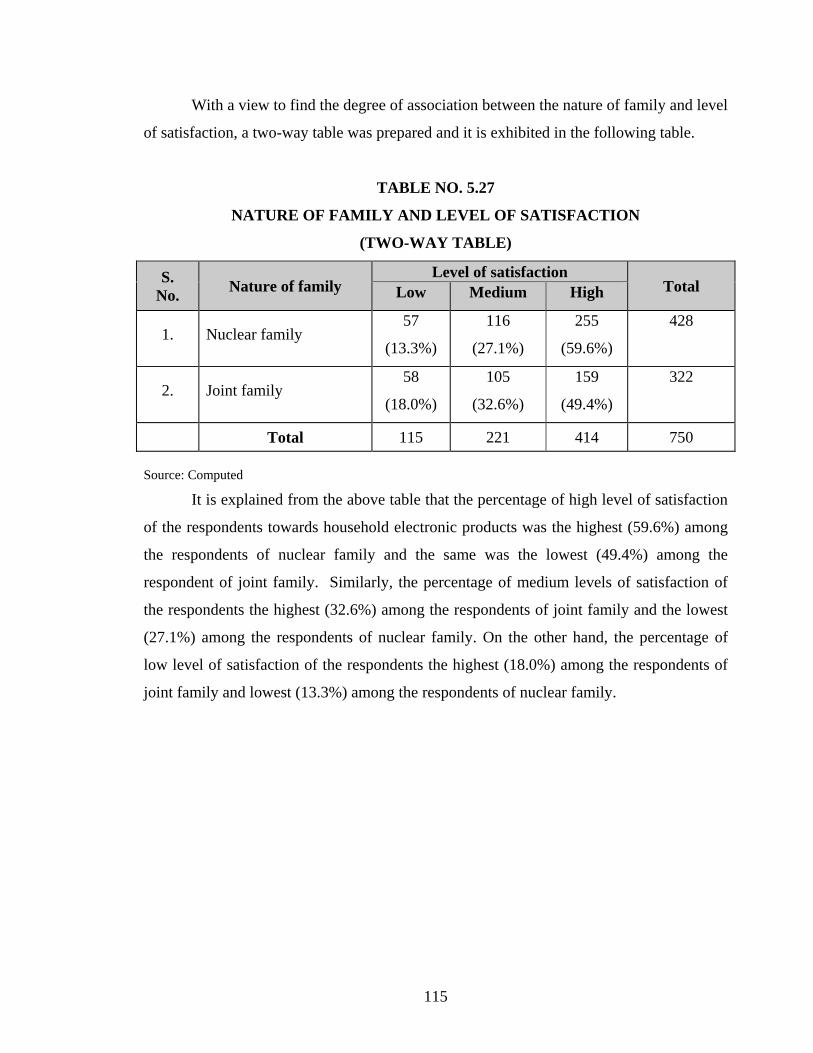
With a view to find the degree of association between the nature of family and level
of satisfaction, a two-way table was prepared and it is exhibited in the following table.
TABLE NO. 5.27
NATURE OF FAMILY AND LEVEL OF SATISFACTION
(TWO-WAY TABLE)
S. No. Nature of family
Level of satisfaction Total Low Medium High
1. Nuclear family 57
(13.3%)
116
(27.1%)
255
(59.6%)
428
2. Joint family 58
(18.0%)
105
(32.6%)
159
(49.4%)
322
Total 115 221 414 750 Source: Computed
It is explained from the above table that the percentage of high level of satisfaction
of the respondents towards household electronic products was the highest (59.6%) among
the respondents of nuclear family and the same was the lowest (49.4%) among the
respondent of joint family. Similarly, the percentage of medium levels of satisfaction of
the respondents the highest (32.6%) among the respondents of joint family and the lowest
(27.1%) among the respondents of nuclear family. On the other hand, the percentage of
low level of satisfaction of the respondents the highest (18.0%) among the respondents of
joint family and lowest (13.3%) among the respondents of nuclear family.

116
In order to find the relationship between the nature of family and their level of
satisfaction, the following null hypothesis was framed and tested with the help of Chi-
square test and the result is shown in the following table.
H0 : There is no significant relationship between nature of family and their level
of satisfaction.
H1 : There is a significant relationship between nature of family and their level
of satisfaction.
TABLE NO. 5.28
NATURE OF FAMILY AND LEVEL OF SATISFACTION
(CHI-SQUARE TEST)
Factor Calculated χ2 Value Table Value D.F Remarks
Nature of
family 7.995 5.991 2
Significant at 5%
Level
Source: Computed It is evident from the table that the calculated chi-square value is greater than the
table value and the result is significant at 5% level. Hence, the hypothesis viz., “nature of
family and their level of satisfaction are not associated”, does not hold good. From the
analysis it is concluded that there is a close relationship between nature of family and their
level of satisfaction.
117
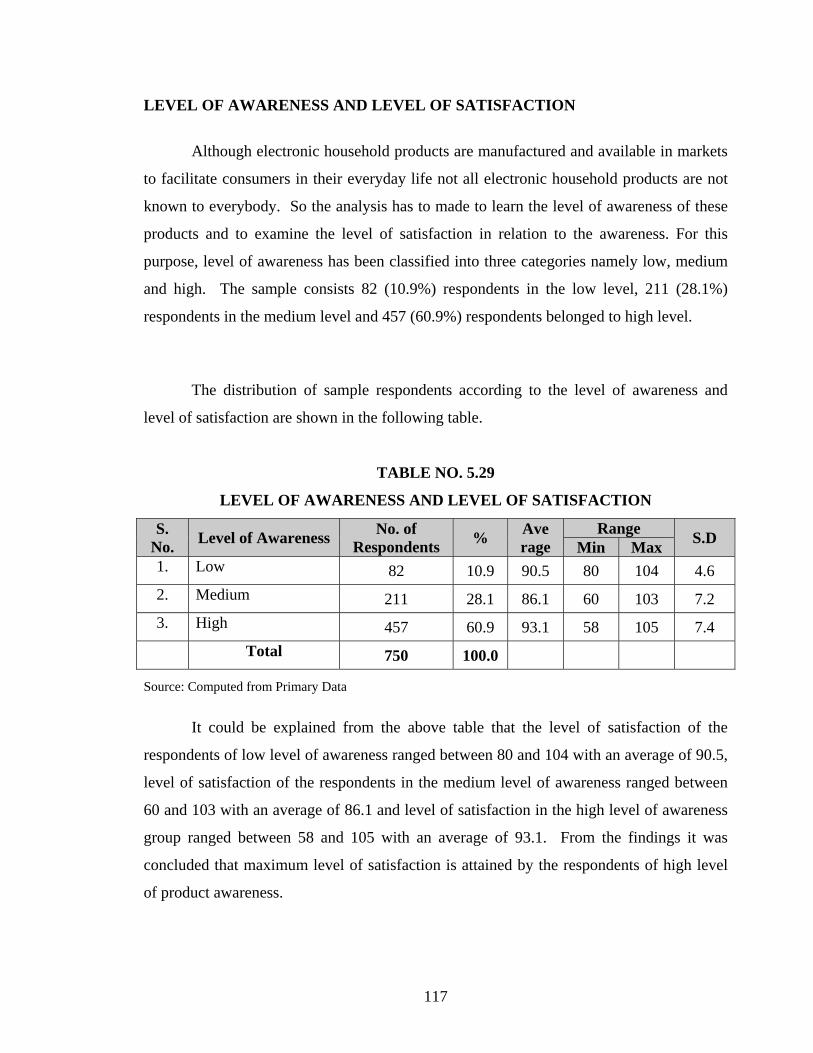
LEVEL OF AWARENESS AND LEVEL OF SATISFACTION
Although electronic household products are manufactured and available in markets
to facilitate consumers in their everyday life not all electronic household products are not
known to everybody. So the analysis has to made to learn the level of awareness of these
products and to examine the level of satisfaction in relation to the awareness. For this
purpose, level of awareness has been classified into three categories namely low, medium
and high. The sample consists 82 (10.9%) respondents in the low level, 211 (28.1%)
respondents in the medium level and 457 (60.9%) respondents belonged to high level.
The distribution of sample respondents according to the level of awareness and
level of satisfaction are shown in the following table.
TABLE NO. 5.29
LEVEL OF AWARENESS AND LEVEL OF SATISFACTION
S. No. Level of Awareness No. of
Respondents % Ave rage
Range S.D Min Max 1. Low 82 10.9 90.5 80 104 4.6 2. Medium 211 28.1 86.1 60 103 7.2 3. High 457 60.9 93.1 58 105 7.4 Total 750 100.0
Source: Computed from Primary Data
It could be explained from the above table that the level of satisfaction of the
respondents of low level of awareness ranged between 80 and 104 with an average of 90.5,
level of satisfaction of the respondents in the medium level of awareness ranged between
60 and 103 with an average of 86.1 and level of satisfaction in the high level of awareness
group ranged between 58 and 105 with an average of 93.1. From the findings it was
concluded that maximum level of satisfaction is attained by the respondents of high level
of product awareness.
118
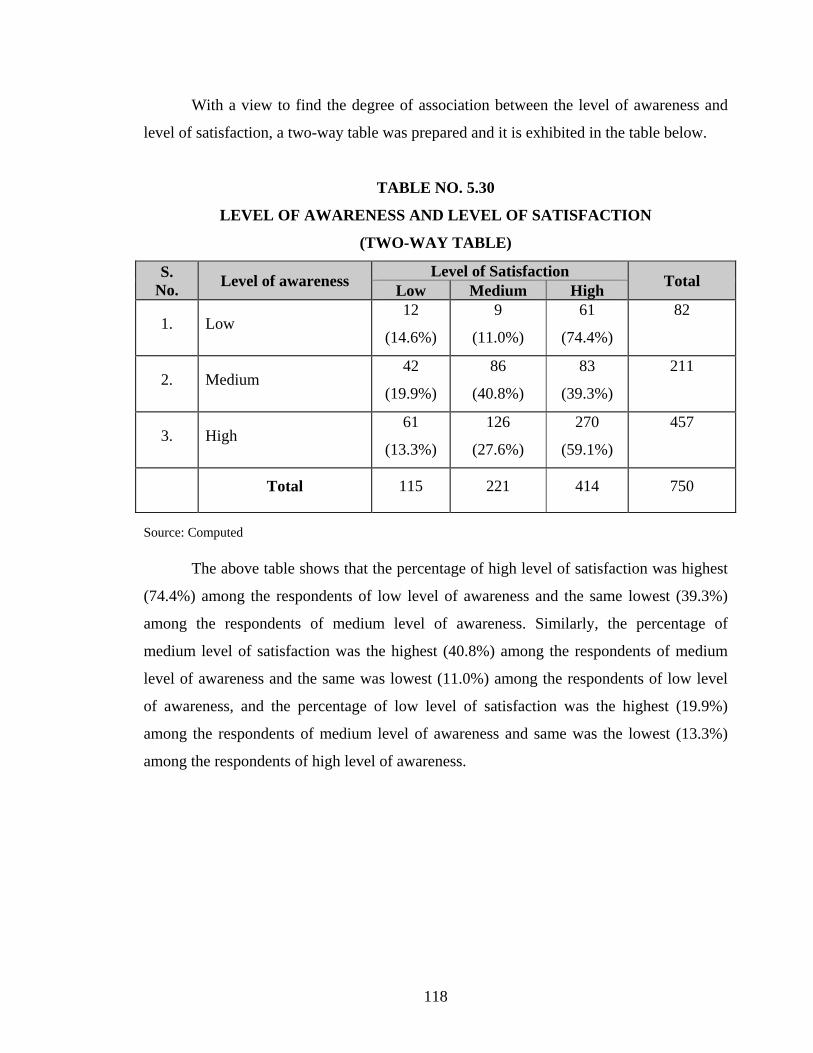
With a view to find the degree of association between the level of awareness and
level of satisfaction, a two-way table was prepared and it is exhibited in the table below.
TABLE NO. 5.30
LEVEL OF AWARENESS AND LEVEL OF SATISFACTION
(TWO-WAY TABLE)
S. No. Level of awareness Level of Satisfaction Total Low Medium High
1. Low 12
(14.6%)
9
(11.0%)
61
(74.4%)
82
2. Medium 42
(19.9%)
86
(40.8%)
83
(39.3%)
211
3. High 61
(13.3%)
126
(27.6%)
270
(59.1%)
457
Total 115 221 414 750
Source: Computed
The above table shows that the percentage of high level of satisfaction was highest
(74.4%) among the respondents of low level of awareness and the same lowest (39.3%)
among the respondents of medium level of awareness. Similarly, the percentage of
medium level of satisfaction was the highest (40.8%) among the respondents of medium
level of awareness and the same was lowest (11.0%) among the respondents of low level
of awareness, and the percentage of low level of satisfaction was the highest (19.9%)
among the respondents of medium level of awareness and same was the lowest (13.3%)
among the respondents of high level of awareness.
119
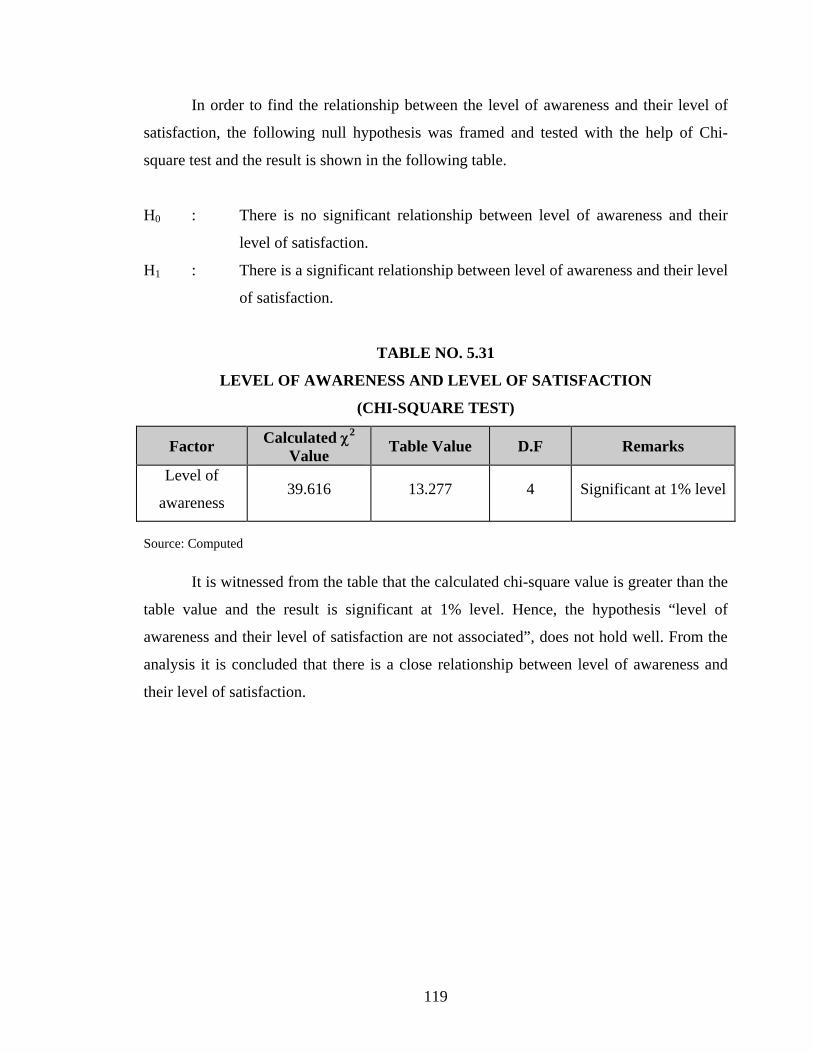
In order to find the relationship between the level of awareness and their level of
satisfaction, the following null hypothesis was framed and tested with the help of Chi-
square test and the result is shown in the following table.
H0 : There is no significant relationship between level of awareness and their
level of satisfaction.
H1 : There is a significant relationship between level of awareness and their level
of satisfaction.
TABLE NO. 5.31
LEVEL OF AWARENESS AND LEVEL OF SATISFACTION
(CHI-SQUARE TEST)
Factor Calculated χ2 Value Table Value D.F Remarks
Level of
awareness 39.616 13.277 4 Significant at 1% level
Source: Computed
It is witnessed from the table that the calculated chi-square value is greater than the
table value and the result is significant at 1% level. Hence, the hypothesis “level of
awareness and their level of satisfaction are not associated”, does not hold well. From the
analysis it is concluded that there is a close relationship between level of awareness and
their level of satisfaction.
120
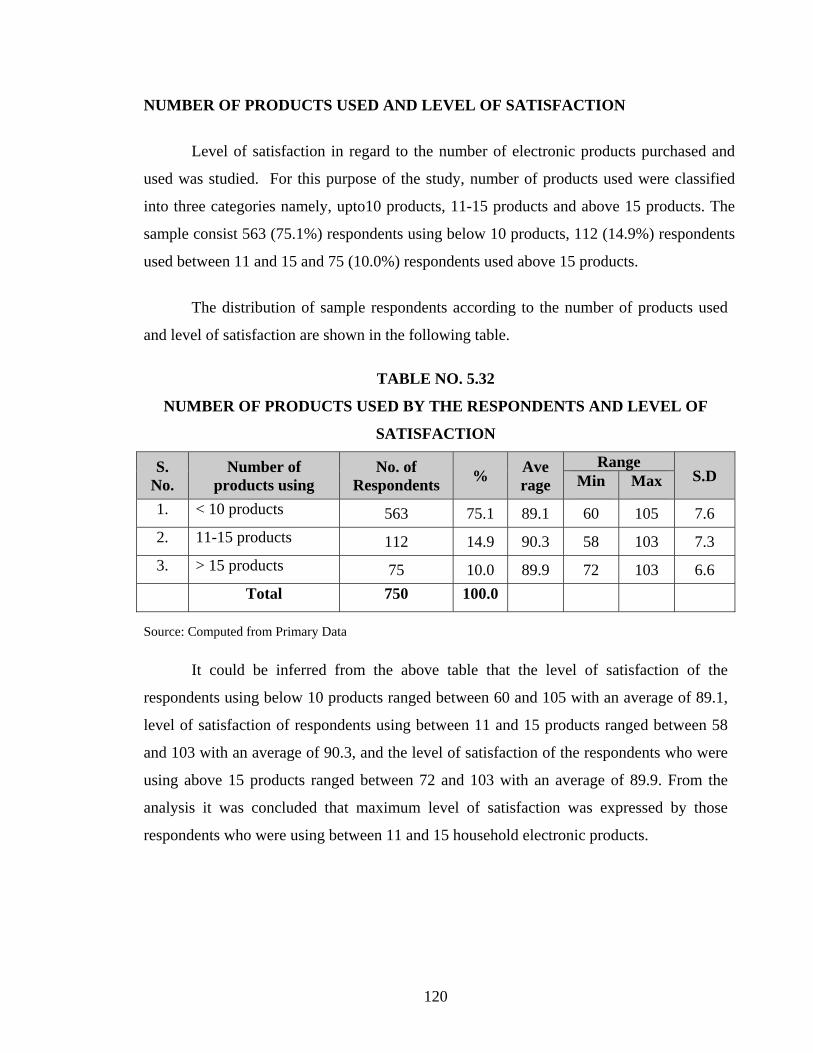
NUMBER OF PRODUCTS USED AND LEVEL OF SATISFACTION
Level of satisfaction in regard to the number of electronic products purchased and
used was studied. For this purpose of the study, number of products used were classified
into three categories namely, upto10 products, 11-15 products and above 15 products. The
sample consist 563 (75.1%) respondents using below 10 products, 112 (14.9%) respondents
used between 11 and 15 and 75 (10.0%) respondents used above 15 products.
The distribution of sample respondents according to the number of products used
and level of satisfaction are shown in the following table.
TABLE NO. 5.32
NUMBER OF PRODUCTS USED BY THE RESPONDENTS AND LEVEL OF
SATISFACTION
S. No.
Number of products using
No. of Respondents % Ave
rage Range
S.D Min Max
1. < 10 products 563 75.1 89.1 60 105 7.6 2. 11-15 products 112 14.9 90.3 58 103 7.3 3. > 15 products 75 10.0 89.9 72 103 6.6 Total 750 100.0
Source: Computed from Primary Data
It could be inferred from the above table that the level of satisfaction of the
respondents using below 10 products ranged between 60 and 105 with an average of 89.1,
level of satisfaction of respondents using between 11 and 15 products ranged between 58
and 103 with an average of 90.3, and the level of satisfaction of the respondents who were
using above 15 products ranged between 72 and 103 with an average of 89.9. From the
analysis it was concluded that maximum level of satisfaction was expressed by those
respondents who were using between 11 and 15 household electronic products.
121
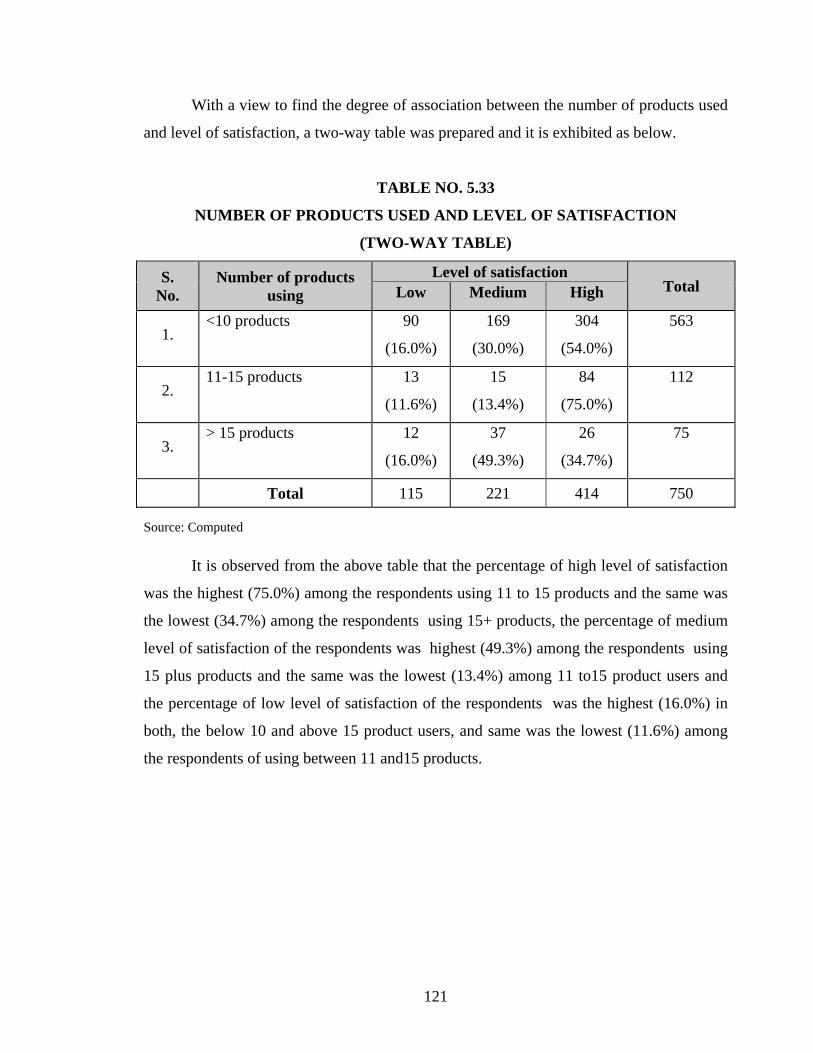
With a view to find the degree of association between the number of products used
and level of satisfaction, a two-way table was prepared and it is exhibited as below.
TABLE NO. 5.33
NUMBER OF PRODUCTS USED AND LEVEL OF SATISFACTION
(TWO-WAY TABLE)
S. No.
Number of products using
Level of satisfaction Total Low Medium High
1. <10 products 90
(16.0%)
169
(30.0%)
304
(54.0%)
563
2. 11-15 products 13
(11.6%)
15
(13.4%)
84
(75.0%)
112
3. > 15 products 12
(16.0%)
37
(49.3%)
26
(34.7%)
75
Total 115 221 414 750
Source: Computed
It is observed from the above table that the percentage of high level of satisfaction
was the highest (75.0%) among the respondents using 11 to 15 products and the same was
the lowest (34.7%) among the respondents using 15+ products, the percentage of medium
level of satisfaction of the respondents was highest (49.3%) among the respondents using
15 plus products and the same was the lowest (13.4%) among 11 to15 product users and
the percentage of low level of satisfaction of the respondents was the highest (16.0%) in
both, the below 10 and above 15 product users, and same was the lowest (11.6%) among
the respondents of using between 11 and15 products.

122
In order to find the relationship between the number of products used and their
level of satisfaction, the following null hypothesis was framed and tested with the help of
Chi-square test and the result is shown in the following table.
H0 : There is no significant relationship between number of products used and
their level of satisfaction.
H1 : There is a significant relationship between number of products used and
their level of satisfaction.
TABLE NO. 5.34
NUMBER OF PRODUCTS AND LEVEL OF SATISFACTION
(CHI-SQUARE TEST)
Factor Calculated χ2 Value Table Value D.F Remarks
Number of
products used 34.947 13.277 4
Significant at 1%
Level
Source: Computed
It is evident from the table that the calculated chi-square value is greater than the
table value and the result is significant at 1% level. Hence, the hypothesis viz., “number of
products used and their level of satisfaction are not associated”, does not hold good. From
the analysis it is concluded that there is a close relationship between number of products
used and their level of satisfaction.
123
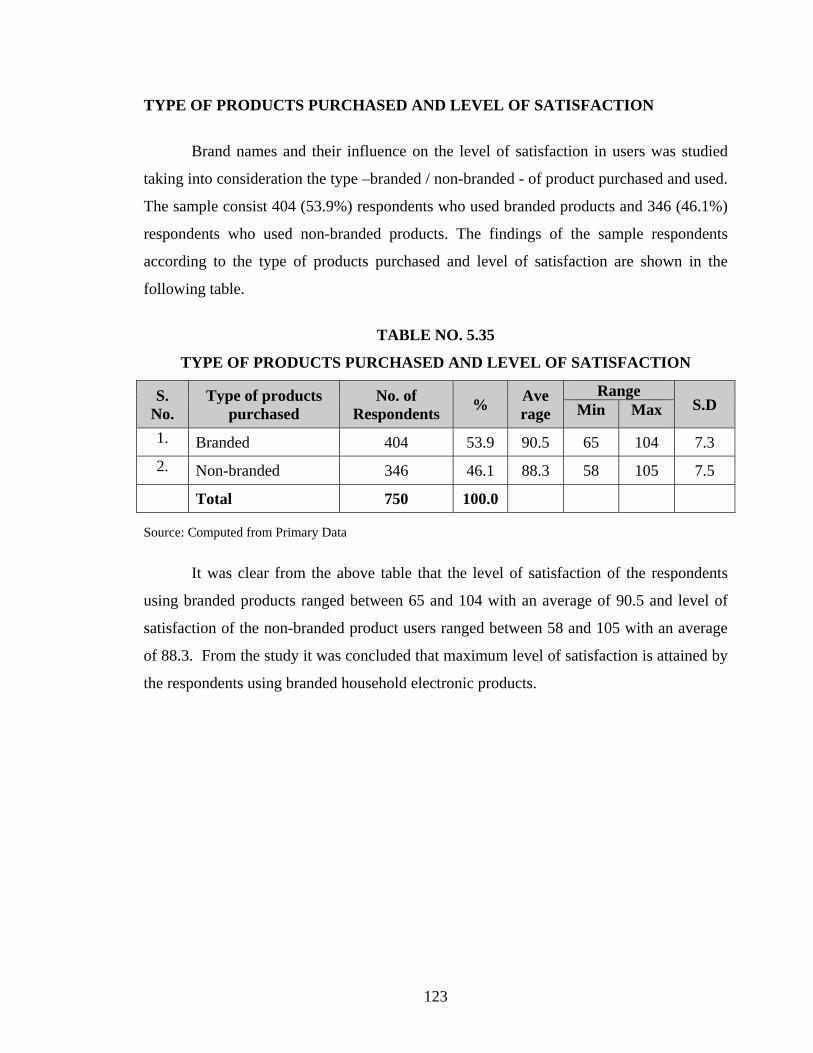
TYPE OF PRODUCTS PURCHASED AND LEVEL OF SATISFACTION
Brand names and their influence on the level of satisfaction in users was studied
taking into consideration the type –branded / non-branded - of product purchased and used.
The sample consist 404 (53.9%) respondents who used branded products and 346 (46.1%)
respondents who used non-branded products. The findings of the sample respondents
according to the type of products purchased and level of satisfaction are shown in the
following table.
TABLE NO. 5.35
TYPE OF PRODUCTS PURCHASED AND LEVEL OF SATISFACTION
S. No.
Type of products purchased
No. of Respondents % Ave
rage Range
S.D Min Max
1. Branded 404 53.9 90.5 65 104 7.3 2. Non-branded 346 46.1 88.3 58 105 7.5 Total 750 100.0
Source: Computed from Primary Data
It was clear from the above table that the level of satisfaction of the respondents
using branded products ranged between 65 and 104 with an average of 90.5 and level of
satisfaction of the non-branded product users ranged between 58 and 105 with an average
of 88.3. From the study it was concluded that maximum level of satisfaction is attained by
the respondents using branded household electronic products.
124
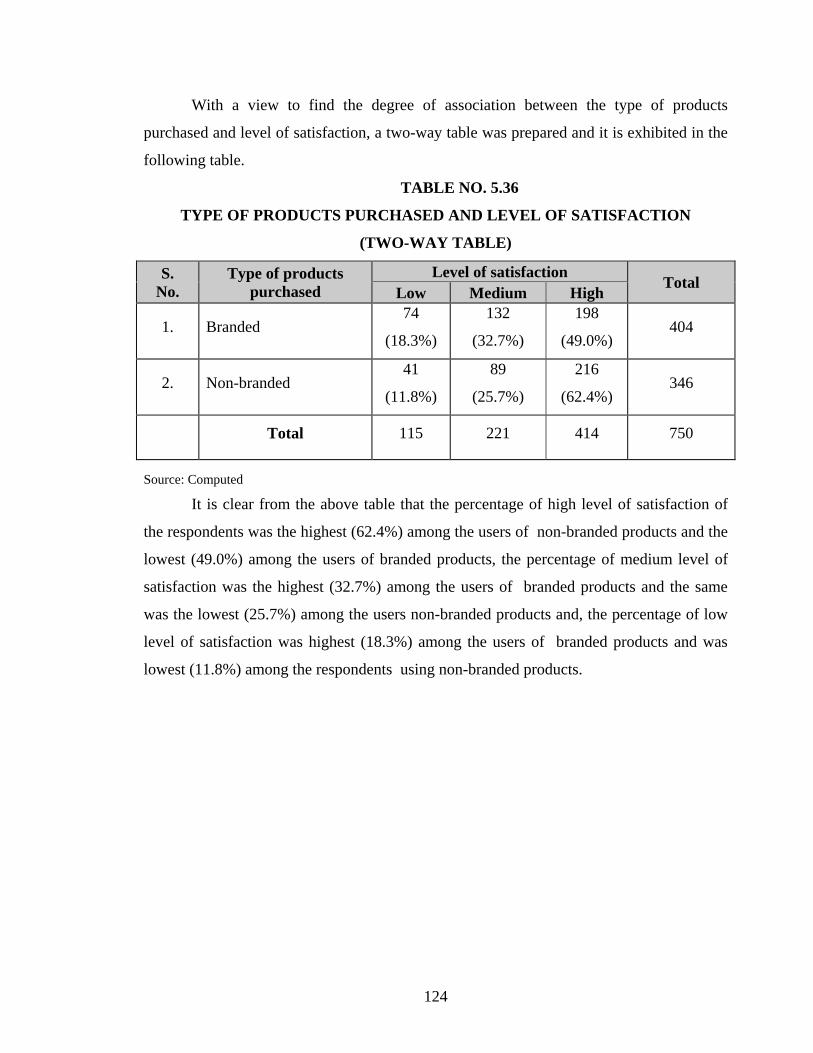
With a view to find the degree of association between the type of products
purchased and level of satisfaction, a two-way table was prepared and it is exhibited in the
following table.
TABLE NO. 5.36
TYPE OF PRODUCTS PURCHASED AND LEVEL OF SATISFACTION
(TWO-WAY TABLE)
S. No.
Type of products purchased
Level of satisfaction Total Low Medium High
1. Branded 74
(18.3%)
132
(32.7%)
198
(49.0%) 404
2. Non-branded 41
(11.8%)
89
(25.7%)
216
(62.4%) 346
Total 115 221 414 750
Source: Computed It is clear from the above table that the percentage of high level of satisfaction of
the respondents was the highest (62.4%) among the users of non-branded products and the
lowest (49.0%) among the users of branded products, the percentage of medium level of
satisfaction was the highest (32.7%) among the users of branded products and the same
was the lowest (25.7%) among the users non-branded products and, the percentage of low
level of satisfaction was highest (18.3%) among the users of branded products and was
lowest (11.8%) among the respondents using non-branded products.

125
In order to find the relationship between the type of products purchased and their
level of satisfaction, the following null hypothesis was framed and tested with the help of
Chi-square test and the result is shown in the following table.
H0 : There is no significant relationship between type of products purchased and
their level of satisfaction.
H1 : There is a significant relationship between type of products purchased and
their level of satisfaction.
TABLE NO. 5.37
TYPE OF PRODUCTS PURCHASED AND LEVEL OF SATISFACTION
(CHI-SQUARE TEST)
Factor Calculated χ2 Value
Table Value D.F Remarks
Type of products
purchased 14.218 9.210 2
Significant at 1%
Level
Source: Computed
It is exhibited from the table that the calculated chi-square value is greater than the
table value and the result is significant at 1% level. Hence, the hypothesis viz., “type of
products purchased and their level of satisfaction are not associated”, does not hold good.
From the analysis it is concluded that there is a close relationship between type of products
purchased and their level of satisfaction.
126
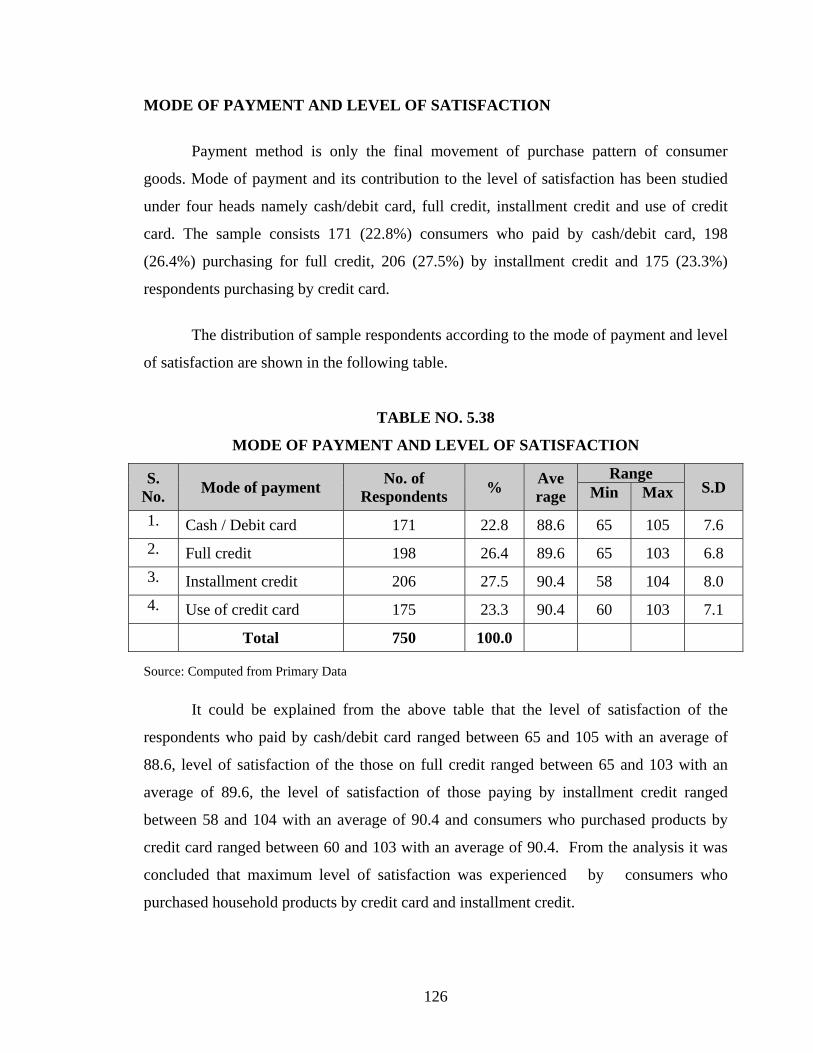
MODE OF PAYMENT AND LEVEL OF SATISFACTION
Payment method is only the final movement of purchase pattern of consumer
goods. Mode of payment and its contribution to the level of satisfaction has been studied
under four heads namely cash/debit card, full credit, installment credit and use of credit
card. The sample consists 171 (22.8%) consumers who paid by cash/debit card, 198
(26.4%) purchasing for full credit, 206 (27.5%) by installment credit and 175 (23.3%)
respondents purchasing by credit card.
The distribution of sample respondents according to the mode of payment and level
of satisfaction are shown in the following table.
TABLE NO. 5.38
MODE OF PAYMENT AND LEVEL OF SATISFACTION
S. No. Mode of payment No. of
Respondents % Ave rage
Range S.D Min Max
1. Cash / Debit card 171 22.8 88.6 65 105 7.6 2. Full credit 198 26.4 89.6 65 103 6.8 3. Installment credit 206 27.5 90.4 58 104 8.0 4. Use of credit card 175 23.3 90.4 60 103 7.1 Total 750 100.0
Source: Computed from Primary Data
It could be explained from the above table that the level of satisfaction of the
respondents who paid by cash/debit card ranged between 65 and 105 with an average of
88.6, level of satisfaction of the those on full credit ranged between 65 and 103 with an
average of 89.6, the level of satisfaction of those paying by installment credit ranged
between 58 and 104 with an average of 90.4 and consumers who purchased products by
credit card ranged between 60 and 103 with an average of 90.4. From the analysis it was
concluded that maximum level of satisfaction was experienced by consumers who
purchased household products by credit card and installment credit.

127
With a view to find the degree of association between mode of payment and level
of satisfaction, a two-way table was prepared and it is exhibited in the following table.
TABLE NO. 5.39
MODE OF PAYMENT AND LEVEL OF SATISFACTION
(TWO-WAY TABLE)
S.
No. Mode of payment
Level of satisfaction Total
Low Medium High
1. Cash / Debit card 35
(20.5%)
56
(32.7%)
80
(46.8%) 171
2. Full credit 24
(12.1%)
63
(31.8%)
111
(56.1%) 198
3. Installment credit 38
(18.4%)
54
(26.2%)
114
(55.3%) 206
4. Use of credit card 18
(10.3%)
48
(27.4%)
109
(62.3%) 175
Total 115 221 414 750
Source: Computed
It is noted from the above table the percentage of level of satisfaction of the
consumers is the highest (62.3%) among the people using credit card payment and the
same was the lowest (46.8%) among the consumers paying by cash/debit card. Similarly,
the percentage of medium level of satisfaction was the highest (32.7%) among those
paying by cash/debit card and lowest (26.2%) among the consumers availing installment
credit, percentage of low level of satisfaction of consumers was the highest (20.5%) among
those paying by cash/debit card and same was the lowest (10.3%) among the consumers
using credit cards.
128
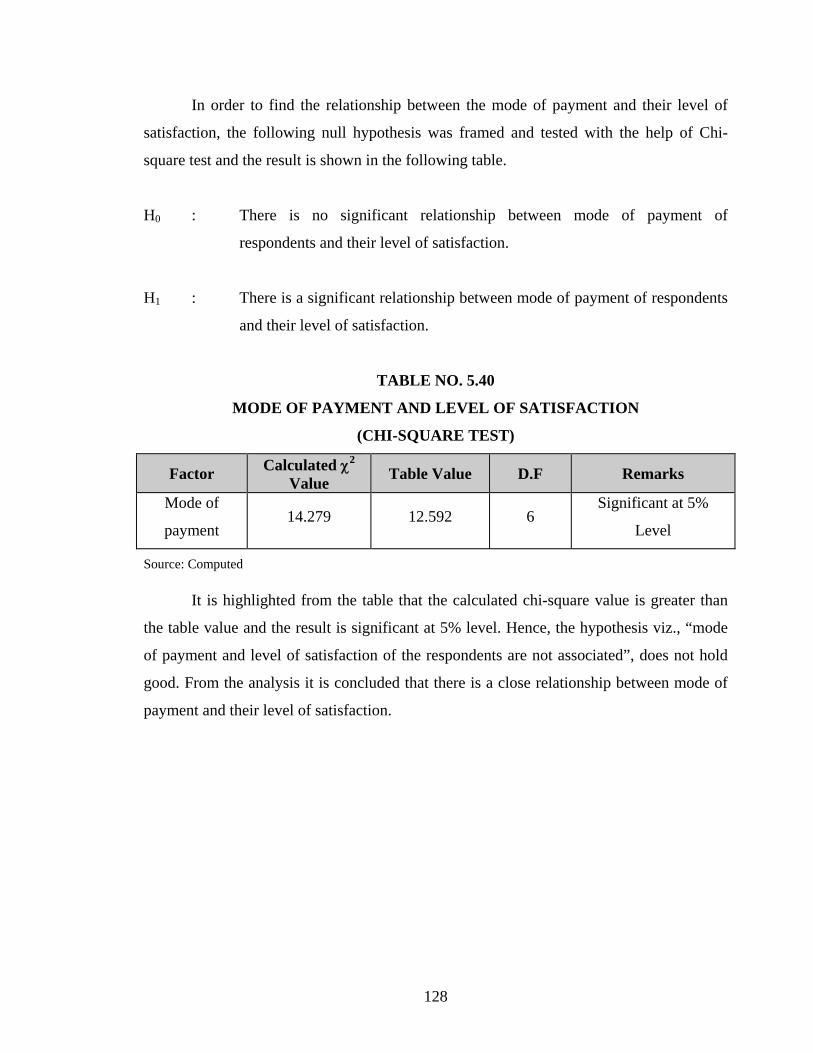
In order to find the relationship between the mode of payment and their level of
satisfaction, the following null hypothesis was framed and tested with the help of Chi-
square test and the result is shown in the following table.
H0 : There is no significant relationship between mode of payment of
respondents and their level of satisfaction.
H1 : There is a significant relationship between mode of payment of respondents
and their level of satisfaction.
TABLE NO. 5.40
MODE OF PAYMENT AND LEVEL OF SATISFACTION
(CHI-SQUARE TEST)
Factor Calculated χ2 Value Table Value D.F Remarks
Mode of
payment 14.279 12.592 6
Significant at 5%
Level
Source: Computed
It is highlighted from the table that the calculated chi-square value is greater than
the table value and the result is significant at 5% level. Hence, the hypothesis viz., “mode
of payment and level of satisfaction of the respondents are not associated”, does not hold
good. From the analysis it is concluded that there is a close relationship between mode of
payment and their level of satisfaction.
129
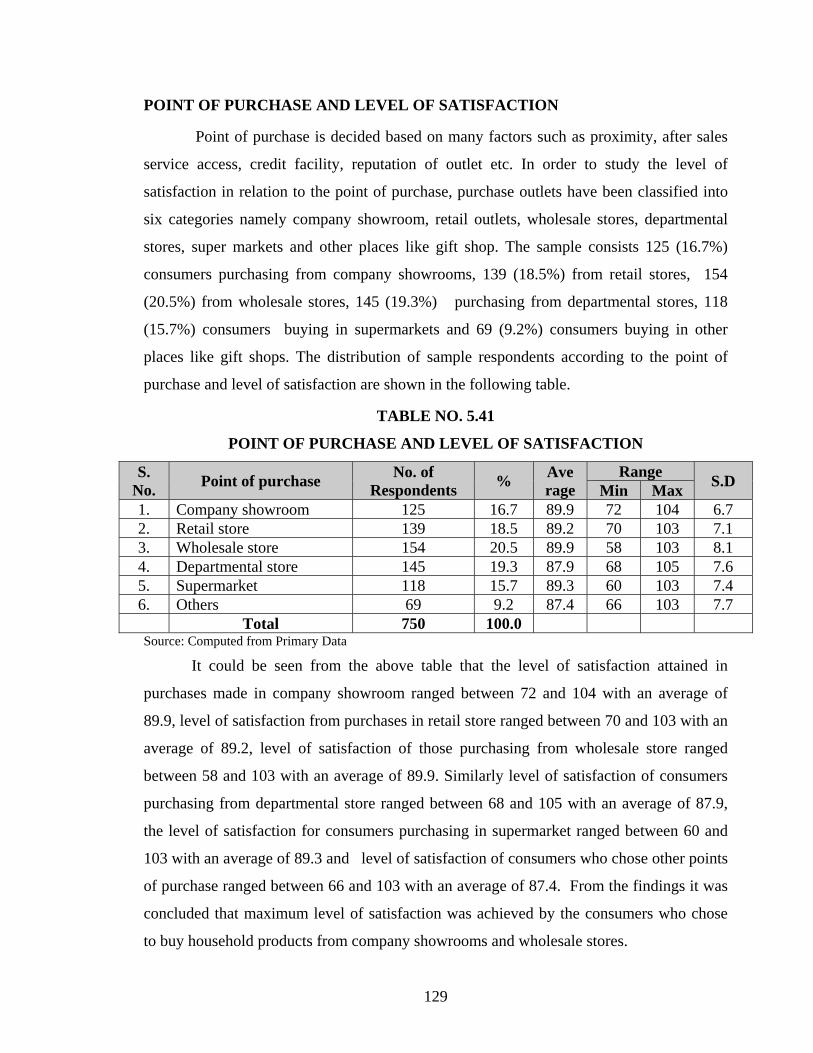
POINT OF PURCHASE AND LEVEL OF SATISFACTION
Point of purchase is decided based on many factors such as proximity, after sales
service access, credit facility, reputation of outlet etc. In order to study the level of
satisfaction in relation to the point of purchase, purchase outlets have been classified into
six categories namely company showroom, retail outlets, wholesale stores, departmental
stores, super markets and other places like gift shop. The sample consists 125 (16.7%)
consumers purchasing from company showrooms, 139 (18.5%) from retail stores, 154
(20.5%) from wholesale stores, 145 (19.3%) purchasing from departmental stores, 118
(15.7%) consumers buying in supermarkets and 69 (9.2%) consumers buying in other
places like gift shops. The distribution of sample respondents according to the point of
purchase and level of satisfaction are shown in the following table.
TABLE NO. 5.41
POINT OF PURCHASE AND LEVEL OF SATISFACTION
S. No. Point of purchase No. of
Respondents % Ave rage
Range S.D Min Max 1. Company showroom 125 16.7 89.9 72 104 6.7 2. Retail store 139 18.5 89.2 70 103 7.1 3. Wholesale store 154 20.5 89.9 58 103 8.1 4. Departmental store 145 19.3 87.9 68 105 7.6 5. Supermarket 118 15.7 89.3 60 103 7.4 6. Others 69 9.2 87.4 66 103 7.7 Total 750 100.0 Source: Computed from Primary Data
It could be seen from the above table that the level of satisfaction attained in
purchases made in company showroom ranged between 72 and 104 with an average of
89.9, level of satisfaction from purchases in retail store ranged between 70 and 103 with an
average of 89.2, level of satisfaction of those purchasing from wholesale store ranged
between 58 and 103 with an average of 89.9. Similarly level of satisfaction of consumers
purchasing from departmental store ranged between 68 and 105 with an average of 87.9,
the level of satisfaction for consumers purchasing in supermarket ranged between 60 and
103 with an average of 89.3 and level of satisfaction of consumers who chose other points
of purchase ranged between 66 and 103 with an average of 87.4. From the findings it was
concluded that maximum level of satisfaction was achieved by the consumers who chose
to buy household products from company showrooms and wholesale stores.
130
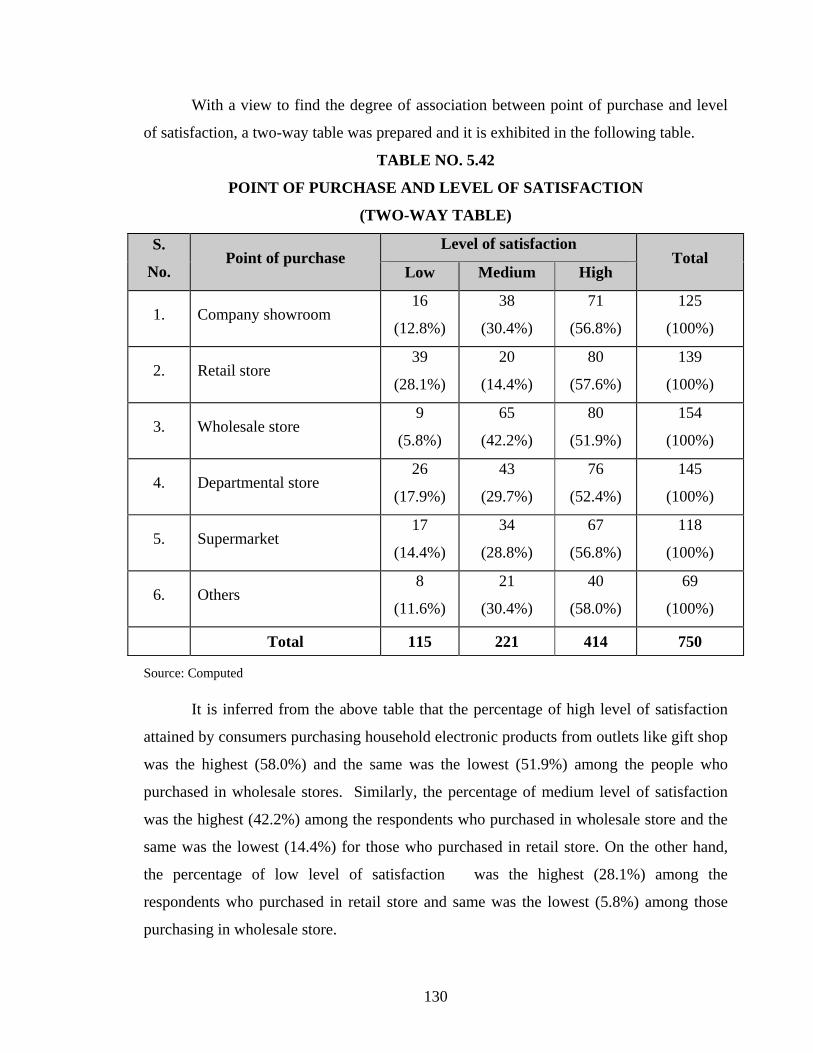
With a view to find the degree of association between point of purchase and level
of satisfaction, a two-way table was prepared and it is exhibited in the following table.
TABLE NO. 5.42
POINT OF PURCHASE AND LEVEL OF SATISFACTION
(TWO-WAY TABLE)
S.
No. Point of purchase
Level of satisfaction Total
Low Medium High
1. Company showroom 16
(12.8%)
38
(30.4%)
71
(56.8%)
125
(100%)
2. Retail store 39
(28.1%)
20
(14.4%)
80
(57.6%)
139
(100%)
3. Wholesale store 9
(5.8%)
65
(42.2%)
80
(51.9%)
154
(100%)
4. Departmental store 26
(17.9%)
43
(29.7%)
76
(52.4%)
145
(100%)
5. Supermarket 17
(14.4%)
34
(28.8%)
67
(56.8%)
118
(100%)
6. Others 8
(11.6%)
21
(30.4%)
40
(58.0%)
69
(100%)
Total 115 221 414 750
Source: Computed
It is inferred from the above table that the percentage of high level of satisfaction
attained by consumers purchasing household electronic products from outlets like gift shop
was the highest (58.0%) and the same was the lowest (51.9%) among the people who
purchased in wholesale stores. Similarly, the percentage of medium level of satisfaction
was the highest (42.2%) among the respondents who purchased in wholesale store and the
same was the lowest (14.4%) for those who purchased in retail store. On the other hand,
the percentage of low level of satisfaction was the highest (28.1%) among the
respondents who purchased in retail store and same was the lowest (5.8%) among those
purchasing in wholesale store.

131
In order to find the relationship between the point of purchase and their level of
satisfaction, the following null hypothesis was framed and tested with the help of Chi-
square test and the result is shown in the following table.
H0 : There is no significant relationship between point of purchase and their
level of satisfaction.
H1 : There is a significant relationship between point of purchase and their level
of satisfaction.
TABLE NO. 5.43
POINT OF PURCHASE AND LEVEL OF SATISFACTION
(CHI-SQUARE TEST)
Factor Calculated χ2 Value
Table Value D.F Remarks
Point of
purchase 45.709 23.209 10
Significant at 1%
Level
Source: Computed
It is observed from the table that the calculated chi-square value is greater than the
table value and the result is significant at 1% level. Hence, the hypothesis viz., “point of
purchase and their level of satisfaction are not associated”, does not hold good. From the
analysis it is concluded that there is a close relationship between point of purchase and
level of satisfaction.

132
II. PERCENTAGE ANALYSIS
AWARENESS ABOUT THE PRODUCTS
Period of awareness by the consumers about products was studied taking twenty-
five items into consideration and findings shown in table below.
TABLE NO.5.44
PERIOD OF AWARENESS ABOUT THE PRODUCTS
No. Products
≤ 5
Years
6-10
Years
> 10
Years Total
1 Radio 25
(3.3%)
346
(46.1%)
379
(50.5%)
750
(100%)
2 TV 175
(23.3%)
230
(30.7%)
345
(46.0%)
750
(100%)
3 Fan 129
(18.6%)
225
(32.4%)
341
(49.1%)
695
(100%)
4 Iron Box 157
(21.7%)
319
(44.2%)
246
(34.1%)
722
(100%)
5 Washing Machine 173
(27.5%)
169
(26.9%)
287
(45.6%)
629
(100%)
6 Refrigerator 187
(28.1%)
286
(42.9%)
193
(29.0%)
666
(100%)
7 Induction Stove 324
(66.7%)
125
(25.7%)
37
(7.6%)
486
(100%)
8 Mixer 154
(25.7%)
249
(41.5%)
197
(32.8%)
600
(100%)
9 Computer 241
(57.9%)
127
(30.5%)
48
(11.5%)
416
(100%)
10 Water Heater 215
(47.9%)
167
(37.2%)
67
(14.9%)
449
(100%)
11 DVD Player 345
(51.2%)
287
(42.6%)
42
(6.2%)
674
(100%)

133
No. Products
≤ 5
Years
6-10
Years
> 10
Years Total
12 Microwave Oven 167
(64.0%)
79
(30.3%)
15
(5.7%)
261
(100%)
13 Air Conditioner 257
(46.8%)
168
(30.6%)
124
(22.6%)
549
(100%)
14 Stabilizer 328
(51.3%)
147
(23.0%)
165
(25.8%)
640
(100%)
15 Rice Cooker 249
(45.9%)
167
(30.8%)
127
(23.4%)
543
(100%)
16 Water Purifier 357
(70.6%)
124
(24.5%)
25
(4.9%)
506
(100%)
17 Electronic Power Controller79
(49.7%)
56
(35.2%)
24
(15.1%)
159
(100%)
18 Home theatre 235
(45.8%)
159
(31.0%)
119
(23.2%)
513
(100%)
19 Vacuum Cleaner 219
(57.2%)
105
(27.4%)
59
(15.4%)
383
(100%)
20 DTH 239
(52.3%)
154
(33.7%)
64
(14.0%)
457
(100%)
21 Digital Camera 138
(35.0%)
154
(39.1%)
102
(25.9%)
394
(100%)
22 Wall Clock 49
(6.5%)
308
(41.1%)
393
(52.4%)
750
(100%)
23 Sewing Machine 158
(34.0%)
168
(36.1%)
139
(29.9%)
465
(100%)
24 Toys 298
(42.1%)
302
(42.7%)
107
(15.1%)
707
(100%)
25 Others _______________ 419
(58.8%)
189
(26.5%)
105
(14.7%)
713
(100%)
Source: Computed from Primary Data
134
It is inferred from the above table that mostly all the respondents were aware about
all the products. Consumers were aware about products like radio, TV, fan, washing
machine and wall clock for more than 10 years with percentage being50.5, 46.0, 49.1, 45.6
and 52.4 percent respectively. The consumers were aware about the products like iron
box, refrigerator, mixer, digital camera, sewing machine and toys for 6-10 years as 44.2,
42.9, 41.5, 39.1, 36.1 and 42.7 percent respectively. The awareness in regard to products
like induction stove, computer, water heater, DVD player, microwave oven, air
conditioner, stabilizer, rice cooker, water purifier, electronic power controller, home
theatre, vacuum cleaner, DTH and other products was below 5 years as 66.7, 57.9, 47.9,
51.2, 64.0, 46.8, 51.3, 45.9, 70.6, 49.7, 45.8, 57.2, 52.3, and 58.8 percent respectively. It is
found from the analysis that majority (70.6%) of the consumers were aware about water
heater for less than 5 years.

135
SOURCE OF INFORMATION OF HOUSEHOLD ELECTRONIC PRODUCTS
In general, everyone in the society has come to know about the household
electronic products through some source or person. For the purpose of identifying source
from where the people got to know about household products, sources are classified into
nine categories viz., Radio, TV, Magazine, Newspapers, Posters and Hoarding, Dealers /
Retailers, Relatives/Family members, Window display and other sources. The details are
furnished in the following table.
TABLE NO.5.45
SOURCE OF INFORMATION OF HOUSEHOLD ELECTRONIC PRODUCTS
(Multiple choices)
Sl. No. Sources* No. of
ResponsesPercentage (Out of 750)
1 Radio 359 47.9
2 TV 658 87.7
3 Magazine 598 79.7
4 Newspapers 469 62.5
5 Posters and Hoarding 398 53.1
6 Dealer / Retailers 356 47.5
7 Relatives / Family members 514 68.5
8 Window display 249 33.2
9 Any other sources 341 45.5
Source: multiple responses were considered
It is surmised from the above table that 47.9 percent of the respondents were aware
about the product by listening to radio, 87.7 percent came to know about the product
through TV, 79.7 and 62.5 percent of the respondents knew about the product by reading
magazines and newspapers. 53.1 percent of the respondents through posters and hoardings,
and 47.5 percent of them came to know about the product through dealer/retailers,68.5
percent through relatives/family friends,33.2 percent by window displays and 45.5 percent
got to know of the products through other sources. It is noted from the analysis that
majority 87.7 percent were informed through the TV.

136
CHART NO.5.2
SOURCE OF INFORMATION OF THE HOUSEHOLD PRODUCTS
137
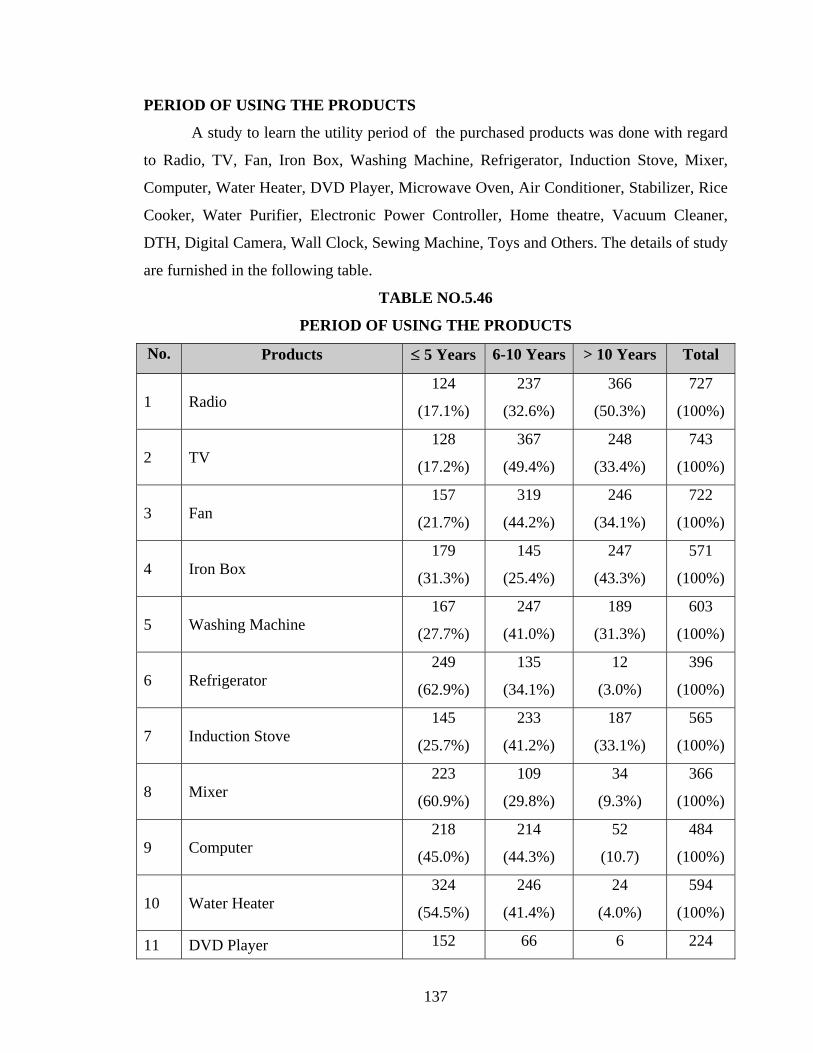
PERIOD OF USING THE PRODUCTS
A study to learn the utility period of the purchased products was done with regard
to Radio, TV, Fan, Iron Box, Washing Machine, Refrigerator, Induction Stove, Mixer,
Computer, Water Heater, DVD Player, Microwave Oven, Air Conditioner, Stabilizer, Rice
Cooker, Water Purifier, Electronic Power Controller, Home theatre, Vacuum Cleaner,
DTH, Digital Camera, Wall Clock, Sewing Machine, Toys and Others. The details of study
are furnished in the following table.
TABLE NO.5.46
PERIOD OF USING THE PRODUCTS
No. Products ≤ 5 Years 6-10 Years > 10 Years Total
1 Radio 124
(17.1%)
237
(32.6%)
366
(50.3%)
727
(100%)
2 TV 128
(17.2%)
367
(49.4%)
248
(33.4%)
743
(100%)
3 Fan 157
(21.7%)
319
(44.2%)
246
(34.1%)
722
(100%)
4 Iron Box 179
(31.3%)
145
(25.4%)
247
(43.3%)
571
(100%)
5 Washing Machine 167
(27.7%)
247
(41.0%)
189
(31.3%)
603
(100%)
6 Refrigerator 249
(62.9%)
135
(34.1%)
12
(3.0%)
396
(100%)
7 Induction Stove 145
(25.7%)
233
(41.2%)
187
(33.1%)
565
(100%)
8 Mixer 223
(60.9%)
109
(29.8%)
34
(9.3%)
366
(100%)
9 Computer 218
(45.0%)
214
(44.3%)
52
(10.7)
484
(100%)
10 Water Heater 324
(54.5%)
246
(41.4%)
24
(4.0%)
594
(100%)
11 DVD Player 152 66 6 224

138
No. Products ≤ 5 Years 6-10 Years > 10 Years Total
(67.9%) (29.5%) (2.7%) (100%)
12 Microwave Oven 245
(48.9%)
154
(30.6%)
105
(20.8%)
504
(100%)
13 Air Conditioner 297
(51.7%)
132
(23.0%)
145
(25.3%)
574
(100%)
14 Stabilizer 215
(44.4%)
154
(31.8%)
115
(23.8%)
484
(100%)
15 Rice Cooker 318
(72.4%)
105
(23.9%)
16
(3.6%)
439
(100%)
16 Water Purifier 57
(55.9%)
25
(24.5%)
20
(19.6%)
102
(100%)
17 Electronic Power Controller 219
(48.1%)
142
(31.2%)
94
(20.7%)
455
(100%)
18 Home theatre 192
(59.6%)
88
(27.3%)
42
(13.0%)
322
(100%)
19 Vacuum Cleaner 222
(55.2%)
142
(35.3%)
38
(9.5%)
402
(100%)
20 DTH 124
(37.8%)
122
(37.2%)
82
(25.0%)
328
(100%)
21 Digital Camera 34
(5.1%)
285
(42.9%)
345
(52.0%)
664
(100%)
22 Wall Clock 148
(37.2%)
142
(35.7%)
108
(27.1)
398
(100%)
23 Sewing Machine 257
(40.3%)
289
(45.3%)
92
(14.4%)
638
(100%)
24 Toys 348
(59.7%)
146
(25.0%)
89
(15.3%)
583
(100%)
25 Others 324
(72.3%)
109
(24.3%)
15
(3.3%)
448
(100%)
Source: Computed
139
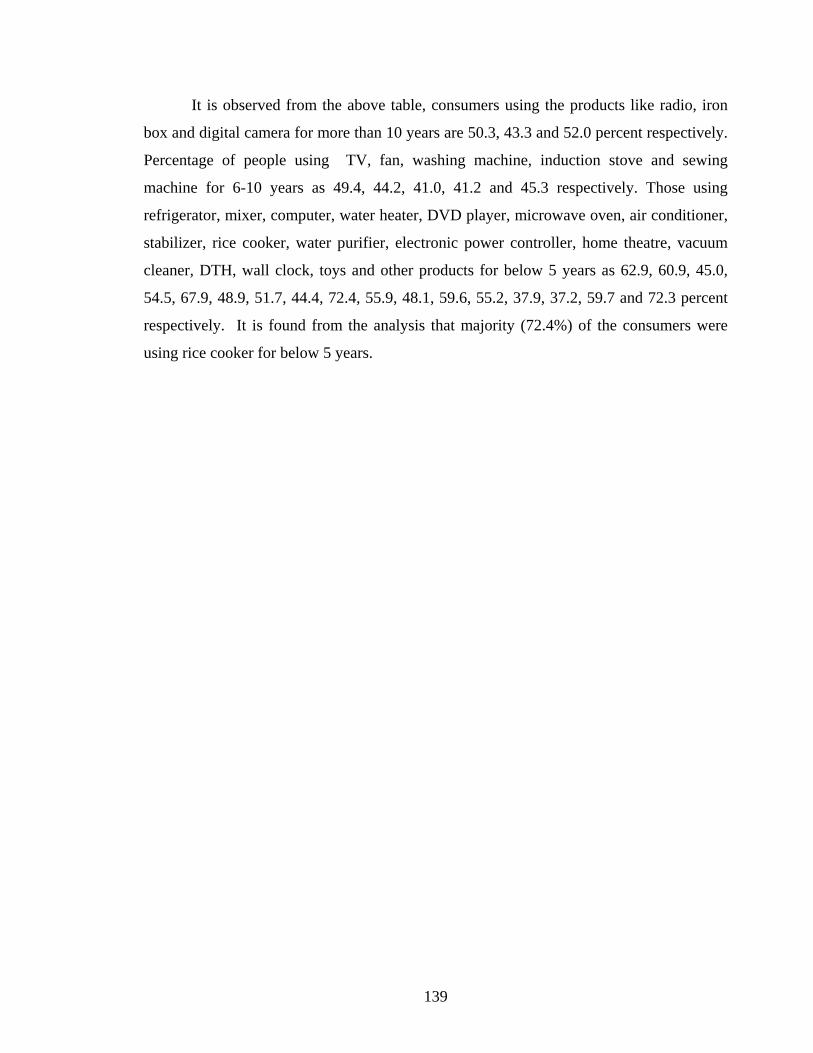
It is observed from the above table, consumers using the products like radio, iron
box and digital camera for more than 10 years are 50.3, 43.3 and 52.0 percent respectively.
Percentage of people using TV, fan, washing machine, induction stove and sewing
machine for 6-10 years as 49.4, 44.2, 41.0, 41.2 and 45.3 respectively. Those using
refrigerator, mixer, computer, water heater, DVD player, microwave oven, air conditioner,
stabilizer, rice cooker, water purifier, electronic power controller, home theatre, vacuum
cleaner, DTH, wall clock, toys and other products for below 5 years as 62.9, 60.9, 45.0,
54.5, 67.9, 48.9, 51.7, 44.4, 72.4, 55.9, 48.1, 59.6, 55.2, 37.9, 37.2, 59.7 and 72.3 percent
respectively. It is found from the analysis that majority (72.4%) of the consumers were
using rice cooker for below 5 years.

140
SOURCES OF INFLUENCE FOR THE PURCHASE DECISION
Analysis is made to know about the influencing sources to take purchase decision.
The radio, TV, magazine, newspapers, posters and hoarding, dealers / retailers,
relatives/family members, window display and other sources. The details are furnished in
the following table.
TABLE NO.5.47
SOURCES OF INFLUENCE FOR THE PURCHASE DECISION
Sl. No. Sources* No. of
ResponsesPercentage (Out of 750)
1 Radio 254 33.9 2 TV 465 62.0 3 Magazine 387 51.6 4 Newspapers 415 55.3 5 Posters and Hoarding 354 47.2 6 Dealer / Retailers 346 46.1 7 Relatives / Family members 512 68.3 8 Window display 256 34.1 9 Any other sources 347 46.3
* Multiple responses were considered Source: Computed from Primary Data
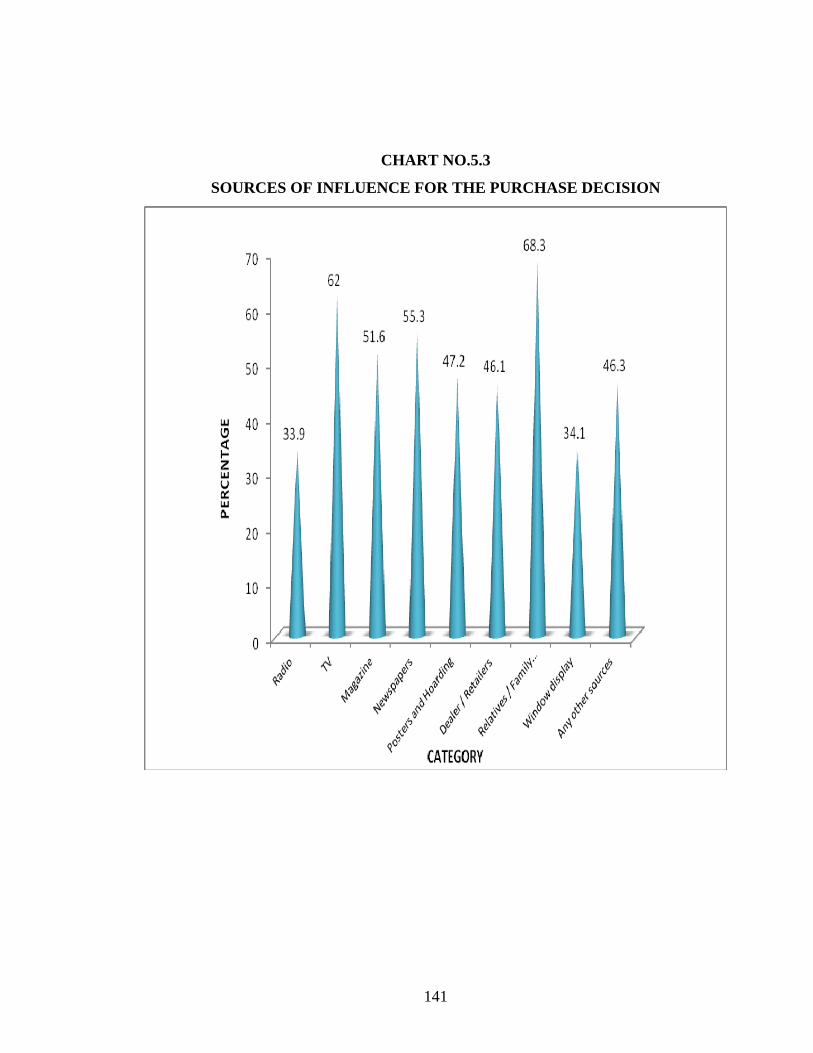
It is determined from the above table that the purchase decision was influenced by
Relatives/Family members showing highest percentage of 68.3, followed by TV 62
percent, Newspaper 55.3percent, Magazines 51.6percent, Posters and Hoarding 47.2
percent, other sources 46.3 percent closely followed by Dealers/Retailers 46.1percent,
Window displays 34.1percent and Radio 33.9 percent.
It is noted from the analysis that majority (68.3) of the respondents gained the
maximum impact on the purchase decision through relatives / family members.
141
CHART NO.5.3
SOURCES OF INFLUENCE FOR THE PURCHASE DECISION
142
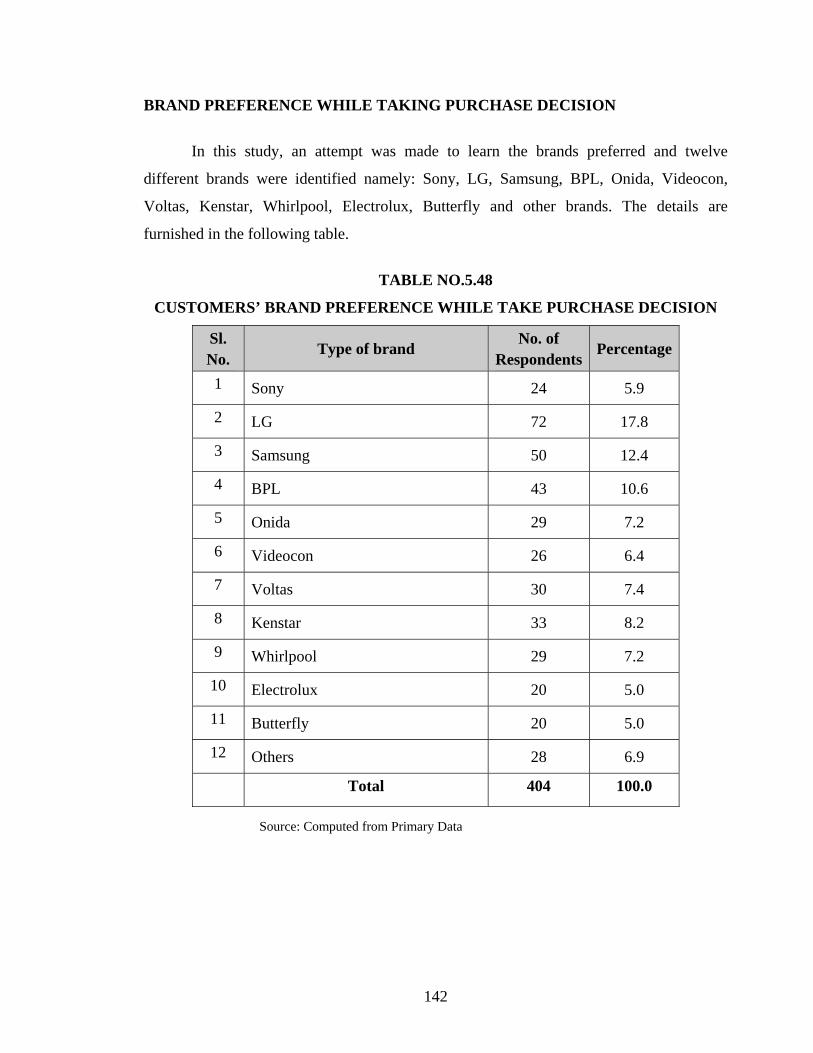
BRAND PREFERENCE WHILE TAKING PURCHASE DECISION
In this study, an attempt was made to learn the brands preferred and twelve
different brands were identified namely: Sony, LG, Samsung, BPL, Onida, Videocon,
Voltas, Kenstar, Whirlpool, Electrolux, Butterfly and other brands. The details are
furnished in the following table.
TABLE NO.5.48
CUSTOMERS’ BRAND PREFERENCE WHILE TAKE PURCHASE DECISION
Sl. No.
Type of brand No. of Respondents
Percentage
1 Sony 24 5.9
2 LG 72 17.8
3 Samsung 50 12.4
4 BPL 43 10.6
5 Onida 29 7.2
6 Videocon 26 6.4
7 Voltas 30 7.4
8 Kenstar 33 8.2
9 Whirlpool 29 7.2
10 Electrolux 20 5.0
11 Butterfly 20 5.0
12 Others 28 6.9
Total 404 100.0
Source: Computed from Primary Data
143
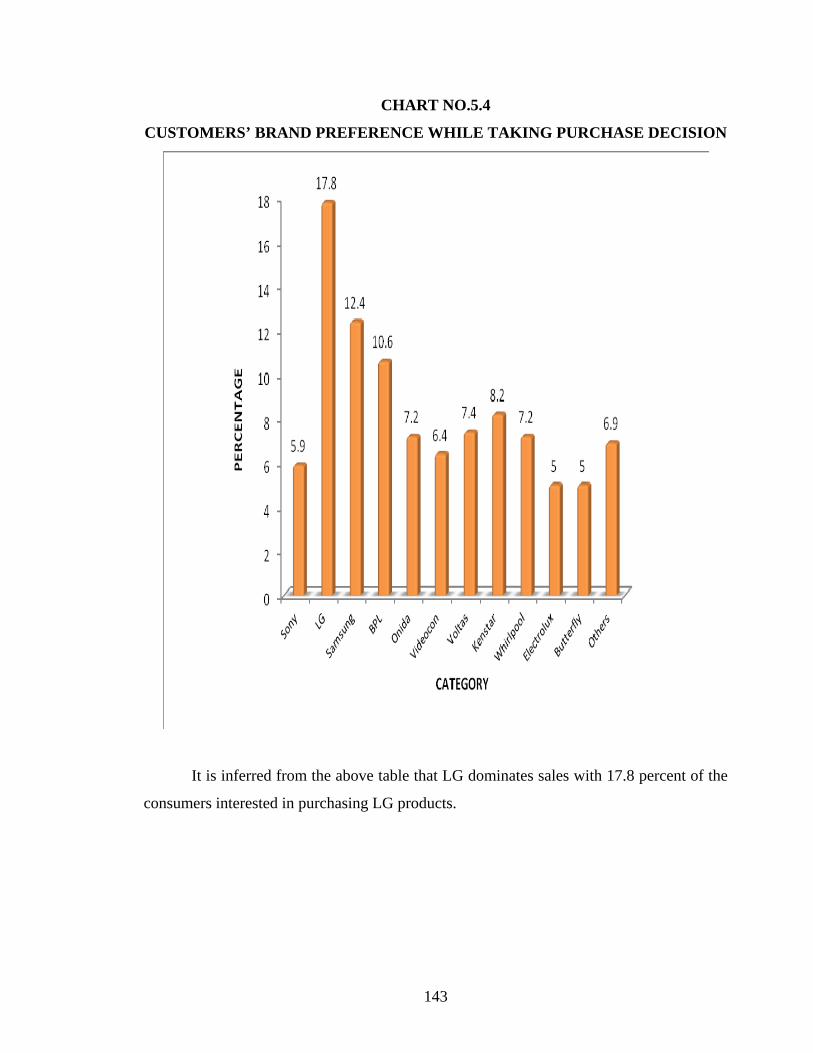
CHART NO.5.4
CUSTOMERS’ BRAND PREFERENCE WHILE TAKING PURCHASE DECISION
It is inferred from the above table that LG dominates sales with 17.8 percent of the
consumers interested in purchasing LG products.

144
SPECIFIC BRAND PREFERENCE OF CUSTOMERS AT EVERY PURCHASE
To identify whether consumers asked and insisted on specific brand at every
purchase, a survey was made and details are furnished in the following table.
TABLE NO.5.49
SPECIFIC BRAND PRERENCE AT EVERY PURCHASE
Sl. No. Opinion No. of Respondents Percentage
1 Yes 259 64.1
2 No 145 35.9
Total 404 100.0
Source: Computed from Primary Data
As shown 64.1 percent of the consumers insisted on specific brand every time they
bought products, whereas 35.9 percent were not so particular about the brand.
CHART NO.5.5
SPECIFIC BRAND PREFERENCE OF CUSTOMERS AT EVERY PURCHASE
145
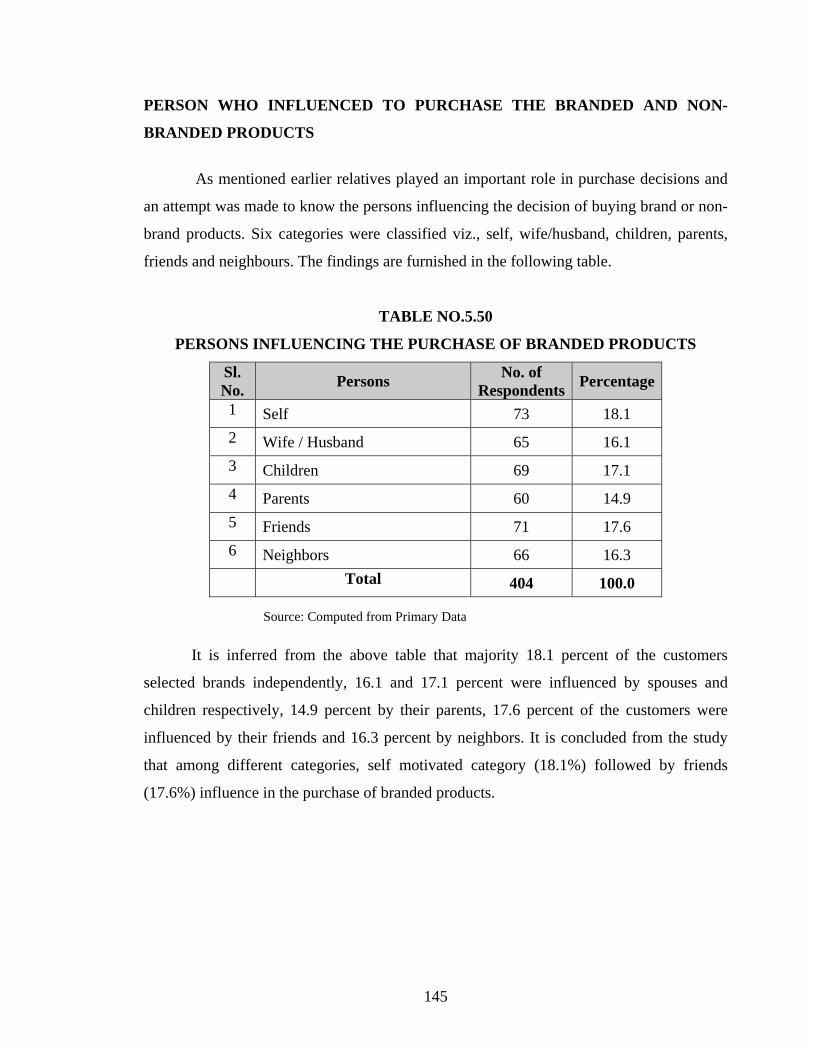
PERSON WHO INFLUENCED TO PURCHASE THE BRANDED AND NON-
BRANDED PRODUCTS
As mentioned earlier relatives played an important role in purchase decisions and
an attempt was made to know the persons influencing the decision of buying brand or non-
brand products. Six categories were classified viz., self, wife/husband, children, parents,
friends and neighbours. The findings are furnished in the following table.
TABLE NO.5.50
PERSONS INFLUENCING THE PURCHASE OF BRANDED PRODUCTS
Sl. No. Persons No. of
Respondents Percentage
1 Self 73 18.1 2 Wife / Husband 65 16.1 3 Children 69 17.1 4 Parents 60 14.9 5 Friends 71 17.6 6 Neighbors 66 16.3 Total 404 100.0
Source: Computed from Primary Data
It is inferred from the above table that majority 18.1 percent of the customers
selected brands independently, 16.1 and 17.1 percent were influenced by spouses and
children respectively, 14.9 percent by their parents, 17.6 percent of the customers were
influenced by their friends and 16.3 percent by neighbors. It is concluded from the study
that among different categories, self motivated category (18.1%) followed by friends
(17.6%) influence in the purchase of branded products.

146
CHART NO.5.6
PERSONS INFLUENCING THE PURCHASE OF BRANDED PRODUCTS
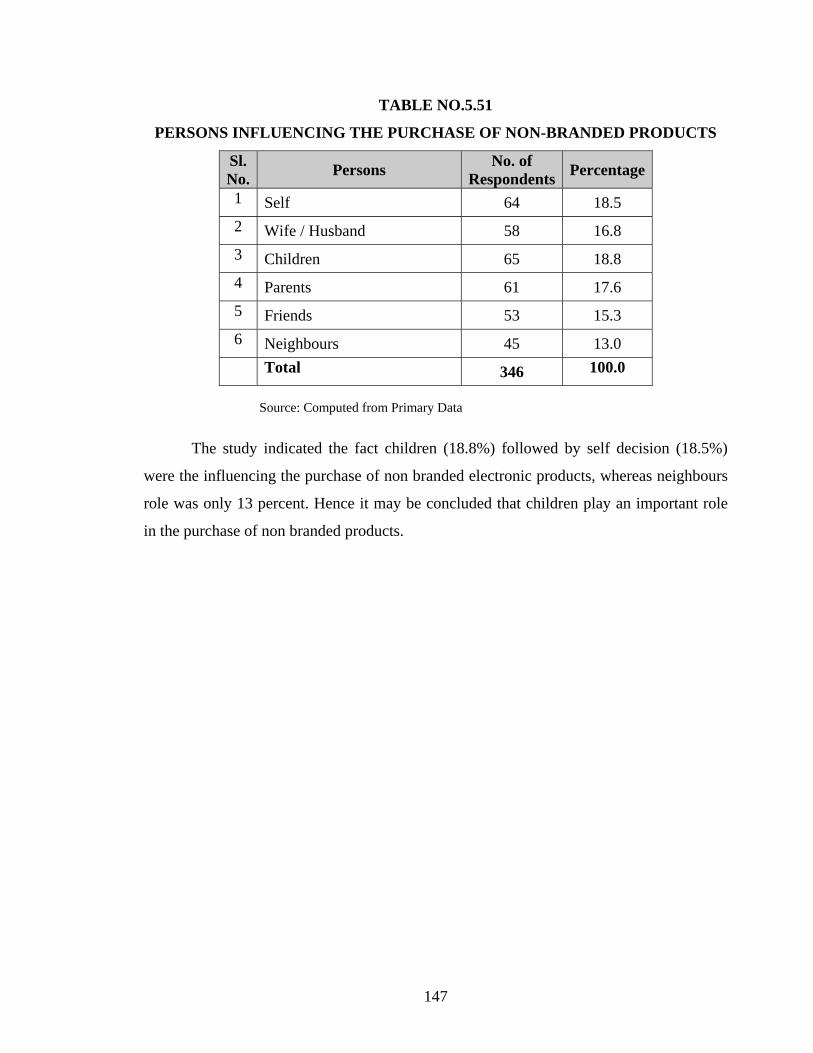
147
TABLE NO.5.51
PERSONS INFLUENCING THE PURCHASE OF NON-BRANDED PRODUCTS
Sl. No. Persons No. of
Respondents Percentage
1 Self 64 18.5 2 Wife / Husband 58 16.8 3 Children 65 18.8 4 Parents 61 17.6 5 Friends 53 15.3 6 Neighbours 45 13.0 Total 346 100.0
Source: Computed from Primary Data
The study indicated the fact children (18.8%) followed by self decision (18.5%)
were the influencing the purchase of non branded electronic products, whereas neighbours
role was only 13 percent. Hence it may be concluded that children play an important role
in the purchase of non branded products.
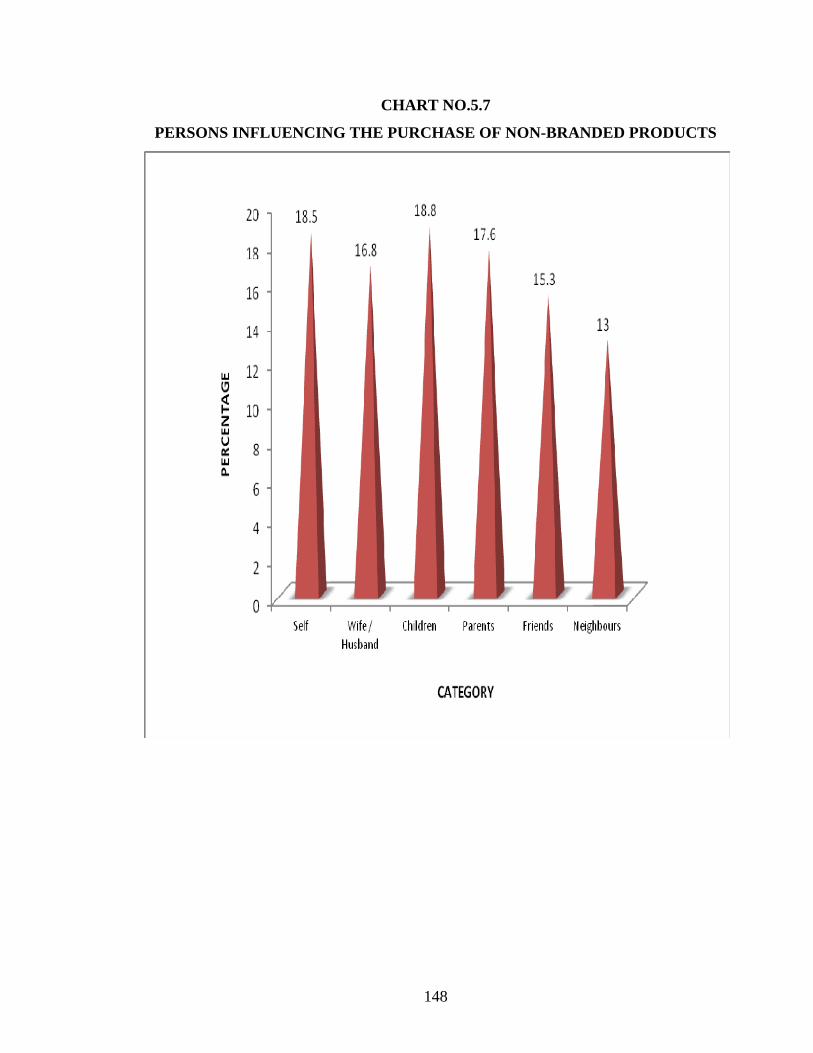
148
CHART NO.5.7
PERSONS INFLUENCING THE PURCHASE OF NON-BRANDED PRODUCTS
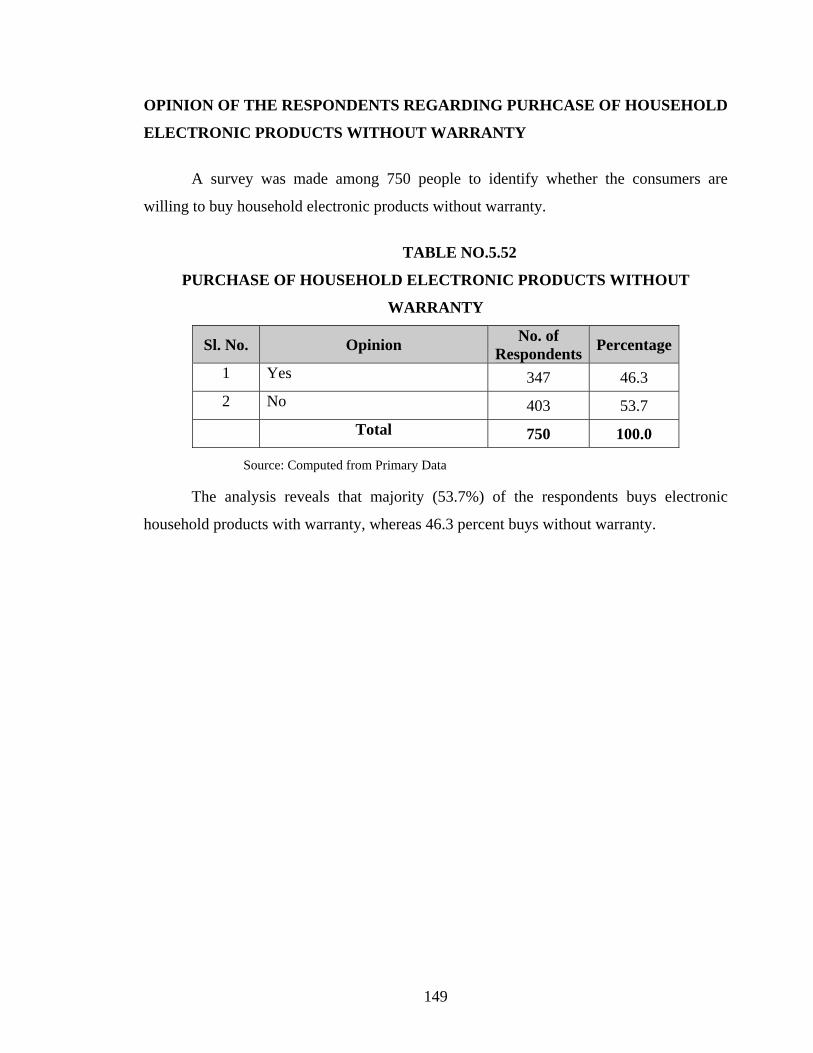
149
OPINION OF THE RESPONDENTS REGARDING PURHCASE OF HOUSEHOLD
ELECTRONIC PRODUCTS WITHOUT WARRANTY
A survey was made among 750 people to identify whether the consumers are
willing to buy household electronic products without warranty.
TABLE NO.5.52
PURCHASE OF HOUSEHOLD ELECTRONIC PRODUCTS WITHOUT
WARRANTY
Sl. No. Opinion No. of Respondents Percentage
1 Yes 347 46.3 2 No 403 53.7 Total 750 100.0
Source: Computed from Primary Data
The analysis reveals that majority (53.7%) of the respondents buys electronic
household products with warranty, whereas 46.3 percent buys without warranty.

150
CHART NO.5.8
PURCHASE OF HOUSEHOLD ELECTRONIC PRODUCTS WITHOUT
WARRANTY
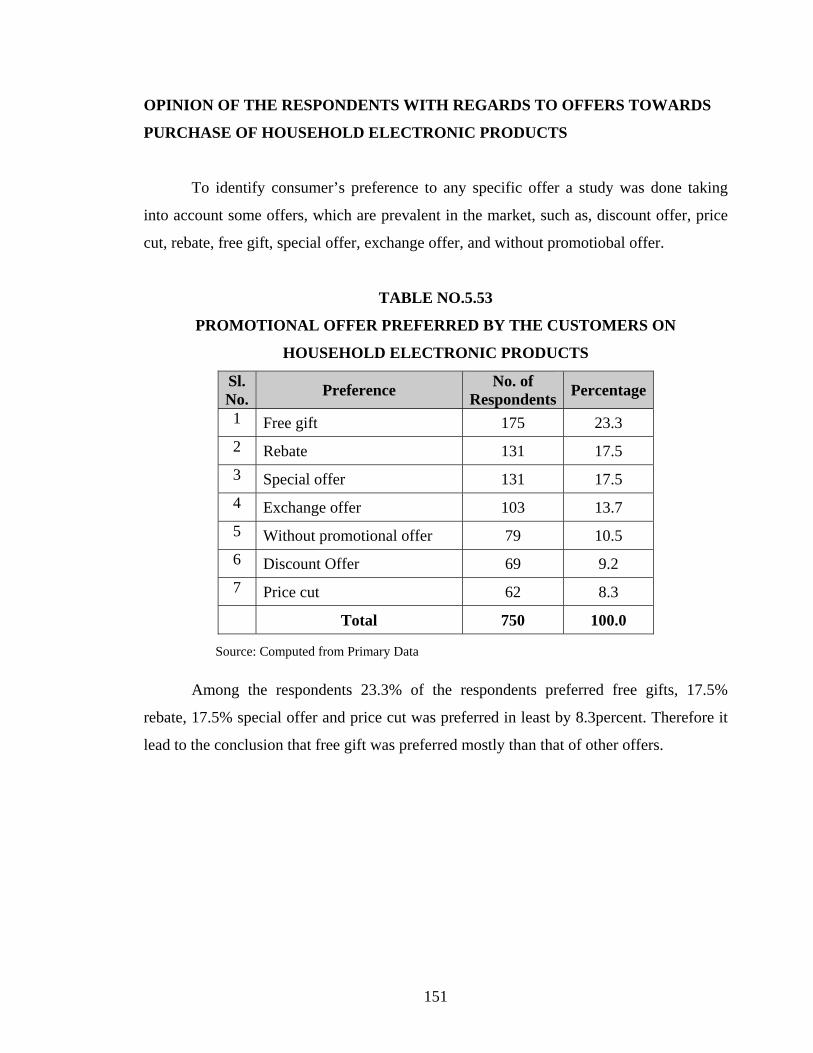
151
OPINION OF THE RESPONDENTS WITH REGARDS TO OFFERS TOWARDS
PURCHASE OF HOUSEHOLD ELECTRONIC PRODUCTS
To identify consumer’s preference to any specific offer a study was done taking
into account some offers, which are prevalent in the market, such as, discount offer, price
cut, rebate, free gift, special offer, exchange offer, and without promotiobal offer.
TABLE NO.5.53
PROMOTIONAL OFFER PREFERRED BY THE CUSTOMERS ON
HOUSEHOLD ELECTRONIC PRODUCTS
Sl. No. Preference No. of
Respondents Percentage
1 Free gift 175 23.3 2 Rebate 131 17.5 3 Special offer 131 17.5 4 Exchange offer 103 13.7 5 Without promotional offer 79 10.5 6 Discount Offer 69 9.2 7 Price cut 62 8.3 Total 750 100.0
Source: Computed from Primary Data
Among the respondents 23.3% of the respondents preferred free gifts, 17.5%
rebate, 17.5% special offer and price cut was preferred in least by 8.3percent. Therefore it
lead to the conclusion that free gift was preferred mostly than that of other offers.
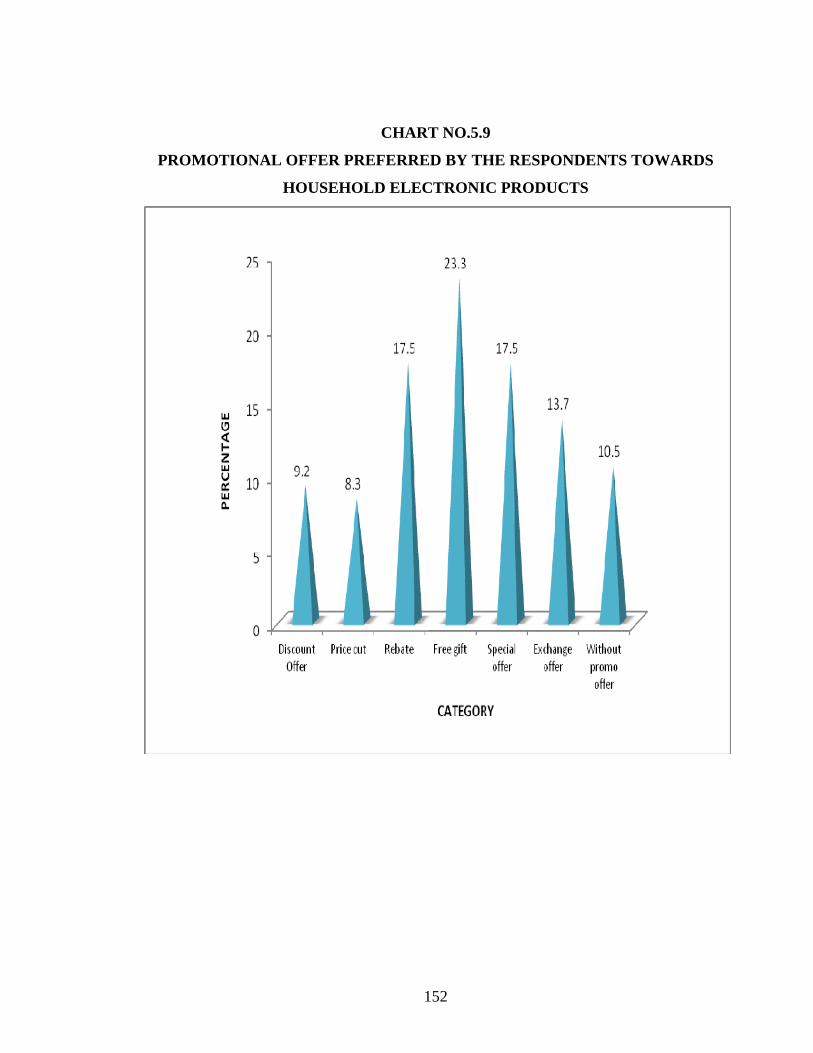
152
CHART NO.5.9
PROMOTIONAL OFFER PREFERRED BY THE RESPONDENTS TOWARDS
HOUSEHOLD ELECTRONIC PRODUCTS
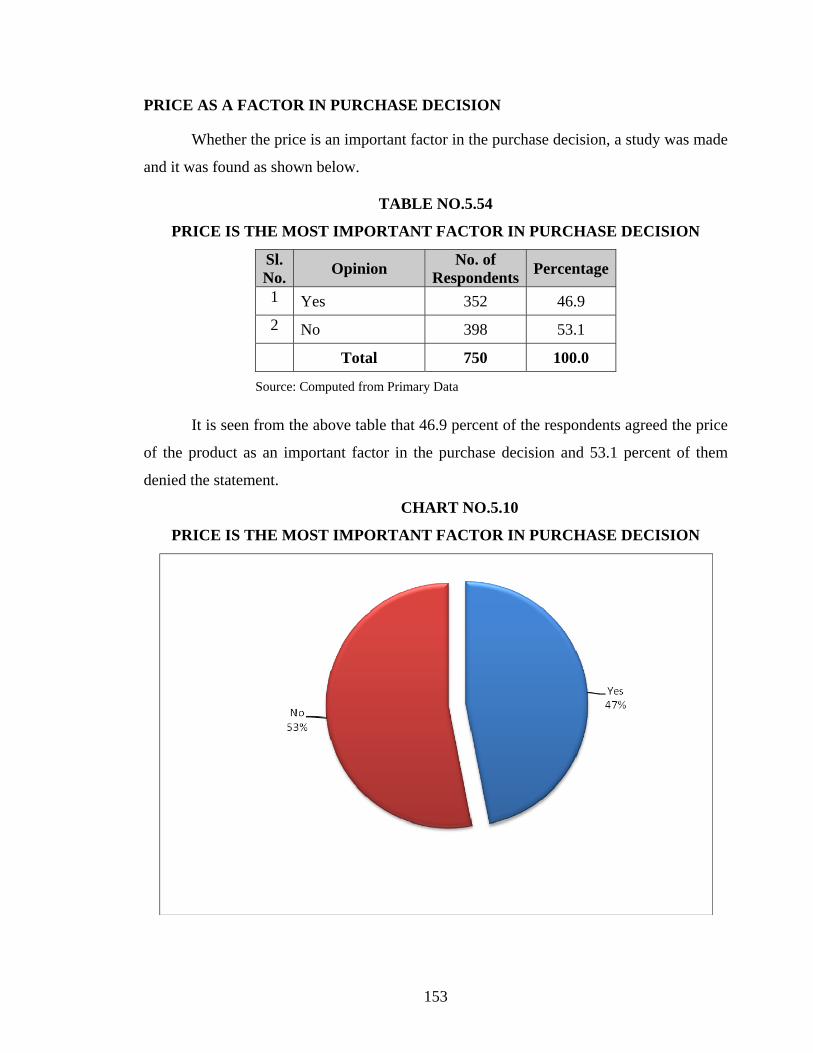
153
PRICE AS A FACTOR IN PURCHASE DECISION
Whether the price is an important factor in the purchase decision, a study was made
and it was found as shown below.
TABLE NO.5.54
PRICE IS THE MOST IMPORTANT FACTOR IN PURCHASE DECISION
Sl. No. Opinion No. of
Respondents Percentage
1 Yes 352 46.9 2 No 398 53.1 Total 750 100.0
Source: Computed from Primary Data
It is seen from the above table that 46.9 percent of the respondents agreed the price
of the product as an important factor in the purchase decision and 53.1 percent of them
denied the statement.
CHART NO.5.10
PRICE IS THE MOST IMPORTANT FACTOR IN PURCHASE DECISION
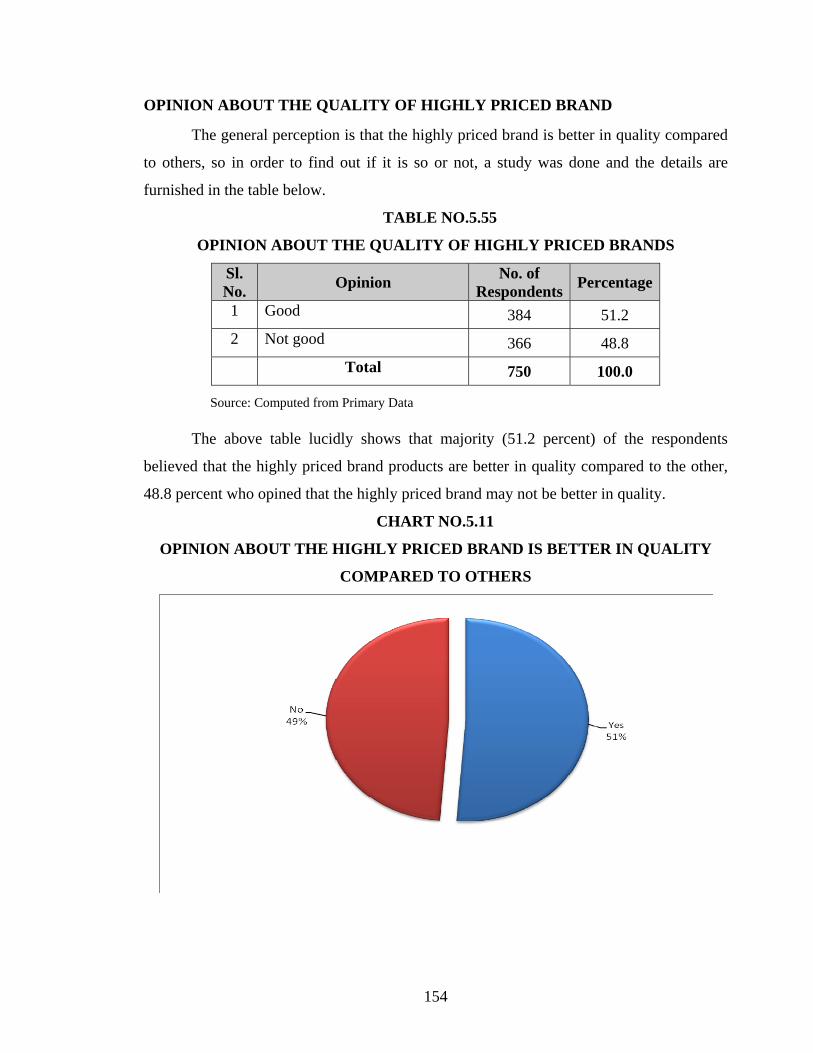
154
OPINION ABOUT THE QUALITY OF HIGHLY PRICED BRAND
The general perception is that the highly priced brand is better in quality compared
to others, so in order to find out if it is so or not, a study was done and the details are
furnished in the table below.
TABLE NO.5.55
OPINION ABOUT THE QUALITY OF HIGHLY PRICED BRANDS
Sl. No. Opinion No. of
Respondents Percentage
1 Good 384 51.2 2 Not good 366 48.8 Total 750 100.0
Source: Computed from Primary Data
The above table lucidly shows that majority (51.2 percent) of the respondents
believed that the highly priced brand products are better in quality compared to the other,
48.8 percent who opined that the highly priced brand may not be better in quality.
CHART NO.5.11
OPINION ABOUT THE HIGHLY PRICED BRAND IS BETTER IN QUALITY
COMPARED TO OTHERS

155
CUSTOMERS OPINION REGARDING PLACE OF PURCHASE
Customers’ behavior and preference regarding their place of purchase was studied
and whether they purchased in the same shop or different shops every time is tabulated
below.
TABLE NO. 5.56
OPINION OF THE RESPONDENTS ABOUT PLACE OF PURCHASE
Sl. No. Opinion No. of
Respondents Percentage
1 Same shop 410 54.7
2 Any shop 340 45.3
Total 750 100.0
Source: Computed from Primary Data
It is clear from the above table that 54.7 percent of the consumers preferred to buy
from the same shop and remaining 45.3 percent of them did not mind buying from any
store.
CHART NO.5.12
OPINION OF THE RESPONDENTS ABOUT PLACE OF PURCHASE
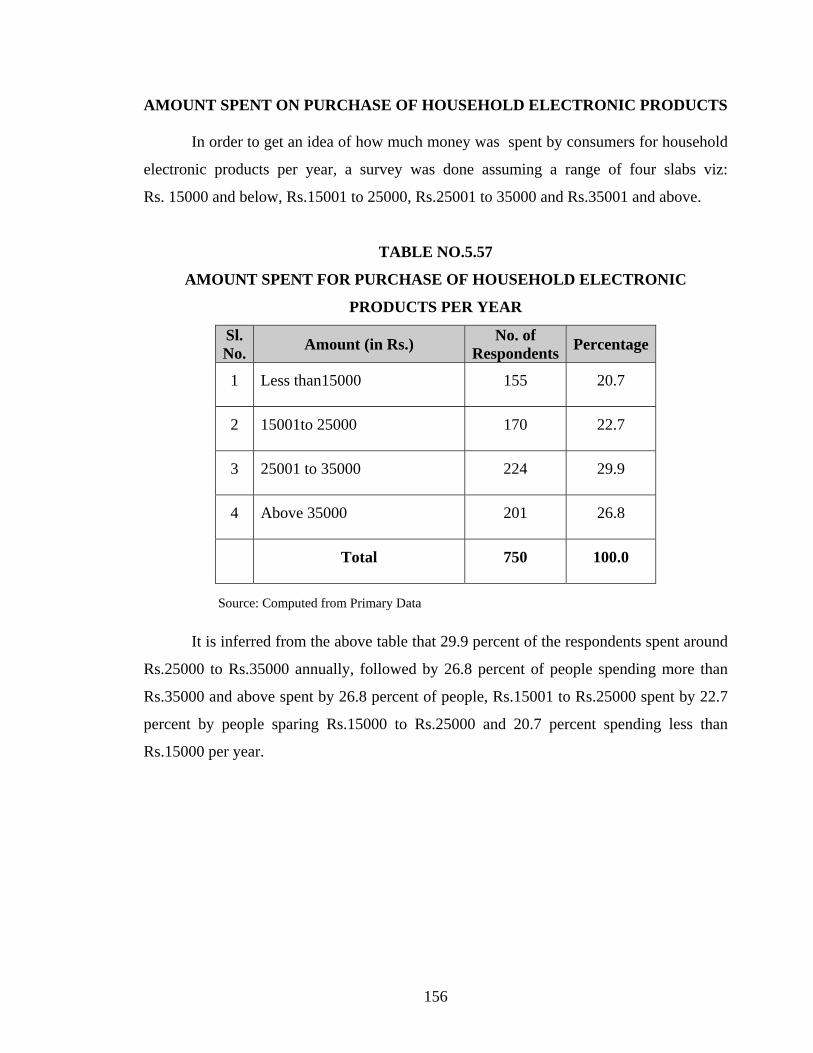
156
AMOUNT SPENT ON PURCHASE OF HOUSEHOLD ELECTRONIC PRODUCTS
In order to get an idea of how much money was spent by consumers for household
electronic products per year, a survey was done assuming a range of four slabs viz:
Rs. 15000 and below, Rs.15001 to 25000, Rs.25001 to 35000 and Rs.35001 and above.
TABLE NO.5.57
AMOUNT SPENT FOR PURCHASE OF HOUSEHOLD ELECTRONIC
PRODUCTS PER YEAR
Sl. No. Amount (in Rs.) No. of
Respondents Percentage
1 Less than15000 155 20.7
2 15001to 25000 170 22.7
3 25001 to 35000 224 29.9
4 Above 35000 201 26.8
Total 750 100.0
Source: Computed from Primary Data
It is inferred from the above table that 29.9 percent of the respondents spent around
Rs.25000 to Rs.35000 annually, followed by 26.8 percent of people spending more than
Rs.35000 and above spent by 26.8 percent of people, Rs.15001 to Rs.25000 spent by 22.7
percent by people sparing Rs.15000 to Rs.25000 and 20.7 percent spending less than
Rs.15000 per year.
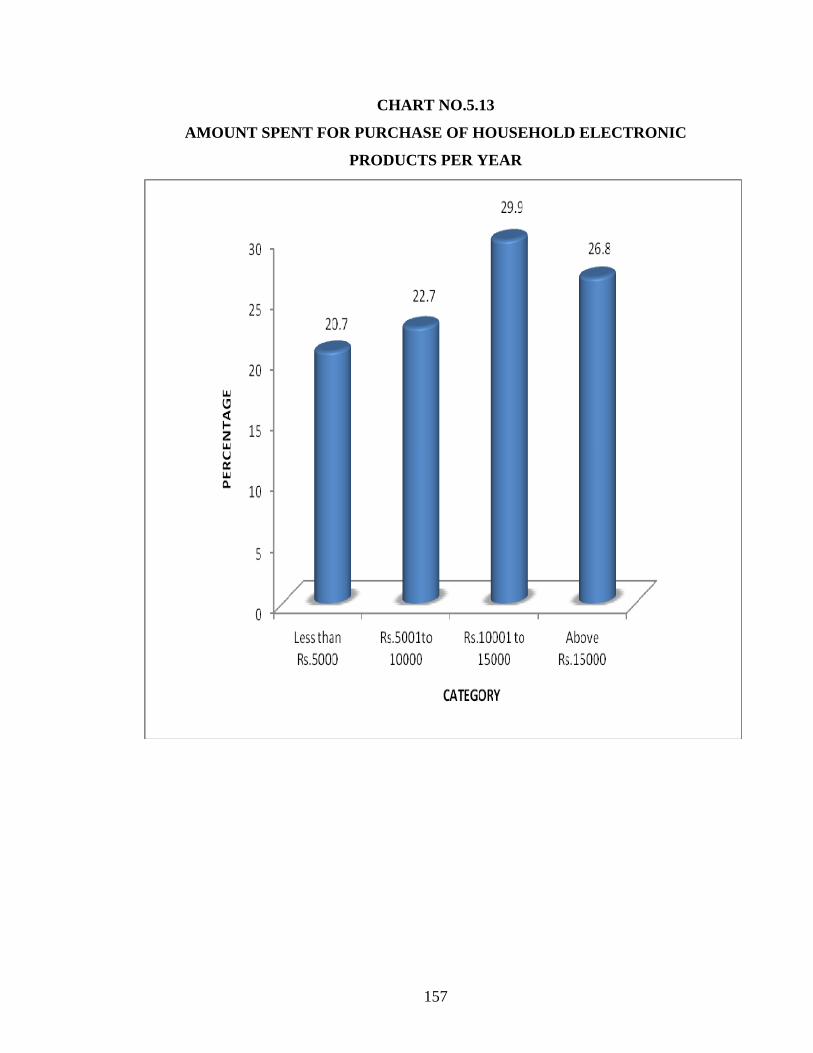
157
CHART NO.5.13
AMOUNT SPENT FOR PURCHASE OF HOUSEHOLD ELECTRONIC
PRODUCTS PER YEAR

158
CUSTOMERS’ OBSERVATION ON ISO/ISI CERTIFIED PRODUCTS
An attempt was made to analyse the customers’ observation in relation to the
quality mark such as ISI, ISO, authorized by Government to the products, before
purchasing the electronic products. Their habits of checking them has been classified into
four categories viz., always, frequently, sometimes and never for better understanding.
TABLE NO.5.58
CUSTOMERS’ OBSERVATION ON ISO/ISI CERTIFIED PRODUCTS
Sl. No. Opinion No. of
Respondents Percentage
1 Always 204 27.2
2 Frequently 284 37.9
3 Sometimes 170 22.7
4 Never 92 12.3
Total 750 100.0
Source: Computed from Primary Data
It is inferred from the above table that only 27.2 percent of the consumers were
always examining the authorized mark before buying, whereas 37.9 percent of the
respondents were frequently viewing the certificate mark, 22.7 percent examined the
authorized mark sometime and the balance 12.3 percent of the consumers never gave any
attention to ISI and ISO certificate marks. So the majority happened to be those who only
frequently observed certificate marks

159
CHART NO.5.14
CUSTOMERS’ OBSERVATION ON ISO/ISI CERTIFIED PRODUCTS

160
PREFERENCE TO ISI, ISO PRODUCTS
An attempt was made to identify the preference of customers towards ISI, ISO
products in the market. For this purpose, the preference to ISI, ISO products are classified
viz., always, frequently, sometimes and never. Most of the electronic products are ISI; ISO
certified products and many products are sold without these certification.
TABLE NO.5.59
PREFERENCE TO ISI & ISO CERTIFIED PRODUCTS
Sl. No. Opinion No. of
Respondents Percentage
1 Always 226 30.1
2 Frequently 235 31.3
3 Sometimes 151 20.1
4 Never 138 18.4
Total 750 100.0
Source: Computed from Primary Data
Above table shows that 30.1 percent of the consumers always insisted on ISI and
ISO products, 31.3 percent only frequently, 20.1 percent of the consumers preferred
sometimes and 18.4 percent never bought ISI and ISO products. It is noted from the
analysis that only (30.1%) of the respondents were always interested to purchase the ISI
and ISO goods.
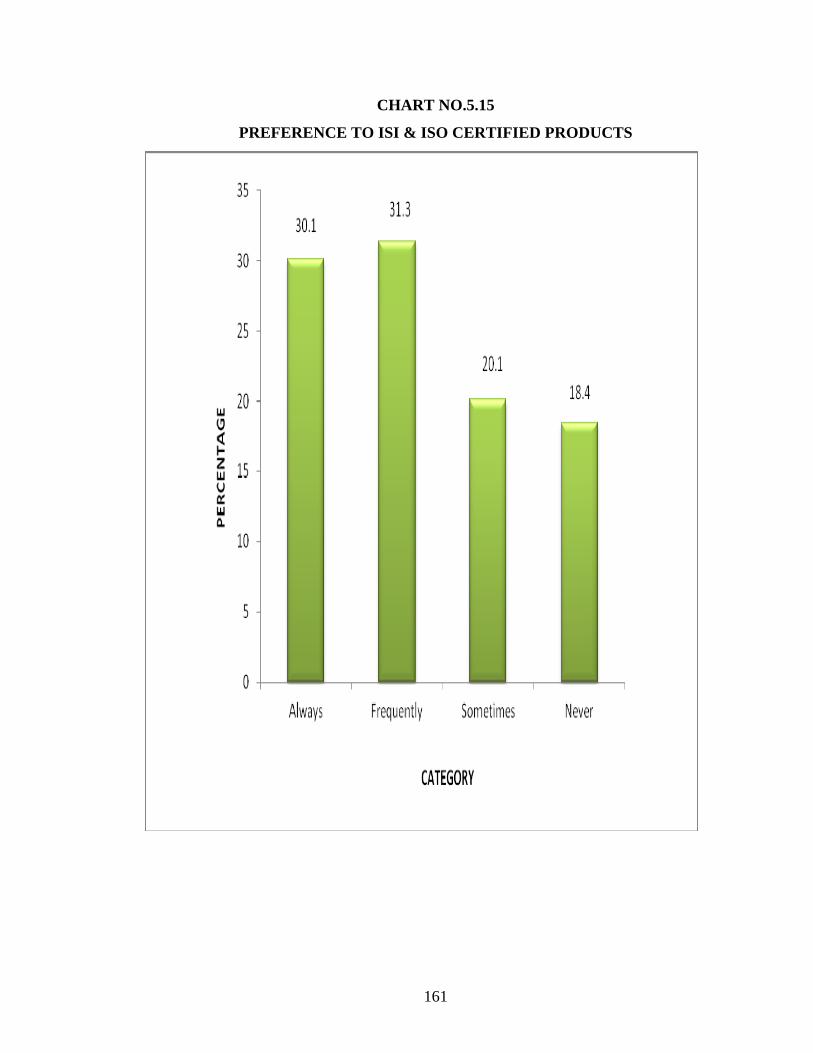
161
CHART NO.5.15
PREFERENCE TO ISI & ISO CERTIFIED PRODUCTS

162
OPINION ABOUT THE PRICE OF THE ISI/ISO CERTIFIED PRODUCT
A study is made to assess the opinion of the customers about the price of the
products with ISI and ISO.
TABLE NO.5.60
OPINION ABOUT THE PRICE OF ISI/ISO CERTIFIED PRODUCT
Sl. No. Opinion No. of
Respondents Percentage
1 Yes 411 54.8
2 No 339 45.2
Total 750 100.0
Source: Computed from Primary Data Majority (54.8 percent) of the consumers opined ISI and ISO certified goods are
costlier, whereas the balance 45.2 percent thought it was not so.
CHART NO.5.16
OPINION ABOUT THE PRICE OF ISI/ISO CERTIFIED PRODUCT
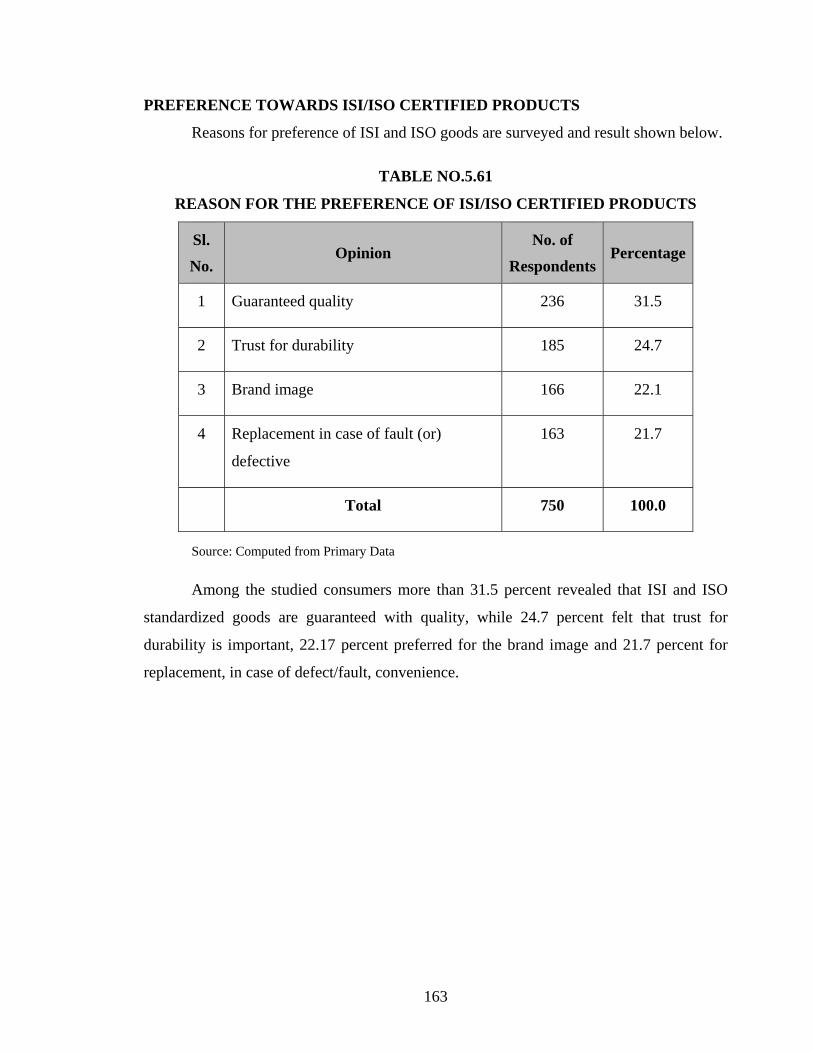
163
PREFERENCE TOWARDS ISI/ISO CERTIFIED PRODUCTS
Reasons for preference of ISI and ISO goods are surveyed and result shown below.
TABLE NO.5.61
REASON FOR THE PREFERENCE OF ISI/ISO CERTIFIED PRODUCTS
Sl.
No. Opinion
No. of
Respondents Percentage
1 Guaranteed quality 236 31.5
2 Trust for durability 185 24.7
3 Brand image 166 22.1
4 Replacement in case of fault (or)
defective
163 21.7
Total 750 100.0
Source: Computed from Primary Data
Among the studied consumers more than 31.5 percent revealed that ISI and ISO
standardized goods are guaranteed with quality, while 24.7 percent felt that trust for
durability is important, 22.17 percent preferred for the brand image and 21.7 percent for
replacement, in case of defect/fault, convenience.
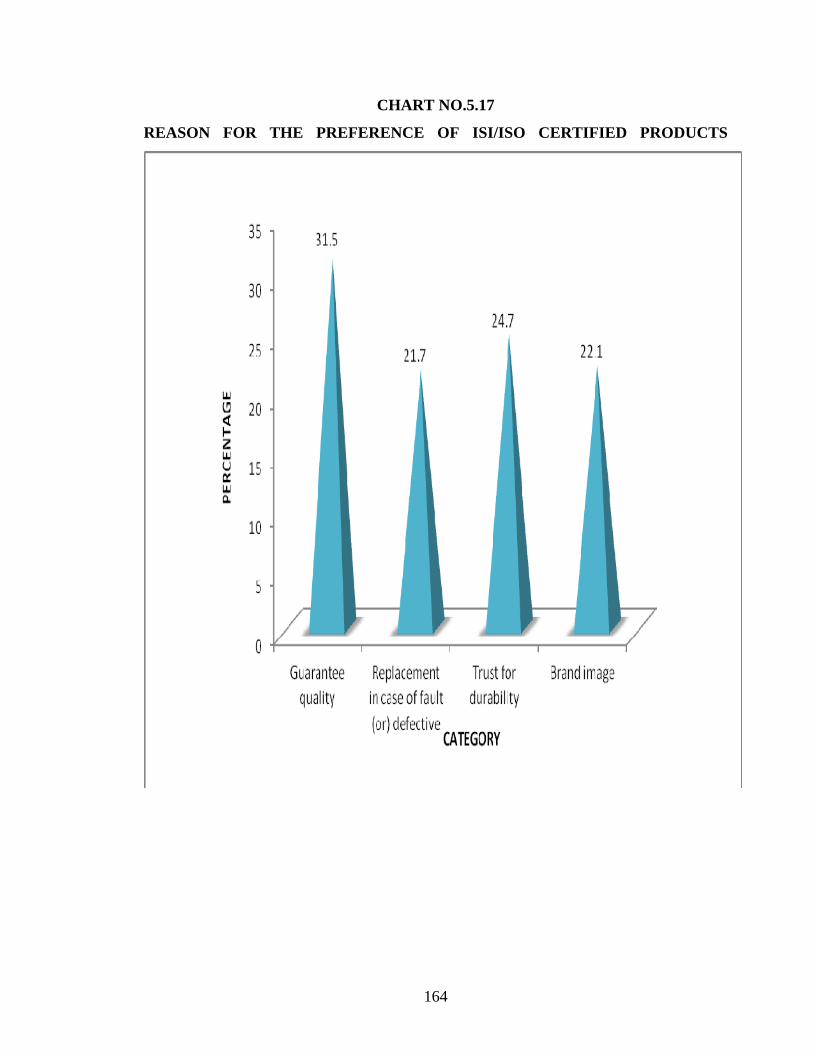
164
CHART NO.5.17
REASON FOR THE PREFERENCE OF ISI/ISO CERTIFIED PRODUCTS

165
REASONS FOR NOT SELECTING ISI/ISO CERTIFIED PRODUCTS
The various reasons for not selecting the ISI/ISO marked goods was studied among
the consumers and are stated below.
TABLE NO.5.62
REASONS FOR NOT SELECTING ISI/ISO CERTIFIED PRODUCTS
Sl. No. Reasons No. of
Respondents Percentage
1 Costly 205 27.3
2 Not up to the standard 158 21.1
3 Not necessary, the same quality as to other goods 217 28.9
4 Bulk purchase 134 17.9
5 Any other 36 4.8
Total 750 100.0
Source: Computed from Primary Data
It is analysed from the above table that 27.3 of consumers did not go for ISI
certified goods because of high price, 21.1 percent thought ISI/ISO marked goods are not
up to the standard, 28.9 percent of the customers had doubts on the quality in comparison
to other goods, 17.9 percent because it has to be purchased in bulk and 4.8 percent of the
consumers for other reasons. It is found from the analysis that majority thought the quality
of ISI/ISO marked goods is same as to other goods.

166
CHART NO.5.18
REASONS FOR NOT SELECTING ISI/ISO CERTIFIED PRODUCTS
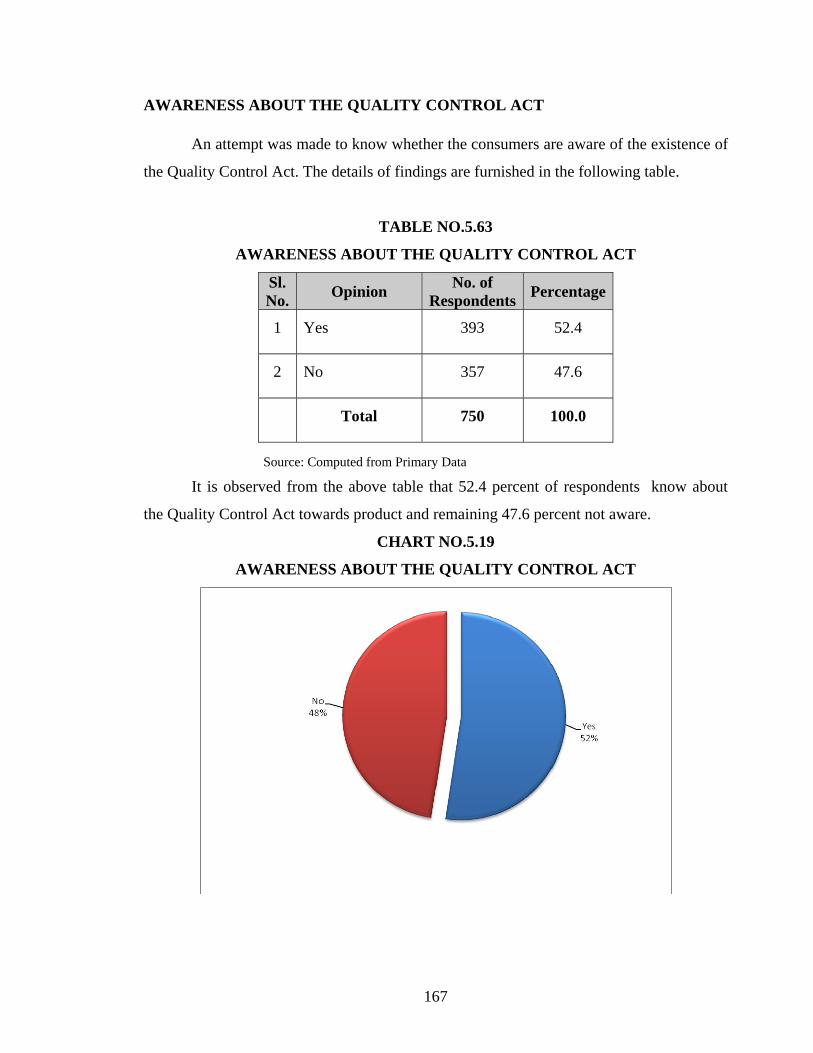
167
AWARENESS ABOUT THE QUALITY CONTROL ACT
An attempt was made to know whether the consumers are aware of the existence of
the Quality Control Act. The details of findings are furnished in the following table.
TABLE NO.5.63
AWARENESS ABOUT THE QUALITY CONTROL ACT
Sl. No. Opinion No. of
Respondents Percentage
1 Yes 393 52.4
2 No 357 47.6
Total 750 100.0
Source: Computed from Primary Data It is observed from the above table that 52.4 percent of respondents know about
the Quality Control Act towards product and remaining 47.6 percent not aware.
CHART NO.5.19
AWARENESS ABOUT THE QUALITY CONTROL ACT
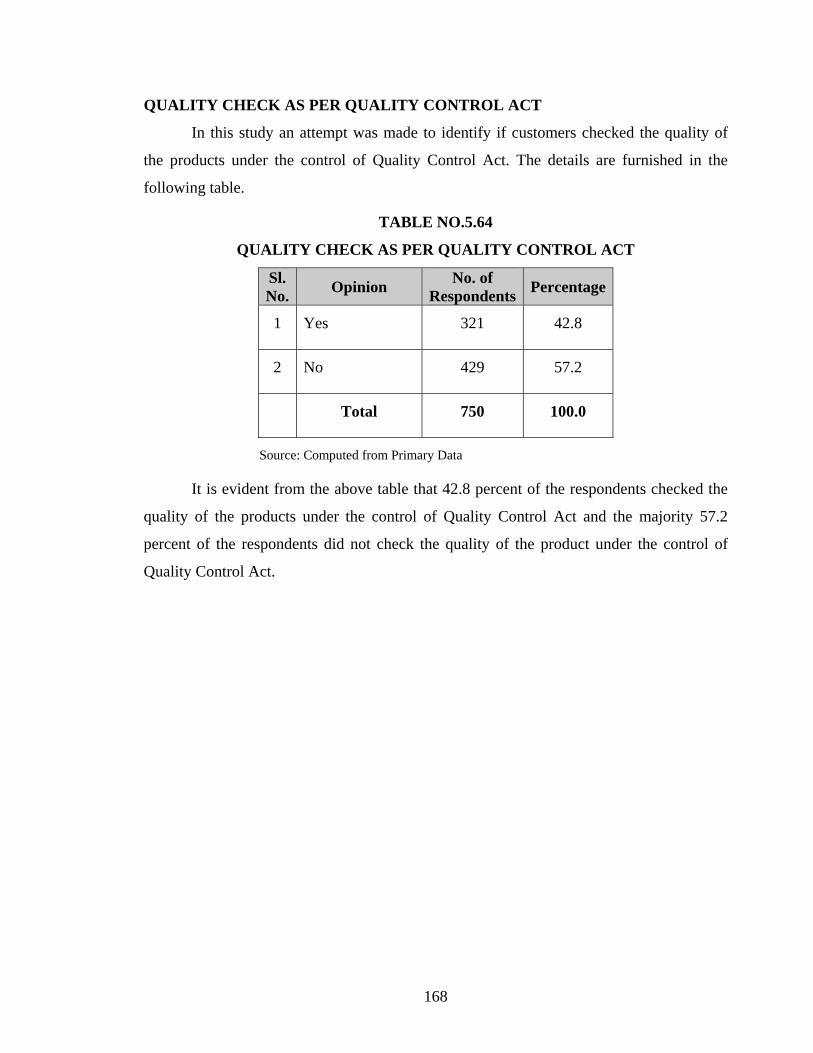
168
QUALITY CHECK AS PER QUALITY CONTROL ACT
In this study an attempt was made to identify if customers checked the quality of
the products under the control of Quality Control Act. The details are furnished in the
following table.
TABLE NO.5.64
QUALITY CHECK AS PER QUALITY CONTROL ACT
Sl. No. Opinion No. of
Respondents Percentage
1 Yes 321 42.8
2 No 429 57.2
Total 750 100.0
Source: Computed from Primary Data
It is evident from the above table that 42.8 percent of the respondents checked the
quality of the products under the control of Quality Control Act and the majority 57.2
percent of the respondents did not check the quality of the product under the control of
Quality Control Act.

169
CHART NO.5.20
QUALITY CHECK AS PER QUALITY CONTROL ACT
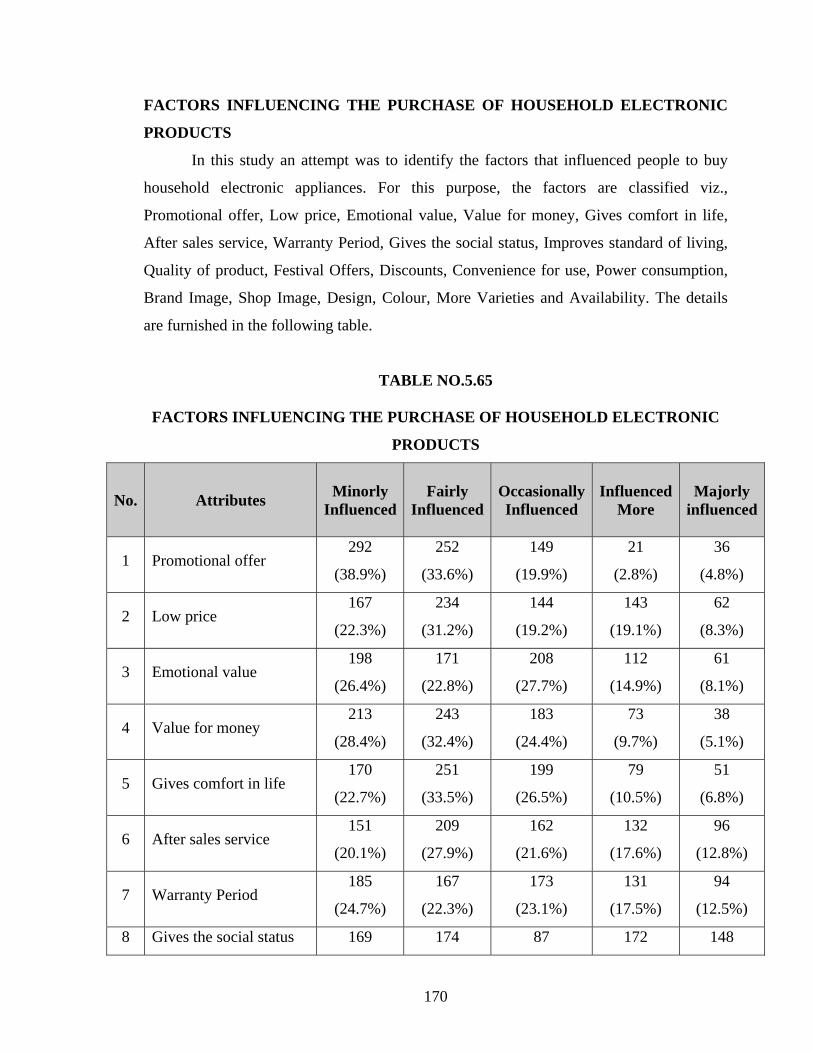
170
FACTORS INFLUENCING THE PURCHASE OF HOUSEHOLD ELECTRONIC
PRODUCTS
In this study an attempt was to identify the factors that influenced people to buy
household electronic appliances. For this purpose, the factors are classified viz.,
Promotional offer, Low price, Emotional value, Value for money, Gives comfort in life,
After sales service, Warranty Period, Gives the social status, Improves standard of living,
Quality of product, Festival Offers, Discounts, Convenience for use, Power consumption,
Brand Image, Shop Image, Design, Colour, More Varieties and Availability. The details
are furnished in the following table.
TABLE NO.5.65
FACTORS INFLUENCING THE PURCHASE OF HOUSEHOLD ELECTRONIC
PRODUCTS
No. Attributes Minorly Influenced
Fairly Influenced
Occasionally Influenced
Influenced
More
Majorly influenced
1 Promotional offer 292
(38.9%)
252
(33.6%)
149
(19.9%)
21
(2.8%)
36
(4.8%)
2 Low price 167
(22.3%)
234
(31.2%)
144
(19.2%)
143
(19.1%)
62
(8.3%)
3 Emotional value 198
(26.4%)
171
(22.8%)
208
(27.7%)
112
(14.9%)
61
(8.1%)
4 Value for money 213
(28.4%)
243
(32.4%)
183
(24.4%)
73
(9.7%)
38
(5.1%)
5 Gives comfort in life 170
(22.7%)
251
(33.5%)
199
(26.5%)
79
(10.5%)
51
(6.8%)
6 After sales service 151
(20.1%)
209
(27.9%)
162
(21.6%)
132
(17.6%)
96
(12.8%)
7 Warranty Period 185
(24.7%)
167
(22.3%)
173
(23.1%)
131
(17.5%)
94
(12.5%)
8 Gives the social status 169 174 87 172 148

171
No. Attributes Minorly Influenced
Fairly Influenced
Occasionally Influenced
Influenced
More
Majorly influenced
(22.5%) (23.2%) (11.6%) (22.9%) (19.7%)
9 Improves standard of
living
178
(23.7%)
124
(16.5%)
129
(17.2%)
140
(18.7%)
179
(23.9%)
10 Quality of product 148
(19.7%)
165
(22.0%)
161
(21.5%)
152
(20.3%)
124
(16.5%)
11 Festival Offers 156
(20.8%)
137
(18.3%)
155
(20.7%)
160
(21.3%)
142
(18.9%)
12 Discounts 125
(16.7%)
133
(17.7%)
130
(17.3%)
119
(15.9%)
243
(32.4%)
13 Convenience for use 140
(18.7%)
131
(17.5%)
197
(26.3%)
125
(16.7%)
157
(20.9%)
14 Power consumption 178
(23.7%)
215
(28.7%)
115
(15.3%)
146
(19.5%)
96
(12.8%)
15 Brand Image 170
(22.7%)
151
(20.1%)
128
(17.1%)
150
(20.0%)
151
(20.1%)
16 Shop Image 27
(3.6%)
39
(5.2%)
249
(33.2%)
200
(26.7%)
235
(31.3%)
17 Design 225
(30.0%)
163
(21.7%)
188
(25.1%)
109
(14.5%)
65
(8.7%)
18 Colour 214
(28.5%)
218
(29.1%)
161
(21.5%)
107
(14.3%)
50
(6.7%)
19 More Varieties 207
(27.6%)
196
(26.1%)
186
(24.8%)
105
(14.0%)
56
(7.5%)
20 Availability 56
(7.5%)
146
(19.5%)
194
(25.9%)
223
(29.7%)
131
(17.5%)
Source: Computed from Primary Data

172
It is inferred from the above table that the customers were minorly influenced by
promotional offer, warranty period, brand image, design and more varieties as 38.9, 54.7,
22.7, 30.0, 27.6 percent respectively ,were fairly influenced by low price, value for money,
gives comfort in life, after sales service, gives the social status, quality of product, power
consumption and colour as 31.2, 32.4, 33.5, 27.9, 23.2, 22.0, 28.3 and 29.1 percent
respectively, influenced by emotional value, convenience for use and shop image as 27.7,
26.3 and 33.2 percent respectively. Similarly they were more influenced by festival offers
and availability as 21.3 and 29.7 percent respectively, by discounts and improved standard
of living as 32.4 and 23.9 percent respectively. It is noted that the majority (54.7%) of the
consumers were minorly influenced by warranty period.
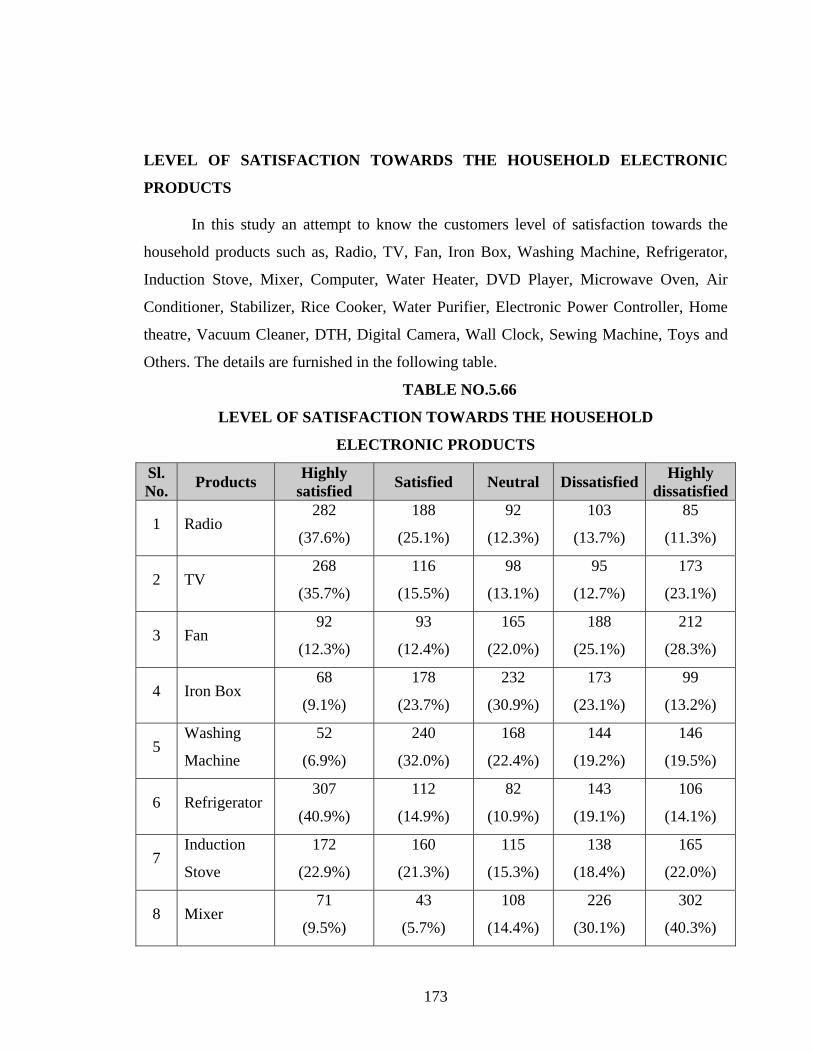
173
LEVEL OF SATISFACTION TOWARDS THE HOUSEHOLD ELECTRONIC
PRODUCTS
In this study an attempt to know the customers level of satisfaction towards the
household products such as, Radio, TV, Fan, Iron Box, Washing Machine, Refrigerator,
Induction Stove, Mixer, Computer, Water Heater, DVD Player, Microwave Oven, Air
Conditioner, Stabilizer, Rice Cooker, Water Purifier, Electronic Power Controller, Home
theatre, Vacuum Cleaner, DTH, Digital Camera, Wall Clock, Sewing Machine, Toys and
Others. The details are furnished in the following table.
TABLE NO.5.66
LEVEL OF SATISFACTION TOWARDS THE HOUSEHOLD
ELECTRONIC PRODUCTS
Sl. No. Products Highly
satisfied Satisfied Neutral Dissatisfied Highly dissatisfied
1 Radio 282
(37.6%)
188
(25.1%)
92
(12.3%)
103
(13.7%)
85
(11.3%)
2 TV 268
(35.7%)
116
(15.5%)
98
(13.1%)
95
(12.7%)
173
(23.1%)
3 Fan 92
(12.3%)
93
(12.4%)
165
(22.0%)
188
(25.1%)
212
(28.3%)
4 Iron Box 68
(9.1%)
178
(23.7%)
232
(30.9%)
173
(23.1%)
99
(13.2%)
5 Washing
Machine
52
(6.9%)
240
(32.0%)
168
(22.4%)
144
(19.2%)
146
(19.5%)
6 Refrigerator 307
(40.9%)
112
(14.9%)
82
(10.9%)
143
(19.1%)
106
(14.1%)
7 Induction
Stove
172
(22.9%)
160
(21.3%)
115
(15.3%)
138
(18.4%)
165
(22.0%)
8 Mixer 71
(9.5%)
43
(5.7%)
108
(14.4%)
226
(30.1%)
302
(40.3%)
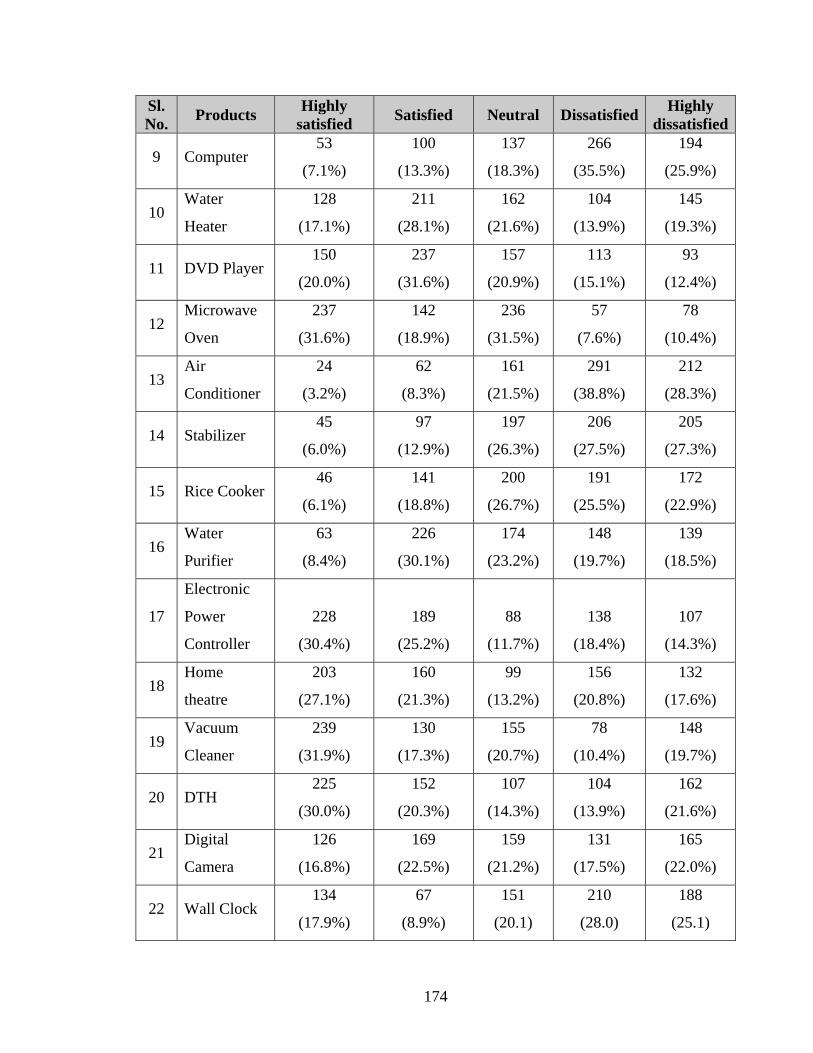
174
Sl. No. Products Highly
satisfied Satisfied Neutral Dissatisfied Highly dissatisfied
9 Computer 53
(7.1%)
100
(13.3%)
137
(18.3%)
266
(35.5%)
194
(25.9%)
10 Water
Heater
128
(17.1%)
211
(28.1%)
162
(21.6%)
104
(13.9%)
145
(19.3%)
11 DVD Player 150
(20.0%)
237
(31.6%)
157
(20.9%)
113
(15.1%)
93
(12.4%)
12 Microwave
Oven
237
(31.6%)
142
(18.9%)
236
(31.5%)
57
(7.6%)
78
(10.4%)
13 Air
Conditioner
24
(3.2%)
62
(8.3%)
161
(21.5%)
291
(38.8%)
212
(28.3%)
14 Stabilizer 45
(6.0%)
97
(12.9%)
197
(26.3%)
206
(27.5%)
205
(27.3%)
15 Rice Cooker 46
(6.1%)
141
(18.8%)
200
(26.7%)
191
(25.5%)
172
(22.9%)
16 Water
Purifier
63
(8.4%)
226
(30.1%)
174
(23.2%)
148
(19.7%)
139
(18.5%)
17
Electronic
Power
Controller
228
(30.4%)
189
(25.2%)
88
(11.7%)
138
(18.4%)
107
(14.3%)
18 Home
theatre
203
(27.1%)
160
(21.3%)
99
(13.2%)
156
(20.8%)
132
(17.6%)
19 Vacuum
Cleaner
239
(31.9%)
130
(17.3%)
155
(20.7%)
78
(10.4%)
148
(19.7%)
20 DTH 225
(30.0%)
152
(20.3%)
107
(14.3%)
104
(13.9%)
162
(21.6%)
21 Digital
Camera
126
(16.8%)
169
(22.5%)
159
(21.2%)
131
(17.5%)
165
(22.0%)
22 Wall Clock 134
(17.9%)
67
(8.9%)
151
(20.1)
210
(28.0)
188
(25.1)
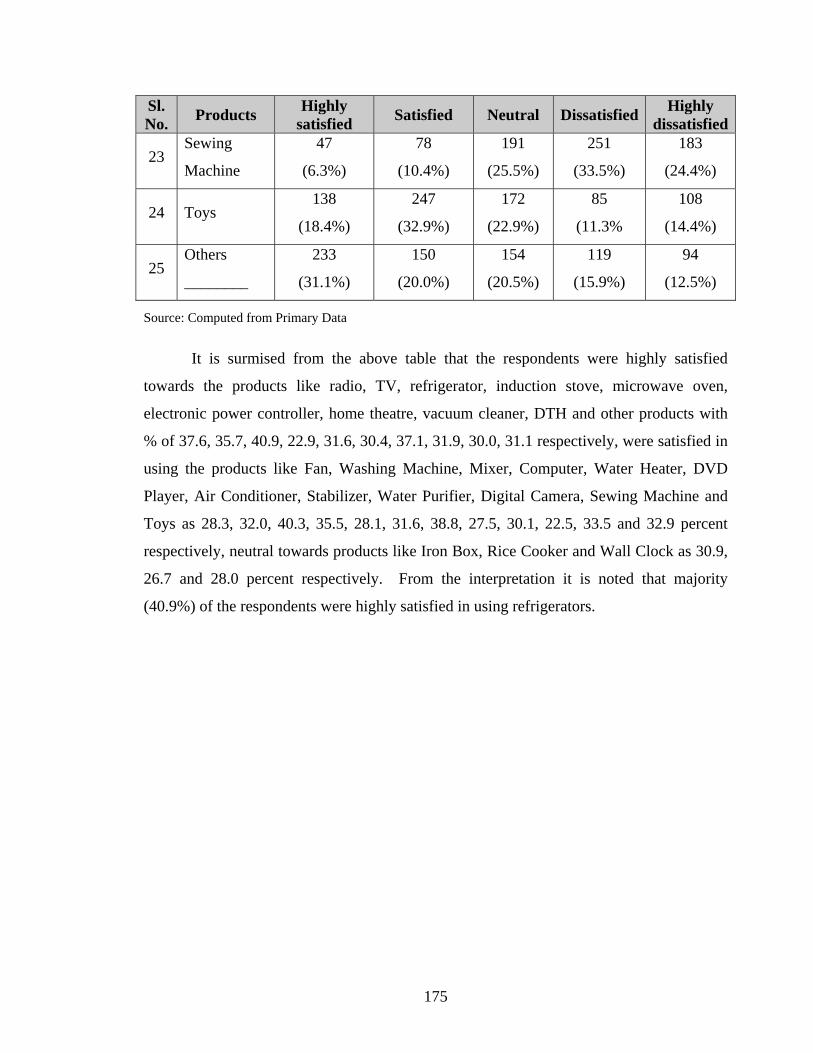
175
Sl. No. Products Highly
satisfied Satisfied Neutral Dissatisfied Highly dissatisfied
23 Sewing
Machine
47
(6.3%)
78
(10.4%)
191
(25.5%)
251
(33.5%)
183
(24.4%)
24 Toys 138
(18.4%)
247
(32.9%)
172
(22.9%)
85
(11.3%
108
(14.4%)
25 Others
________
233
(31.1%)
150
(20.0%)
154
(20.5%)
119
(15.9%)
94
(12.5%)
Source: Computed from Primary Data
It is surmised from the above table that the respondents were highly satisfied
towards the products like radio, TV, refrigerator, induction stove, microwave oven,
electronic power controller, home theatre, vacuum cleaner, DTH and other products with
% of 37.6, 35.7, 40.9, 22.9, 31.6, 30.4, 37.1, 31.9, 30.0, 31.1 respectively, were satisfied in
using the products like Fan, Washing Machine, Mixer, Computer, Water Heater, DVD
Player, Air Conditioner, Stabilizer, Water Purifier, Digital Camera, Sewing Machine and
Toys as 28.3, 32.0, 40.3, 35.5, 28.1, 31.6, 38.8, 27.5, 30.1, 22.5, 33.5 and 32.9 percent
respectively, neutral towards products like Iron Box, Rice Cooker and Wall Clock as 30.9,
26.7 and 28.0 percent respectively. From the interpretation it is noted that majority
(40.9%) of the respondents were highly satisfied in using refrigerators.

176
III. HENRY GARRETT RANKING TECHNIQUE
REASONS FOR PURCHASING HOUSEHOLD ELECTRONIC PRODUCTS
The household electronic products are very much necessary in every home. Ten
factors influencing the purchase decision chosen and respondents were asked to rank the
above factors in the order of their importance. To identify the most important reason,
Henry Garrett Ranking Technique was employed and the details of the ranking of
important reason to purchase the household electronic products are shown in the following
table.
TABLE NO.5.67
REASONS FOR PURCHASING HOUSEHOLD ELECTRONIC PRODUCTS
S.No. Reasons Total score
Mean Score Rank
1 Value of money 40899 54.5 III
2 Better performance 44701 59.6 I
3 Low price 37971 50.6 VI
4 Emotional value 40996 54.7 II
5 Gives social status 40360 53.8 IV
6 High quality 38306 51.1 V
7 Possessed by other 35108 46.8 VII
8 Durability 32050 42.7 IX
9 Latest Technology 31857 42.5 X
10 More features 33215 44.3 VIII
Source: Computed from Primary Data
It is surmised from the above table that purchasing the household electronic goods
for the reason “better performance” was ranked first with the Garrett score of 44701 points.
It is followed by the second and third ranks for “emotional value” and “value of money”
177
with the total Garrett scores of 40996 and 40899 points respectively. The fourth, fifth and
sixth ranks were placed to the reasons such as “gives social status”, “high quality” and
“low price” with the Garrett scores of 40360, 38306 and 37971 points respectively. On the
other hand, the reasons such as “possessed by other”, “more features” and “durability”
were ranked in the seventh, eighth and ninth positions with the Garrett scores of 35108,
33215 and 32050 points respectively. Lastly “latest technology” was ranked in the tenth
position with Garrett score of 31857 points. From the analysis, it was inferred that
majority of the respondents ranked reasons like “better performance” and “emotional
value” as top among these ten reasons to purchase the household electronic products.
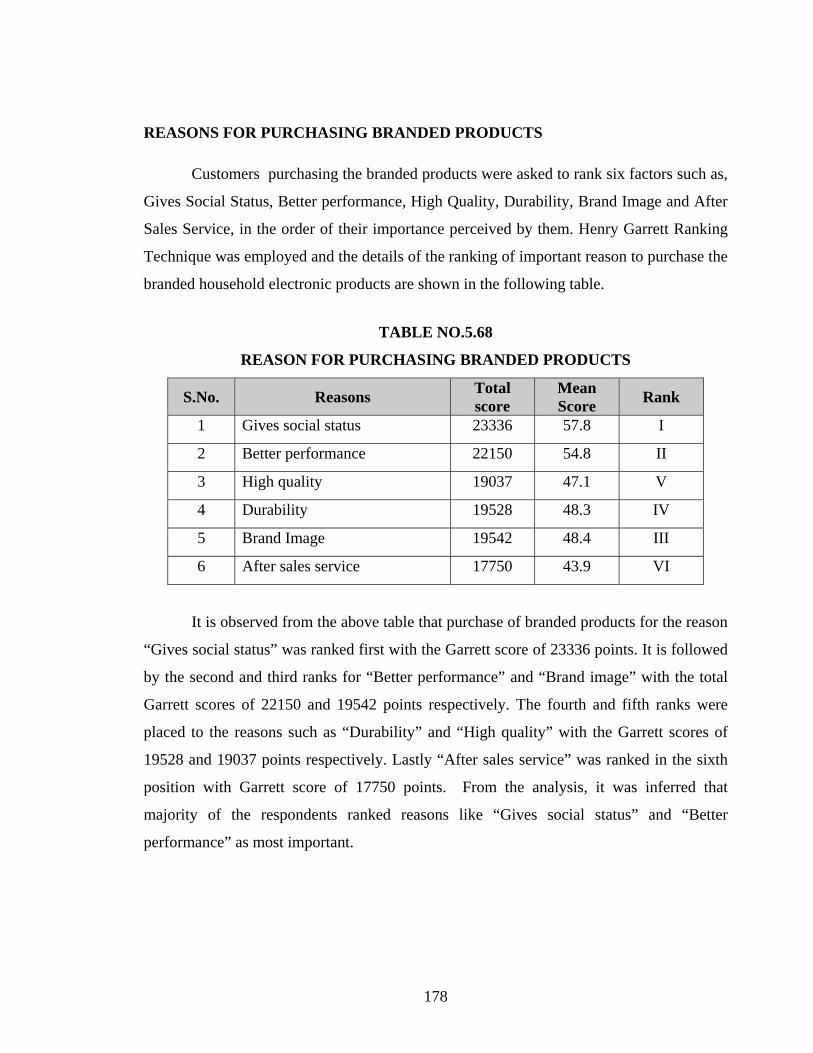
178
REASONS FOR PURCHASING BRANDED PRODUCTS
Customers purchasing the branded products were asked to rank six factors such as,
Gives Social Status, Better performance, High Quality, Durability, Brand Image and After
Sales Service, in the order of their importance perceived by them. Henry Garrett Ranking
Technique was employed and the details of the ranking of important reason to purchase the
branded household electronic products are shown in the following table.
TABLE NO.5.68
REASON FOR PURCHASING BRANDED PRODUCTS
S.No. Reasons Total score
Mean Score Rank
1 Gives social status 23336 57.8 I
2 Better performance 22150 54.8 II
3 High quality 19037 47.1 V
4 Durability 19528 48.3 IV
5 Brand Image 19542 48.4 III
6 After sales service 17750 43.9 VI
It is observed from the above table that purchase of branded products for the reason
“Gives social status” was ranked first with the Garrett score of 23336 points. It is followed
by the second and third ranks for “Better performance” and “Brand image” with the total
Garrett scores of 22150 and 19542 points respectively. The fourth and fifth ranks were
placed to the reasons such as “Durability” and “High quality” with the Garrett scores of
19528 and 19037 points respectively. Lastly “After sales service” was ranked in the sixth
position with Garrett score of 17750 points. From the analysis, it was inferred that
majority of the respondents ranked reasons like “Gives social status” and “Better
performance” as most important.

179
REASONS FOR PURCHASING NON-BRANDED PRODUCTS
The reasons for purchasing non-branded household goods was surveyed in respect
to six factors such as Gives Social Status, Better Performance, More Features, Competitive
Price, Low Price, Easy Availability and More Varieties. The respondents were asked to
rank the above factors in the order of their importance. To identify the most important
reason, Henry Garrett Ranking Technique was employed and the details furnished in below
table.
TABLE NO.5.69
REASONS FOR PURCHASING NON-BRANDED PRODUCTS
S. No. Reasons Total score
Mean Score Rank
1 Better performance 17155 49.6 III
2 More features 19560 56.5 I
3 Competitive Price 17480 50.5 II
4 Low price 16200 46.8 VI
5 Easy Availability 17048 49.3 IV
6 More varieties 16669 48.2 V
Source: Computed
It is evident from the above table that purchase of non-branded products for the
reason “more features” was ranked first with the Garrett score of 19560 points. It is
followed by the second and third ranks for “competitive price” and “better performance”
with the total Garrett scores of 17480 and 17155 points respectively. The fourth and fifth
ranks were placed to the reasons such as “easy availability” and “more varieties” with the
Garrett scores of 17048 and 16669 points respectively. Lastly “low price” was ranked in
the sixth position with Garrett score of 16200 points. From the analysis, it was inferred
that majority of the respondents ranked reasons like “more features” and “competitive
price” high among the six reasons.

180
PROBLEMS FACED BY THE RESPONDENTS WHILE USING THE
HOUSEHOLD ELECTRONIC PRODUCTS
A study to understand the problems encountered in usage of electronic products
and reasons which could contribute to them was done taking into consideration fifteen
points viz., Unstable Price, Poor Quality, Unable to understand the technical features,
Confused functions, It is annoying to clean product, Product requires more care, Product is
not strong or durable enough, Product is not improved compared with its previous version,
Product’s design soon becomes obsolete or old-fashioned, Software support is seldom
updated, Worried about harming their health, Users have difficulty in finding a specific
function, Electronics are difficult to recycle, Products are quickly obsolete and discarded
and discarded electronics are managed badly. The problems are studied with the help of
Henry Garrett ranking technique and the details are shown in the following table.
TABLE NO.5.70
PROBLEMS FACED WHILE USING THE HOUSEHOLD
ELECTRONIC PRODUCTS
S. No. Problems Total
Score Mean Score Rank
1 Unstable Price 27315 36.4 XV
2 Less Quality 33540 44.7 XIV
3 Unable to understand the technical features 36662 48.9 X
4 Confused functions 39745 53.0 V
5 It is annoying to clean product. 39580 52.8 VII
6 Product requires more care. 40435 53.9 II
7 Product is not strong or durable enough 36556 48.7 XI
8 Product is not improved compared with its
previous version 38006 50.7 VIII
9 Product’s design soon becomes boring or old-
fashioned 34770 46.4 XIII
10 Software support is seldom updated. 36466 48.6 XII
11 Worried about harming their health. 37941 50.6 IX
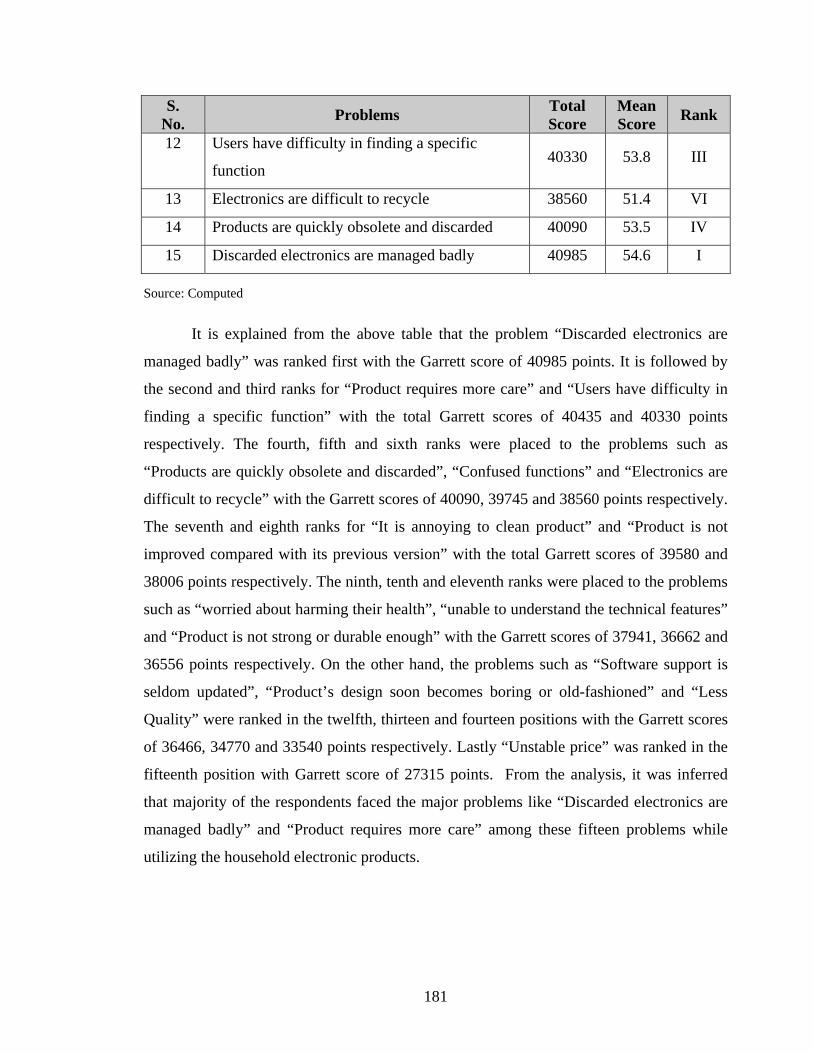
181
S. No. Problems Total
Score Mean Score Rank
12 Users have difficulty in finding a specific
function 40330 53.8 III
13 Electronics are difficult to recycle 38560 51.4 VI
14 Products are quickly obsolete and discarded 40090 53.5 IV
15 Discarded electronics are managed badly 40985 54.6 I
Source: Computed
It is explained from the above table that the problem “Discarded electronics are
managed badly” was ranked first with the Garrett score of 40985 points. It is followed by
the second and third ranks for “Product requires more care” and “Users have difficulty in
finding a specific function” with the total Garrett scores of 40435 and 40330 points
respectively. The fourth, fifth and sixth ranks were placed to the problems such as
“Products are quickly obsolete and discarded”, “Confused functions” and “Electronics are
difficult to recycle” with the Garrett scores of 40090, 39745 and 38560 points respectively.
The seventh and eighth ranks for “It is annoying to clean product” and “Product is not
improved compared with its previous version” with the total Garrett scores of 39580 and
38006 points respectively. The ninth, tenth and eleventh ranks were placed to the problems
such as “worried about harming their health”, “unable to understand the technical features”
and “Product is not strong or durable enough” with the Garrett scores of 37941, 36662 and
36556 points respectively. On the other hand, the problems such as “Software support is
seldom updated”, “Product’s design soon becomes boring or old-fashioned” and “Less
Quality” were ranked in the twelfth, thirteen and fourteen positions with the Garrett scores
of 36466, 34770 and 33540 points respectively. Lastly “Unstable price” was ranked in the
fifteenth position with Garrett score of 27315 points. From the analysis, it was inferred
that majority of the respondents faced the major problems like “Discarded electronics are
managed badly” and “Product requires more care” among these fifteen problems while
utilizing the household electronic products.

182
IV. MULTIPLE CORRELATION ANALYSIS
Correlation analysis attempts to determine the degree of relationship between
variables. The correlation co-efficient of the selected independent variables with the level
of influence and satisfaction of the consumers who have household electronic products has
been worked out in order to identify the most important variables which have relationship
with level of satisfaction. Also the correlation co-efficient among the different variables
determining the level of influence and satisfaction has been worked out so as to arrive at a
correlation matrix, which incorporates correlation co-efficient of all the selected variables
with the dependent variables as well as correlation co-efficient among different
independent variables. The calculated correlation co-efficient values were compared with
a critical value of simple correlation co-efficient available in the statistical tables (Fishers
and Yates) for its significance.
CORRELATION ANALYSIS – LEVEL OF INFLUENCE
The correlation co-efficient matrix of the selected variables with dependent
variables, level of influence of the consumers are induced to prefer to buy the household
electronic products is given in Table No.5.71

183

184
185
From the Table No. 1, it is identified that the variables X1 (Living Place), X2 (Age),
X3 (Gender), X4 (Educational Status), X7 (Family Income level) and X14 (Point of
purchase) had significant positive correlation with the level of influence of the consumers
towards characteristics of the household electronic products. The variables X9 (Type of
family), X10 (Level of awareness), X11 (Number of products using) and X12 (Type of
products using) had significant negative correlation with the level of influence. The
correlation is also positive but insignificant with the two variables namely, X6 (Present
status) and X8 (Family size). On the other hand, the correlation was negative but
insignificant with the variables X5 (Marital Status) and X13 (Mode of purchase).
It is found from the correlation analysis, the level of influence are induced to prefer
to buy the household electronic products is highly correlated with Living Place, Age,
Gender, Educational Status, Family Income level, Point of purchase, Type of family, Level
of awareness, Number of products used and Type of products used.
186
CORRELATION ANALYSIS – LEVEL OF SATISFACTION
The correlation co-efficient matrix of the selected variables with dependent
variables, level of satisfaction of the consumers towards household electronic products is
given in Table No.5.72.

187
188
From the Table No. 5.72 it could be noted that the variables X2 (Age), X3 (Gender),
X6 (Present Status), X7 (Family Income level), X8 (Family size), X10 (Level of awareness),
X11 (Number of products using), X12 (Type of products using) and X13 (Mode of purchase)
had significant positive correlation with the level of satisfaction of the consumers towards
household electronic products. The variables X1 (Living place) and X9 (Type of family)
had significant negative correlation with the level of satisfaction. The correlation is also
positive but insignificant with the variable X14 (point of purchase). On the other hand, the
correlation was negative but insignificant with the variables X4 (Educational Status) and
X5 (Marital Status).
It is found from the correlation analysis, the level of satisfaction of the consumers
towards using household electronic products is highly correlated with Living Place, Age,
Gender, Present Status, Family Income level, Family size, Type of family, Level of
awareness, Number of products using, Type of products using and Mode of purchase.
189
IV. MULTIPLE REGRESSION ANALYSIS
In the following analysis, the relationship between the level of satisfaction among
the consumers who utilize household electronic products and fourteen independent factors
were studied. It was found that out of fourteen, thirteen factors were closely associated
with the level of satisfaction towards their usage of household electronic products by the
selected sample respondents.
Selected fourteen independent factors are.
1. Living Place
2. Age
3. Gender
4. Educational Status
5. Marital Status
6. Present Status
7. Family Monthly Income
8. Family size
9. Type of family
10. Level of Awareness
11. Number of products used
12. Type of products used
13. Mode of purchase
14. Point of Purchase
In order to measure the interdependence of independent factors and their level of
satisfaction towards household electronic products, the results were subjected to multiple
regression analysis. The results of multiple regression analysis are shown in Table 5.73.
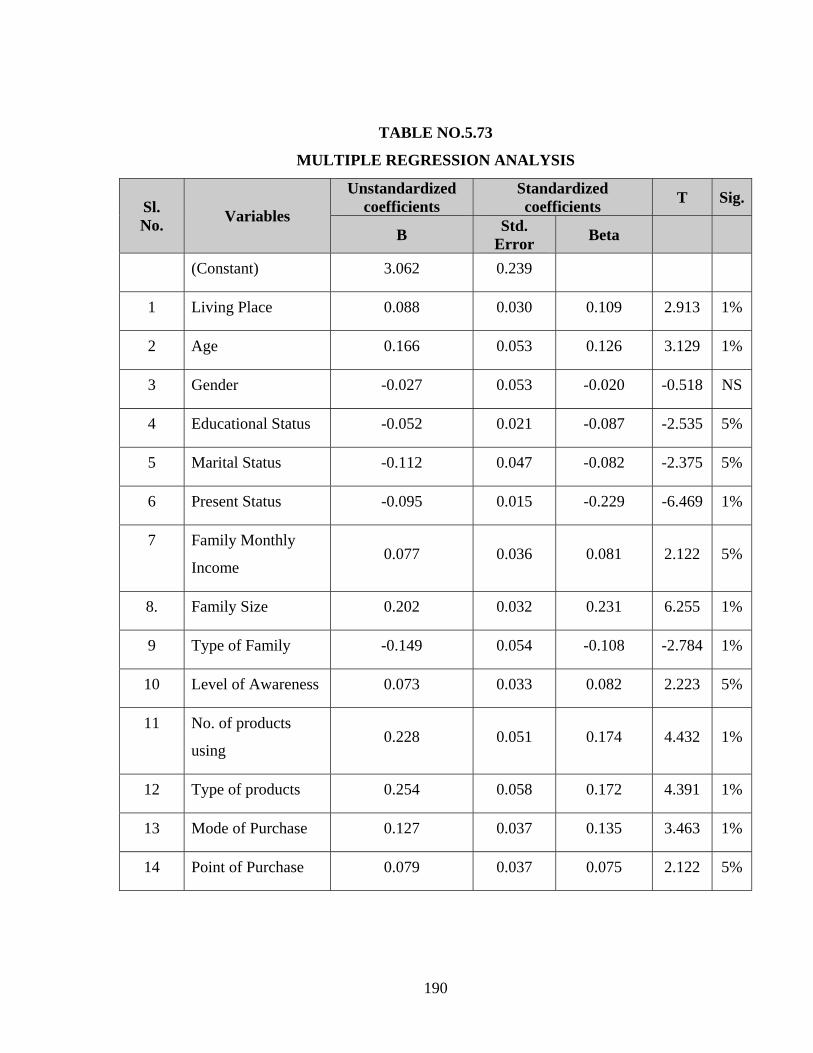
190
TABLE NO.5.73
MULTIPLE REGRESSION ANALYSIS
Sl. No. Variables
Unstandardized coefficients
Standardized coefficients T Sig.
B Std. Error Beta
(Constant) 3.062 0.239
1 Living Place 0.088 0.030 0.109 2.913 1%
2 Age 0.166 0.053 0.126 3.129 1%
3 Gender -0.027 0.053 -0.020 -0.518 NS
4 Educational Status -0.052 0.021 -0.087 -2.535 5%
5 Marital Status -0.112 0.047 -0.082 -2.375 5%
6 Present Status -0.095 0.015 -0.229 -6.469 1%
7 Family Monthly
Income 0.077 0.036 0.081 2.122 5%
8. Family Size 0.202 0.032 0.231 6.255 1%
9 Type of Family -0.149 0.054 -0.108 -2.784 1%
10 Level of Awareness 0.073 0.033 0.082 2.223 5%
11 No. of products
using 0.228 0.051 0.174 4.432 1%
12 Type of products 0.254 0.058 0.172 4.391 1%
13 Mode of Purchase 0.127 0.037 0.135 3.463 1%
14 Point of Purchase 0.079 0.037 0.075 2.122 5%
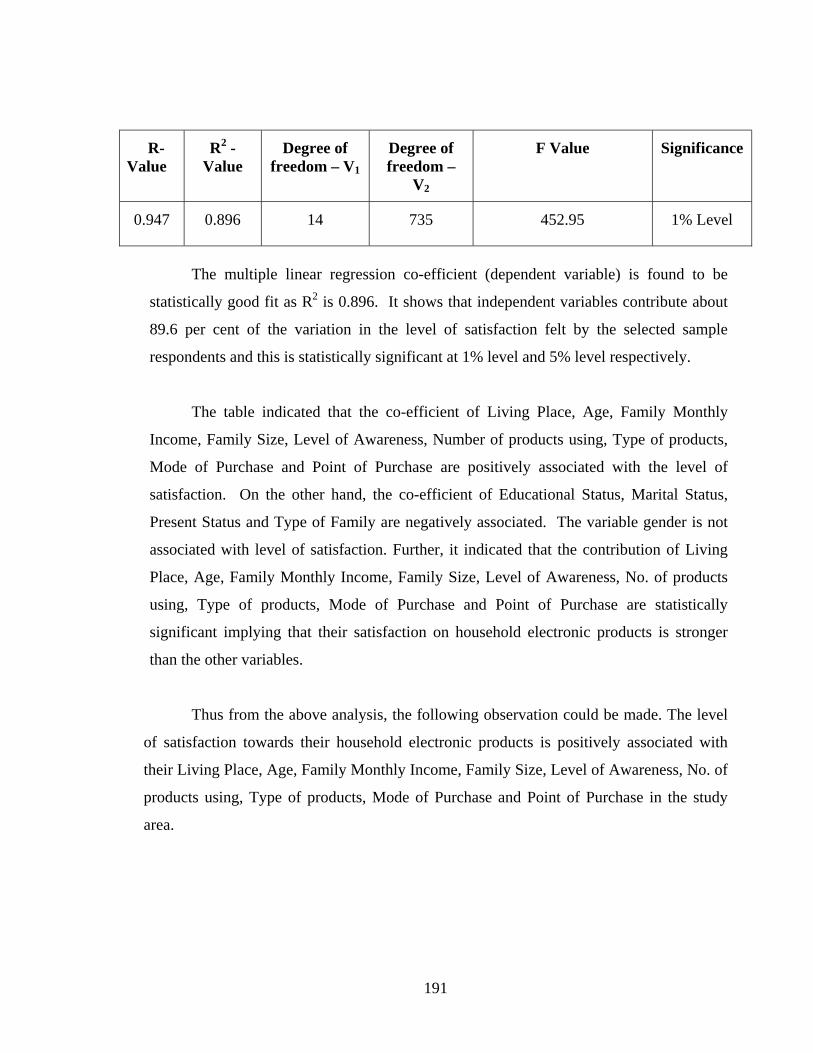
191
R-Value
R2 -Value
Degree of freedom – V1
Degree of freedom –
V2
F Value Significance
0.947 0.896 14 735 452.95 1% Level
The multiple linear regression co-efficient (dependent variable) is found to be
statistically good fit as R2 is 0.896. It shows that independent variables contribute about
89.6 per cent of the variation in the level of satisfaction felt by the selected sample
respondents and this is statistically significant at 1% level and 5% level respectively.
The table indicated that the co-efficient of Living Place, Age, Family Monthly
Income, Family Size, Level of Awareness, Number of products using, Type of products,
Mode of Purchase and Point of Purchase are positively associated with the level of
satisfaction. On the other hand, the co-efficient of Educational Status, Marital Status,
Present Status and Type of Family are negatively associated. The variable gender is not
associated with level of satisfaction. Further, it indicated that the contribution of Living
Place, Age, Family Monthly Income, Family Size, Level of Awareness, No. of products
using, Type of products, Mode of Purchase and Point of Purchase are statistically
significant implying that their satisfaction on household electronic products is stronger
than the other variables.
Thus from the above analysis, the following observation could be made. The level
of satisfaction towards their household electronic products is positively associated with
their Living Place, Age, Family Monthly Income, Family Size, Level of Awareness, No. of
products using, Type of products, Mode of Purchase and Point of Purchase in the study
area.

192
VI. DISCRIMINANT FUNCTION ANALYSIS
Opinions of consumers towards their level of satisfaction on using electronic
products according to their experience were collected in the study area. In the study area
750 respondents were divided into two groups, one showing low level of satisfaction and
the other showing high level of satisfaction. The difference of opinion of one group with
the other was studied with the help of Discriminant Function Analysis. For the purpose of
the study fourteen variables were selected.
1. Living Place
2. Age
3. Gender
4. Educational Status
5. Marital Status
6. Present Status
7. Family Monthly Income
8. Family size
9. Type of family
10. Level of Awareness
11. Number of products used
12. Type of products used
13. Mode of purchase
14. Point of Purchase
The Discriminant Function Analysis was attempted to construct a function with
these and other variables, so that the consumers belonging to these two groups are
differentiated at the maximum. The linear combination of variables is known as
discriminant function and its parameters are called discriminant function coefficients. In
constructing this discriminant function, all the variables which contribute more to
differentiate these two groups were examined.
Mahalanobis minimum D2 method is based on the generalized squared Euclidean
distance that adjusts for unequal variances in the variables. The major advantage of this
193
procedure is that it is computed in the original space of the predictor (independent)
variables rather than as a collapsed version which is used in the other method.
Generally, all the variables selected will not contribute to explain the maximum
discriminatory power of the function. So a selection rule is applied based on certain criteria
to include those variables which best discriminate. Stepwise selection method was applied
in constructing discriminant function which selects one variable at a time to include in the
function. Before entering into the function, the variables are examined for inclusion in the
function.
The variables which have maximum D2 value, if entered into the function are
selected for inclusion in the function. Once entered, any variable already in the equation is
again considered for removal based on certain removal criteria. Likewise, at each step, the
next best discriminating variable is selected and included in the function and any variable
already included in the function is considered for removal, based on the selection and
removal criteria respectively.
DISCRIMINANT ANALYSIS FOR THE PROBLEM UNDER STUDY
Since discriminant function analysis involved classification problem also, to
ascertain the efficiency of the discriminant function analysis all the variables which satisfy
the entry and removal criteria were entered into the function. Normally, the criteria used to
select the variables for inclusion in the function is minimum ‘F’, to enter into the equation
i.e. F statistic calculated for the qualified variable to enter into the function is fixed as ≥ 1.
Similarly, any variable entered in the equation will be removed from the function if
‘F’ statistic for the variable calculated is <1. The two groups are defined as
Group 1 - Low level of Satisfier
Group 2 - High level of Satisfier
The mean and standard deviation for these groups and for the entire samples are
given for each variable considered in the analysis.
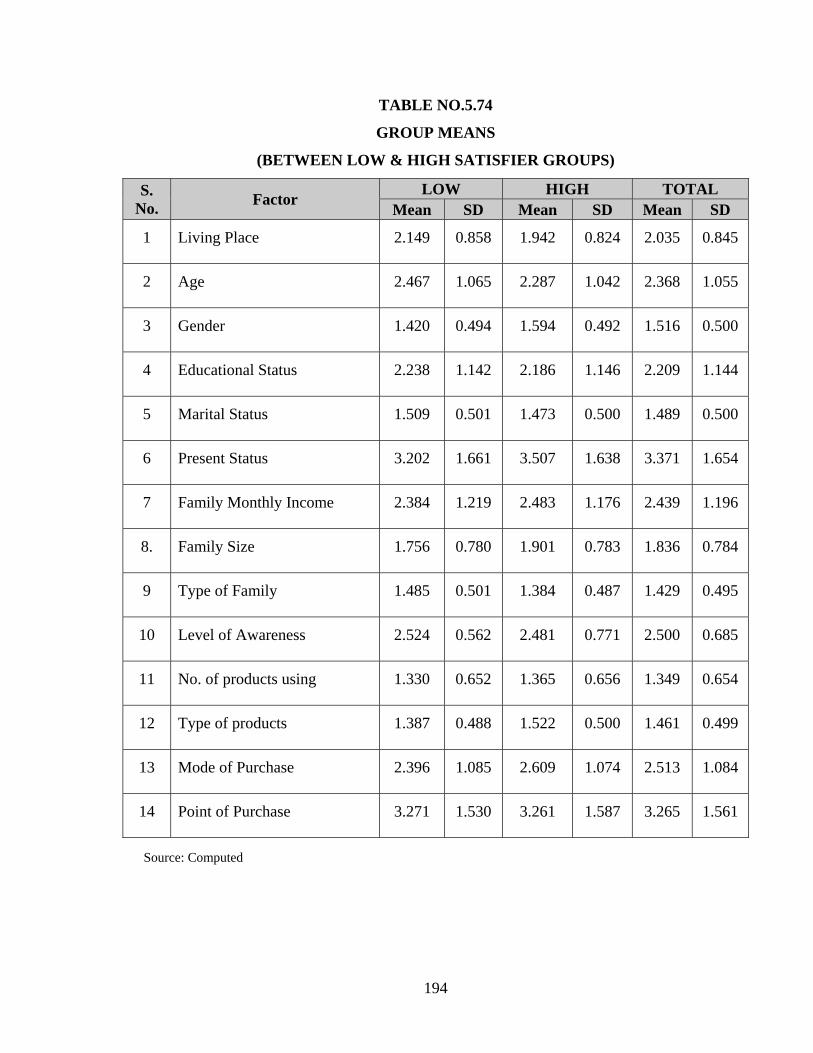
194
TABLE NO.5.74
GROUP MEANS
(BETWEEN LOW & HIGH SATISFIER GROUPS)
S. No. Factor LOW HIGH TOTAL
Mean SD Mean SD Mean SD
1 Living Place 2.149 0.858 1.942 0.824 2.035 0.845
2 Age 2.467 1.065 2.287 1.042 2.368 1.055
3 Gender 1.420 0.494 1.594 0.492 1.516 0.500
4 Educational Status 2.238 1.142 2.186 1.146 2.209 1.144
5 Marital Status 1.509 0.501 1.473 0.500 1.489 0.500
6 Present Status 3.202 1.661 3.507 1.638 3.371 1.654
7 Family Monthly Income 2.384 1.219 2.483 1.176 2.439 1.196
8. Family Size 1.756 0.780 1.901 0.783 1.836 0.784
9 Type of Family 1.485 0.501 1.384 0.487 1.429 0.495
10 Level of Awareness 2.524 0.562 2.481 0.771 2.500 0.685
11 No. of products using 1.330 0.652 1.365 0.656 1.349 0.654
12 Type of products 1.387 0.488 1.522 0.500 1.461 0.499
13 Mode of Purchase 2.396 1.085 2.609 1.074 2.513 1.084
14 Point of Purchase 3.271 1.530 3.261 1.587 3.265 1.561
Source: Computed
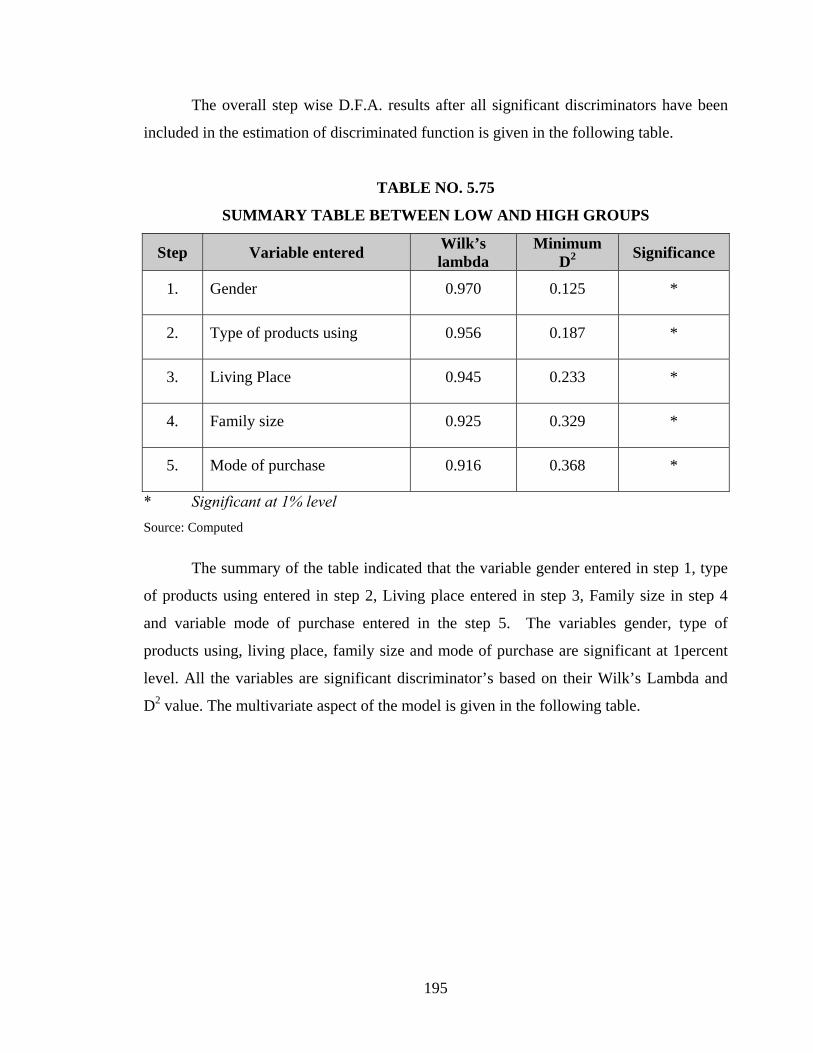
195
The overall step wise D.F.A. results after all significant discriminators have been
included in the estimation of discriminated function is given in the following table.
TABLE NO. 5.75
SUMMARY TABLE BETWEEN LOW AND HIGH GROUPS
Step Variable entered Wilk’s lambda
Minimum D2 Significance
1. Gender 0.970 0.125 *
2. Type of products using 0.956 0.187 *
3. Living Place 0.945 0.233 *
4. Family size 0.925 0.329 *
5. Mode of purchase 0.916 0.368 *
* Significant at 1% level Source: Computed
The summary of the table indicated that the variable gender entered in step 1, type
of products using entered in step 2, Living place entered in step 3, Family size in step 4
and variable mode of purchase entered in the step 5. The variables gender, type of
products using, living place, family size and mode of purchase are significant at 1percent
level. All the variables are significant discriminator’s based on their Wilk’s Lambda and
D2 value. The multivariate aspect of the model is given in the following table.

196
TABLE NO. 5.76
CANONICAL DISCRIMINANT FUNCTION
(BETWEEN LOW AND HIGH SATISFIER GROUPS )
Canonical correlation
Wilks Lambda
Chi-square D.F. Sig
0.289 0.916 65.163 5 Significant at
1% level
Source: Computed
The canonical correlation is 0.289 when squared is 0.083 that is 8.3% of the
variance in the discriminant group can be accounted for by this model, Wilk’s Lambda and
chi-square value suggested that D.F. is significant at 1percent level.
The variables given above are identified finally by the D.F.A. as the eligible
discriminating variables. Based on the selected variables, the corresponding D.F.
coefficients are calculated. They are given in the following table.
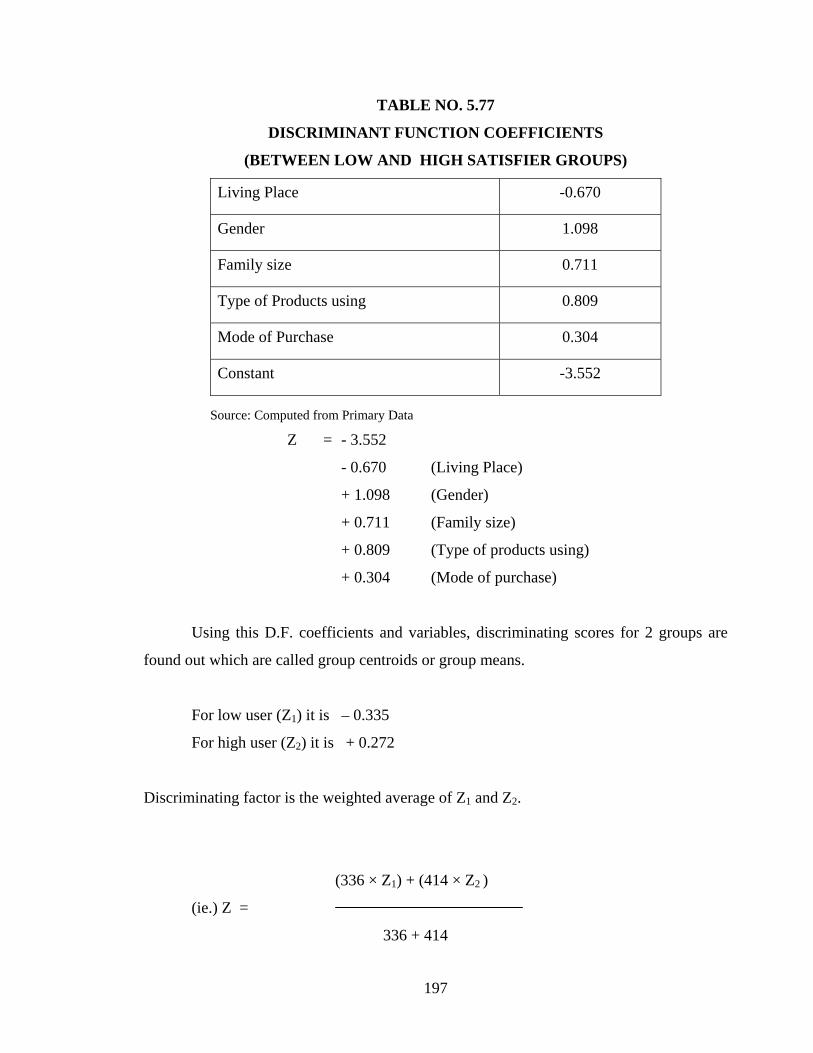
197
TABLE NO. 5.77
DISCRIMINANT FUNCTION COEFFICIENTS
(BETWEEN LOW AND HIGH SATISFIER GROUPS)
Living Place -0.670
Gender 1.098
Family size 0.711
Type of Products using 0.809
Mode of Purchase 0.304
Constant -3.552
Source: Computed from Primary Data
Z = - 3.552
- 0.670 (Living Place)
+ 1.098 (Gender)
+ 0.711 (Family size)
+ 0.809 (Type of products using)
+ 0.304 (Mode of purchase)
Using this D.F. coefficients and variables, discriminating scores for 2 groups are
found out which are called group centroids or group means.
For low user (Z1) it is – 0.335
For high user (Z2) it is + 0.272
Discriminating factor is the weighted average of Z1 and Z2.
(336 × Z1) + (414 × Z2 )
(ie.) Z =
336 + 414
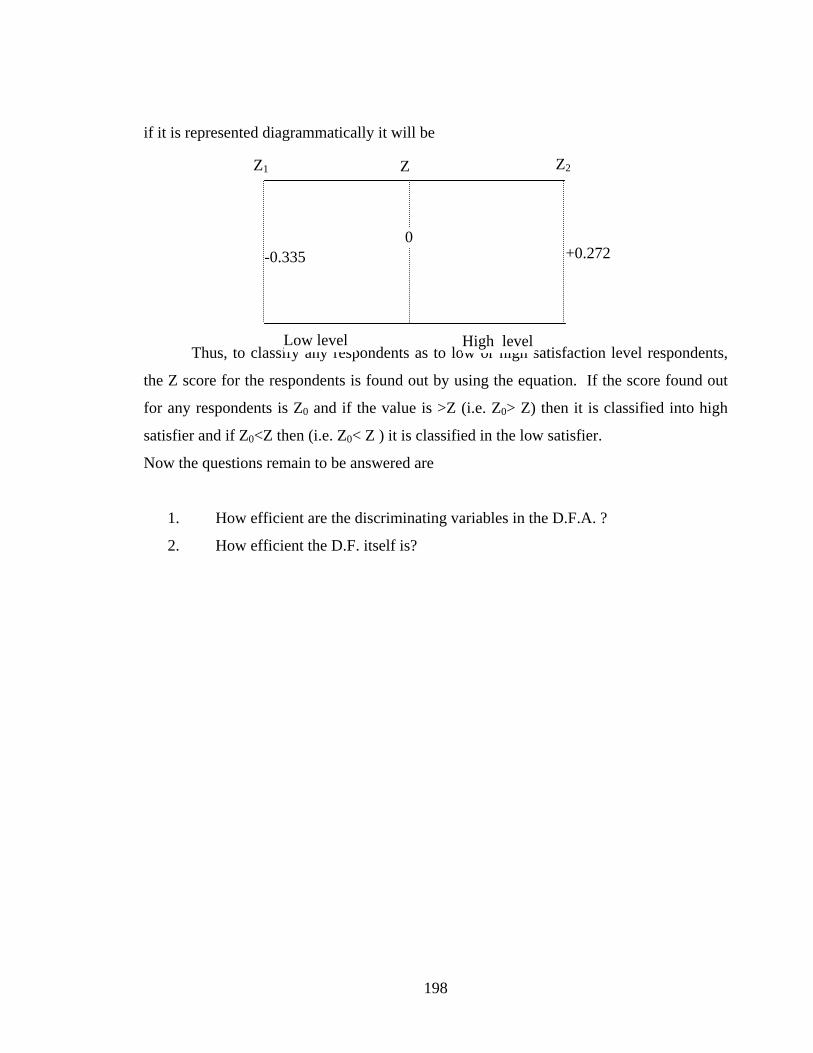
198
if it is represented diagrammatically it will be
Thus, to classify any respondents as to low or high satisfaction level respondents,
the Z score for the respondents is found out by using the equation. If the score found out
for any respondents is Z0 and if the value is >Z (i.e. Z0> Z) then it is classified into high
satisfier and if Z0<Z then (i.e. Z0< Z ) it is classified in the low satisfier.
Now the questions remain to be answered are
1. How efficient are the discriminating variables in the D.F.A. ?
2. How efficient the D.F. itself is?
Z1 Z Z2
-0.335 0
+0.272
Low level High level
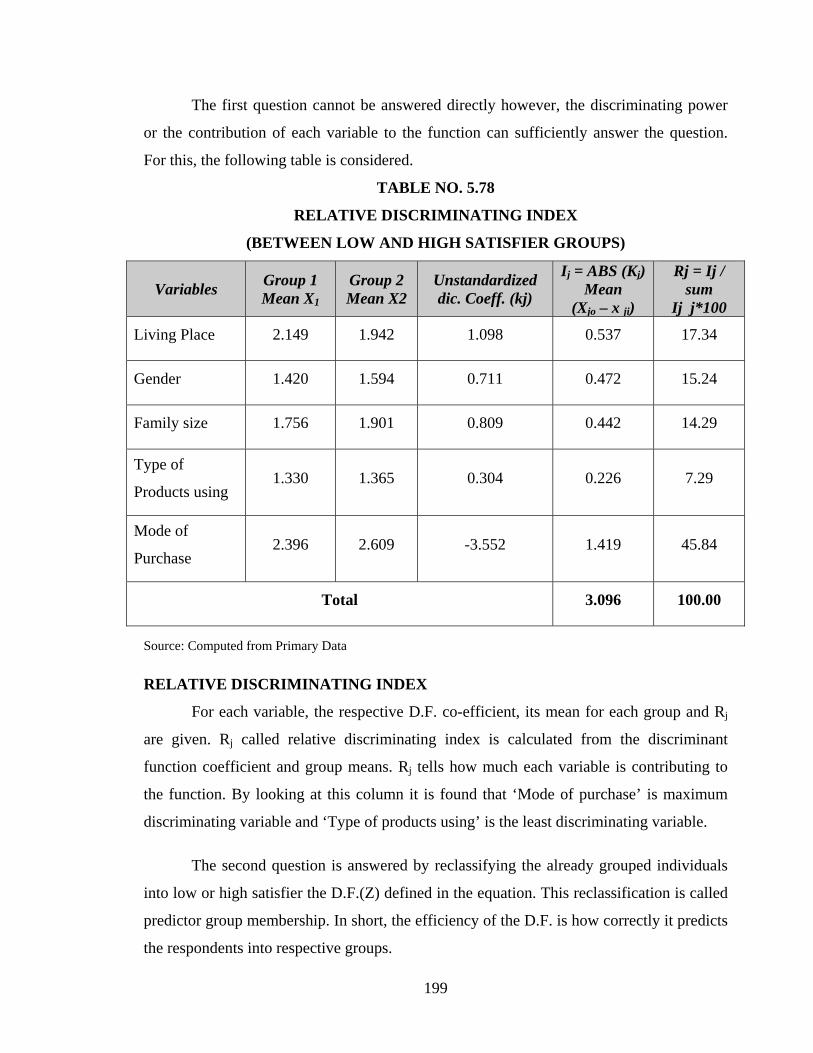
199
The first question cannot be answered directly however, the discriminating power
or the contribution of each variable to the function can sufficiently answer the question.
For this, the following table is considered.
TABLE NO. 5.78
RELATIVE DISCRIMINATING INDEX
(BETWEEN LOW AND HIGH SATISFIER GROUPS)
Variables Group 1 Mean X1
Group 2 Mean X2
Unstandardized dic. Coeff. (kj)
Ij = ABS (Kj) Mean
(Xjo – x ji)
Rj = Ij / sum
Ij j*100
Living Place 2.149 1.942 1.098 0.537 17.34
Gender 1.420 1.594 0.711 0.472 15.24
Family size 1.756 1.901 0.809 0.442 14.29
Type of
Products using 1.330 1.365 0.304 0.226 7.29
Mode of
Purchase 2.396 2.609 -3.552 1.419 45.84
Total 3.096 100.00
Source: Computed from Primary Data
RELATIVE DISCRIMINATING INDEX
For each variable, the respective D.F. co-efficient, its mean for each group and Rj
are given. Rj called relative discriminating index is calculated from the discriminant
function coefficient and group means. Rj tells how much each variable is contributing to
the function. By looking at this column it is found that ‘Mode of purchase’ is maximum
discriminating variable and ‘Type of products using’ is the least discriminating variable.
The second question is answered by reclassifying the already grouped individuals
into low or high satisfier the D.F.(Z) defined in the equation. This reclassification is called
predictor group membership. In short, the efficiency of the D.F. is how correctly it predicts
the respondents into respective groups.
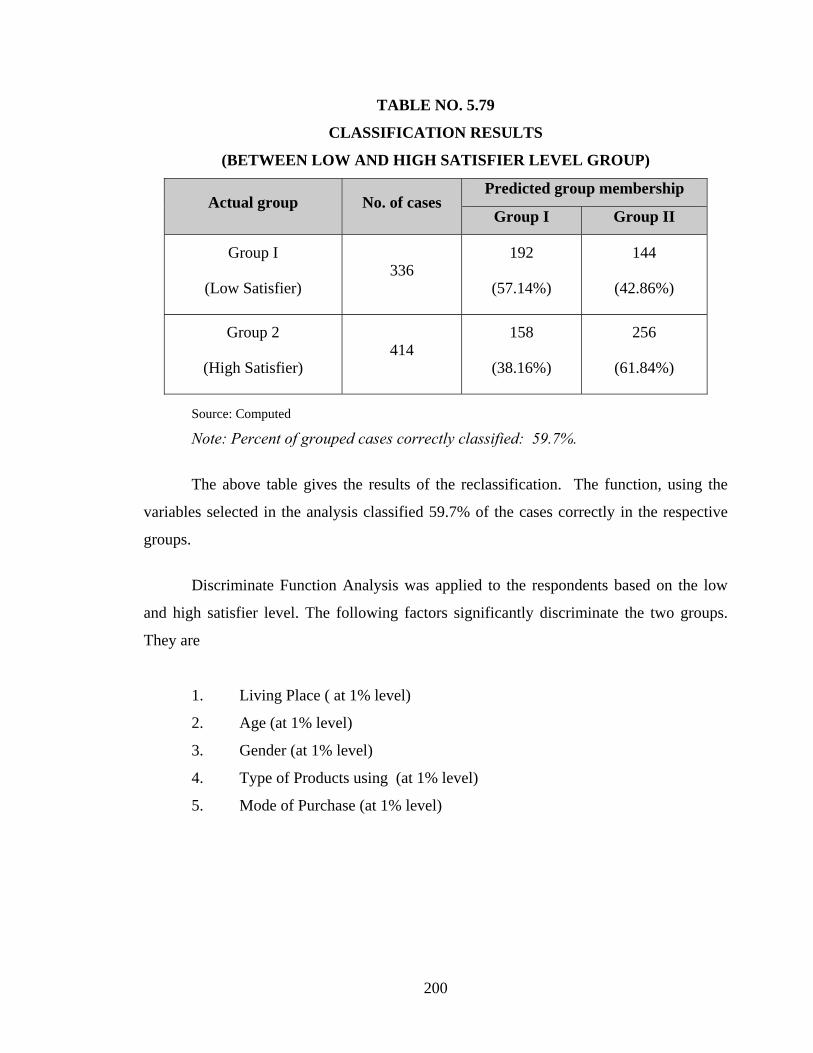
200
TABLE NO. 5.79
CLASSIFICATION RESULTS
(BETWEEN LOW AND HIGH SATISFIER LEVEL GROUP)
Actual group No. of cases Predicted group membership
Group I Group II
Group I
(Low Satisfier) 336
192
(57.14%)
144
(42.86%)
Group 2
(High Satisfier) 414
158
(38.16%)
256
(61.84%)
Source: Computed Note: Percent of grouped cases correctly classified: 59.7%.
The above table gives the results of the reclassification. The function, using the
variables selected in the analysis classified 59.7% of the cases correctly in the respective
groups.
Discriminate Function Analysis was applied to the respondents based on the low
and high satisfier level. The following factors significantly discriminate the two groups.
They are
1. Living Place ( at 1% level)
2. Age (at 1% level)
3. Gender (at 1% level)
4. Type of Products using (at 1% level)
5. Mode of Purchase (at 1% level)
201
VII. FACTOR ANALYSIS
A ‘factor’ is an underlying dimension that accounts for several observed variables.
There can be one or more factors, depending upon the nature of the study and the number
of variables involved in it. ‘Factor-loadings are those values which explain how closely the
variables are related to each one of the factors discovered. ‘Communality’, symbolized as
h2, shows how much of each variable is accounted for by the underlying factor taken
together. A high value of communality means that not much of the variable is left over
after whatever the factors represent is taken into consideration. It is worked out in respect
of each variable as under:
h2 of the ith variable = (ith factor loading of factor A)
+ (ith factor loading of factor B) + …
When the sum of squared values of factor loadings relating to a factor is taken, then
such sum is referred to as ‘Eigen Value’ or latent root. Eigen value indicates the relative
importance of each factor in accounting for the particular set of variables being analysed.
When Eigen values of all factors are totaled, the resulting value is termed as the
total sum of squares. This value, when divided by the number of variables, results in an
index that shows how the particular solution accounts for what all the variables taken
together represent.
‘Rotation’, in the context of factor analysis, is something like staining a microscope
slide. Just as different stains on it reveal different structures in the tissue, different rotations
reveal different structures in the data. Though different rotations give results that appear to
be entirely different, but from a statistical point of view, all results are taken as equal, none
superior or inferior to others. However, from the standpoint of making sense of the results
of factor analysis, one must select the right rotation. If the factors are independent,
orthogonal rotation is done and if the factors are correlated, an oblique rotation is made.
Communality for each variable will remain undisturbed regardless of rotation but the
Eigen values will change as a result of rotation.
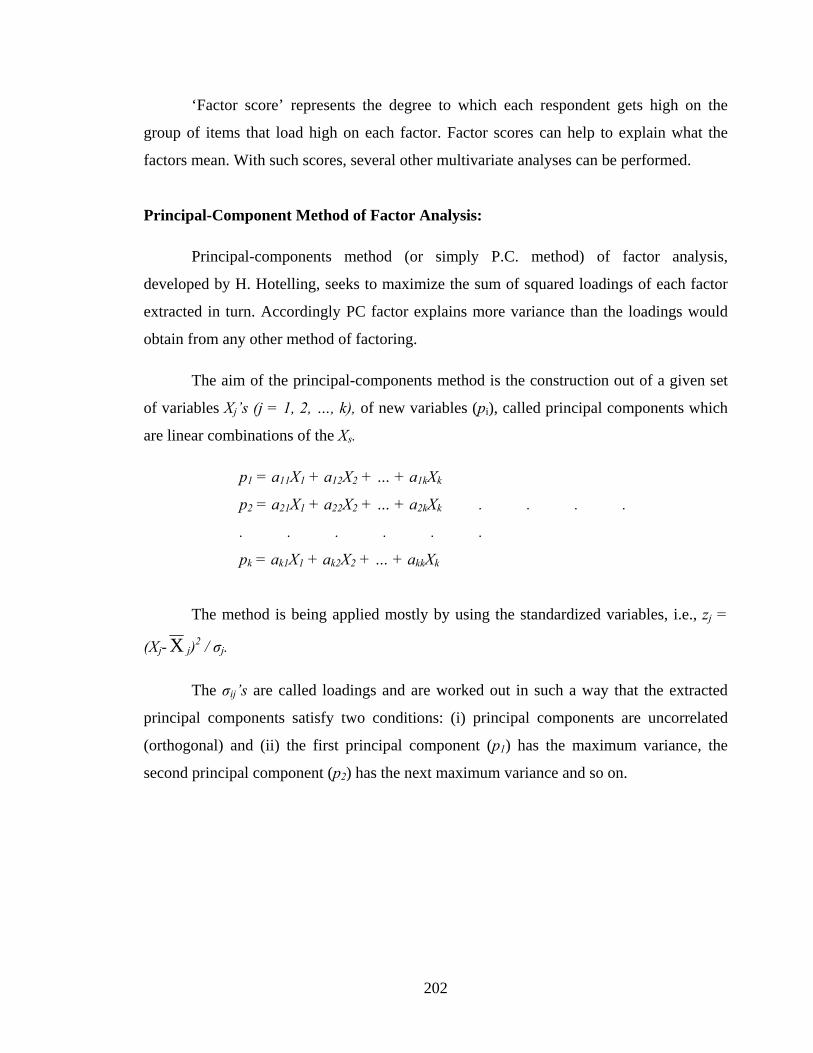
202
‘Factor score’ represents the degree to which each respondent gets high on the
group of items that load high on each factor. Factor scores can help to explain what the
factors mean. With such scores, several other multivariate analyses can be performed.
Principal-Component Method of Factor Analysis:
Principal-components method (or simply P.C. method) of factor analysis,
developed by H. Hotelling, seeks to maximize the sum of squared loadings of each factor
extracted in turn. Accordingly PC factor explains more variance than the loadings would
obtain from any other method of factoring.
The aim of the principal-components method is the construction out of a given set
of variables Xj’s (j = 1, 2, …, k), of new variables (pi), called principal components which
are linear combinations of the Xs.
p1 = a11X1 + a12X2 + … + a1kXk
p2 = a21X1 + a22X2 + … + a2kXk . . . .
. . . . . .
pk = ak1X1 + ak2X2 + … + akkXk
The method is being applied mostly by using the standardized variables, i.e., zj =
(Xj- X j)2 / σj.
The σij’s are called loadings and are worked out in such a way that the extracted
principal components satisfy two conditions: (i) principal components are uncorrelated
(orthogonal) and (ii) the first principal component (p1) has the maximum variance, the
second principal component (p2) has the next maximum variance and so on.
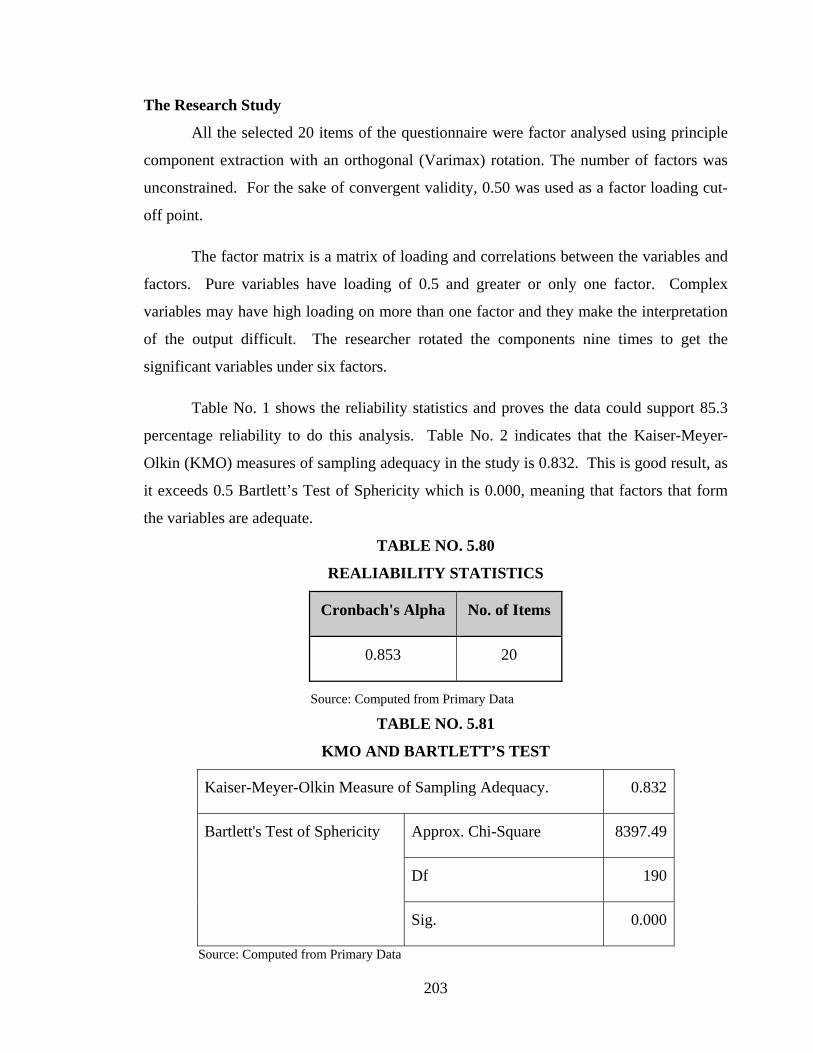
203
The Research Study
All the selected 20 items of the questionnaire were factor analysed using principle
component extraction with an orthogonal (Varimax) rotation. The number of factors was
unconstrained. For the sake of convergent validity, 0.50 was used as a factor loading cut-
off point.
The factor matrix is a matrix of loading and correlations between the variables and
factors. Pure variables have loading of 0.5 and greater or only one factor. Complex
variables may have high loading on more than one factor and they make the interpretation
of the output difficult. The researcher rotated the components nine times to get the
significant variables under six factors.
Table No. 1 shows the reliability statistics and proves the data could support 85.3
percentage reliability to do this analysis. Table No. 2 indicates that the Kaiser-Meyer-
Olkin (KMO) measures of sampling adequacy in the study is 0.832. This is good result, as
it exceeds 0.5 Bartlett’s Test of Sphericity which is 0.000, meaning that factors that form
the variables are adequate.
TABLE NO. 5.80
REALIABILITY STATISTICS
Cronbach's Alpha No. of Items
0.853 20
Source: Computed from Primary Data
TABLE NO. 5.81
KMO AND BARTLETT’S TEST
Kaiser-Meyer-Olkin Measure of Sampling Adequacy. 0.832
Bartlett's Test of Sphericity Approx. Chi-Square 8397.49
Df 190
Sig. 0.000
Source: Computed from Primary Data

204
TOTAL VARIANCE EXPLAINED
Table No. 3 depicts the total variance explained. Total variance is explained with
rotation, the Eigen values are different for factor 1, 2,3,4,5 and 6. The Eigen values for
factor 1, 2,3,4,5 and 6 are 4.306, 2.094, 1.997, 1.524, 1.351 and 1.052. Percentage of
variance for factors 1, 2,3,4,5 & 6 are 21.531, 10.470, 9.987, 7.622, 6.756 and 5.260
respectively. It indicates that six factors extract from 20 factors have cumulative
percentage up to 61.626% of the total variance.
TABLE NO. 5.82
TOTAL VARIANCE EXPLAINED
Compo-nent
Initial Eigen values Extraction Sums of Squared Loadings
Rotation Sums of Squared Loadings
Total % of Variance
Cumula tive %
Total % of Variance
Cumula- tive %
Total % of Variance
Cumu- lative %
1 4.306 21.531 21.531 4.306 21.531 21.531 3.646 18.229 18.229
2 2.094 10.470 32.001 2.094 10.470 32.001 2.333 11.665 29.894
3 1.997 9.987 41.988 1.997 9.987 41.988 2.325 11.627 41.521
4 1.524 7.622 49.610 1.524 7.622 49.610 1.369 6.847 48.368
5 1.351 6.756 56.366 1.351 6.756 56.366 1.328 6.638 55.006
6 1.052 5.260 61.626 1.052 5.260 61.626 1.324 6.620 61.626
7 0.992 4.958 66.584
8 0.981 4.904 71.488
9 0.902 4.511 75.999
10 0.851 4.254 80.253
11 0.837 4.186 84.439
12 0.765 3.826 88.266
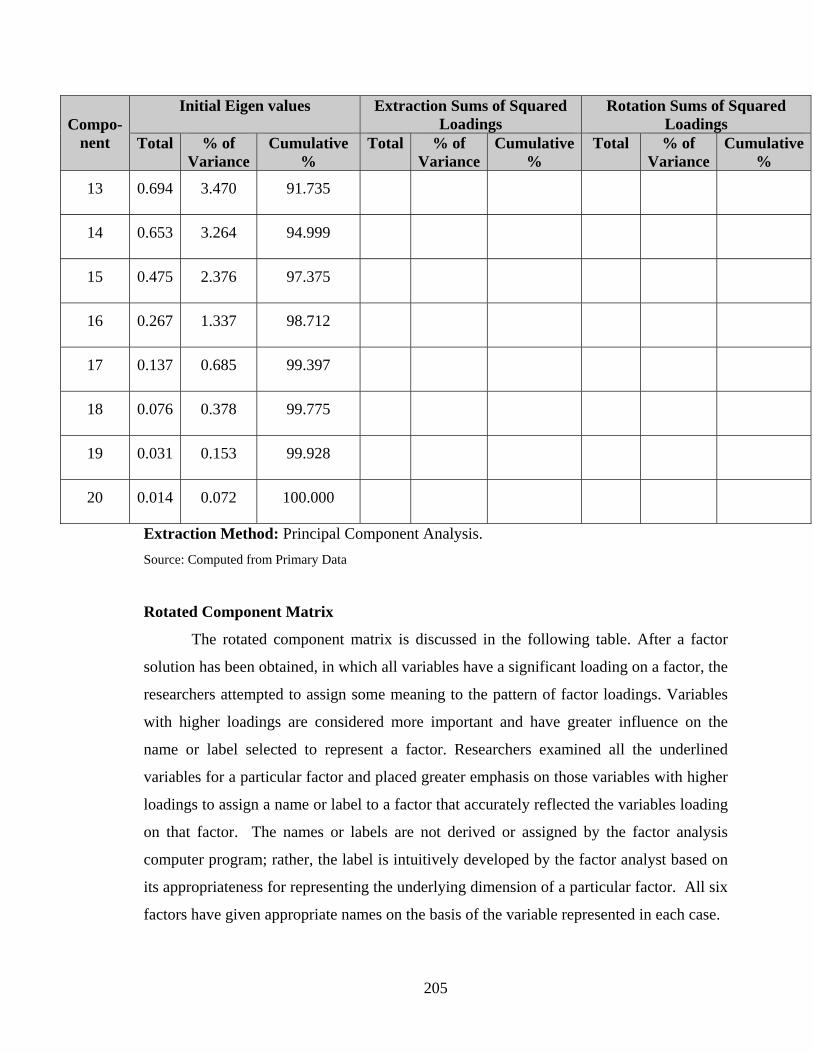
205
Compo-nent
Initial Eigen values Extraction Sums of Squared Loadings
Rotation Sums of Squared Loadings
Total % of Variance
Cumulative %
Total % of Variance
Cumulative %
Total % of Variance
Cumulative %
13 0.694 3.470 91.735
14 0.653 3.264 94.999
15 0.475 2.376 97.375
16 0.267 1.337 98.712
17 0.137 0.685 99.397
18 0.076 0.378 99.775
19 0.031 0.153 99.928
20 0.014 0.072 100.000
Extraction Method: Principal Component Analysis. Source: Computed from Primary Data
Rotated Component Matrix
The rotated component matrix is discussed in the following table. After a factor
solution has been obtained, in which all variables have a significant loading on a factor, the
researchers attempted to assign some meaning to the pattern of factor loadings. Variables
with higher loadings are considered more important and have greater influence on the
name or label selected to represent a factor. Researchers examined all the underlined
variables for a particular factor and placed greater emphasis on those variables with higher
loadings to assign a name or label to a factor that accurately reflected the variables loading
on that factor. The names or labels are not derived or assigned by the factor analysis
computer program; rather, the label is intuitively developed by the factor analyst based on
its appropriateness for representing the underlying dimension of a particular factor. All six
factors have given appropriate names on the basis of the variable represented in each case.
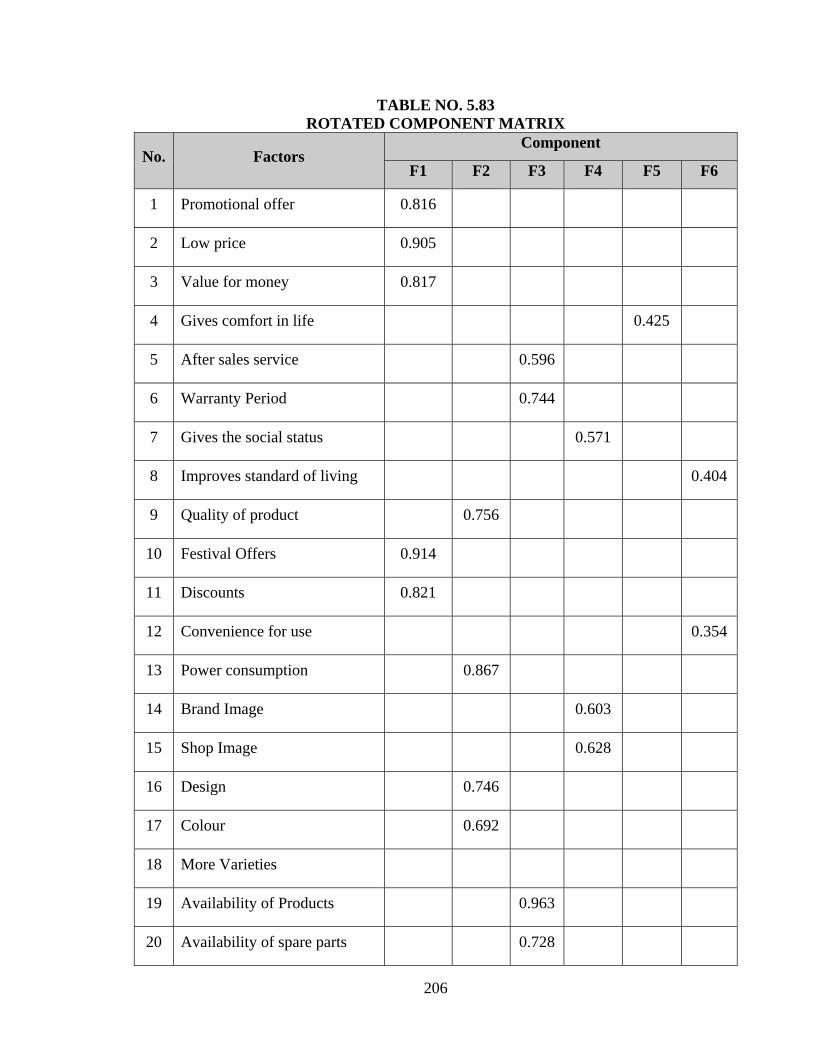
206
TABLE NO. 5.83 ROTATED COMPONENT MATRIX
No. Factors Component
F1 F2 F3 F4 F5 F6
1 Promotional offer 0.816
2 Low price 0.905
3 Value for money 0.817
4 Gives comfort in life 0.425
5 After sales service 0.596
6 Warranty Period 0.744
7 Gives the social status 0.571
8 Improves standard of living 0.404
9 Quality of product 0.756
10 Festival Offers 0.914
11 Discounts 0.821
12 Convenience for use 0.354
13 Power consumption 0.867
14 Brand Image 0.603
15 Shop Image 0.628
16 Design 0.746
17 Colour 0.692
18 More Varieties
19 Availability of Products 0.963
20 Availability of spare parts 0.728
207
Extraction Method : Principal Component Analysis.
Rotation Method : Varimax with Kaiser Normalization.
Rotation converged in 21 iterations. Source: Computed from Primary Data
The above table shows the rotated component matrix, in which the extracted factors
are assigning a new naming related together. From the above table it is noted that all the
loading factors which are having the loading value less than 0.5 are rejected from the
analysis.
a) Factor 1 is the most important factor which explained 21.531% of the variation.
The factors ‘Promotional Offer (0.816)’, ‘Low Price (0.905)’, ‘Value for Money
(0.817)’, ‘Festival Offers (0.914)’ and ‘Discounts (0.821)’ are highly correlated
with each other. These statements reflect cost related consciousness of consumers
of household products; hence, the researcher names this segment as ‘Cost
Conscious Consumers’.
b) The second kind of factors explained 10.470% of the variances. In this segment,
the researcher took the four important variables such as ‘Quality of products
(0.756)’, ‘Power consumption (0.867)’, ‘Design (0.746), and ‘Color (0.692). These
statements reflected consciousness to quality of products and hence the researcher
grouped it as ‘Quality Conscious Consumers’.
c) This factor explained 9.987% of the variations. In this segment, the researchers
took four variables like ‘After sales service (0.596)’, ‘Warranty Period (0.744)’,
‘Availability of Products (0.963), and ‘Availability of spare parts (0.728). These
statements reflected consciousness to services support for their products and hence
the classification as ‘Service Conscious Consumers’.
d) The factor explained 7.622 percent of the variations. The extracted statements are
‘Gives the Social Status (0.571), ‘Brand Image (0.603) and ‘Shop Image (0.628)’
and these statements indicates the social status of the consumers when using these
products. Hence, the segment ‘Social Status Conscious Consumers’.

208
e) The fifth factor explained 6.756 percent of the variations. In this factor, loading
values are very less i.e., 0.425 which is less than 0.5 and hence the variable is
rejected.
f) The sixth factor explained 5.260 percent of the variations. In this factor, loading
values are very less i.e., 0.404 and 0.354 which is less than 0.5 and hence the
variables are rejected.
Conclusion
From the present study it was noticed that the level of satisfaction of consumers
using household electronic products varied and it was classified into four categories. The
first category as ‘Cost Conscious Consumers’, who are purchased the electronic products
at the time of discount offers, promotional offers and festival offers. Secondly the ‘Quality
Conscious Consumers’, who after getting the discounts and offers, need the electronic
products in good quality, design and colour. Followed by the quality electronic products,
the consumers expect well equipped service centres hence, the ‘Service Conscious
consumers’. Consumers who felt their social status enhanced in using the electronic
products were classified as Social Status Conscious Consumers’.
`
Due to the changing lifestyle of today’s consumers, the role of household electronic
products is remarkable. With joint family system diminishing and nuclear families
increasing with double income, they prefer the usage of electronic products to save time
and energy. Most of the consumers prefer to take the privilege of credit cards and
installment credit for their purchases. It is discovered that consumers persist on specific
brands while every purchase and LG modules dominate the household electronic products
market.