chapter twelve performance evaluation and decentralization copyright © 2012 nelson education ltd
Post on 19-Dec-2015
221 views
TRANSCRIPT

Chapter TwelvePerformance Evaluation and
Decentralization
Chapter TwelvePerformance Evaluation and
Decentralization
COPYRIGHT © 2012 Nelson Education Ltd.

COPYRIGHT © 2012 Nelson Education Ltd.
Learning ObjectivesLearning Objectives
1. Explain how and why firms choose to decentralize
2. Compute and explain return on investment
3. Compute and explain residual income and economic value added
4. Explain the role of transfer pricing in a decentralized firm
5. Explain the uses of the Balanced Scorecard, and compute cycle time, velocity, and manufacturing cycle efficiency
12-2

OBJECTIVE OBJECTIVE 11
Explain how and why firms choose to
decentralize
COPYRIGHT © 2012 Nelson Education Ltd.
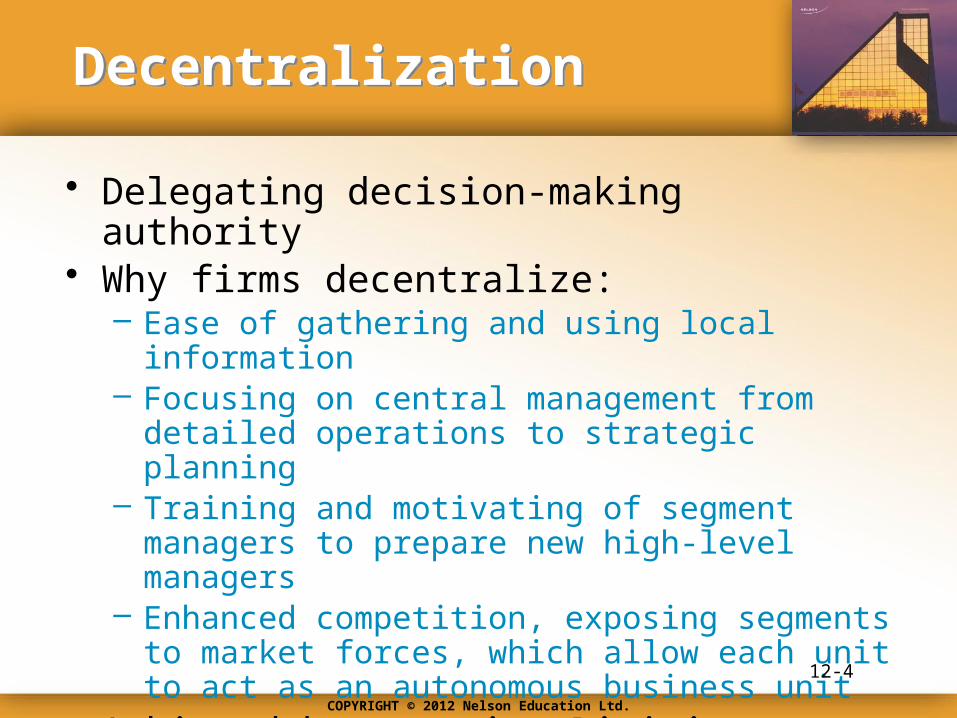
DecentralizationDecentralization
• Delegating decision-making authority• Why firms decentralize:
– Ease of gathering and using local information– Focusing on central management from detailed
operations to strategic planning– Training and motivating of segment managers to
prepare new high-level managers– Enhanced competition, exposing segments to market
forces, which allow each unit to act as an autonomous business unit
• Achieved by creating Divisions
12-4

COPYRIGHT © 2012 Nelson Education Ltd.
DivisionsDivisions
• Differentiated by:– Type of product or service provided– Geographic lines
• Type of responsibility given to divisional manager– Responsibility centre is a segment of business
whose manager is accountable for specified sets of activities
12-5

COPYRIGHT © 2012 Nelson Education Ltd.
Types of Responsibility CentresTypes of Responsibility Centres
• Cost centre– Manager is responsible only for costs
• Revenue centre– Manager is responsible only for sales
• Profit centre– Manager is responsible for revenues and costs
• Investment centre– Manager is responsible for revenues, costs,
and investments
12-6

COPYRIGHT © 2012 Nelson Education Ltd.
Measuring the Performance of Profit centresMeasuring the Performance of Profit centres
• Preparation of segmented income statements– Two methods of computing income:
• Variable costing • Full or Absorption costing
– Methods often lead to different operating income figures
12-7

OBJECTIVE OBJECTIVE 22
Compute and explain return on investment
(ROI)

COPYRIGHT © 2012 Nelson Education Ltd.
Return on Investment (ROI)Return on Investment (ROI)
Operating Income ÷ Average Operating Assets
Earnings before income and taxes (EBIT)
Formula:
(Beginning assets + Ending assets) ÷ 2
12-9
COPYRIGHT © 2012 Nelson Education Ltd.
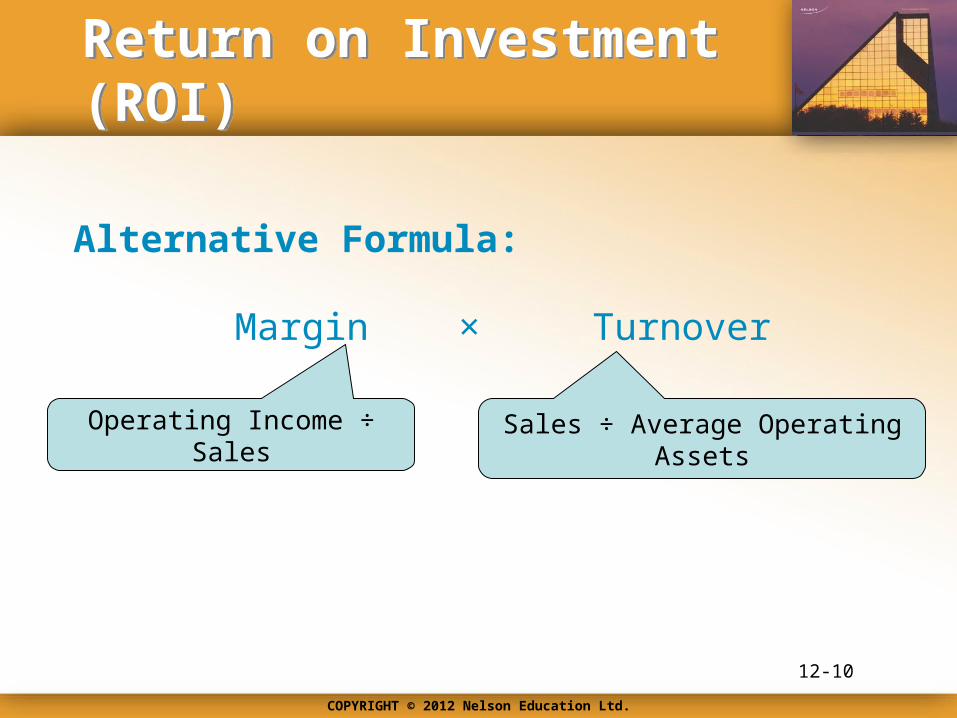
Return on Investment (ROI)Return on Investment (ROI)
Margin × Turnover
Operating Income ÷ Sales
Alternative Formula:
Sales ÷ Average Operating Assets
12-10

COPYRIGHT © 2012 Nelson Education Ltd.
Margin and TurnoverMargin and Turnover
• Margin– Ratio of operating income to sales– Tells how many cents of operating income
result from each dollar of sales– Expresses portion of sales available for
interest, taxes, and profit
• Turnover– Divides sales by average operating assets– Tells how many dollars of sales result from
every dollar invested in operating assets
12-11
COPYRIGHT © 2012 Nelson Education Ltd.
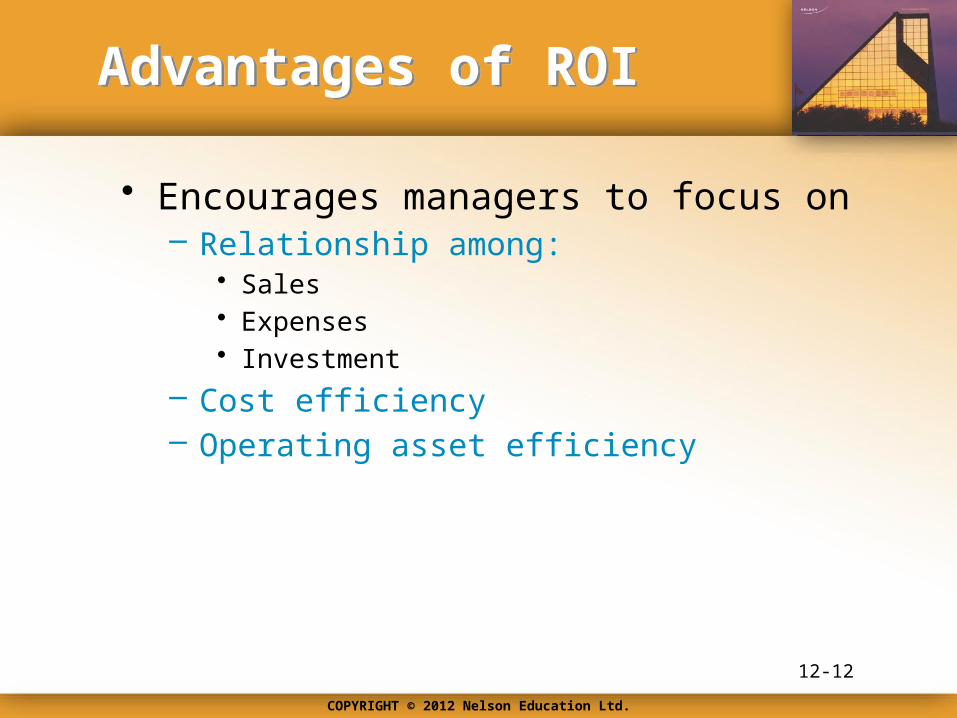
Advantages of ROIAdvantages of ROI
• Encourages managers to focus on– Relationship among:
• Sales• Expenses• Investment
– Cost efficiency– Operating asset efficiency
12-12

COPYRIGHT © 2012 Nelson Education Ltd.
Disadvantages of ROIDisadvantages of ROI
• Narrow focus on divisional profitability at expense of profitability for the overall firm
• Encourages managers to focus on short run at the expense of the long run
12-13
COPYRIGHT © 2012 Nelson Education Ltd.
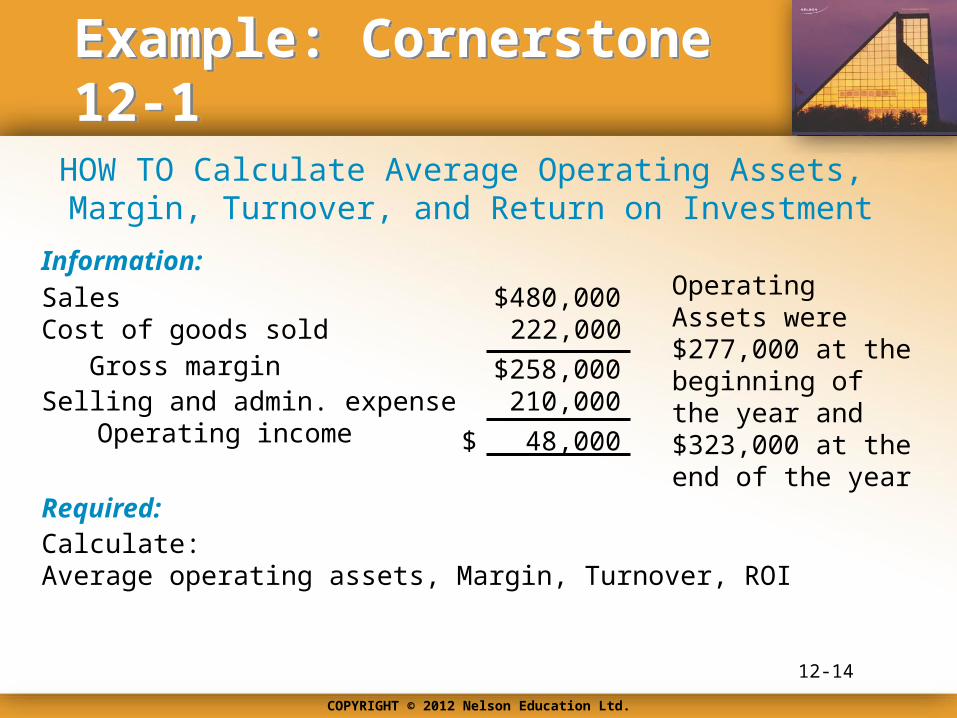
HOW TO Calculate Average Operating Assets, Margin, Turnover, and Return on Investment
Example: Cornerstone 12-1Example: Cornerstone 12-1
Information:SalesCost of goods sold
Gross marginSelling and admin. expense
$480,000222,000
Operating income $ 48,000
$258,000210,000
Operating Assets were $277,000 at the beginning of the year and $323,000 at the end of the year
Required:Calculate:Average operating assets, Margin, Turnover, ROI
12-14
COPYRIGHT © 2012 Nelson Education Ltd.
ExampleExample
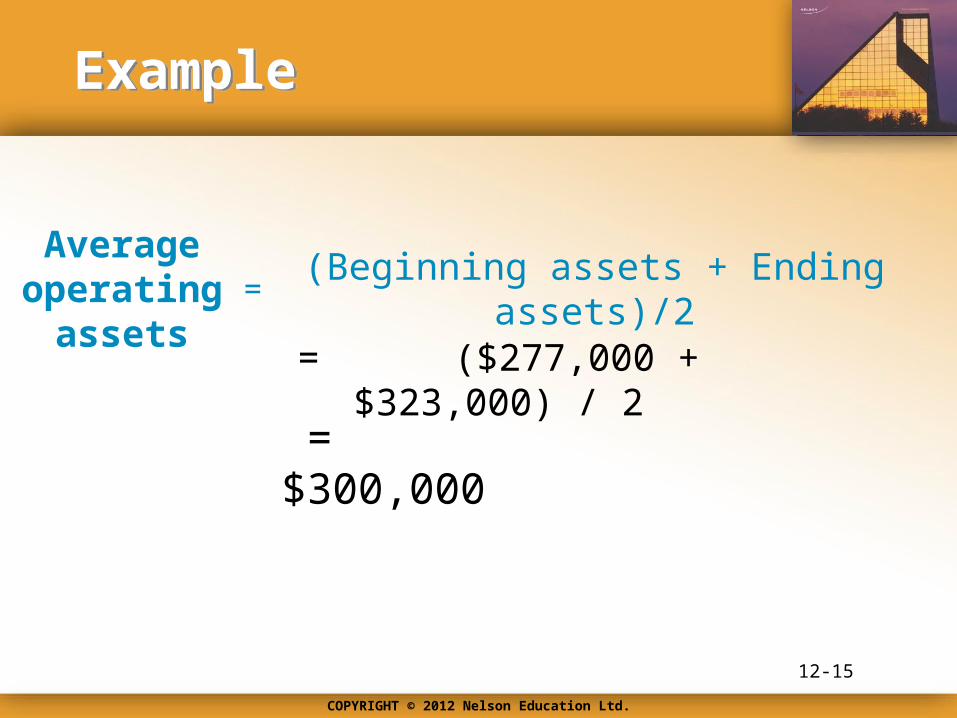
Average operating
assets(Beginning assets + Ending assets)/2=
= ($277,000 + $323,000) / 2
= $300,000
12-15

COPYRIGHT © 2012 Nelson Education Ltd.
ExampleExample
Margin Operating Income / Sales=
= $48,000 / $480,000
= 0.10 or 10%
12-16
Turnover Sales / Average operating assets=
= $480,000 / $300,000
= 1.6

COPYRIGHT © 2012 Nelson Education Ltd.
ExampleExample
Return on Investment
(ROI)
Margin × Turnover=
= 0.10 × 1.6
= .16 or 16%
Alternatively:
Operating income / Average operating assets
= $48,000 / $300,000
= .16 or 16%
12-17

OBJECTIVE OBJECTIVE 33
Compute and explain residual income and
economic value added

COPYRIGHT © 2012 Nelson Education Ltd.
Residual IncomeResidual Income
Operating Income DMinimum rate of return ×
Average operating assets
If residual income is…
less than zero, the co. is earning less than minimum ROI
exactly zero, the co. is earning precisely minimum ROI
greater than zero, the co. is earning more than minimum ROI
Set by the company
12-19

COPYRIGHT © 2012 Nelson Education Ltd.
Advantages & Disadvantages of Residual IncomeAdvantages & Disadvantages of Residual Income
• Advantages– Accept any project that earns above minimum rate
• Disadvantages– Short run orientation– Residual income is an absolute measure of
profitability• Direct comparison is difficult when level of investments
differ
12-20

COPYRIGHT © 2012 Nelson Education Ltd.
Example: Cornerstone 12-2Example: Cornerstone 12-2
Information:SalesCost of goods sold
Gross marginSelling and admin. expense
$480,000222,000
Operating income $ 48,000
$258,000210,000
Operating Assets were $277,000 at the start of the year and $323,000 at year endA minimum ROI of 12% is required
HOW TO Calculate Residual Income
Required:
Calculate:
Average operating assets, Residual income
12-21

COPYRIGHT © 2012 Nelson Education Ltd.
ExampleExample
Average operating
assets(Beginning assets + Ending assets)/2=
= ($277,000 + $323,000) / 2
= $300,000
12-22

COPYRIGHT © 2012 Nelson Education Ltd.
ExampleExample
Residual Income
Operating Income
=
= $48,000 - $36,000
= $12,000
D Minimum rate of return ×
Average Operating
Assets
12-23

COPYRIGHT © 2012 Nelson Education Ltd.
Residual IncomeResidual Income
D
Formula:
Actual percentage cost of capital × Total capital employed
If EVA is positive then company is creating wealth
If EVA is negative then company is destroying wealth
After-tax operating income
12-24

COPYRIGHT © 2012 Nelson Education Ltd.
Example: Cornerstone 12-3Example: Cornerstone 12-3
Information:SalesCost of goods sold
Gross marginSelling and admin.
$480,000222,000
Operating income $ 48,000
$258,000210,000
Total capital employed equalled $300,000. Actual cost of capital is 10%
Less: Income taxes (@ 30%) 14,400 Net income $ 33,600
HOW TO Calculate Economic Value Added
Calculate Economic Value Added (EVA) for the Western Division
Required:
12-25
COPYRIGHT © 2012 Nelson Education Ltd.
ExampleExample
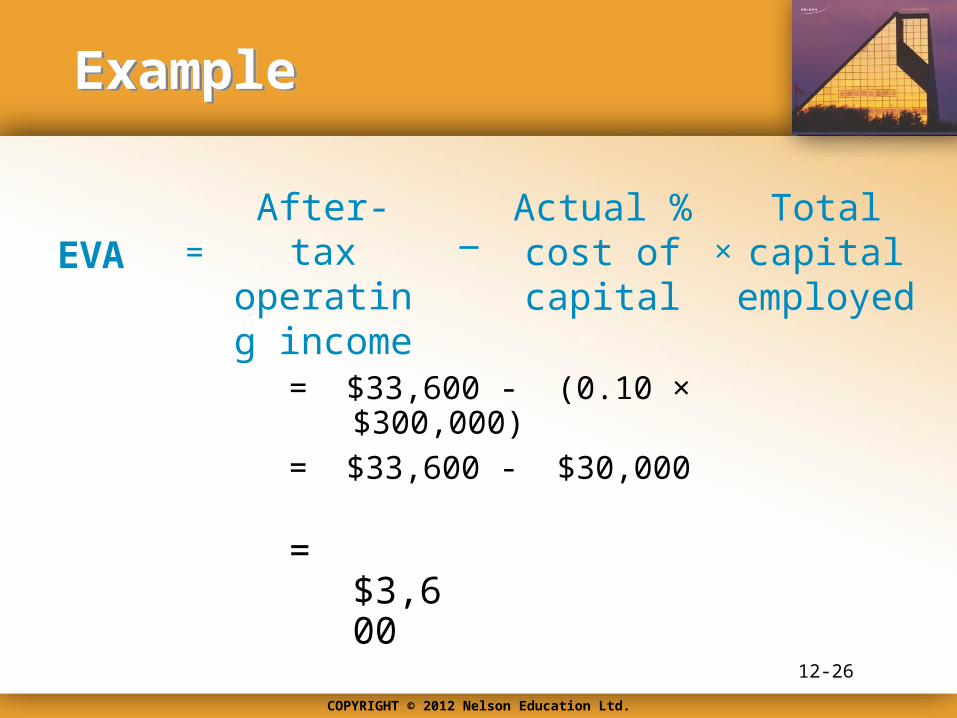
EVA = ×
= $33,600 - (0.10 × $300,000)
After-tax operating income
Actual % cost of capital
Total capital
employed
= $33,600 - $30,000
= $3,600
12-26

COPYRIGHT © 2012 Nelson Education Ltd.
Advantages of EVAAdvantages of EVA
• Encourages the right kind of behaviour• Relies on true cost of capital• Cost of capital is considered a corporate
expense and is passed along to overall income statement
• Makes investment seem free to the divisions so they want more
12-27

OBJECTIVE OBJECTIVE 44
Explain the role of transfer pricing in a decentralized firm

COPYRIGHT © 2012 Nelson Education Ltd.
Transfer PricingTransfer Pricing
• Price charged for a component by the selling division to the buying division of the same company
• Sale is a revenue to the selling division• Sale is a cost to the buying division• Transfer Pricing policies:
– Market price– Cost-based transfer pricing– Negotiated transfer pricing
12-29
COPYRIGHT © 2012 Nelson Education Ltd.
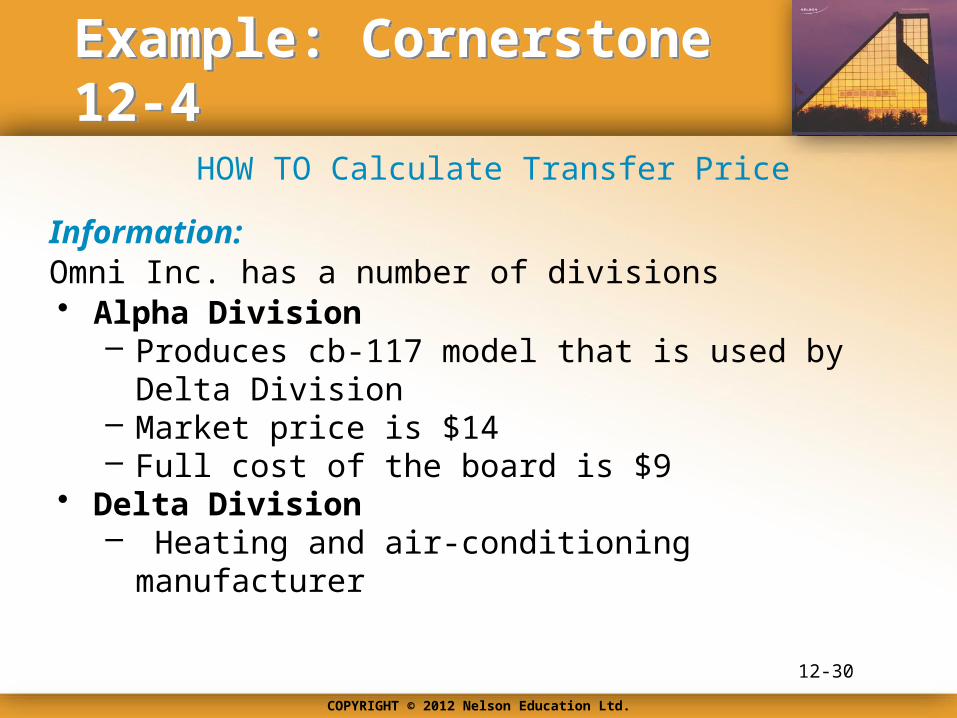
Example: Cornerstone 12-4Example: Cornerstone 12-4
• Alpha Division– Produces cb-117 model that is used by Delta
Division– Market price is $14– Full cost of the board is $9
• Delta Division– Heating and air-conditioning manufacturer
Information:Omni Inc. has a number of divisions
HOW TO Calculate Transfer Price
12-30
COPYRIGHT © 2012 Nelson Education Ltd.
ExampleExample
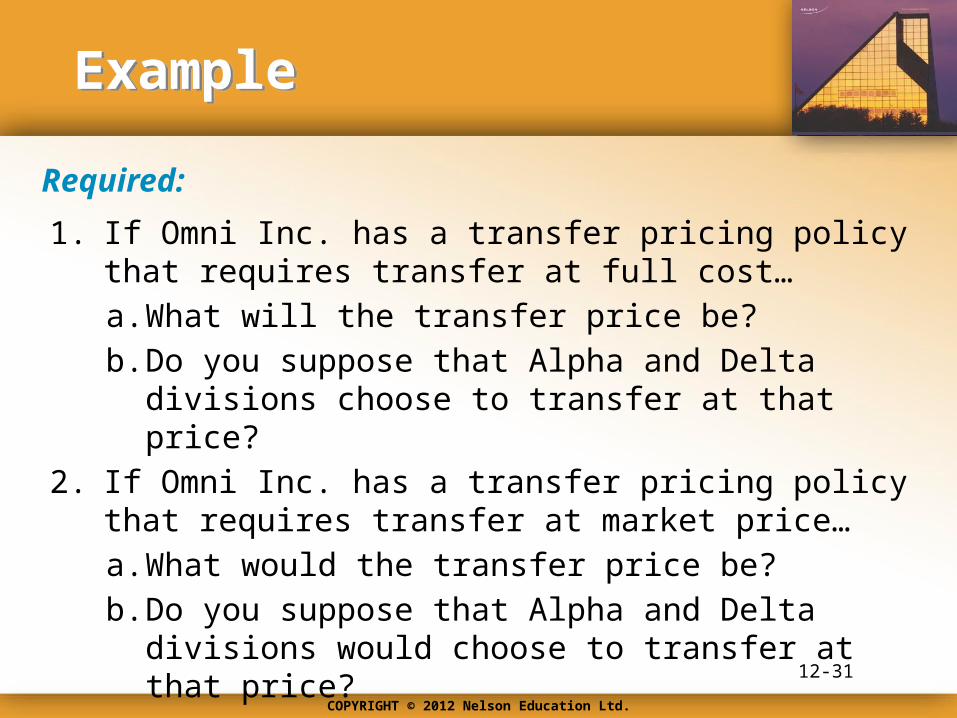
1. If Omni Inc. has a transfer pricing policy that requires transfer at full cost…
a. What will the transfer price be?
b. Do you suppose that Alpha and Delta divisions choose to transfer at that price?
2. If Omni Inc. has a transfer pricing policy that requires transfer at market price…
a. What would the transfer price be?
b. Do you suppose that Alpha and Delta divisions would choose to transfer at that price?
Required:
12-31

COPYRIGHT © 2012 Nelson Education Ltd.
Advantages of EVAAdvantages of EVA
3. Now suppose that Omni Inc. allows negotiated transfer pricing and that Alpha Division can avoid $3 of selling expense by selling to Delta Division
a. Which division sets the minimum transfer price and what is it?
b. Which division sets the maximum transfer price, and what is it?
c. Do you suppose that Alpha and Delta divisions would choose to transfer somewhere in the bargaining range?
Required continued:
12-32

COPYRIGHT © 2012 Nelson Education Ltd.
ExampleExample
Transfer Pricing at Full Cost:
Full cost transfer price $9
Delta Division would like the price, but…
Alpha Division would refuse to transfer since $14 could be earned in the outside
market
12-33
COPYRIGHT © 2012 Nelson Education Ltd.
ExampleExample
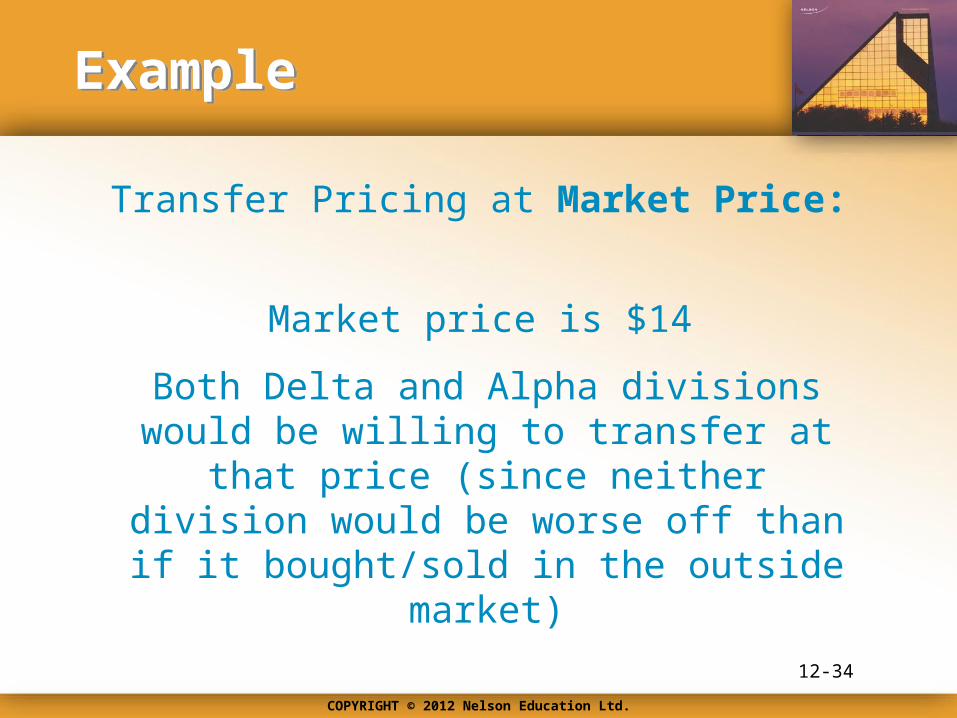
Transfer Pricing at Market Price:
Market price is $14
Both Delta and Alpha divisions would be willing to transfer at that price (since neither
division would be worse off than if it bought/sold in the outside market)
12-34

COPYRIGHT © 2012 Nelson Education Ltd.
ExampleExample
Transfer Pricing at a Negotiated Transfer Price:
Minimum transfer price = $14 – $3 = $11
This price is set by Alpha division (the selling division)
Maximum transfer price = $14
This price is the market price and is set by Delta division (the buying division)
Alpha and Delta will negotiate a price somewhere between $11 and $14
12-35

OBJECTIVE OBJECTIVE 55
Explain the uses of the Balanced Scorecard and compute cycle
time, velocity, and manufacturing cycle efficiency
COPYRIGHT © 2012 Nelson Education Ltd.
Balanced ScorecardBalanced Scorecard
• Strategic management system • Translates an organization’s mission
and strategy into:– Operational objectives – Performance measures– Four different perspectives
12-37

COPYRIGHT © 2012 Nelson Education Ltd.
Operational Objectives and Performance MeasuresOperational Objectives and Performance Measures
• Financial perspective– economic consequences of actions taken
• Customer perspective– customer and market segments in which business
unit will compete• Internal business process perspective
– internal processes needed to provide value for customers and owners
• Learning & growth (infrastructure) perspective– capabilities that an organization needs to create
long-term growth and improvement
12-38

COPYRIGHT © 2012 Nelson Education Ltd.
Strategy TranslationStrategy Translation
Specifying objectives, measures, targets, and initiatives for each
perspective
12-39

COPYRIGHT © 2012 Nelson Education Ltd.
Performance MeasuresPerformance Measures
• Derived from a company’s vision, strategy, and objectives
• Measures must be balanced between– performance driver measures and outcome
measures– objective and subjective measures– external and internal measures– financial and nonfinancial measures
• Must also be carefully linked to the organization’s strategy
12-40
COPYRIGHT © 2012 Nelson Education Ltd.
Financial PerspectivesFinancial Perspectives
• Established the long- and short-term financial performance objectives
• Concerned with global financial consequences of the three perspectives
• Three strategic themes:– Revenue growth– Cost reduction– Asset utilization
12-41

COPYRIGHT © 2012 Nelson Education Ltd.
Revenue GrowthRevenue Growth
• Objectives:– Increase number of new products– Create new applications for existing products– Develop new customers and markets– Adopt a new pricing strategy
• From objectives performance measures can be designed
12-42

COPYRIGHT © 2012 Nelson Education Ltd.
Cost ReductionCost Reduction
• Objectives– Reducing the cost
• per unit of product• per customer• per distribution channel
• Trends tell whether costs are being reduced• Activity-based costing can play an essential
measurement role
12-43

COPYRIGHT © 2012 Nelson Education Ltd.
Asset UtilizationAsset Utilization
• Principle objective– Improving asset utilization
• Measures– Return on investment– Economic value added
12-44

COPYRIGHT © 2012 Nelson Education Ltd.
Customer PerspectiveCustomer Perspective
• Defines and selects customer and market segments in which company competes
• Objectives are to increase:– market share– customer retention– customer acquisition– customer satisfaction– customer profitability
12-45

COPYRIGHT © 2012 Nelson Education Ltd.
Customer PerspectiveCustomer Perspective
• Measures:– market share– percentage growth of business from existing
customers – percentage of repeating customers– number of new customers– ratings from customer satisfaction surveys– individual and segment profitability
• Activity-based costing is a key tool
12-46

COPYRIGHT © 2012 Nelson Education Ltd.
Cycle Time and VelocityCycle Time and Velocity
• Responsiveness– Time to respond to a customer order
• Operational measures– Cycle Time
• Length of time it takes to produce a unit of output from the time raw materials are received until the good is delivered to finished goods inventory
– Velocity• Number of units of output that can be produced in a
given period of time
12-47
COPYRIGHT © 2012 Nelson Education Ltd.
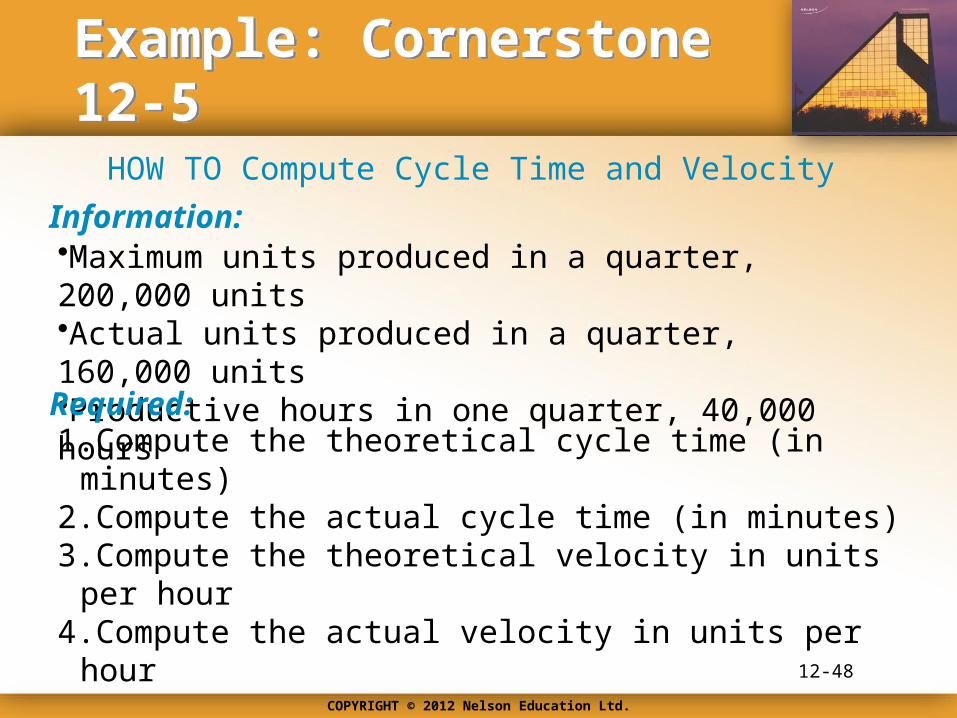
Example: Cornerstone 12-5Example: Cornerstone 12-5
•Maximum units produced in a quarter, 200,000 units•Actual units produced in a quarter, 160,000 units•Productive hours in one quarter, 40,000 hours
Information:
HOW TO Compute Cycle Time and Velocity
1.Compute the theoretical cycle time (in minutes)2.Compute the actual cycle time (in minutes)3.Compute the theoretical velocity in units per hour4.Compute the actual velocity in units per hour
Required:
12-48

COPYRIGHT © 2012 Nelson Education Ltd.
Theoretical Cycle TimeTheoretical Cycle Time
Productive hours in one quarter ×
60 minutes per hour
Maximum units produced in a
quarter
40,000 hours × 60 minutes per hour 200,000 units
12 minutes per unit
12-49

COPYRIGHT © 2012 Nelson Education Ltd.
Actual Cycle Time Actual Cycle Time
Productive hours in one quarter ×
60 minutes per hour
Actual units produced in a
quarter
40,000 hours × 60 minutes per hour 160,000 units
15 minutes per unit
12-50

COPYRIGHT © 2012 Nelson Education Ltd.
Theoretical VelocityTheoretical Velocity
60 minutes per hour
Theoretical cycle time
60 minutes per hour
12 minutes per unit
= 5 units per hour
=
12-51
COPYRIGHT © 2012 Nelson Education Ltd.
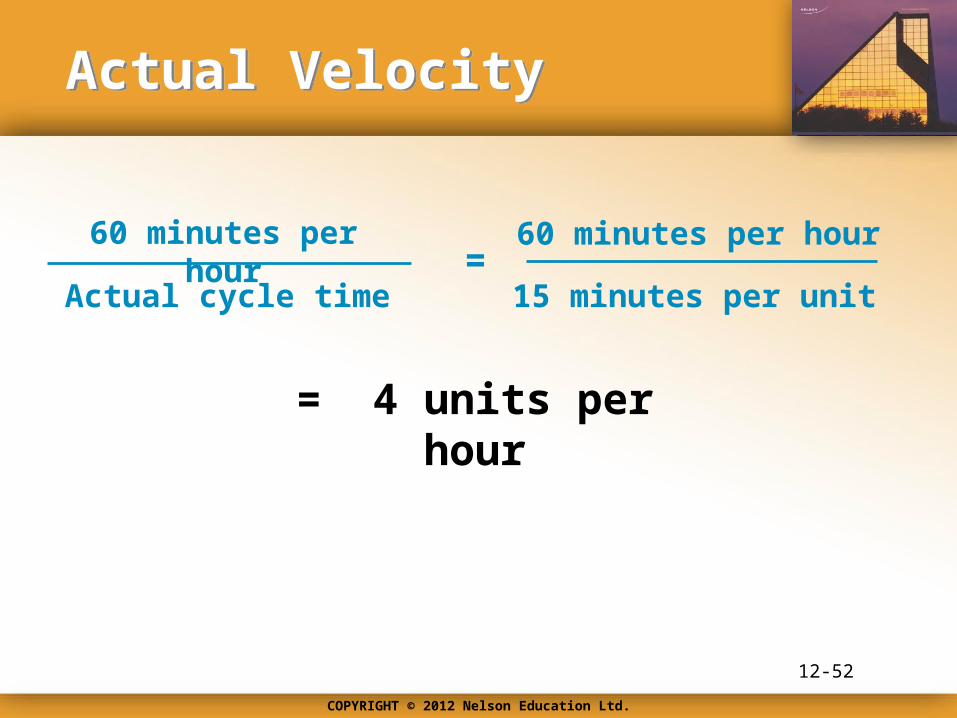
Actual VelocityActual Velocity
60 minutes per hour
Actual cycle time
60 minutes per hour
15 minutes per unit
= 4 units per hour
=
12-52
COPYRIGHT © 2012 Nelson Education Ltd.
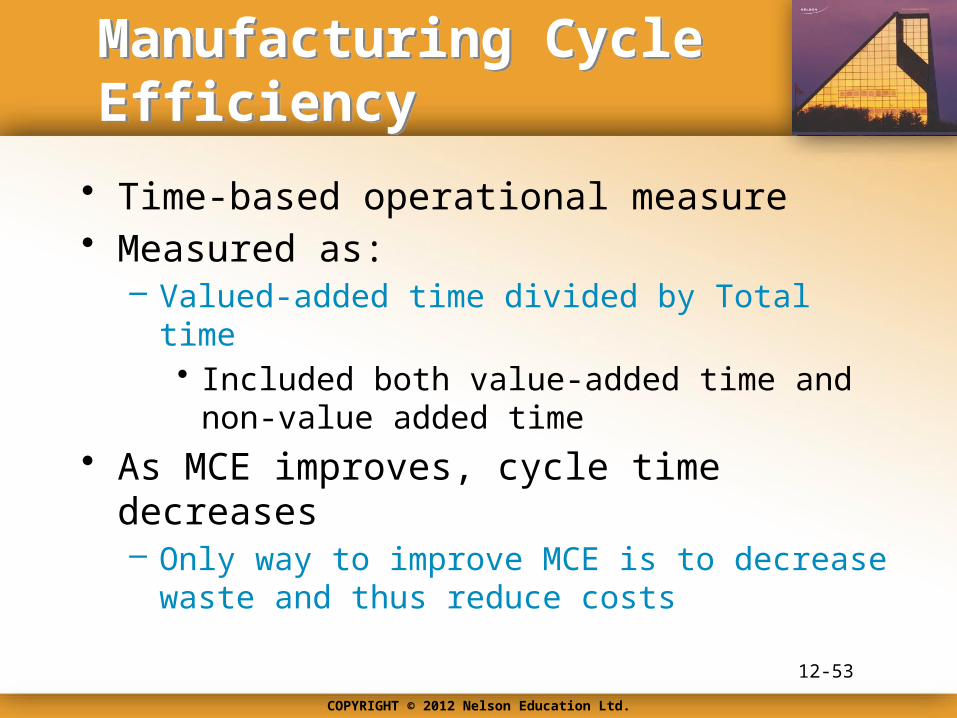
Manufacturing Cycle EfficiencyManufacturing Cycle Efficiency
• Time-based operational measure• Measured as:
– Valued-added time divided by Total time• Included both value-added time and non-value
added time
• As MCE improves, cycle time decreases – Only way to improve MCE is to decrease waste and
thus reduce costs
12-53
COPYRIGHT © 2012 Nelson Education Ltd.
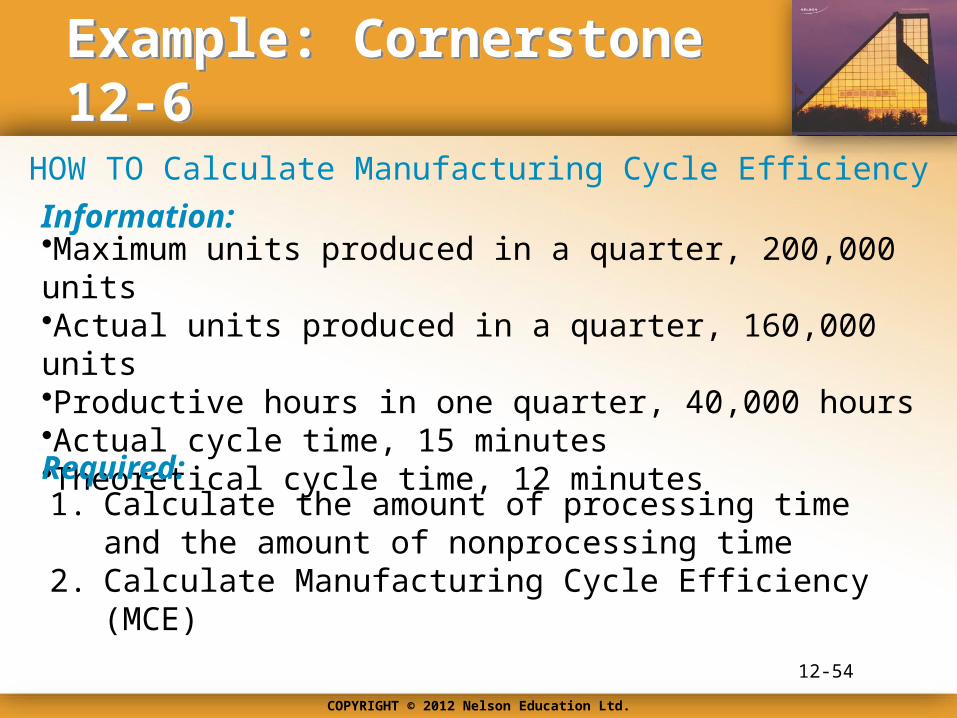
Example: Cornerstone 12-6Example: Cornerstone 12-6
•Maximum units produced in a quarter, 200,000 units•Actual units produced in a quarter, 160,000 units•Productive hours in one quarter, 40,000 hours•Actual cycle time, 15 minutes•Theoretical cycle time, 12 minutes
Information:
HOW TO Calculate Manufacturing Cycle Efficiency
1. Calculate the amount of processing time and the amount of nonprocessing time
2. Calculate Manufacturing Cycle Efficiency (MCE)
Required:
12-54
COPYRIGHT © 2012 Nelson Education Ltd.
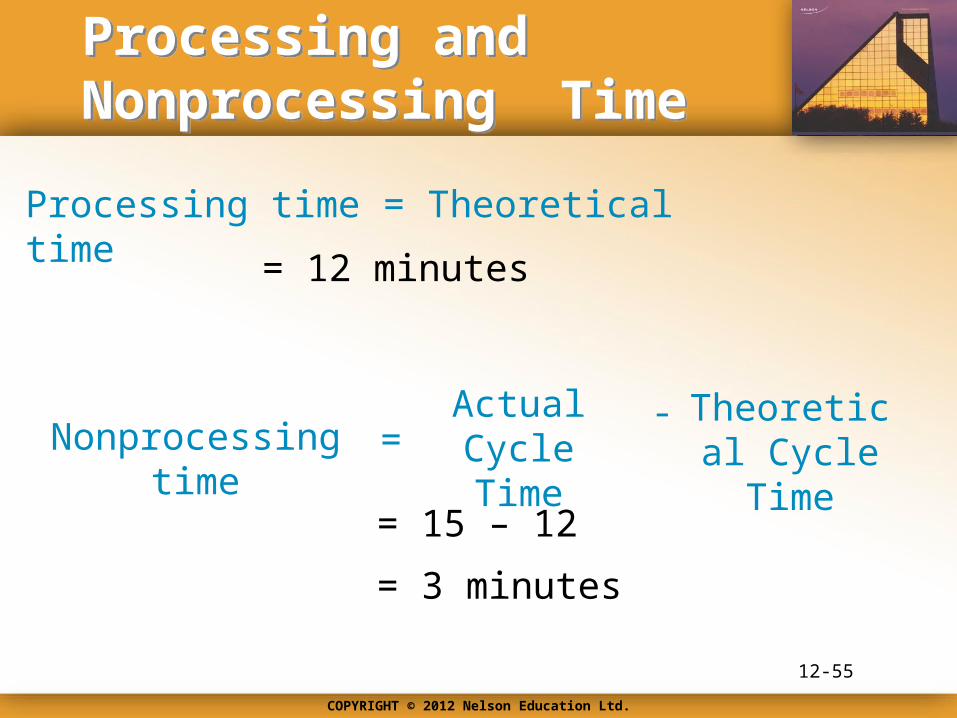
Processing and Nonprocessing TimeProcessing and Nonprocessing Time
Processing time = Theoretical time
= 12 minutes
Nonprocessing time =Actual Cycle
Time- Theoretical
Cycle Time
= 15 – 12
= 3 minutes
12-55

COPYRIGHT © 2012 Nelson Education Ltd.
Manufacturing Cycle Time (MCE)Manufacturing Cycle Time (MCE)
Processing time
Processing time
12 (12 + 3)
+Nonprocessing
time
0.8 or 80 percent
12-56