chapter sample - j. ross publishing decision making process is one reason why ppm is not widely ......
TRANSCRIPT

xi
PREFACE
BACKGROUNDMuch has been written on the subject of project portfolio management (PPM). Harvey Levine, a highly regarded project management expert, defined PPM as “... the management of the project port-folio so as to maximize the contribution of projects to the overall welfare and success of the enter-prise” (Levine, 2005). With PPM, projects that best support organizational goals and objectives are selected to ensure the optimal mix of projects and portfolios to achieve strategic objectives. Although many authors, including Levine, have defined “what” PPM is, it is still not broadly implemented. The authors believe that while the “what” of PPM has been effectively described by a host of PPM pro-fessionals, the process of “how” has been presented in abstract and has not received nearly as much attention. In our view, the lack of detail about “how” to perform PPM and its central role in an effec-tive decision making process is one reason why PPM is not widely employed or used to maximum benefit. Simply put, although executives and managers may know what PPM is, many do not fully understand how to implement and practice it to make better decisions and more effectively manage project portfolios that will best achieve their objectives.
A key element of PPM is effective decision making using an organized and disciplined process. Too often projects are randomly identified, discussed to exhaustion, and then finally chosen as a means to end interminable meetings, resulting in misallocation of the organization’s valued and scarce resources. Managers grapple with endless dialogue because the decision process lacks struc-ture, and those participating fail to realize that portfolio decisions are complex enough to exceed the grasp of human cognition. Questions such as how to align projects to strategic goals and objectives, accurately determine the relative importance of conflicting objectives, evaluate the degree to which projects contribute to these objectives, decide where to allocate scarce resources for maximum ben-efit, and balance projects across the organization to satisfy competing demands without destroying organization morale and unity have complex answers. Such decisions cannot be made effectively us-ing informal processes. How to eliminate fruitless discussion, improve the quality of portfolio deci-sions, and increase the chances of achieving the organization’s strategic goals and objectives through PPM are what this book is about.
WHY PPMIncreasing competition and the need for agility in today’s organizations makes a compelling case for effective portfolio selection and management through timely and sound decision making. That means getting the right information to the right people at the right time, thus increasing the likeli-hood of making the right decision. Many organizations fund and execute projects without using formal PPM, that is, projects are selected using ad hoc decision processes, often leading to project portfolios that are unrelated to or fail to achieve strategic goals and objectives. How projects are se-lected matters in terms of how well strategic goals and objectives are achieved.
Sample
Cha
pter
xii Mastering Project Portfolio Management
Even the most basic PPM process can yield significant benefits for any organization by increasing the chances of selecting and managing project portfolios that deliver the most benefit in terms of achieving goals and objectives at a given funding level under identified organizational constraints. Making the wrong decisions and expending resources on the wrong initiatives, those that do not drive organizational achievement, are much more costly than implementing a basic, effective PPM process. Identifying, evaluating, selecting, and managing a project portfolio is a complex decision problem requiring robust processes and procedures, clear roles and responsibilities, and appropri-ate software tools and decision methods. While this may sound overwhelming, establishing a PPM process can be accomplished with the right guidance, effective management of change, and an un-derstanding of what is required.
PURPOSE OF THIS BOOKThis book provides a holistic view of PPM that includes people, process, tools, and techniques that work together synergistically within the organization to produce portfolio decisions with the greatest chance of success. To accomplish this, the authors provide a PPM model that conceptually illustrates the entire process from strategic planning through portfolio evaluation and adjustment. We follow the process model through prioritizing organizational objectives; identifying and evaluating candi-date projects; selecting optimal portfolios; and evaluating performance of the portfolios. To put the decision processes and tools in context, we describe roles and responsibilities, major activities, and governance concepts necessary to support the PPM process.
In addition, the book shows how members of an organization not currently using formal PPM can effectively implement processes to prioritize goals and objectives defined during strategic plan-ning, identify and select portfolios of projects that best achieve them, and evaluate project portfolio performance. Rather than an abstract discussion, this book applies a hands-on approach using real decision support software and techniques accompanied by step-by-step illustrations to guide the reader through the process. The reader is provided temporary access to the software to reinforce the concepts described.
CONTENT AND ORGANIZATIONThe book contains eleven chapters, each building on the previous one. Chapter 1 establishes a com-mon understanding of PPM. Chapter 2 addresses the strategic planning process and its role in pro-ducing the goals and objectives that serve as critical inputs to the PPM process. Chapter 3 introduces measurement types and decision models and describes software tools used in the book’s examples. These three chapters are crucial to understanding the basics of PPM and the context of decisions made within the process.
Chapter 4 introduces structuring decision models and describes the process of prioritizing the organizational objectives identified during the strategic planning process. In many organizations lacking an effective PPM process, this step is omitted and the organizational objectives are errone-ously treated as though they are of equal importance.
Chapters 5 and 6 describe how to identify and screen large numbers of potential projects to pro-duce a reduced pool of candidate projects to be considered for portfolio selection, while maintaining traceability of these projects to the organizational objectives they support.
Chapters 7, 8, and 9 address the evaluation of the candidate projects (also called alternatives) with respect to the objectives they support, thus determining relative project benefits. Additionally, the selection of the project portfolio subject to organizational constraints and risk is presented, including consideration of alternative portfolio scenarios for various sets of business assumptions.
Sample
Cha
pter

PREFACE xiii
Finally, Chapters 10 and 11 discuss the implementation of the approved project portfolio and address how to evaluate the portfolio with regard to performance against baseline plans while main-taining relevance to organizational objectives. These chapters describe the iterative nature of PPM and the cycles that drive it.
Throughout the book the material is reinforced using a notional example based on a real project portfolio situation while providing the reader access to the software used in this book in order to understand and apply it.
SOFTWARE TOOLSIt is not the intention of the authors to endorse one software product over others. However, we do make it clear that timely and effective project portfolio decisions are difficult or impossible without the right decision-making tools. In this book we do not emphasize managing projects using proj-ect management software, rather we focus on decisions involving selecting the right portfolio and effectively managing its performance to achieve strategic objectives. Accordingly, the authors use decision support software tools provided by Expert Choice to illustrate the concepts. The tools are based on the Analytic Hierarchy Process (AHP), a widely accepted approach for making complex compensatory decisions of all kinds, including those presented in this book.
This software is a logical choice to illustrate decision-making concepts because it incorporates enhanced AHP support and optimization capabilities beyond those offered by many other tools. However, other PPM software tools are available in the marketplace, including the portfolio-based enhancements for Oracle’s Primavera, Microsoft’s Project Server, PlanView Enterprise, and many products from smaller vendors. Some of these products, with origins in project management soft-ware, include compensatory decision-making capabilities; some require considerable resources to implement and manage. Not all of these products use AHP and the ratio-scale mathematics neces-sary for valid comparison of alternatives and selection of project portfolios. In any case, the decision-making concepts presented in this book using Expert Choice tools will familiarize the reader with the broad applicability of AHP for mathematically sound complex PPM decisions, including priori-tizing objectives, selecting project portfolios, and evaluating portfolio performance.
AUDIENCEThe authors developed this book for use by people in any organization that relies on projects to contribute to the achievement of its vision, goals, and objectives; it is intended for those who want to implement PPM for the first time or wish to enhance their existing project portfolio processes. By providing a PPM model and the infrastructure needed to support the model, this book provides a roadmap to effectively design, develop, implement, and manage a tailored project portfolio process in a relatively short period of time without great expense. In addition to decomposing the process into easily understandable and logical phases, the book also identifies specific tools, techniques, and resources needed to support the process, together with examples throughout to show the reader how to do it. With guidance, engagement, and the support of upper management, and reasonably effec-tive project and program management infrastructure, any organization can implement its own PPM process. Thus, they can make better decisions and increase their chances of achieving strategic objec-tives. People whose organizations are already using PPM might think about how to use the concepts in this book to supplement or improve existing processes.
The book is also intended for use as a textbook in a PPM course within graduate and upper-level undergraduate business degree programs. It provides a roadmap for students to understand PPM through the application of tools and techniques, using a defined process consisting of discrete phases
Sample
Cha
pter

xiv Mastering Project Portfolio Management
and steps. By structuring the text to coincide with the logical progression of the PPM process and illustrating which tools and techniques to use along the roadmap, students will obtain a clear under-standing of PPM.
REFERENCESLevine, Harvey A. (2005). Project Portfolio Management: A Practical Guide to Selecting Projects, Managing Port-
folios, and Maximizing Benefits. San Francisco, CA: Jossey-Bass Business and Management Series.
Sample
Cha
pter

37
3Introduction to Ratio-scale
Measurements and the Analytic hierarchy Process
Some of the most important, and most complex, decisions made by organizations are those that de-termine which projects will be executed to maximize return to the organization. The ability to struc-ture decisions, measure options, and synthesize the measurements to derive priorities is critical to implementing and maintaining an effective PPM process and in selecting optimal portfolios. These capabilities must be embedded in the tools and techniques used. How choices are made can be the difference between good decisions and bad ones. Understanding how to measure, and how to inter-pret the measurement, are crucial skills in making good decisions. Therefore, just before embarking on the project portfolio decision journey, we examine some common decision practices in use today and plot a smoother course through the rocky shoals of such decisions.
In many cases, when making choices among alternatives, individuals and groups assign weights and scores with absolute numbers; for example, when scoring vacation spots from lowest to highest (1 to 5) you might give a Mediterranean destination 5 and a Caribbean destination 4. How are these absolute numbers different from 4.3 versus 4.8? Suppose you live in Toronto and have five vaca-tion spots in the United States in mind. You decide to rank them from first to last choice based on desired average temperature for the month you intend to take your vacation. After looking up the mean temperatures, you might rank these destinations (1) Orlando, (2) Los Angeles, (3) Denver, (4) San Francisco, and (5) Anchorage. These rankings tell you the order in which you would choose these locations based on temperature, but they do not reflect how much better Orlando is than Los Angeles. What if you have other objectives beside warmest mean temperature in July? Now the deci-sion becomes more complicated. You could have another objective of access to nature to view many species of wildlife. The objective of seeing wildlife in its natural setting would likely result in ranking the cities (1) Anchorage, (2) Denver, (3) San Francisco, (4) Los Angeles, and (5) Orlando, unless you only want to see alligators. Table 3.1 shows a typical approach taken by some groups and many busi-nesses to make a decision in a case like this.
As you can see, after averaging the rankings for the two objectives, Denver would be the selected destination and all other destinations, except San Francisco, would be considered equally acceptable for second place. Denver ranked in the middle for both objectives, not first in anything. As will be seen later, performing arithmetic operations on ordinal numbers yields meaningless results. The rankings are ordinal numbers and indicate just that, order. If graduate students line up for caps and
Sample
Cha
pter

38 Mastering Project Portfolio Management
gowns, how much more important (or smarter) is the first student in line than the tenth? Yet many organizations insist on averaging or adding rankings on multiple factors to make important business choices. In addition, we have not distinguished how much more important average high temperature might be than access to wildlife. Even if access to wildlife were twice as important as temperature, applying weights to ordinal scores also yields meaningless or invalid results.
Most business decisions involve multiple objectives, making the assignment of weights and scores difficult, arbitrary, and with no sound basis for differentiation. In addition, these assessments may involve different orders of magnitude, that is, how does one really compare the relative importance of an alternative with a weight of 0.06 to another with a weight of 60.00. Can human intelligence really differentiate items by thousandths and be consistent about these differentiations? For human beings to make complex decisions, as we discover, the complexity must be reduced by grouping the objectives and by breaking the groups into sub-groups; in other words, creating a hierarchy. Just as the deliverables of a project are decomposed into a deliverable work breakdown structure, complex decisions must be addressed by breaking them into manageable portions defined in a hierarchy. In addition, within the hierarchy, decision makers need a way to assign priorities to objectives that are mathematically meaningful when compared to other objectives at the same level so that we know, for example, that the wildlife objective is, perhaps, 2.5 times as important as the warm temperature objective; these are called ratio-scale priorities.
Many businesses, academia, government agencies, and not-for-profits expend days if not weeks of executive and management time developing strategic plans for their organizations and defining goals and objectives by which to achieve those strategies. These goals and objectives may be numer-ous and are often competing. This chapter discusses current decision making techniques and their shortcomings and introduces a rational approach for structuring and measuring such decisions—the analytic hierarchy process (AHP). It provides the means and the mathematics for decisions to be hierarchically structured, and for ratio-scale priorities to be derived to support meaningful decisions under conditions of complexity. For now, let’s take a look at some commonly used decision making approaches.
3.1 DECISION MAKING WITH B.O.G.S.A.T.A common method for making complex decisions is called BOGSAT, an acronym for a Bunch of Old Guys/Gals Sitting Around Talking that Encarta defines as “decision making by committee: the management practice of using often inexperienced committee members to make the most important decisions” (Encarta, 2009). Even experienced senior management has been known to use BOGSAT in the absence of any alternative approaches, often resulting in unproductive, tension-producing, lengthy meetings with outcomes sometimes based on the undue influence of the leader or hurried by the clock that is approaching the lunch hour or the end of the business day. BOGSAT decisions are hampered not only by fruitless discussion, but also by poor measurement techniques and poor collaboration practices.
Table 3.1 Vacation destination selection based on average ranking
Sample
Cha
pter
Introduction to Ratio-scale Measurements and the Analytic Hierarchy Process 39
A major reason for the failure of BOGSAT as a decision making technique is that, as psychologists have found, the human brain is limited in both its capacity to discriminate among only seven things, plus or minus two, and its ability to remember for the short term only seven things, plus or minus two (Miller, 1994). In other words, we can remember about seven numbers in the order read to us and can discriminate or make judgments about, for example, seven musical tones, with each sound associated with a letter or number. Most business decisions can involve dozens of elements such as “. . . issues, pros, cons, objectives, criteria . . .” (Forman, 2001, p. 6). If these complex decisions can be broken down into simpler parts and restructured in the form of hierarchies, each level of which has no more than seven—plus or minus two—elements, a more feasible and rational decision process can be used. So, we can use hierarchies to break down complex decisions into manageable pieces.
3.2 THE IMPORTANCE OF HIERARCHIES IN COMPLEX PROBLEMSHerbert Simon recognized that large organizations are structurally hierarchical; they create units that are divided into smaller and smaller units. He noted that hierarchical subdivision occurs in all complex systems, and it is how humans with limited cognitive powers can address complexity (Simon, 1960). Lancelot Whyte declared that hierarchies are “. . . the most powerful method of clas-sification used by the human brain-mind in ordering experience, observations, entities and informa-tion” (Whyte, 1969). As described later, AHP provides us with a method to structure major decisions into hierarchies of objectives and alternatives and compare them to arrive at any complex decision, including the selection of an optimal project portfolio for an organization.
3.3 COMPARISON OF WAYS TO USE NUMBERSNow that the need to decompose complex decision factors into hierarchies is understood, let’s con-sider another important aspect of decision making—the use of numerical identifiers or scores to compare alternatives. As Darrell Huff pointed out, statistics don’t lie, people do (Huff, 1993). Even if there is no intent to misuse numbers, numerical representations are not always what they seem and may be used, accidentally or purposely, to give credence to nonsense. We discuss briefly the four ways that numbers are used as levels of measurement and select one of the four as the basis for com-paring the importance of objectives and alternatives for complex decision making and, specifically, for selecting project portfolios. As identified in social science research (Sable, 1999; Trochim, 2006), the four numerical scales of measurement are nominal, ordinal, interval, and ratio. Each scale retains the properties of all the prior scales while adding some unique properties.
3.3.1 Nominal ScaleThe nominal scale uses numbers in name only, thus the term nominal. Nominal numbers are used for identification such as Region 1 as the Western Region, Region 2 as the Southern Region, and so on. Student identification numbers and zip codes are other types of nominal numbers. Performing any mathematical operations on nominal scale numbers such as adding zip codes or region numbers produces nonsense.
3.3.2 Ordinal ScaleThe ordinal scale retains the properties of the nominal scale and adds the property of ranking; the numbers indicate the order of the evaluation, whether increasing or decreasing. For example, a
Sample
Cha
pter

40 Mastering Project Portfolio Management
group of 10 employees can be ranked from 1 to 10 to indicate their perceived performance or value to the organization. However, this does not mean that the difference between the performance of the top- and second-ranked employee is the same as the difference between the eight- and ninth-ranked employee. In other words, these numbers assign rank order and can be used to sort data, but they say nothing meaningful about the size of the intervals between them. Performing mathematical op-erations on ordinal numbers also results in nonsense, or, at least, misleading information. However, think of the surveys you’ve seen that rank cities or vacation destinations on ten features, for example, and then average or add the rankings as described. The results are enthusiastically accepted because they are numeric. However, they are mathematically meaningless.
3.3.3 Interval ScaleThe interval scale retains the properties of the ordinal scale and adds the property that the intervals between numbers are meaningful. For example, the difference between 10 and 20°F is the same as the difference between 70 and 80°F. So, computing an average temperature for a location is meaning-ful. However, this does not mean that 80° is four times as hot as 20°, even though the number 80 is four times as large as the number 20. Averages make sense for interval scale numbers, for example, the average daily temperature in Los Angeles on March 1 might be 55°F because the average low on that date is 40°F and the average high is 70°F; however, ratios with interval numbers are meaningless. Arithmetic operations such as addition and subtraction, or multiplication and division, require at least interval scale meaning. Interval level numbers can be multiplied by constants or by a ratio level number, but not by another interval level number (Forman, 2001).
3.3.4 Ratio ScaleThe ratio scale retains the properties of the interval scale and adds the property that ratios are mean-ingful, for example, twice as many customers bought Pepsi as Coca Cola, and zero customers bought Dr. Pepper. Ratio scales have a fixed zero point. Numbers or units on the scale are equal over all levels of the scale. Time is a good example of a ratio scale because the difference between 3 hours and 6 hours is the same as the difference between 9 hours and 12 hours (an interval scale), and 6 hours is twice as long as 3 hours (a ratio scale). In addition, 12 hours is twice as long as 6 hours and thus four times as long as 3 hours. No restrictions are placed on the use of mathematical operations on ratio level numbers. Because of this, decision methods based on ratio scale numbers are mathemati-cally sound as well as the most flexible and accurate (Forman, 2001). The ratios can be absolute, as in the example just given of 6 hours being twice as long as 3 hours. They can also be relative, as in comparing the size of one rectangle to another in terms of area, as shown in Figure 3.1.
Box A, with a width of 3 units and a height of 3 units has an area of 9 square units, while Box B, with a width of 6 units and a height of 3 units has an area of 18 square units. So, Box B is twice as big, in relative terms, as Box A. Even if the absolute measurements are not known, relative measurement can be as accurate as, or more accurate than, absolute measurement. If the absolute height and width or other absolute measurements are not provided, people can produce accurate relative comparisons of size readily, as demonstrated by the estimates of the relative areas of five geometric shapes.
Figure 3.1 Absolute and relative size ratios
Sample
Cha
pter

Introduction to Ratio-scale Measurements and the Analytic Hierarchy Process 41
In an experiment performed by a group of 15 business graduate students at the George Washing-ton University in 2008, and repeated many times by other groups in other settings, students were asked to allocate $100.00, representing the relative size of five illustrated shapes, including a circle, a triangle, a square, a diamond, and a rectangle. The estimates were performed using comparisons of each object to the other objects by asking, for example, Circle A is _____ times larger than Triangle B, and so on, until Circle A had been compared to each of the other four objects. The process was repeated by comparing Triangle B to each of the other four objects, then Square C to each, and so on until each object had been compared in relative size to each of the other four. Comparing an object to one other object at a time is known as a pairwise comparison, and the entire process is known as performing pairwise comparisons. When the individual dollar amounts estimated by the group were averaged, the results were accurate to two decimal places and within one percent of the actual rela-tive sizes of the five objects (Forman, 2008). Further, the group result was more accurate than the estimates of any individual in the group—which is nearly always the case—indicating that multiple qualified evaluators can make more accurate decisions than individuals.
With relative measurement, it is possible to determine preferences without the need for absolute measurements such as the known sizes of the boxes. AHP uses and produces ratio-scale numbers that represent the relative importance of objectives and alternatives to the achievement of the objec-tives. This means that qualitative measurements can be made and applied in decision making along with quantitative measurements to indicate the relative importance of objectives and alternatives.
We have already stated that BOGSAT, although well practiced in terms of frequency, is not a good practice for making complex decisions because of the cognitive limitations of the human brain. For-man (2001) cited Max Bazerman (1986) on the economist’s model of rationality that assumes that decision makers follow a specific set of logical steps that require a perfectly defined problem and knowledge of all relevant information and criteria. Since humans have cognitive limitations that prevent such perfect, unaided ability to find the optimal solution, they will settle for what is suffi-cient or good enough, which Herbert Simon called satisficing (Simon, 1960). Later in this chapter, we show how using AHP, along with appropriate computer-based tools, can help decision makers reach optimal solutions in less time than a decision making process using BOGSAT can reach satisficing solutions. First, it is important to understand the concept of compensatory decision making and why it is superior to non-compensatory decision making.
3.4 COMPENSATORY AND NON-COMPENSATORY DECISION MAKINGRobin Hogarth, a distinguished researcher in the field of behavioral decision making, has catego-rized decision rules for choice into two groups:
1. Strategies that confront the conflicts inherent in the choice situation 2. Strategies that avoid the conflicts
Conflict-confronting strategies are compensatory. That is, they allow you to trade off a low value on one dimension against a high value on another. Conflict-avoiding strategies, on the other hand, are non-compensatory. That is, they do not allow trade-offs (Hogarth, 1987).
Compensatory decisions are rational decisions that require identification of the complete set of attributes that could positively or negatively affect the success of the options, assigning a relative importance to each attribute, computing a value for each option based on the model, and, finally, selecting the option with the best value. “In compensatory decisions, when the final values for at-tributes are computed, negative attributes can be compensated for by equal or higher value positive attributes. For instance, a plane ticket that costs $50 more (negative attribute) may ultimately be the
Sample
Cha
pter

42 Mastering Project Portfolio Management
better choice because it is a direct flight (positive attribute)” (Straub, 2003). Using a non-compensa-tory approach, the decision maker would not be able to consider the trade-off value of convenience against price.
Hogarth identifies the linear compensatory model as the most comprehensive strategy for making choices; however, until recently, its use has been infeasible because the complexity of the calculations and the number of alternatives to consider is beyond human cognitive abilities. Thus, people have generally made and continue to make non-compensatory decisions, taking the first adequate option, as in satisficing.
Now, however, because of AHP and software tools and available computer technology to support it, people can make compensatory personal and organizational decisions with relative ease, using not just the linear compensatory model recommended by Hogarth, but a multi-linear model because of the AHP’s ability to multiply priorities from one level to the next (Forman, 2001).
3.5 ANALYTIC HIERARCHY PROCESSDeveloped by Dr. Thomas Saaty at the Wharton School of Business in the 1970s, AHP is a concep-tual process that allows people to structure complex decisions and to incorporate both qualitative and quantitative assessments as well as intuition into the process of decision making. AHP helps people to:
• Structure complexity by organizing the various elements of a problem into a hierarchy.• Assess, via pairwise comparisons, the relative importance of the objectives and the relative
preference for the identified alternatives.• Derive priorities by combining intangible information from experience and intuition, and
tangible information such as quantitative data.• Synthesize the results of competing objectives and different points of view (Forman, 2008).
Through a series of complex mathematical calculations that are easily performed today by widely available computer software, AHP allows comparisons of objectives to establish their relative im-portance and comparisons of alternatives to establish the relative degree to which each alternative satisfies the objectives.
The use of AHP involves three basic steps (Forman, 2006):
1. Decomposition or structuring 2. Comparative judgments or measuring 3. Combining or synthesizing
The structuring or decomposition step breaks down a complex problem into hierarchies or related clusters much like a deliverable work breakdown structure is created to refine the products for a large project. The measuring or comparative judgment step compares the relative importance of each ele-ment in a cluster to each of the other elements of the cluster with respect to the parent of the cluster (Forman, 2001) to derive the local priorities of those elements.
AHP is based on four axioms:
1. Reciprocal 2. Homogeneity 3. Lack of feedback among objectives 4. Adequate representation of ideas to ensure the appropriate use of AHP
Only the first two are discussed here. For further information about the AHP axioms, refer to Thomas Saaty’s journal article on this subject (Saaty, 1986).
Sample
Cha
pter

Introduction to Ratio-scale Measurements and the Analytic Hierarchy Process 43
The reciprocal axiom requires that if a pairwise comparison of Element A to Element B is made with regard to how much more (or less) A supports the parent attribute X than B, then the reciprocal is also true. For example, if A is evaluated to be three times as important as B in supporting X, then B is 1/3 as important as A in supporting X. For example, if A is three times the size of B, then B is 1/3 the size of A. If X = 12, then B = 3 and A = 9.
The homogeneity axiom requires that elements in a cluster of the hierarchy differ by no more than one order of magnitude, otherwise large errors in judgment may occur. For example, if the elements in a cluster weigh between 1 and 10 pounds, then pairwise comparative judgments can be made with much greater accuracy than if the elements weighed between 1 pound and 1 ton. Following this axiom results in greater consistency because evaluators are less likely to make consistency errors such as A is greater than B and B is greater than C, but A is less than C.
3.6 PAIRWISE COMPARISONPairwise comparisons can be made using verbal, numeric, and graphical methods to derive ratio-scale priorities and allow the evaluator to structure decisions with limited data. These comparisons are used to derive priorities for each objective with respect to the goal, the importance of sub-objectives with respect to each of the other sub-objectives at the same level with respect to each objective, and the preference of each of the alternatives with respect to those objectives and sub-objectives. Finally, the information is synthesized and an overall best choice is indicated, with a benefit calculated for each alternative.
“Pairwise comparisons are basic to the AHP methodology. When comparing a pair of factors, a ratio of relative importance, preference or likelihood of the factors can be established. . .” (Forman, 2001, p. 62). The factors can be any two elements at the same level in a hierarchy, including objec-tives, sub-objectives, or alternatives. Interestingly, the ratio does not need to be found on a standard absolute scale such as minutes or meters, but can be based on subjective judgment, as described in the experiment on the relative sizes of five polygons. AHP synthesizes these results using mathemati-cal processes for computing eigenvectors, methods which have been subjected to testing and have proven to be extremely accurate (Forman, 2001). Thus it is possible to use both subjective and objec-tive data and observations in pairwise comparisons. We suggest that the reader consult textbooks on linear algebra for more information about the mathematics underlying AHP.
3.7 OVERVIEW OF AHP IN PROJECT PORTFOLIO MANAGEMENTThe initial step in a project portfolio decision process is to develop a top-down hierarchical evaluation structure characterized by a goal and objectives. If desired, these objectives can be further decomposed as sub-objectives. For an organization, these goals and objectives are normally identified as part of the organization’s strategic planning process as described in Chapter 2. Once the goal is established and the objectives hierarchy defined, AHP allows comparison of each objective with each other sibling objec-tive at the same level using pairwise comparisons to derive ratio-scale priorities between objectives. This establishes which objectives are considered more meaningful than others by the stakeholders as-signed to evaluate them. If sub-objectives are identified, the same pairwise comparison process is fol-lowed to derive ratio-scale priorities for the sub-objectives with respect to the parent objectives.
The next step is to identify alternatives, or projects, to be considered as part of the organization’s project portfolio. AHP allows comparison of each alternative project against each of the other alter-native projects with respect to how well that project satisfies each objective and thus can calculate ratio-scale priorities among the alternatives; these priorities provide more meaningful information
Sample
Cha
pter

44 Mastering Project Portfolio Management
than the arbitrary and often misleading traditional weighting scales and ordinal rankings. Finally, these multiple attribute priorities are synthesized (combined) to determine the optimal portfolio of projects within defined limitations such as maximum budget.
AHP is used worldwide today in thousands of organizations, including corporations, universi-ties, and governments for various complex decisions from hiring employees to evaluating mergers and acquisitions. One of the rapidly growing application areas is the selection and evaluation of the optimal portfolio of projects, the subject of this book.
3.8 INTRODUCTION TO EXPERT CHOICE SOFTWARE TOOLSMultiple software tools are available to support the AHP for structuring, measuring, and synthesizing complex decisions; any such reputable tool can be used to provide the accurate complex calculations required. We have chosen tools provided by Expert Choice. A temporary software license accompa-nies this book to allow readers to follow along with the examples. Expert Choice is a leading software and consulting organization that for more than a quarter of a century has developed software and helped improve complex decision making for business, government, educational institutions, and not-for-profit organizations. The examples in this book show the reader how to apply the PPM pro-cess step-by-step using the supplied software at appropriate stages in the process. Thus, readers learn the processes along with premium AHP-based tools that they can apply to improve PPM and other complex decision making in their respective organizations, and even in their personal lives. Expert Choice software tools employed in this book include:
• Comparion™ Suite to structure the AHP model and prioritize objectives and alternatives• Expert Choice Desktop™ with the Resource Aligner™ module for portfolio optimization• Periscope for dashboard illustration purposes only
Temporary licenses for limited versions of Comparion™ Suite and with the Resource Aligner mod-ule are provided with the purchase of a new copy of this book to enhance learning and provide you with hands-on experience in the processes described in the book. To obtain access to this software navigate to http://ppmbook.expertchoice.com. The terms of use are described and you will be asked to provide contact and login information and to verify that you are eligible to use the software. In this section we briefly introduce each of these tools. In subsequent chapters detailed step-by-step examples are provided to support the selection and optimization of the sample project portfolio.
3.8.1 Comparion™ SuiteComparion™ Suite is a web-based solution for building AHP models, conducting evaluations, and analyzing results. It enables asynchronous or synchronous real time collaboration to structure and synthesize decisions based on quantitative data and intuition for geographically dispersed or col-located teams. Like ECD, Comparion Suite allows consideration of trade-offs and what-if scenarios. Because it is web-based, Comparion is often preferred to collect evaluator input for virtual teams dispersed across geographies or time zones.
We have chosen a simple example to illustrate the use of Comparion that provides verbal and graph-ical modes of comparison. In the example we use graphical pairwise comparison mode. The goal is to select the best ice cream based on the following three objectives for a good dish of ice cream:
• Most flavor (qualitative based on participant subjective assessment)• Healthiest (quantitative based on expert nutritional assessment)• Best price (quantitative based on price per unit)
Sample
Cha
pter

Introduction to Ratio-scale Measurements and the Analytic Hierarchy Process 45
The objectives have not yet been prioritized. In addition, there are five alternatives or choices for ice cream:
• Nonfat vanilla frozen yogurt• Ultra-rich chocolate ice cream• Lowfat coffee ice cream• Melon sorbet• Coconut cream gelato
Figure 3.2 shows the objectives and the alternatives after they have been entered into Comparion.
Figure 3.2 Objectives and alternatives for selecting the best ice cream (Expert Choice Comparion)
When a participant logs in to Comparion, he is presented with a series of pairwise comparisons to provide judgments about the relative importance of the objectives. In Figure 3.3 the participant is asked to consider the goal of selecting the best ice cream and then to compare one objective to another—in this case to determine whether most flavor or healthiest is more important and how much more important. This evaluator used the slider to indicate that flavor is twice as important as healthfulness.
Figure 3.3 Pairwise comparison of “Most flavor” versus “Healthiest” objectives
When each objective has been compared to each other objective, the priorities derived from the participant’s judgments can be displayed as shown in Figure 3.4.
Sample
Cha
pter

46 Mastering Project Portfolio Management
This participant determined that flavor is about twice as important as healthfulness and about three times as important as price when selecting the best ice cream. Next, participants evaluating the five different types of frozen dessert representing the alternatives are asked to rate how well each alternative supports each of the three objectives as shown in Figure 3.5.
Figure 3.5 Participant evaluation of how well each alternative satisfies the “Most flavor” objective
As can be seen, this evaluator thinks that ultra-rich dark chocolate ice cream is more than twice as preferable as nonfat vanilla frozen yogurt. The evaluator likes the flavor of coconut cream gelato nearly as much, but doesn’t find the flavor of melon sorbet appealing when selecting ice cream. In Figure 3.6 the relative priority of the alternatives for the most flavor objective is shown.
Figure 3.6 Relative preference of alternatives with respect to “Most flavor” objective
Figure 3.4 Priorities of objectives for a participant
Sample
Cha
pter

Introduction to Ratio-scale Measurements and the Analytic Hierarchy Process 47
When all participants have completed their evaluations, the results are combined, or synthesized, to produce the overall decision results as shown in Figure 3.7. As can be seen, the relative priorities of the three objectives are most flavor at 54.97%, healthiest at 26.63%, and best price at only 18.40% in terms of relative importance to the goal. Given the combined preference for flavor over healthful-ness, and healthfulness over price, the group decision for the alternative that most meets the goal of best ice cream is the ultra-rich dark chocolate ice cream.
Figure 3.7 Synthesized results for all participants
Sensitivity analysis allows us to play what if by changing certain parameters such as the relative priorities of the objectives to see what the result would be if they were different. Figure 3.8 shows how the results change when the healthiest objective is increased to about 45%, thus reducing the relative importance of the other objectives. In this case, it would take a considerable increase in the importance of healthfulness to change the results, meaning that the decision result is not sensitive to changes in the importance of that objective.
Figure 3.8 Changing the importance of the objectives changes the decision result
Although the ice cream selection example is a simple decision, the same process can be applied to more complex personal decisions and to the most complex decisions in business, academia, govern-ment, and not-for-profit organizations by structuring the objectives hierarchy and identifying the
Sample
Cha
pter

48 Mastering Project Portfolio Management
alternatives, measuring using pairwise comparisons or other methods to remove the complexity of multiple competing factors, and synthesizing the results to be reviewed with the participants.
Comparion and tools with similar capability are essential to prioritize objectives and alterna-tives during the strategic and selection phases of the PPM process. Such tools enable structuring complexity, managing compensatory decision making, and deriving ratio-scale measures of relative importance of objectives and alternatives.
In addition to the asynchronous model building and evaluation capabilities, Comparion TeamTime™ can be used for web-based synchronous evaluation meetings and brainstorming or decision-structuring meetings at the invitation of a facilitator. Such meetings can be conducted with geographically dispersed or collocated participants or a combination of remote and local participants.
To gain an introductory understanding of Comparion Suite, go to the website link using the user name and password provided. You will see a login screen similar to the one shown in Figure 3.9.
In later chapters detailed step-by-step guidance is provided for using Comparion during relevant steps in the process.
3.8.2 Expert Choice DesktopECD is a Windows desktop-based software tool that, like Comparion Suite, models the decision-making process based on the complex mathematical calculations that are the foundation of AHP and allows for iterative development of a decision hierarchy by requiring the identification of a goal, objectives, and alternatives. Both ECD and Comparion include additional tools to perform sensitiv-ity analysis and provide graphical information that can be used to enhance communications and the human commitment to the resulting decisions. Sensitivity analysis allows the user to graphically as-sess how the preferred alternatives change with respect to changes in the importance of the objectives or sub-objectives contained in the model.
In addition to supporting structuring, measuring, and synthesizing of AHP models, ECD supports an additional module, the Resource Aligner, to enable project portfolio selection and optimization
Figure 3.9 Login screen for Comparion™ Suite
Sample
Cha
pter
Introduction to Ratio-scale Measurements and the Analytic Hierarchy Process 49
at specified budget levels and under constraints specified by the organization. With the Resource Aligner, multiple portfolio scenarios can be easily saved and compared.
Both Comparion Suite and ECD software support multiple modes for entering judgments. Each judgment compares two elements in a cluster and produces a ratio-scale result. The same objectives and alternatives, prioritized in the same way, yield the same results in either tool.
We’ll use the simple ice cream selection example from Comparion to show how the same evalua-tion screens can appear in ECD. It allows comparisons to be presented to evaluators in three modes—numerical, verbal, and graphical.
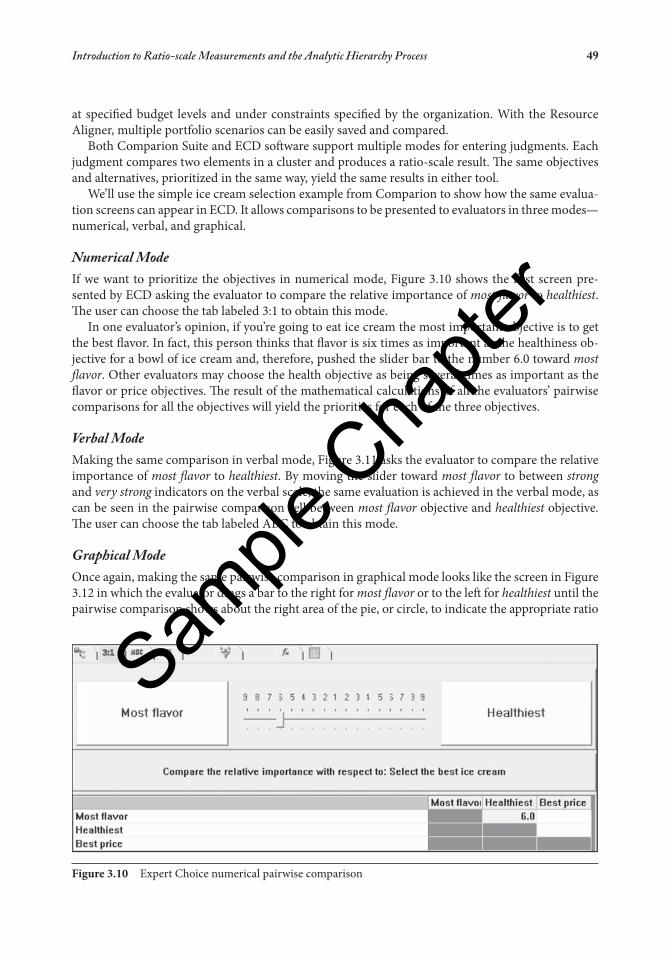
Numerical ModeIf we want to prioritize the objectives in numerical mode, Figure 3.10 shows the first screen pre-sented by ECD asking the evaluator to compare the relative importance of most flavor to healthiest. The user can choose the tab labeled 3:1 to obtain this mode.
In one evaluator’s opinion, if you’re going to eat ice cream the most important objective is to get the best flavor. In fact, this person thinks that flavor is six times as important as the healthiness ob-jective for a bowl of ice cream and, therefore, pushed the slider bar to the number 6.0 toward most flavor. Other evaluators may choose the health objective as being several times as important as the flavor or price objectives. The result of the mathematical calculations of all the evaluators’ pairwise comparisons for all the objectives will yield the priorities for each of the three objectives.
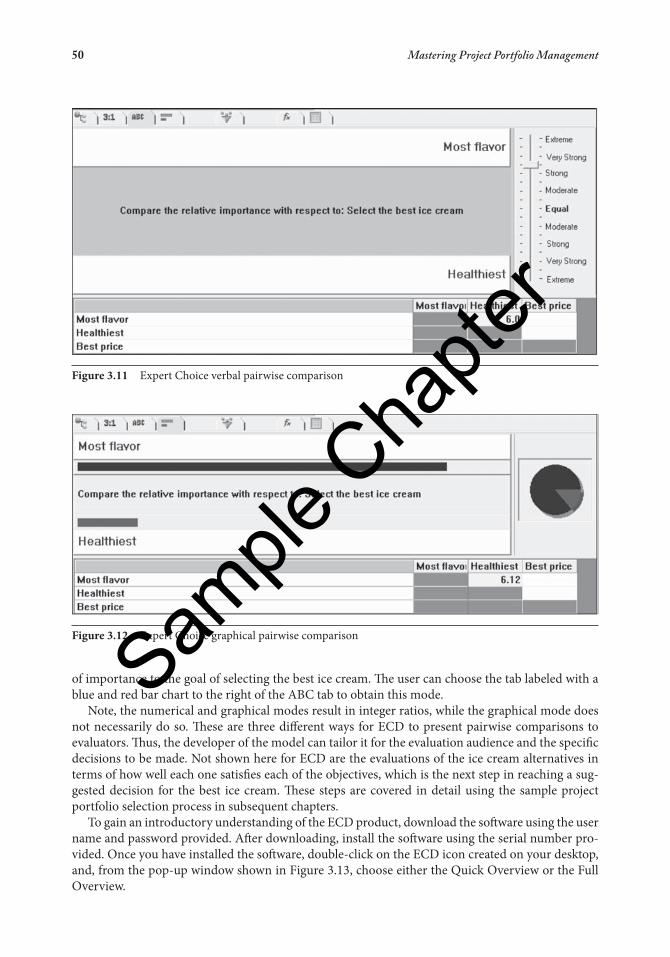
Verbal ModeMaking the same comparison in verbal mode, Figure 3.11 asks the evaluator to compare the relative importance of most flavor to healthiest. By moving the slider toward most flavor to between strong and very strong indicators on the verbal scale, the same evaluation is achieved in the verbal mode, as can be seen in the pairwise comparison cell between most flavor objective and healthiest objective. The user can choose the tab labeled ABC to obtain this mode.
Graphical ModeOnce again, making the same pairwise comparison in graphical mode looks like the screen in Figure 3.12 in which the evaluator drags a bar to the right for most flavor or to the left for healthiest until the pairwise comparison shows about the right area of the pie, or circle, to indicate the appropriate ratio
Figure 3.10 Expert Choice numerical pairwise comparison
Sample
Cha
pter
50 Mastering Project Portfolio Management
of importance to the goal of selecting the best ice cream. The user can choose the tab labeled with a blue and red bar chart to the right of the ABC tab to obtain this mode.
Note, the numerical and graphical modes result in integer ratios, while the graphical mode does not necessarily do so. These are three different ways for ECD to present pairwise comparisons to evaluators. Thus, the developer of the model can tailor it for the evaluation audience and the specific decisions to be made. Not shown here for ECD are the evaluations of the ice cream alternatives in terms of how well each one satisfies each of the objectives, which is the next step in reaching a sug-gested decision for the best ice cream. These steps are covered in detail using the sample project portfolio selection process in subsequent chapters.
To gain an introductory understanding of the ECD product, download the software using the user name and password provided. After downloading, install the software using the serial number pro-vided. Once you have installed the software, double-click on the ECD icon created on your desktop, and, from the pop-up window shown in Figure 3.13, choose either the Quick Overview or the Full Overview.
Figure 3.11 Expert Choice verbal pairwise comparison
Figure 3.12 Expert Choice graphical pairwise comparison
Sample
Cha
pter

Introduction to Ratio-scale Measurements and the Analytic Hierarchy Process 51
Depending on the version, you may see the word Desktop after Expert Choice at the top of the screen, instead of the version number 11.5. After you have seen the overviews, you may wish to check the Don’t show this screen again box at the lower left (to avoid seeing this screen again) and go straight to Start Using Expert Choice. If you wish to see the Quick Start Guide or Tutorials after you have disabled the initial window, simply select the Help menu, and choose the Quick Start Guide or Tutorials option.
Both Comparion Suite and ECD provide audit trails showing how each decision was reached. These are essential to the process of reviewing the integrity of decisions and for explaining the reasons for them to others. Both tools also support sensitivity analysis and allow iteration as necessary. Either tool can be used to structure a decision, to measure and collect evaluator input, and to synthesize results. ECD contains enhanced capabilities for interfacing with other software such as Oracle, Excel, and MS Project, and additional options for risks, constraints, and portfolio optimization. Models can be easily exchanged between the two software programs through uploading and downloading. At present, to implement risks, constraints, and portfolio optimization, the Resource Aligner module of ECD is required. Any synthesized Comparion model can be downloaded to a desktop computer with the appropriate software module for this purpose. Eventually, Expert Choice plans to deliver the capabilities of its Resource Aligner via enhancements to Comparion. Although examples of use are provided for both Comparion and ECD, readers with access to the internet are encouraged to use Comparion for structuring the model and prioritizing the objectives and alternatives.
3.8.3 PeriscopePeriscope is a sample dashboard tool that supports progress reporting and management of project portfolios. Data from ECD or Comparion can be imported into Periscope to develop a periodic portfolio performance report card. A dashboard uses project status data to create a visual display of
Figure 3.13 Expert Choice start-up window
Sample
Cha
pter

52 Mastering Project Portfolio Management
project and portfolio progress at a point in time, or across time periods, with drill-down from the portfolio to the project level. As you will see during the implementation and evaluation phases of the PPM process, such a tool can help decision makers determine where action is needed to adjust the portfolio. The results produced by Periscope reflect the evaluated potential strategic benefits of the selected project alternatives. For this book, Periscope is used only to illustrate performance dash-boards in the final chapters and is not available for download.
3.9 SUMMARYThis chapter has described decision making techniques and the benefits of ratio-scale measurements to provide background for understanding complex decisions and factors necessary for making them accurate. It has also introduced AHP as a leading process for structuring decisions, synthesizing re-sults, and making trade-offs that result in optimal decisions for people and organizations. The tools needed to manage the complex calculations underlying AHP were introduced in the form of soft-ware from Expert Choice, through which the implementation steps in this textbook are illustrated. Instructions were provided for the reader to obtain access to limited versions of the software tools along with the purchase of a new book.
Subsequent chapters address the PPM process using the five-phase approach described in Chap-ter 1. We show how to establish, implement, and maintain the process in an organization through the use of a sample portfolio of projects. The sample portfolio candidates represent projects from the fic-titious university—American Business University—introduced in Chapter 2 and is used to provide step-by-step guidance in applying the supporting tools and techniques. In Chapter 4 the objectives hierarchy is established and the objectives defined during strategic planning are prioritized using AHP and Comparion Suite as the final step in the strategic phase of PPM.
3.10 REFERENCESEncarta® World English Dictionary (North American Edition) (2009). Microsoft Corporation. http://encarta
.msn.com/dictionary_561532773/BOGSAT.html (retrieved January 30, 2010).Forman, E. H. and M. A. Selly (2001). Decision by Objectives. River Edge, NJ: World Scientific. (Reproduced
with permission from World Scientific.)Forman, E. H. (2008). “Project Prioritization and Portfolio Management,” Lecture 3 (PowerPoint). George
Washington University, Washington, D.C.Hogarth, Robin (1987). Judgment and Choice. New York, NY: John Wiley & Sons, 72.Huff, Darrell and Irving Geis (1993). How to Lie with Statistics. New York, NY: W. W. Norton.Introduction to Measurement Scales and Data Types (1999). Sable. http://simon.cs.vt.edu/SoSci/converted/
Measurement/activity.html (retrieved January 23, 2010).Lee, Lorraine and Rita Anderson (2009). “A Comparison of Compensatory and Non-Compensatory Decision
Making Strategies in IT Project Portfolio Management.” International Research Workshop on IT Project Management 2009. Paper 9. http://aisel.aisnet.org/irwitpm2009/9 (retrieved February 1, 2010).
Miller, G. A. (1994). “The Magical Number Seven, Plus or Minus Two: Some Limits on Our Capacity for Pro-cessing Information.” Psychological Review, 101:2, 343-352.
Saaty, Thomas L. (1986). “Axiomatic Foundation of the Analytic Hierarchy Process.” Management Science, 32:7 (July), 841-855.
Simon, Herbert A. (1960). The New Science of Management Decision. New York, NY: Harper and Brothers.Straub, K. and C. Gaddy (2003). “Decisions, Decisions . . . What’s a Poor User (and Designer) To Do?” Human Fac-
tors International. http://www.humanfactors.com/downloads/oct03.asp (retrieved February 1, 2010).Trochim, William M. (2006). “The Research Methods Knowledge Base,” 2nd ed. http://www.socialresearch-
methods.net/kb/ (version current as of October 10, 2006).Whyte, L. L. (1969). Hierarchical Structures, New York, NY: American Elsevier.
Sample
Cha
pter