chapter rh assessment hierarchy and initial ... assessment hierarchy and initial province ranking...
TRANSCRIPT
Chapter RH
ASSESSMENT HIERARCHY AND INITIAL PROVINCERANKING
By T. R. Klett, James W. Schmoker, and Thomas S. Ahlbrandt
in U.S. Geological Survey Digital Data Series 60
U.S. Geological Survey
RH-ii
Table of Contents
ASSESSMENT HIERARCHY AND INITIAL PROVINCE RANKING ........RH-1
Regions ...............................................................................................RH-2
Geologic Provinces...............................................................................RH-2
Total Petroleum Systems.......................................................................RH-3
Assessment Units..................................................................................RH-4
INITIAL PROVINCE RANKING ............................................................RH-4
Database and Allocation of Petroleum Resources to Geologic Provinces.....RH-6
Relationship of Ranking to Undiscovered Resources.................................RH-7
SUMMARY............................................................................................RH-8
REFERENCES.......................................................................................RH-9
Tables
Table RH-1. Initial ranking of world geologic provinces that contain oil and gas
by total known petroleum volumes.
Figures
Figure RH-1. Geologic provinces of the world.
Figure RH-2. Cumulative percent of world total known petroleum volume by the
100 top-ranked geologic provinces (exclusive of the U.S.).
Figure RH-3. Histogram showing volumes of total known petroleum by the 100
top-ranked geologic provinces (exclusive of the U.S.).
RH-1
ASSESSMENT HIERARCHY AND INITIAL PROVINCERANKING
For the U.S. Geological Survey’s World Petroleum Assessment 2000 project, the
world was divided into a hierarchical series of geographic and geologic units in
order to organize, evaluate, and delineate assessment areas. These units are
regions, geologic provinces, total petroleum systems, and assessment units.
Regions serve as organizational units and geologic provinces are used as
prioritization tools. Regions and geologic provinces are not used as fundamental
assessment entities in the formal assessment procedure, although results are
aggregated at these scales.
The total petroleum system (TPS) and assessment unit (AU) are the geologic
entities for which assessments of undiscovered oil and gas volumes were made.
These are delineated within each of the geologic provinces that are considered for
assessment. The boundaries of TPS's and AU's need not be entirely contained
within a single geologic province because petroleum may migrate across
geologic-province boundaries.
A numeric code identifies each region, geologic province, TPS, and AU. These
codes are used consistently throughout this assessment project and serve to
identify a specific unit in any of the related publications. The code is as follows:
Region, single digit 3
Geologic Province, three digits to the right of region code 3162
Total Petroleum System, two digits to the right of province code 316205
Assessment Unit, two digits to the right of total petroleum system code 31620504
RH-2
Regions
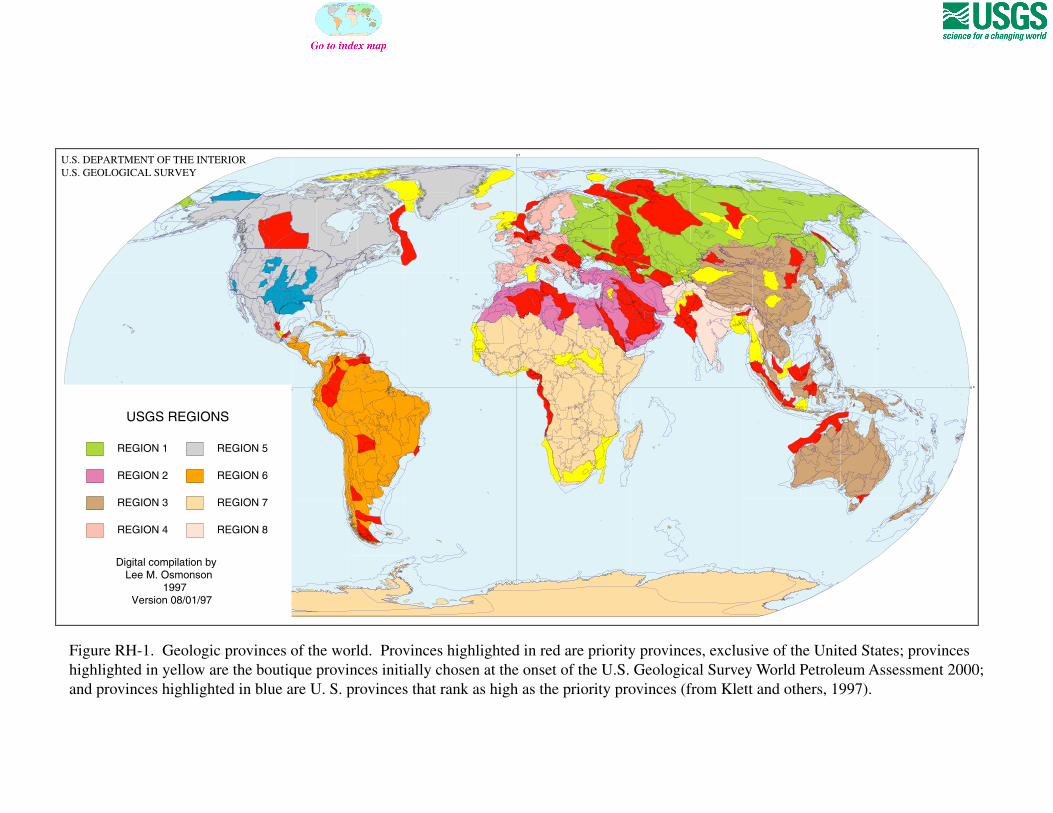
For assessment purposes, the world's land areas were divided into eight regions
(fig. RH-1) that approximate those used by the U.S. State Department and the U.S.
Department of Energy. Each of the following regions was assigned a coordinator
and staff responsible for assessment: 1, Former Soviet Union; 2, Middle East and
North Africa; 3, Asia Pacific; 4, Europe; 5, North America; 6, Central and South
America; 7, Sub-Saharan Africa and Antarctica; and 8, South Asia (fig. RH-1).
Geologic Provinces
Geologic provinces were defined by the USGS to encompass all the world's major
land areas and adjoining water to depths of at least 2,000 m. Each geologic
province is an area having characteristic dimensions of perhaps hundreds to
thousands of kilometers encompassing a natural geologic entity (for example,
sedimentary basin, thrust belt, delta) or some combination of contiguous geologic
entities. Province boundaries were drawn along natural geologic boundaries,
although in the open oceans, they are sometimes located at an arbitrary water
depth.
Geologic provinces were defined from geologic maps and available published
literature. Digital maps were then compiled from this information. Geologic
provinces of the United States were established in the 1995-1996 U.S. Department
of the Interior National Oil and Gas Assessment (Gautier and others, 1995; Lore
and others, 1996).
Worldwide, 937 geologic provinces were identified. Figure RH-1 shows the
geologic-province outlines for each of the eight regions. A four-digit numeric
code, in which the first digit represents the region, and a descriptive name were
given to each. Table RH-1 lists the geologic provinces that contain discovered
RH-3
petroleum (406 geologic provinces) in addition to 5 geologic provinces that are
considered petroliferous although no discoveries have yet been made.
Total Petroleum Systems
The TPS is a mappable entity encompassing genetically related petroleum that
occurs in seeps, shows, and accumulations (discovered or undiscovered) that have
been generated by a pod or by closely related pods of mature source rock. In
addition, the TPS contains the essential mappable geologic elements (source,
reservoir, seal, and overburden rocks) that controlled fundamental processes of
generation, migration, entrapment, and preservation of petroleum. Particular
emphasis is placed on the similarities of the fluids of accumulations within TPS’s,
unlike geologic provinces in which similarities of the rocks are emphasized.
Total petroleum systems were delineated using information and data found in the
literature, proprietary databases, and personal communication with petroleum-
industry representatives. A composite TPS, a mappable entity encompassing all
or a portion of two or more TPS’s, was defined to facilitate petroleum-resource
assessment, in cases where fields within an AU were thought to be charged by
more than one source rock.
The TPS was chosen as the foundation for petroleum-resource assessments for the
following reasons, (1) the TPS offers a practical approach that standardizes and
focuses the gathering and communication of relevant geologic knowledge; (2) it is
an element based on geology and geochemistry that can be scientifically tested;
(3) petroleum geologists are generally familiar with the criteria used to identify
and map TPS’s; (4) new information that improves the understanding of the TPS
can be incorporated into an assessment; and (5) because a TPS accounts for all
hydrocarbons (discovered and undiscovered) that emanate from a single pod or
RH-4
closely related pods of mature source rock it is a naturally occurring, fluid-based
element on which to base an assessment.
Assessment Units
An AU is a mappable volume of rock within a TPS that encompasses fields
(discovered and undiscovered) which share similar geologic traits and socio-
economic factors (such as current political and economic environments, onshore
or offshore, infrastructure, administrative boundaries, and so on). The fields
within an AU should constitute a sufficiently homogeneous population so that the
chosen methodology of resource assessment is applicable. A TPS might equate to
a single AU, but can be subdivided into two or more AU's if necessary in order
that each AU is sufficiently homogeneous to assess individually. However, every
geologic or socio-economic heterogeneity within a TPS cannot be separated into
an individual AU. Assessment units commonly contain inherent heterogeneities
and, because of lack of data, there may be a need to generalize. In such cases,
petroleum-accumulation density and exploration concepts are not extrapolated
across the entire AU.
Assessment units are the basic entity for which the input data form was completed
(Chapter AM) and for which sizes and number of undiscovered fields were
forecast. They also serve as the basic entity for which assessment results were
calculated.
INITIAL PROVINCE RANKING
The primary geologic provinces to be examined for assessment were selected by
ranking the 937 identified geologic provinces in terms of total known petroleum
volumes (as billion barrels of oil equivalent or BBOE) and selecting those that
contain the greatest volumes. Of the 937 identified geologic provinces, 354
RH-5
provinces outside of the U.S. and 52 within the U.S. contain known petroleum
volumes (table RH-1).
Known petroleum volume is defined as cumulative production plus remaining
reserves. Natural gas is accommodated in this definition by the term “barrels of
oil equivalent” (BOE), where 6,000 ft3 of natural gas (CFG) equals 1 BOE. Total
known petroleum volume is the sum of the volumes of oil, in barrels; natural gas
(combined non-associated gas and associated-dissolved gas), in terms of its energy
equivalent in barrels of oil; and natural gas liquids (NGL), in barrels. The
following material was drawn from Klett and others (1997).
Geologic provinces were ranked in two ways, one including U.S. provinces and
the other without U.S. provinces. The World Petroleum Assessment 2000 is
exclusive of the U.S. The U.S. was previously assessed and the estimated
resources published in 1995 (Gautier and others, 1995; Lore and others, 1996).
The ranking and the percent of the world's volume of total known petroleum
volume for each petroliferous geologic province are shown in table RH-1. The
relative rank of 52 U.S. provinces are also shown in table RH-1. Figure RH-2
shows percent cumulative total known petroleum volume as a function of
province rank for geologic provinces exclusive of the U.S. Figure RH-3 shows
the volumes of total known petroleum in the 100 top-ranked geologic provinces
exclusive of the U.S.
Those geologic provinces that together represent 95 percent of the world's total
known petroleum volume exclusive of the U.S., are here called priority
provinces, and comprise a group of 76 provinces that were analyzed for the
World Petroleum Assessment 2000. Initially, an additional 26 geologic provinces
were chosen to be considered for assessment analysis for a variety of geologic,
RH-6
political, technical, or geographic reasons and are identified as boutique
provinces. Figure RH-1 highlights the locations of the initially defined priority
and boutique provinces.
Boutique provinces rank below the priority provinces in terms of total known
petroleum (table RH-1). Most of the boutique provinces contain some known
volume of petroleum. During the course of the assessment process, some of the
initially chosen boutique provinces (listed in table RH-1) were not analyzed, but
others were added (especially in South America).
Database and Allocation of Petroleum Resources to GeologicProvinces
About 32,000 fields contained in three oil and gas production databases purchased
by the USGS (Petroconsultants, 1996; NRG Associates, Inc., 1995a, 1995b) were
allocated to world regions and then to geologic provinces. This allocation was
based on the location of the field's center point using geographic information
systems (GIS) applications. All subsequent statistics rely on data contained in
these databases.
Field data for United States onshore areas and State waters are from the
Significant Oil and Gas Fields of the United States database (NRG Associates,
Inc., 1995a) and are current through 1992. Canadian field data are from the
Significant Oil and Gas Pools of Canada database (NRG Associates, 1995b)
and are current through 1993. All other field data are from the Petroleum
Exploration and Production Database (Petroconsultants, 1996) and are current
through 1995. Province-level data for U.S. Federal offshore areas are from
Minerals Management Service (Lore and others, 1996) and are current through
1994.
RH-7
Relationship of Ranking to Undiscovered Resources
The world geologic-province ranking of table RH-1 provided a quantitative
rationale for selecting provinces for the assessment of potential undiscovered
petroleum resources. For depicting the relative potential for new-field
discoveries, however, a ranking scheme that includes estimates of undiscovered
resources is provided in the data analysis chapter (AR).
Use of total known petroleum volume as a basis for ranking geologic provinces
has at least two advantages: (1) provinces that have contributed greatly to the
world’s energy supply, and have thus been of direct or indirect significance to
United States economic security, emerge as high priority; and (2) mature
provinces where undiscovered resources are close to well-developed
infrastructure, and where marginal costs will be low, tend to be ranked relatively
high.
Most petroleum endowment occurs in a small number of geologic provinces (figs.
RH-2 and RH-3). The bulk of the undiscovered petroleum resources also is most
likely to occur in these same provinces. Stated overly simply, the ranking of
geologic provinces according to total known petroleum volume embodies the idea
that “acorns are found near oak trees.” Some boutique-province designations
focus attention on those frontier areas where the existence of a substantial
petroleum endowment is suspected but not yet established in the form of total
known petroleum volume. Others focus attention on areas that might be of
particular political, economic, or strategic significance to the United States.
RH-8
The world province ranking of table RH-1 is based on currently known
petroleum volumes--volumes that have not been adjusted for future reserve
growth. The possibilities for changes in relative ranking that might be caused by
different reserve-growth rates among geologic provinces are mitigated somewhat
because many of the world’s large fields were discovered more than two decades
ago and have already experienced significant reserve growth.
An alternative ranking system might be based on remaining reserves rather than
known petroleum volumes. Such a ranking system would lower the relative
ranking of mature geologic provinces that have large cumulative production.
However, the problem of inadequately ranking relatively unexplored geologic
provinces in which most or all of the petroleum resource is undiscovered would
still not be solved. In such geologic provinces, little oil or gas has been produced
to date, and total known petroleum volume essentially equals remaining reserves.
SUMMARY
A hierarchical series of geographic and geologic units was derived in order to
guide the U.S. Geological Survey World Petroleum Assessment 2000. The
ranking of geologic provinces served to direct the assessment to those areas of the
world that have the highest potential for petroleum resources. Total petroleum
systems and assessment units provide a geologic basis on which to conduct the
assessment.
RH-9
REFERENCES
Gautier, D.L., Dolton, G.L., Takahashi, K.I., and Varnes, K.L., eds., 1995, 1995
National assessment of United States oil and gas resources--Results,
methodology, and supporting data: U.S. Geological Survey Digital Data
Series DDS-30.
Klett, T.R., Ahlbrandt, T.S., Schmoker, J.W., and Dolton, G.L., 1997, Ranking
of the world's oil and gas provinces by known petroleum volumes: U. S.
Geological Survey Open-File Report 97-463, CD-ROM.
Lore, G.L., Brooke, J.P., Cooke, D.W., Klazynski, R.J., Olson, D.L., and Ross,
K.M., 1996, Summary of the 1995 assessment of conventionally
recoverable hydrocarbon resources of the Gulf of Mexico and Atlantic
Outer Continental Shelf: Minerals Management Service OCS Report MMS
96-0047, 67 p.
NRG Associates, 1995a, The significant oil and gas fields of the United
States database: Colorado Springs, Colo., NRG Associates, Inc.; database
available from NRG Associates, Inc., P.O. Box 1655, Colorado Springs,
CO 80901 USA.
NRG Associates, 1995b, The significant oil and gas pools of Canada data
base: Colorado Springs, Colo., NRG Associates, Inc.; database available
from NRG Associates, Inc., P.O. Box 1655, Colorado Springs, CO 80901
USA.
Petroconsultants, 1996, Petroleum exploration and production database: Houston,
Texas, Petroconsultants, Inc.; database available from Petroconsultants,
Inc., P.O. Box 740619, Houston, TX 77274-0619 USA.
RH-10
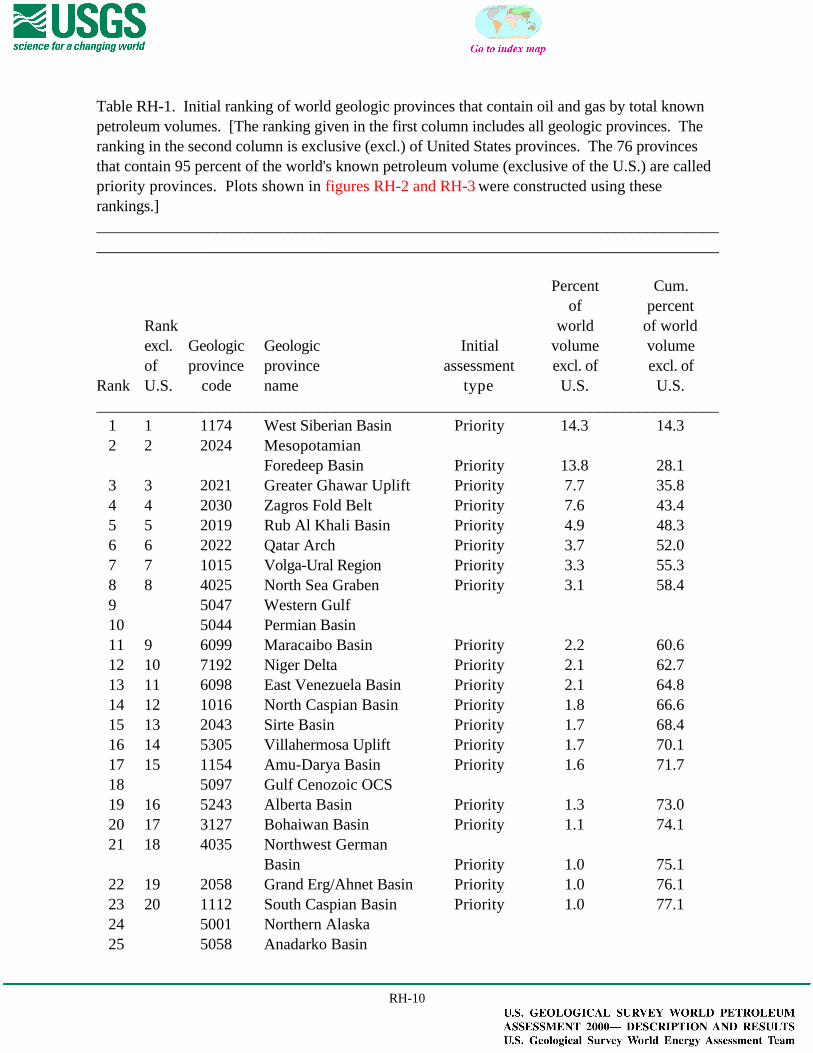
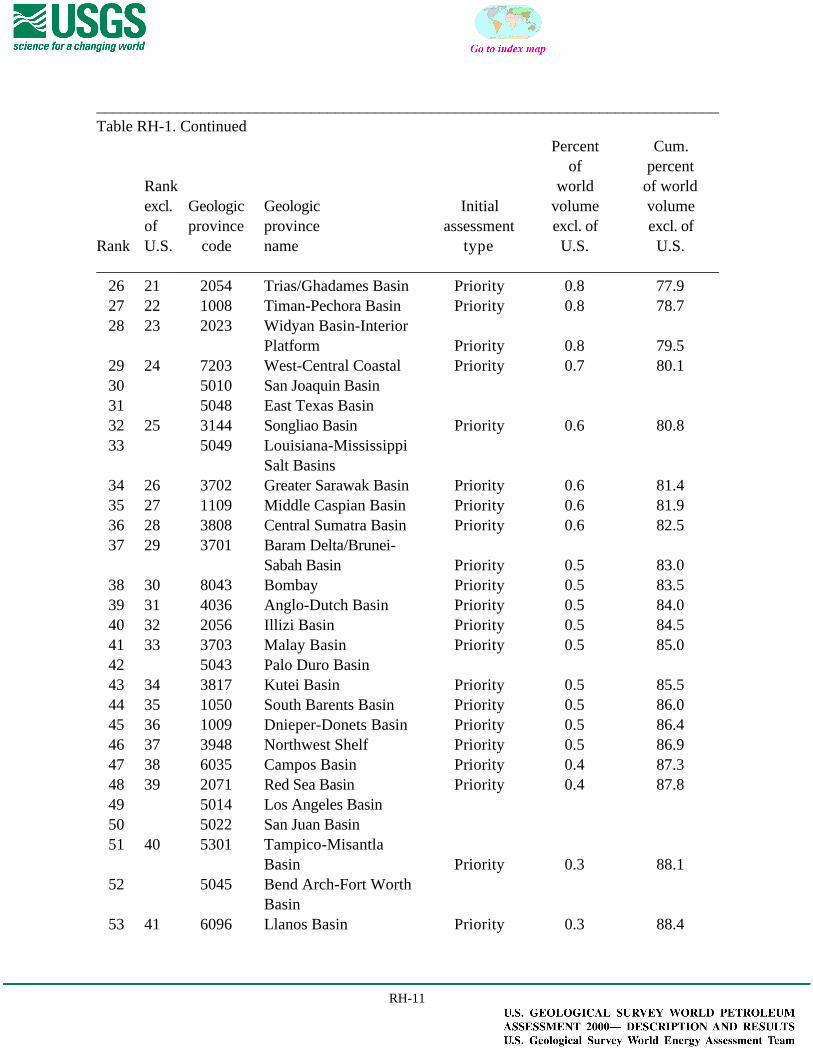
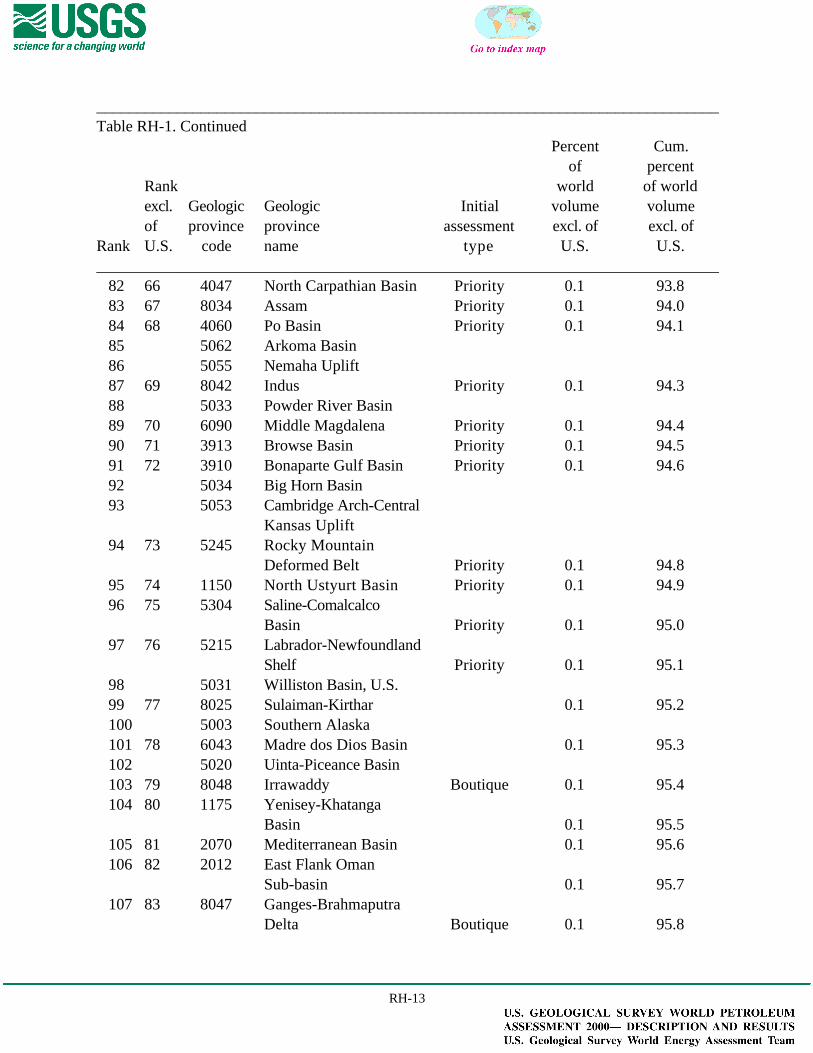
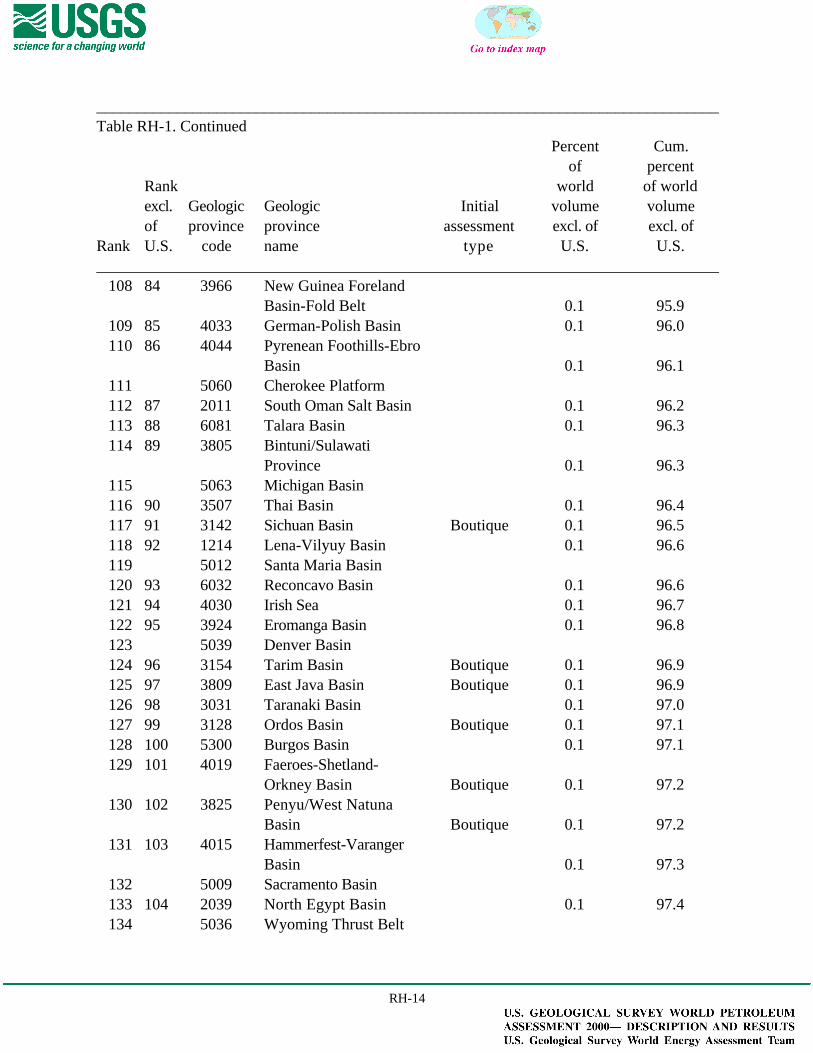
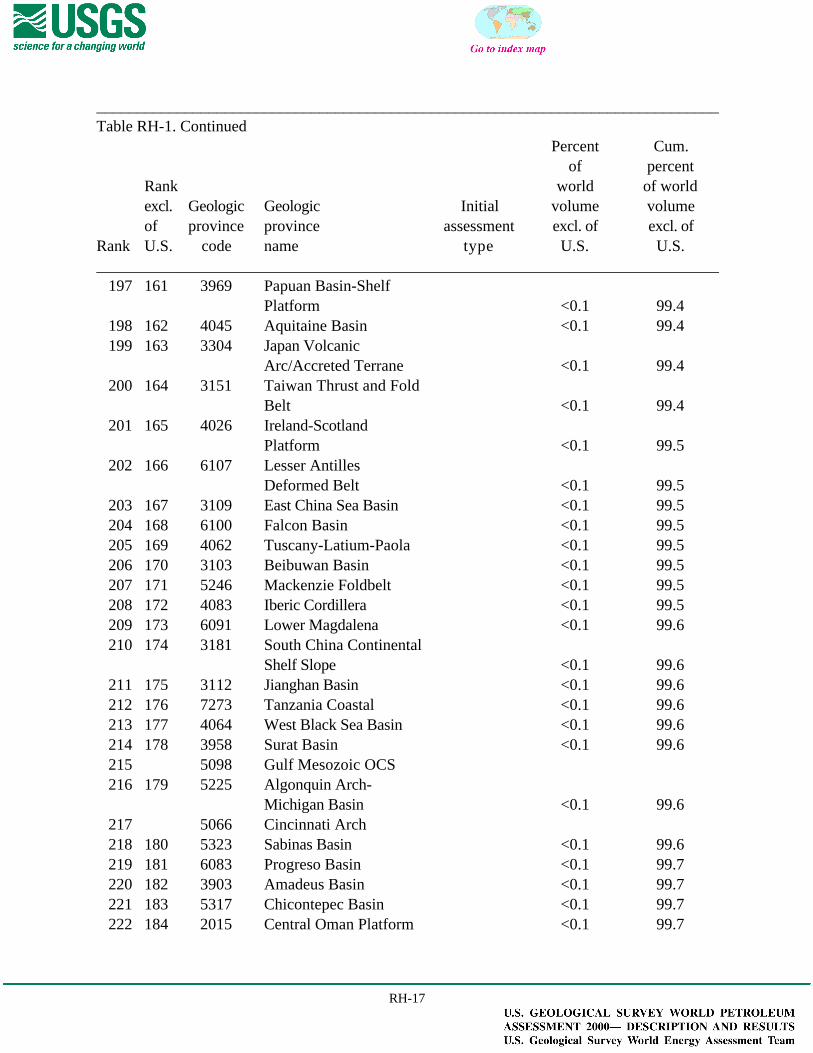
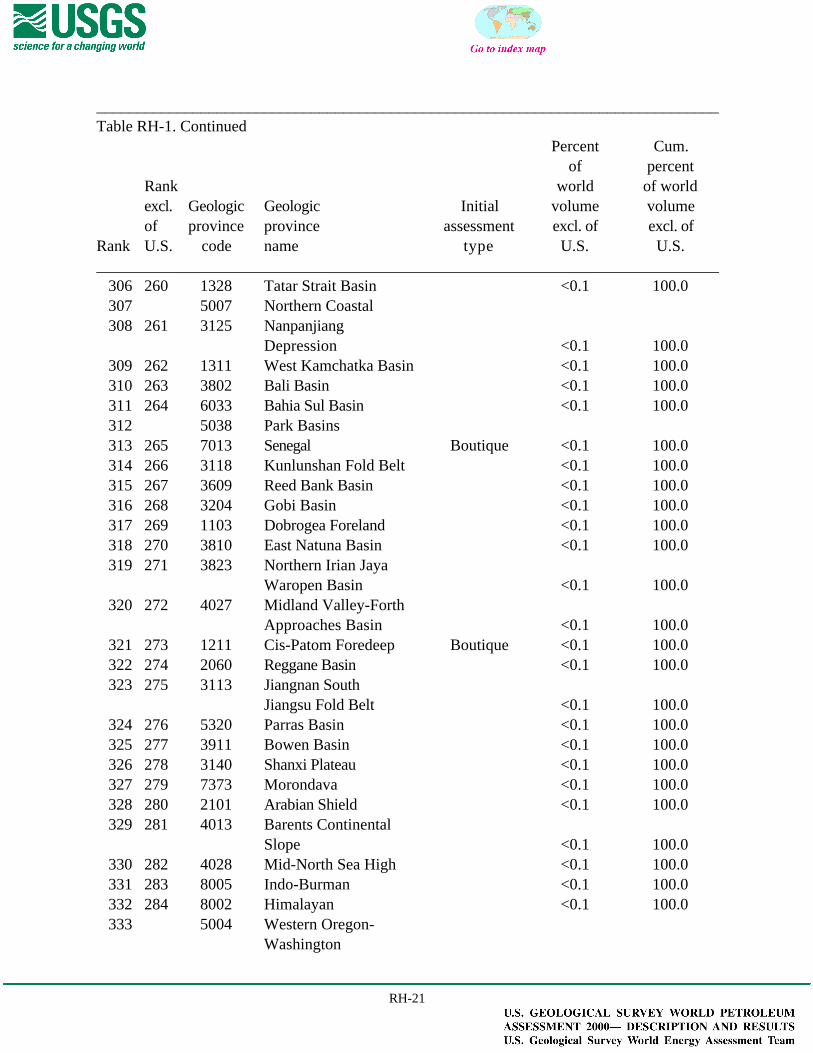
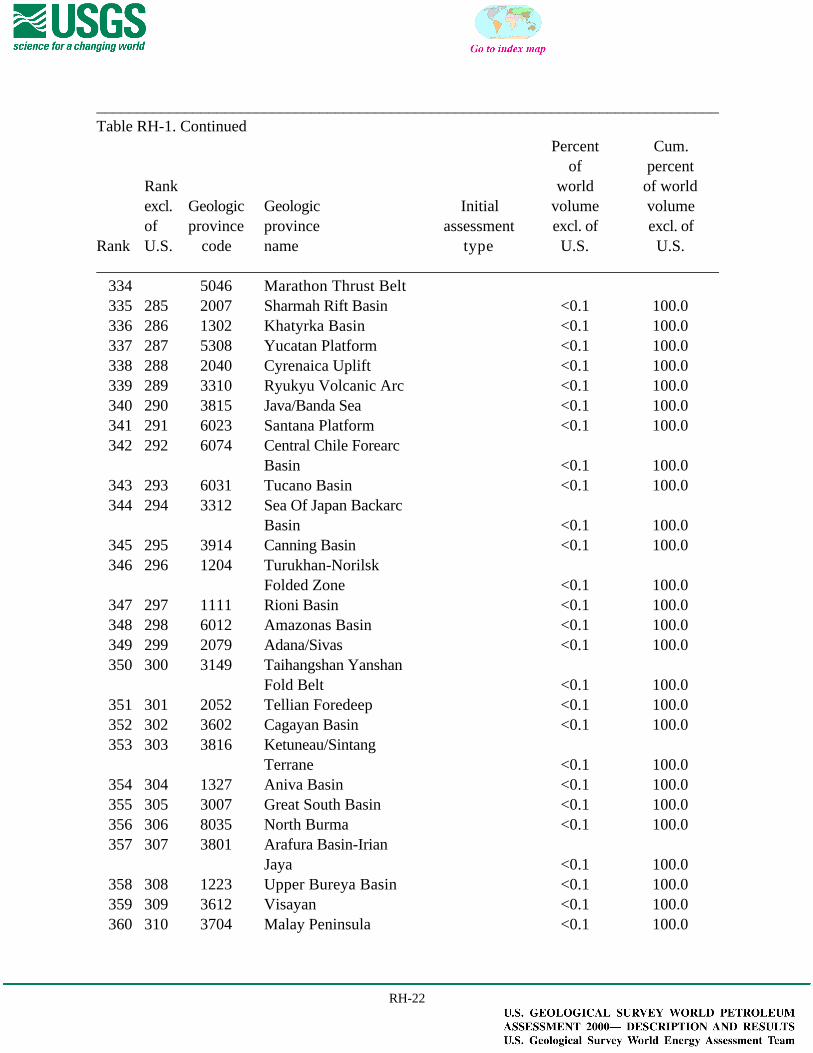
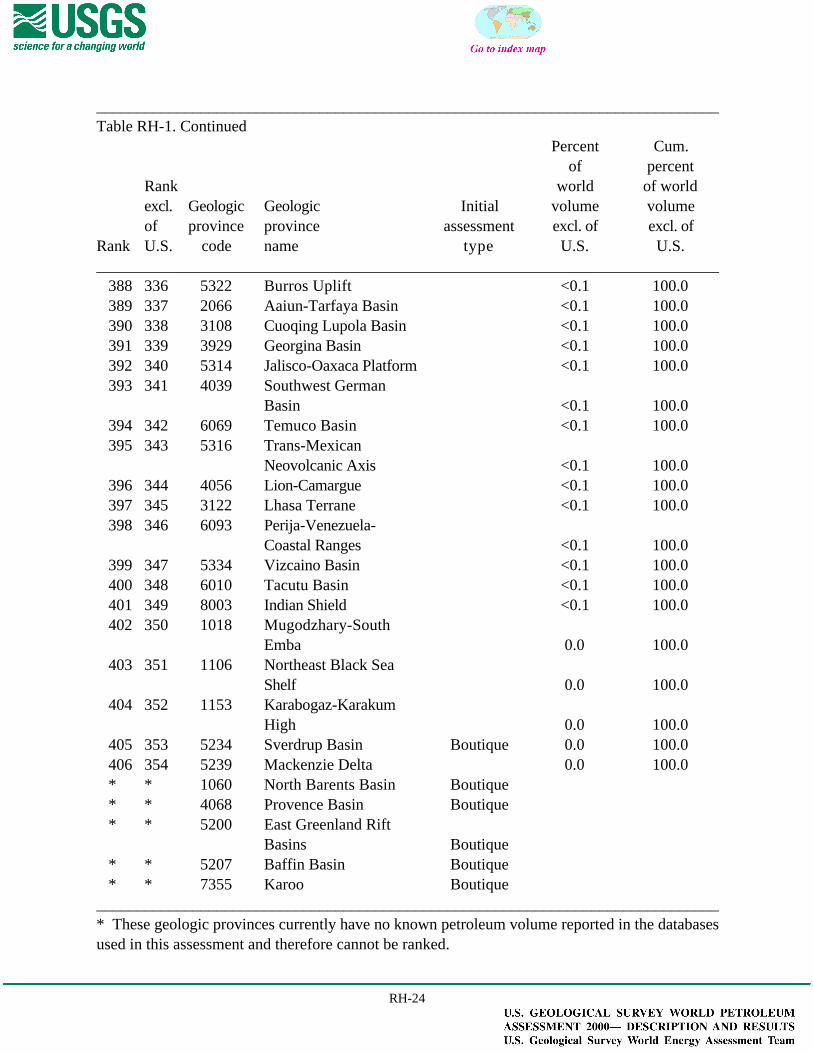
Table RH-1. Initial ranking of world geologic provinces that contain oil and gas by total knownpetroleum volumes. [The ranking given in the first column includes all geologic provinces. Theranking in the second column is exclusive (excl.) of United States provinces. The 76 provincesthat contain 95 percent of the world's known petroleum volume (exclusive of the U.S.) are calledpriority provinces. Plots shown in figures RH-2 and RH-3 were constructed using theserankings.]____________________________________________________________________________________________________________________________________________________________
Percent Cum.of percent
Rank world of worldexcl. Geologic Geologic Initial volume volumeof province province assessment excl. of excl. of
Rank U.S. code name type U.S. U.S.______________________________________________________________________________
1 1 1174 West Siberian Basin Priority 14.3 14.32 2 2024 Mesopotamian
Foredeep Basin Priority 13.8 28.13 3 2021 Greater Ghawar Uplift Priority 7.7 35.84 4 2030 Zagros Fold Belt Priority 7.6 43.45 5 2019 Rub Al Khali Basin Priority 4.9 48.36 6 2022 Qatar Arch Priority 3.7 52.07 7 1015 Volga-Ural Region Priority 3.3 55.38 8 4025 North Sea Graben Priority 3.1 58.49 5047 Western Gulf10 5044 Permian Basin11 9 6099 Maracaibo Basin Priority 2.2 60.612 10 7192 Niger Delta Priority 2.1 62.713 11 6098 East Venezuela Basin Priority 2.1 64.814 12 1016 North Caspian Basin Priority 1.8 66.615 13 2043 Sirte Basin Priority 1.7 68.416 14 5305 Villahermosa Uplift Priority 1.7 70.117 15 1154 Amu-Darya Basin Priority 1.6 71.718 5097 Gulf Cenozoic OCS19 16 5243 Alberta Basin Priority 1.3 73.020 17 3127 Bohaiwan Basin Priority 1.1 74.121 18 4035 Northwest German
Basin Priority 1.0 75.122 19 2058 Grand Erg/Ahnet Basin Priority 1.0 76.123 20 1112 South Caspian Basin Priority 1.0 77.124 5001 Northern Alaska25 5058 Anadarko Basin
RH-11
______________________________________________________________________________Table RH-1. Continued
Percent Cum.of percent
Rank world of worldexcl. Geologic Geologic Initial volume volumeof province province assessment excl. of excl. of
Rank U.S. code name type U.S. U.S.______________________________________________________________________________
26 21 2054 Trias/Ghadames Basin Priority 0.8 77.927 22 1008 Timan-Pechora Basin Priority 0.8 78.728 23 2023 Widyan Basin-Interior
Platform Priority 0.8 79.529 24 7203 West-Central Coastal Priority 0.7 80.130 5010 San Joaquin Basin31 5048 East Texas Basin32 25 3144 Songliao Basin Priority 0.6 80.833 5049 Louisiana-Mississippi
Salt Basins34 26 3702 Greater Sarawak Basin Priority 0.6 81.435 27 1109 Middle Caspian Basin Priority 0.6 81.936 28 3808 Central Sumatra Basin Priority 0.6 82.537 29 3701 Baram Delta/Brunei-
Sabah Basin Priority 0.5 83.038 30 8043 Bombay Priority 0.5 83.539 31 4036 Anglo-Dutch Basin Priority 0.5 84.040 32 2056 Illizi Basin Priority 0.5 84.541 33 3703 Malay Basin Priority 0.5 85.042 5043 Palo Duro Basin43 34 3817 Kutei Basin Priority 0.5 85.544 35 1050 South Barents Basin Priority 0.5 86.045 36 1009 Dnieper-Donets Basin Priority 0.5 86.446 37 3948 Northwest Shelf Priority 0.5 86.947 38 6035 Campos Basin Priority 0.4 87.348 39 2071 Red Sea Basin Priority 0.4 87.849 5014 Los Angeles Basin50 5022 San Juan Basin51 40 5301 Tampico-Misantla
Basin Priority 0.3 88.152 5045 Bend Arch-Fort Worth
Basin53 41 6096 Llanos Basin Priority 0.3 88.4

RH-12
______________________________________________________________________________Table RH-1. Continued
Percent Cum.of percent
Rank world of worldexcl. Geologic Geologic Initial volume volumeof province province assessment excl. of excl. of
Rank U.S. code name type U.S. U.S.______________________________________________________________________________
54 42 4061 Carpathian-BalkanianBasin Priority 0.3 88.7
55 43 3115 Junggar Basin Priority 0.3 89.056 44 6041 Putumayo-Oriente-
Maranon Basin Priority 0.3 89.257 45 2020 Interior Homocline-
Central Arch Priority 0.3 89.558 46 5244 Williston Basin,
Canada Priority 0.3 89.859 47 2016 Fahud Salt Basin Priority 0.3 90.060 48 3930 Gippsland Basin Priority 0.2 90.361 49 6055 Neuquen Basin Priority 0.2 90.562 50 1322 North Sakhalin Basin Priority 0.2 90.863 51 1210 Nepa-Botuoba Arch Priority 0.2 91.064 52 4017 Vestford-Helgeland Priority 0.2 91.365 53 3822 North Sumatra Basin Priority 0.2 91.566 54 6059 Magallanes Basin Priority 0.2 91.767 55 2048 Pelagian Basin Priority 0.2 91.968 56 4057 Transylvanian Basin Priority 0.2 92.169 57 2014 Ghaba Salt Basin Priority 0.2 92.370 58 3824 Northwest Java Basin Priority 0.2 92.571 59 4048 Pannonian Basin Priority 0.2 92.772 5013 Ventura Basin73 60 3828 South Sumatra Basin Priority 0.2 92.974 61 2004 Ma 'Rib-Al Jawf/Masila
Basin Priority 0.2 93.175 62 6045 Santa Cruz-Tarija Basin Priority 0.2 93.276 63 6058 San Jorge Basin Priority 0.2 93.477 5037 Southwestern Wyoming78 5064 Illinois Basin79 64 6103 Tobago Trough Priority 0.2 93.580 5061 Southern Oklahoma81 65 1108 Azov-Kuban Basin Priority 0.1 93.7
RH-13
______________________________________________________________________________Table RH-1. Continued
Percent Cum.of percent
Rank world of worldexcl. Geologic Geologic Initial volume volumeof province province assessment excl. of excl. of
Rank U.S. code name type U.S. U.S.______________________________________________________________________________
82 66 4047 North Carpathian Basin Priority 0.1 93.883 67 8034 Assam Priority 0.1 94.084 68 4060 Po Basin Priority 0.1 94.185 5062 Arkoma Basin86 5055 Nemaha Uplift87 69 8042 Indus Priority 0.1 94.388 5033 Powder River Basin89 70 6090 Middle Magdalena Priority 0.1 94.490 71 3913 Browse Basin Priority 0.1 94.591 72 3910 Bonaparte Gulf Basin Priority 0.1 94.692 5034 Big Horn Basin93 5053 Cambridge Arch-Central
Kansas Uplift94 73 5245 Rocky Mountain
Deformed Belt Priority 0.1 94.895 74 1150 North Ustyurt Basin Priority 0.1 94.996 75 5304 Saline-Comalcalco
Basin Priority 0.1 95.097 76 5215 Labrador-Newfoundland
Shelf Priority 0.1 95.198 5031 Williston Basin, U.S.99 77 8025 Sulaiman-Kirthar 0.1 95.2100 5003 Southern Alaska101 78 6043 Madre dos Dios Basin 0.1 95.3102 5020 Uinta-Piceance Basin103 79 8048 Irrawaddy Boutique 0.1 95.4104 80 1175 Yenisey-Khatanga
Basin 0.1 95.5105 81 2070 Mediterranean Basin 0.1 95.6106 82 2012 East Flank Oman
Sub-basin 0.1 95.7107 83 8047 Ganges-Brahmaputra
Delta Boutique 0.1 95.8
RH-14
______________________________________________________________________________Table RH-1. Continued
Percent Cum.of percent
Rank world of worldexcl. Geologic Geologic Initial volume volumeof province province assessment excl. of excl. of
Rank U.S. code name type U.S. U.S.______________________________________________________________________________
108 84 3966 New Guinea ForelandBasin-Fold Belt 0.1 95.9
109 85 4033 German-Polish Basin 0.1 96.0110 86 4044 Pyrenean Foothills-Ebro
Basin 0.1 96.1111 5060 Cherokee Platform112 87 2011 South Oman Salt Basin 0.1 96.2113 88 6081 Talara Basin 0.1 96.3114 89 3805 Bintuni/Sulawati
Province 0.1 96.3115 5063 Michigan Basin116 90 3507 Thai Basin 0.1 96.4117 91 3142 Sichuan Basin Boutique 0.1 96.5118 92 1214 Lena-Vilyuy Basin 0.1 96.6119 5012 Santa Maria Basin120 93 6032 Reconcavo Basin 0.1 96.6121 94 4030 Irish Sea 0.1 96.7122 95 3924 Eromanga Basin 0.1 96.8123 5039 Denver Basin124 96 3154 Tarim Basin Boutique 0.1 96.9125 97 3809 East Java Basin Boutique 0.1 96.9126 98 3031 Taranaki Basin 0.1 97.0127 99 3128 Ordos Basin Boutique 0.1 97.1128 100 5300 Burgos Basin 0.1 97.1129 101 4019 Faeroes-Shetland-
Orkney Basin Boutique 0.1 97.2130 102 3825 Penyu/West Natuna
Basin Boutique 0.1 97.2131 103 4015 Hammerfest-Varanger
Basin 0.1 97.3132 5009 Sacramento Basin133 104 2039 North Egypt Basin 0.1 97.4134 5036 Wyoming Thrust Belt

RH-15
______________________________________________________________________________Table RH-1. Continued
Percent Cum.of percent
Rank world of worldexcl. Geologic Geologic Initial volume volumeof province province assessment excl. of excl. of
Rank U.S. code name type U.S. U.S.______________________________________________________________________________
135 105 4046 Bohemia 0.1 97.4136 106 3505 Saigon Basin Boutique 0.1 97.5137 107 1156 Afghan-Tajik Basin 0.1 97.5138 108 3159 Yingehai Basin 0.1 97.6139 109 1209 Angara-Lena Terrace Boutique 0.1 97.7140 110 4051 Alps 0.1 97.7141 111 3605 Palawan Shelf 0.1 97.8142 112 2074 Khleisha Uplift 0.1 97.8143 113 2089 Anah Graben 0.1 97.9144 114 6051 Cuyo Basin 0.1 97.9145 115 7146 Sud Boutique 0.1 98.0146 116 1059 Ludlov Saddle 0.1 98.0147 117 2038 Abu Gharadiq Basin 0.1 98.1148 118 2075 Euphrates/Mardin 0.1 98.1149 5059 Sedgwick Basin150 119 5306 Macuspana Basin <0.1 98.2151 120 3503 Mekong/Cuulong/Vung
Tau Basin <0.1 98.2152 121 6092 Eastern Cordillera
Basin <0.1 98.3153 122 2045 Murzuk Basin <0.1 98.3154 5035 Wind River Basin155 123 1159 Fergana Basin Boutique <0.1 98.4156 124 7303 Orange River Coastal Boutique <0.1 98.4157 125 3606 Pamusian Tarakan
Basin <0.1 98.5158 126 6097 Barinas-Apure Basin <0.1 98.5159 127 6089 Upper Magdalena <0.1 98.5160 128 2047 Hamra Basin <0.1 98.6161 129 1207 Baykit Arch Boutique <0.1 98.6162 130 6029 Sergipe-Alagoas Basin <0.1 98.6163 5028 North-Central Montana164 5021 Paradox Basin

RH-16
______________________________________________________________________________Table RH-1. Continued
Percent Cum.of percent
Rank world of worldexcl. Geologic Geologic Initial volume volumeof province province assessment excl. of excl. of
Rank U.S. code name type U.S. U.S.______________________________________________________________________________
165 131 5217 Scotian Shelf <0.1 98.7166 132 4040 Anglo-Paris Basin <0.1 98.7167 133 4058 Adriatic Basin <0.1 98.7168 134 6027 Potigar Basin <0.1 98.8169 135 1167 South Turgay Basin <0.1 98.8170 136 3130 Pearl River Mouth
Basin <0.1 98.8171 137 7363 South African Coastal <0.1 98.9172 138 7255 Somali <0.1 98.9173 139 3126 Nanyang Basin <0.1 98.9174 140 8026 Kohat-Potwar <0.1 98.9175 141 3147 Subei Yellow Sea Basin <0.1 99.0176 5011 Central Coastal177 142 6095 Guajira Basin <0.1 99.0178 143 2077 Palmyra Zone <0.1 99.0179 144 2009 Masila-Jeza Basin <0.1 99.1180 145 4066 Sicily <0.1 99.1181 146 3131 Qaidam Basin <0.1 99.1182 147 7343 Mozambique Coastal Boutique <0.1 99.1183 148 7183 Gulf of Guinea Boutique <0.1 99.2184 149 1010 Pripyat Basin <0.1 99.2185 150 6036 Santos Basin <0.1 99.2186 151 4049 Molasse Basin <0.1 99.2187 152 3308 Niigata Basin <0.1 99.2188 153 6011 Solimoes Basin <0.1 99.3189 5065 Black Warrior Basin190 154 1165 Chu-Sarysu Basin <0.1 99.3191 155 8045 Krishna-Godavari <0.1 99.3192 156 2035 Nile Delta Basin <0.1 99.3193 157 1105 North Crimea Basin <0.1 99.3194 158 4021 Baltic Depression <0.1 99.3195 159 1113 Kura Basin <0.1 99.4196 160 2046 Fezzan Uplift <0.1 99.4
RH-17
______________________________________________________________________________Table RH-1. Continued
Percent Cum.of percent
Rank world of worldexcl. Geologic Geologic Initial volume volumeof province province assessment excl. of excl. of
Rank U.S. code name type U.S. U.S.______________________________________________________________________________
197 161 3969 Papuan Basin-ShelfPlatform <0.1 99.4
198 162 4045 Aquitaine Basin <0.1 99.4199 163 3304 Japan Volcanic
Arc/Accreted Terrane <0.1 99.4200 164 3151 Taiwan Thrust and Fold
Belt <0.1 99.4201 165 4026 Ireland-Scotland
Platform <0.1 99.5202 166 6107 Lesser Antilles
Deformed Belt <0.1 99.5203 167 3109 East China Sea Basin <0.1 99.5204 168 6100 Falcon Basin <0.1 99.5205 169 4062 Tuscany-Latium-Paola <0.1 99.5206 170 3103 Beibuwan Basin <0.1 99.5207 171 5246 Mackenzie Foldbelt <0.1 99.5208 172 4083 Iberic Cordillera <0.1 99.5209 173 6091 Lower Magdalena <0.1 99.6210 174 3181 South China Continental
Shelf Slope <0.1 99.6211 175 3112 Jianghan Basin <0.1 99.6212 176 7273 Tanzania Coastal <0.1 99.6213 177 4064 West Black Sea Basin <0.1 99.6214 178 3958 Surat Basin <0.1 99.6215 5098 Gulf Mesozoic OCS216 179 5225 Algonquin Arch-
Michigan Basin <0.1 99.6217 5066 Cincinnati Arch218 180 5323 Sabinas Basin <0.1 99.6219 181 6083 Progreso Basin <0.1 99.7220 182 3903 Amadeus Basin <0.1 99.7221 183 5317 Chicontepec Basin <0.1 99.7222 184 2015 Central Oman Platform <0.1 99.7
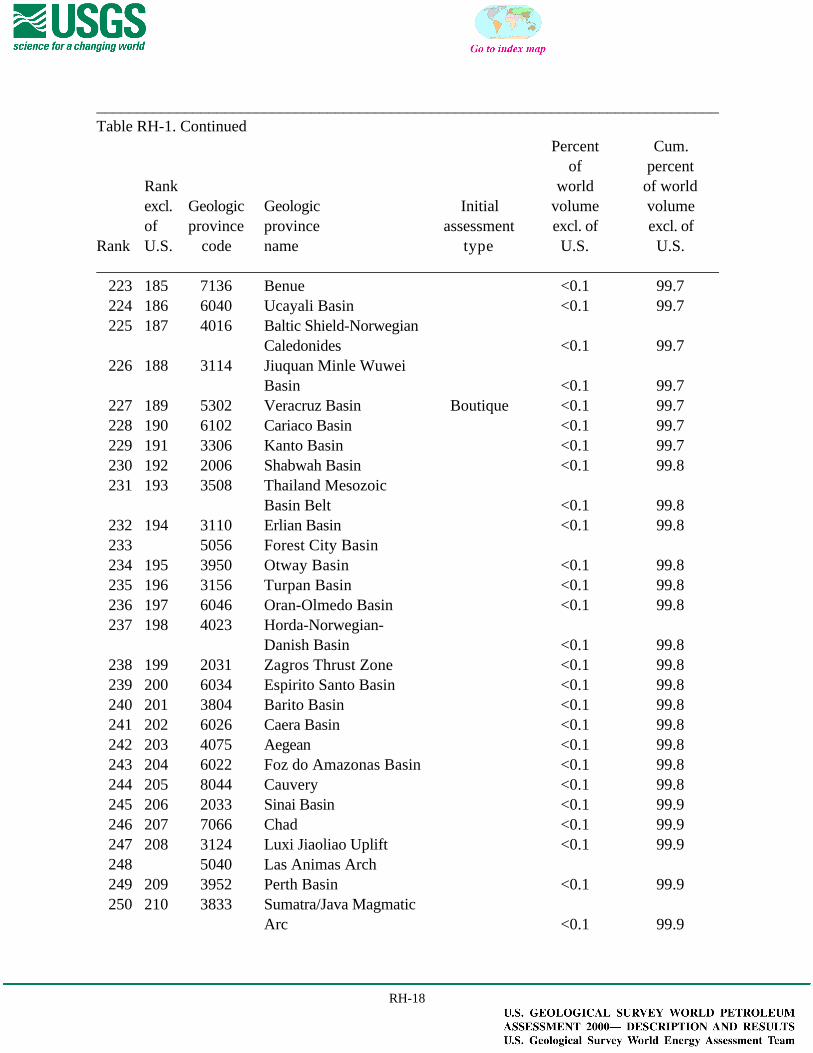
RH-18
______________________________________________________________________________Table RH-1. Continued
Percent Cum.of percent
Rank world of worldexcl. Geologic Geologic Initial volume volumeof province province assessment excl. of excl. of
Rank U.S. code name type U.S. U.S.______________________________________________________________________________
223 185 7136 Benue <0.1 99.7224 186 6040 Ucayali Basin <0.1 99.7225 187 4016 Baltic Shield-Norwegian
Caledonides <0.1 99.7226 188 3114 Jiuquan Minle Wuwei
Basin <0.1 99.7227 189 5302 Veracruz Basin Boutique <0.1 99.7228 190 6102 Cariaco Basin <0.1 99.7229 191 3306 Kanto Basin <0.1 99.7230 192 2006 Shabwah Basin <0.1 99.8231 193 3508 Thailand Mesozoic
Basin Belt <0.1 99.8232 194 3110 Erlian Basin <0.1 99.8233 5056 Forest City Basin234 195 3950 Otway Basin <0.1 99.8235 196 3156 Turpan Basin <0.1 99.8236 197 6046 Oran-Olmedo Basin <0.1 99.8237 198 4023 Horda-Norwegian-
Danish Basin <0.1 99.8238 199 2031 Zagros Thrust Zone <0.1 99.8239 200 6034 Espirito Santo Basin <0.1 99.8240 201 3804 Barito Basin <0.1 99.8241 202 6026 Caera Basin <0.1 99.8242 203 4075 Aegean <0.1 99.8243 204 6022 Foz do Amazonas Basin <0.1 99.8244 205 8044 Cauvery <0.1 99.8245 206 2033 Sinai Basin <0.1 99.9246 207 7066 Chad <0.1 99.9247 208 3124 Luxi Jiaoliao Uplift <0.1 99.9248 5040 Las Animas Arch249 209 3952 Perth Basin <0.1 99.9250 210 3833 Sumatra/Java Magmatic
Arc <0.1 99.9

RH-19
______________________________________________________________________________Table RH-1. Continued
Percent Cum.of percent
Rank world of worldexcl. Geologic Geologic Initial volume volumeof province province assessment excl. of excl. of
Rank U.S. code name type U.S. U.S.______________________________________________________________________________
251 211 3502 Khorat Platform <0.1 99.9252 212 3146 South China Fold Belt <0.1 99.9253 5050 Florida Peninsula254 213 3135 Qinling Dabieshan Fold
Belt <0.1 99.9255 214 4055 Rhine Graben <0.1 99.9256 215 1011 Russian Craton Margin <0.1 99.9257 216 3806 Bone Basin <0.1 99.9258 5067 Appalachian Basin259 217 4011 Svalbard High <0.1 99.9260 218 3611 Sulu Sea Basin <0.1 99.9261 219 1300 Anadyr Basin <0.1 99.9262 220 3153 Taixinan Basin <0.1 99.9263 221 2081 Lesser Caucasus <0.1 99.9264 222 3907 Bass Basin <0.1 99.9265 223 3803 Banda Arc <0.1 99.9266 224 5242 Northern Interior Basins <0.1 99.9267 225 2085 Thrace/Samsun <0.1 99.9268 226 3832 Sumatra/Java Fore-Arc
Basins <0.1 99.9269 5054 Salina Basin270 227 3303 Ishikari Hidaka Basin <0.1 99.9271 228 6021 Guyana-Suriname Basin <0.1 99.9272 229 3316 Tsushima Basin <0.1 99.9273 230 3301 Akita Basin <0.1 99.9274 231 2026 Jafr-Tabuk Basin <0.1 99.9275 232 3916 Carnarvon Basin <0.1 99.9276 233 8023 Central Afghanistan <0.1 99.9277 5019 Eastern Great Basin278 234 5332 Salton Trough <0.1 99.9279 235 3161 Yunnan Guizhou Hubei
Fold Belt <0.1 99.9280 236 1158 Tian Shan Foldbelt <0.1 99.9

RH-20
______________________________________________________________________________Table RH-1. Continued
Percent Cum.of percent
Rank world of worldexcl. Geologic Geologic Initial volume volumeof province province assessment excl. of excl. of
Rank U.S. code name type U.S. U.S.______________________________________________________________________________
281 237 2032 Levantine Basin <0.1 99.9282 238 2061 Ougarta Uplift <0.1 100.0283 5029 Southwest Montana284 239 2076 Haleb <0.1 100.0285 240 2053 Atlas Uplift <0.1 100.0286 241 2029 Wadi-Surhan Basin Boutique <0.1 100.0287 242 4077 Alentejo-Guadalquivir
Basin <0.1 100.0288 243 3207 Temtsag Hailar Basin <0.1 100.0289 244 3821 North Banda Basin <0.1 100.0290 245 3305 Joban Basin <0.1 100.0291 246 8006 Tenasserim-Shan <0.1 100.0292 247 5310 Sierra Madre de
Chiapas-Peten Foldbelt <0.1 100.0293 248 1051 Kola Monocline-
Finnmark Platform <0.1 100.0294 249 4012 Central Barents
Platform <0.1 100.0295 250 2072 Rif Basin <0.1 100.0296 251 1203 Tunguska Basin <0.1 100.0297 252 3819 Meratus High <0.1 100.0298 253 4038 Munsterland Basin <0.1 100.0299 254 6063 Malvinas Basin <0.1 100.0300 5024 Northern Arizona301 255 4070 Spanish Trough-
Cantabrian Zone <0.1 100.0302 256 2064 Essaouni Basin <0.1 100.0303 257 3829 Sulawesi Accretionary
Prism <0.1 100.0304 258 3160 Yinshan Da and Xiao
Hingganling Uplift <0.1 100.0305 259 3162 Zhangguangcailing
Uplift <0.1 100.0
RH-21
______________________________________________________________________________Table RH-1. Continued
Percent Cum.of percent
Rank world of worldexcl. Geologic Geologic Initial volume volumeof province province assessment excl. of excl. of
Rank U.S. code name type U.S. U.S.______________________________________________________________________________
306 260 1328 Tatar Strait Basin <0.1 100.0307 5007 Northern Coastal308 261 3125 Nanpanjiang
Depression <0.1 100.0309 262 1311 West Kamchatka Basin <0.1 100.0310 263 3802 Bali Basin <0.1 100.0311 264 6033 Bahia Sul Basin <0.1 100.0312 5038 Park Basins313 265 7013 Senegal Boutique <0.1 100.0314 266 3118 Kunlunshan Fold Belt <0.1 100.0315 267 3609 Reed Bank Basin <0.1 100.0316 268 3204 Gobi Basin <0.1 100.0317 269 1103 Dobrogea Foreland <0.1 100.0318 270 3810 East Natuna Basin <0.1 100.0319 271 3823 Northern Irian Jaya
Waropen Basin <0.1 100.0320 272 4027 Midland Valley-Forth
Approaches Basin <0.1 100.0321 273 1211 Cis-Patom Foredeep Boutique <0.1 100.0322 274 2060 Reggane Basin <0.1 100.0323 275 3113 Jiangnan South
Jiangsu Fold Belt <0.1 100.0324 276 5320 Parras Basin <0.1 100.0325 277 3911 Bowen Basin <0.1 100.0326 278 3140 Shanxi Plateau <0.1 100.0327 279 7373 Morondava <0.1 100.0328 280 2101 Arabian Shield <0.1 100.0329 281 4013 Barents Continental
Slope <0.1 100.0330 282 4028 Mid-North Sea High <0.1 100.0331 283 8005 Indo-Burman <0.1 100.0332 284 8002 Himalayan <0.1 100.0333 5004 Western Oregon-
Washington
RH-22
______________________________________________________________________________Table RH-1. Continued
Percent Cum.of percent
Rank world of worldexcl. Geologic Geologic Initial volume volumeof province province assessment excl. of excl. of
Rank U.S. code name type U.S. U.S.______________________________________________________________________________
334 5046 Marathon Thrust Belt335 285 2007 Sharmah Rift Basin <0.1 100.0336 286 1302 Khatyrka Basin <0.1 100.0337 287 5308 Yucatan Platform <0.1 100.0338 288 2040 Cyrenaica Uplift <0.1 100.0339 289 3310 Ryukyu Volcanic Arc <0.1 100.0340 290 3815 Java/Banda Sea <0.1 100.0341 291 6023 Santana Platform <0.1 100.0342 292 6074 Central Chile Forearc
Basin <0.1 100.0343 293 6031 Tucano Basin <0.1 100.0344 294 3312 Sea Of Japan Backarc
Basin <0.1 100.0345 295 3914 Canning Basin <0.1 100.0346 296 1204 Turukhan-Norilsk
Folded Zone <0.1 100.0347 297 1111 Rioni Basin <0.1 100.0348 298 6012 Amazonas Basin <0.1 100.0349 299 2079 Adana/Sivas <0.1 100.0350 300 3149 Taihangshan Yanshan
Fold Belt <0.1 100.0351 301 2052 Tellian Foredeep <0.1 100.0352 302 3602 Cagayan Basin <0.1 100.0353 303 3816 Ketuneau/Sintang
Terrane <0.1 100.0354 304 1327 Aniva Basin <0.1 100.0355 305 3007 Great South Basin <0.1 100.0356 306 8035 North Burma <0.1 100.0357 307 3801 Arafura Basin-Irian
Jaya <0.1 100.0358 308 1223 Upper Bureya Basin <0.1 100.0359 309 3612 Visayan <0.1 100.0360 310 3704 Malay Peninsula <0.1 100.0

RH-23
______________________________________________________________________________Table RH-1. Continued
Percent Cum.of percent
Rank world of worldexcl. Geologic Geologic Initial volume volumeof province province assessment excl. of excl. of
Rank U.S. code name type U.S. U.S.______________________________________________________________________________
361 311 5236 Parry Island Foldbelt <0.1 100.0362 312 3102 Altunshan Fold Belt <0.1 100.0363 313 3136 Qiongdongnan Basin <0.1 100.0364 314 3404 Korba Bay Basin <0.1 100.0365 315 2034 South Harrah
Volcanics <0.1 100.0366 5008 Sonoma-Livermore
Basin367 316 6020 Parana Basin <0.1 100.0368 5027 Montana Thrust Belt369 317 4071 Dinaric Alps <0.1 100.0370 318 1004 Belorussian-Voronezh
High <0.1 100.0371 319 3134 Qilianshan Fold Belt <0.1 100.0372 320 3959 Sydney Basin <0.1 100.0373 321 5321 Coahuila Platform <0.1 100.0374 322 4052 Jura <0.1 100.0375 323 6025 Barreieinas Basin <0.1 100.0376 324 4082 Tajo-Duero Basin <0.1 100.0377 325 2078 Beirut <0.1 100.0378 326 3608 Philippine Magmatic
Arc <0.1 100.0379 327 3837 Zambalez/Central
Luzon Basin <0.1 100.0380 328 3919 Clarence-Moreton Basin <0.1 100.0381 329 2050 Tellian Uplift <0.1 100.0382 330 3940 Maryborough Basin <0.1 100.0383 331 6094 Cesar Basin <0.1 100.0384 332 6065 Altiplano Basin <0.1 100.0385 333 3021 New Zealand Orogenic
Belt <0.1 100.0386 334 3311 Sagara Basin <0.1 100.0387 335 4043 Massif Central <0.1 100.0
RH-24
______________________________________________________________________________Table RH-1. Continued
Percent Cum.of percent
Rank world of worldexcl. Geologic Geologic Initial volume volumeof province province assessment excl. of excl. of
Rank U.S. code name type U.S. U.S.______________________________________________________________________________
388 336 5322 Burros Uplift <0.1 100.0389 337 2066 Aaiun-Tarfaya Basin <0.1 100.0390 338 3108 Cuoqing Lupola Basin <0.1 100.0391 339 3929 Georgina Basin <0.1 100.0392 340 5314 Jalisco-Oaxaca Platform <0.1 100.0393 341 4039 Southwest German
Basin <0.1 100.0394 342 6069 Temuco Basin <0.1 100.0395 343 5316 Trans-Mexican
Neovolcanic Axis <0.1 100.0396 344 4056 Lion-Camargue <0.1 100.0397 345 3122 Lhasa Terrane <0.1 100.0398 346 6093 Perija-Venezuela-
Coastal Ranges <0.1 100.0399 347 5334 Vizcaino Basin <0.1 100.0400 348 6010 Tacutu Basin <0.1 100.0401 349 8003 Indian Shield <0.1 100.0402 350 1018 Mugodzhary-South
Emba 0.0 100.0403 351 1106 Northeast Black Sea
Shelf 0.0 100.0404 352 1153 Karabogaz-Karakum
High 0.0 100.0405 353 5234 Sverdrup Basin Boutique 0.0 100.0406 354 5239 Mackenzie Delta 0.0 100.0* * 1060 North Barents Basin Boutique* * 4068 Provence Basin Boutique* * 5200 East Greenland Rift
Basins Boutique* * 5207 Baffin Basin Boutique* * 7355 Karoo Boutique
______________________________________________________________________________* These geologic provinces currently have no known petroleum volume reported in the databasesused in this assessment and therefore cannot be ranked.
0
0
U.S. DEPARTMENT OF THE INTERIORU.S. GEOLOGICAL SURVEY
Figure RH-1. Geologic provinces of the world. Provinces highlighted in red are priority provinces, exclusive of the United States; provinceshighlighted in yellow are the boutique provinces initially chosen at the onset of the U.S. Geological Survey World Petroleum Assessment 2000;and provinces highlighted in blue are U. S. provinces that rank as high as the priority provinces (from Klett and others, 1997).
Digital compilation byLee M. Osmonson
1997Version 08/01/97
USGS REGIONS
REGION 1
REGION 2
REGION 3
REGION 4
REGION 5
REGION 6
REGION 7
REGION 8
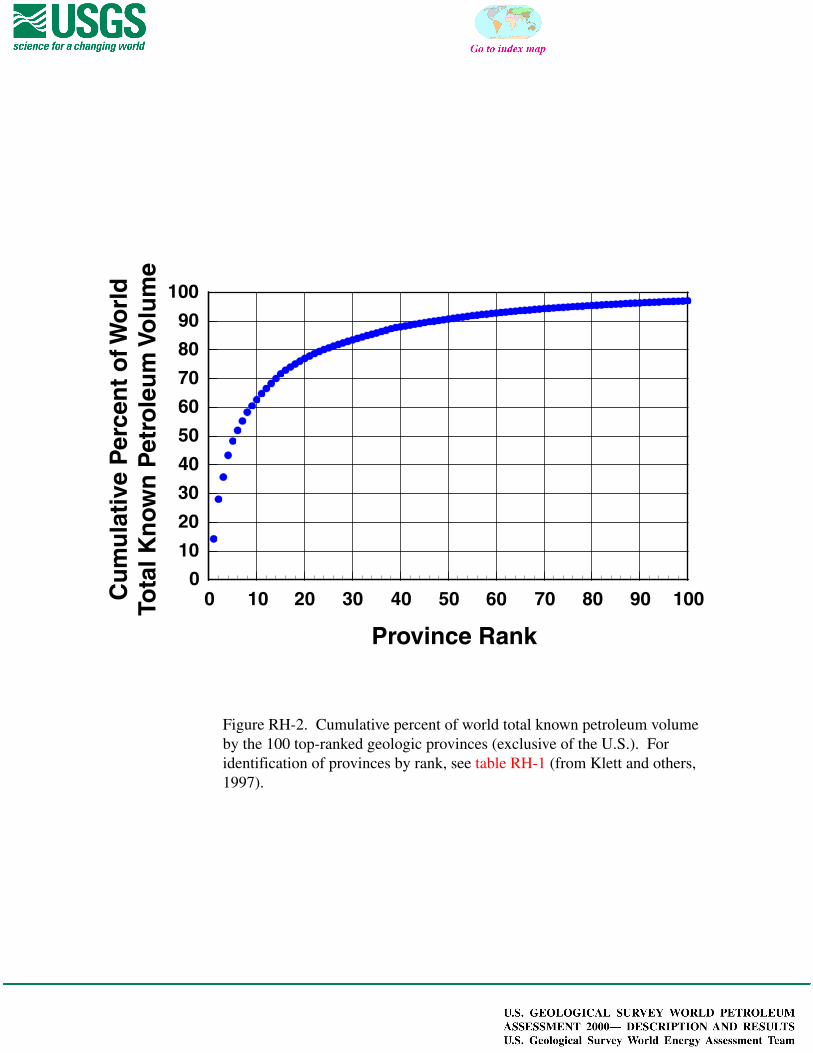
Figure RH-2. Cumulative percent of world total known petroleum volumeby the 100 top-ranked geologic provinces (exclusive of the U.S.). Foridentification of provinces by rank, see table RH-1 (from Klett and others,1997).
Province Rank
Cu
mu
lati
ve P
erce
nt
of W
orl
dTo
tal K
no
wn
Pet
role
um
Vo
lum
e
0 10 20 30 40 50 60 70 80 90 1000
10
20
30
40
50
60
70
80
90
100
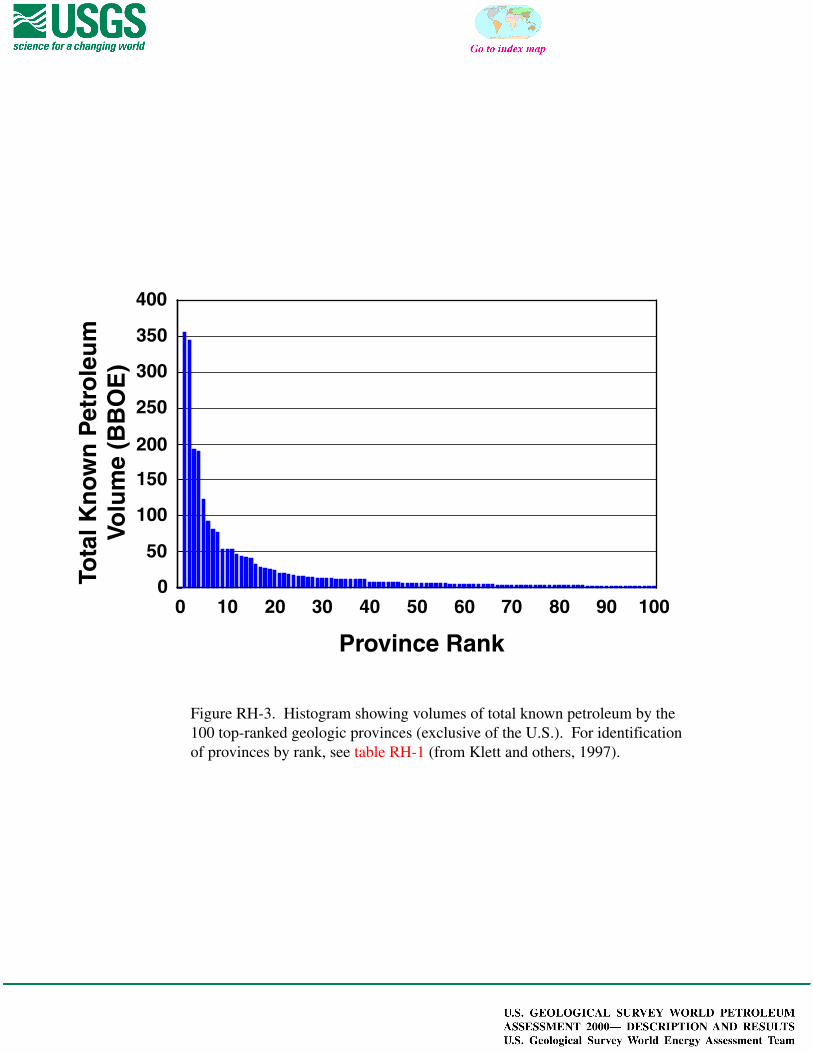
Figure RH-3. Histogram showing volumes of total known petroleum by the100 top-ranked geologic provinces (exclusive of the U.S.). For identificationof provinces by rank, see table RH-1 (from Klett and others, 1997).
Province Rank
Tota
l Kn
ow
n P
etro
leu
mVo
lum
e (B
BO
E)
400
350
300
250
200
150
100
50
00 10 20 30 40 50 60 70 80 90 100