chapter poverty as challenge poverty as a...
TRANSCRIPT

Poverty as a Challenge 29
OverviewThis chapter deals with one of the mostdifficult challenges faced by independentIndia—poverty. After discussing thismulti-dimensional problem throughexamples, the chapter discusses the waypoverty is seen in social sciences. Povertytrends in India and the world areillustrated through the concept of thepoverty line. Causes of poverty as well asanti-poverty measures taken by thegovernment are also discussed. Thechapter ends with broadening the officialconcept of poverty into human poverty.
IntroductionIn our daily life, we come across manypeople who we think are poor. They couldbe landless labourers in villages or peopleliving in overcrowded jhuggis in cities. Theycould be daily wage workers atconstruction sites or child workers in
Poverty as a ChallengeChapter
dhabas. They could also be beggars withchildren in tatters. We see poverty allaround us. In fact, every fourth person inIndia is poor. This means, roughly 260million (or 26 crore) people in India livein poverty. This also means that India hasthe largest single concentration of the poorin the world. This illustrates theseriousness of the challenge.
Two Typical Cases of Poverty
Urban Case
Thirty-three year old Ram Saran worksas a daily-wage labourer in a wheatflour mill near Ranchi in Jharkhand.He manages to earn around Rs 1,500a month when he finds employment,which is not often. The money is notenough to sustain his family of six—that includes his wife and four childrenaged betweem 12 years to six months.
Poverty as a Challenge33
Picture 3.1 Story of Ram Saran
30 Economics
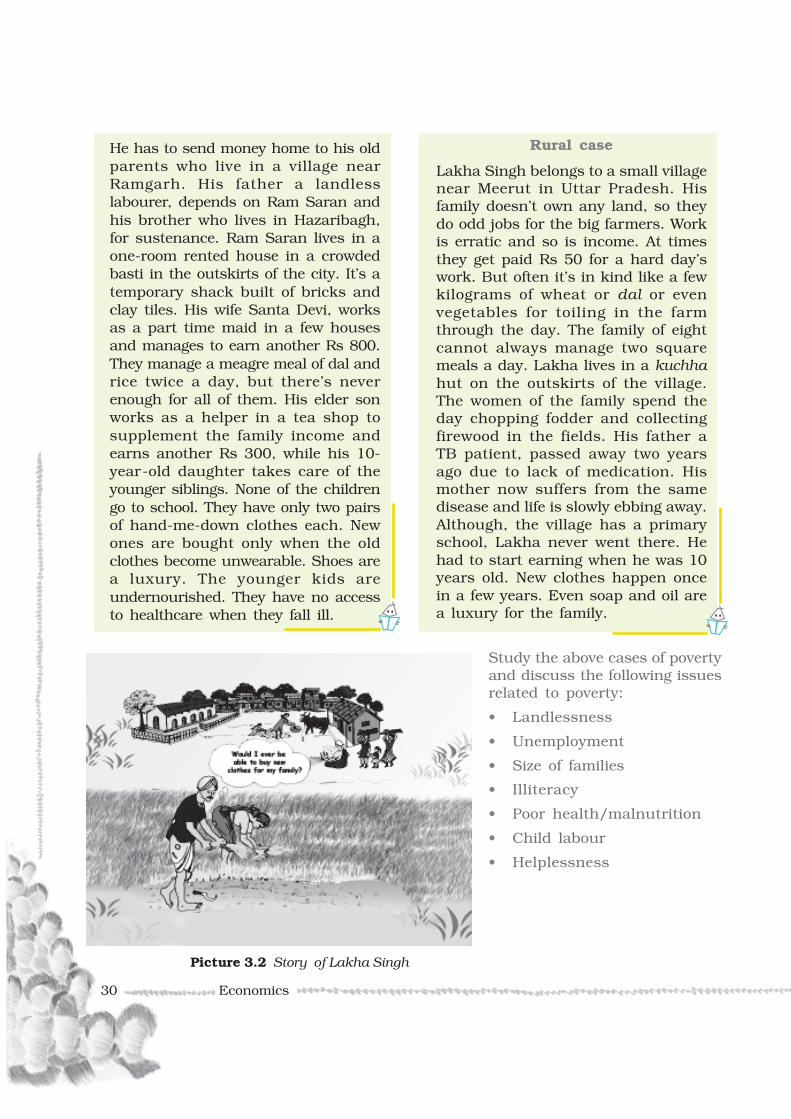
He has to send money home to his oldparents who live in a village nearRamgarh. His father a landlesslabourer, depends on Ram Saran andhis brother who lives in Hazaribagh,for sustenance. Ram Saran lives in aone-room rented house in a crowdedbasti in the outskirts of the city. It’s atemporary shack built of bricks andclay tiles. His wife Santa Devi, worksas a part time maid in a few housesand manages to earn another Rs 800.They manage a meagre meal of dal andrice twice a day, but there’s neverenough for all of them. His elder sonworks as a helper in a tea shop tosupplement the family income andearns another Rs 300, while his 10-year-old daughter takes care of theyounger siblings. None of the childrengo to school. They have only two pairsof hand-me-down clothes each. Newones are bought only when the oldclothes become unwearable. Shoes area luxury. The younger kids areundernourished. They have no accessto healthcare when they fall ill.
Rural case
Lakha Singh belongs to a small villagenear Meerut in Uttar Pradesh. Hisfamily doesn’t own any land, so theydo odd jobs for the big farmers. Workis erratic and so is income. At timesthey get paid Rs 50 for a hard day’swork. But often it’s in kind like a fewkilograms of wheat or dal or evenvegetables for toiling in the farmthrough the day. The family of eightcannot always manage two squaremeals a day. Lakha lives in a kuchhahut on the outskirts of the village.The women of the family spend theday chopping fodder and collectingfirewood in the fields. His father aTB patient, passed away two yearsago due to lack of medication. Hismother now suffers from the samedisease and life is slowly ebbing away.Although, the village has a primaryschool, Lakha never went there. Hehad to start earning when he was 10years old. New clothes happen oncein a few years. Even soap and oil area luxury for the family.
Study the above cases of povertyand discuss the following issuesrelated to poverty:
• Landlessness
• Unemployment
• Size of families
• Illiteracy
• Poor health/malnutrition
• Child labour
• Helplessness
Picture 3.2 Story of Lakha Singh
Poverty as a challenge 31
These two typical cases illustrate manydimensions of poverty. They show thatpoverty means hunger and lack of shelter.It also is a situation in which parents arenot able to send their children to schoolor a situation where sick people cannotafford treatment. Poverty also means lackof clean water and sanitation facilities. Italso means lack of a regular job at aminimum decent level. Above all it meansliving with a sense of helplessness. Poorpeople are in a situation in which theyare ill-treated at almost every place, infarms, factories, government offices,hospitals, railway stations etc. Obviously,nobody would like to live in poverty.
One of the biggest challenges ofindependent India has been to bringmillions of its people out of abject poverty.Mahatama Gandhi always insisted thatIndia would be truly independent onlywhen the poorest of its people become freeof human suffering.
Poverty as seen by social scientistsSince poverty has many facets, socialscientists look at it through a variety ofindicators. Usually the indicators usedrelate to the levels of income andconsumption. But now poverty is lookedthrough other social indicators likeilliteracy level, lack of general resistancedue to malnutrition, lack of access tohealthcare, lack of job opportunities, lackof access to safe drinking water,sanitation etc. Analysis of poverty basedon social exclusion and vulnerability isnow becoming very common (see box).
both a cause as well as aconsequence of poverty in the usualsense. Broadly, it is a process throughwhich individuals or groups areexcluded from facilities, benefits andopportunities that others (their“betters”) enjoy. A typical example isthe working of the caste system inIndia in which people belonging tocertain castes are excluded fromequal opportunities. Social exclusionthus may lead to, but can cause moredamage than, having a very lowincome.
Vulnerability
Vulnerability to poverty is a measure,which describes the greaterprobability of certain communities(say, members of a backward caste)or individuals (such as a widow or aphysically handicapped person) ofbecoming, or remaining, poor in thecoming years. Vulnerability isdetermined by the options availableto different communities for findingan alternative living in terms ofassets, education, health and jobopportunities. Further, it is analysedon the basis of the greater risks thesegroups face at the time of naturaldisasters (earthquakes, tsunami),terrorism etc. Additional analysis ismade of their social and economicability to handle these risks. In fact,vulnerability describes the greaterprobability of being more adverselyaffected than other people when badtime comes for everybody, whether aflood or an earthquake or simply afall in the availability of jobs!
Social exclusion
According to this concept, povertymust be seen in terms of the poorhaving to live only in a poorsurrounding with other poor people,excluded from enjoying social equalityof better -of f people in bettersurroundings. Social exclusion can be
Poverty LineAt the centre of the discussion on povertyis usually the concept of the “poverty line”.A common method used to measurepoverty is based on the income or

32 Economics
consumption levels. A person isconsidered poor if his or her income orconsumption level falls below a given“minimum level” necessary to fulfill basicneeds. What is necessary to satisfy basicneeds is different at different times andin different countries. Therefore, povertyline may vary with time and place. Eachcountry uses an imaginary line that isconsidered appropriate for its existing levelof development and its accepted minimumsocial norms. For example, a person nothaving a car in the United States may beconsidered poor. In India, owning of a caris still considered a luxury.
While determining the poverty line inIndia, a minimum level of foodrequirement, clothing, footwear, fuel andlight, educational and medicalrequirement etc. are determined forsubsistence. These physical quantities aremultiplied by their prices in rupees. Thepresent formula for food requirementwhile estimating the poverty line is basedon the desired calorie requirement. Fooditems such as cereals, pulses, vegetable,milk, oil, sugar etc. together provide theseneeded calories. The calorie needs varydepending on age, sex and the type ofwork that a person does. The acceptedaverage calorie requirement in India is2400 calories per person per day in ruralareas and 2100 calories per person perday in urban areas. Since people livingin rural areas engage themselves in morephysical work, calorie requirements inrural areas are considered to be higherthan urban areas. The monetaryexpenditure per capita needed for buyingthese calorie requirements in terms offood grains etc. is revised periodicallytaking into consideration the rise inprices.
On the basis of these calculations, forthe year 2000, the poverty line for a personwas fixed at Rs 328 per month for therural areas and Rs 454 for the urbanareas. Despite less calorie requirement,
the higher amount for urban areas hasbeen fixed because of high prices of manyessential products in urban centres. Inthis way in the year 2000, a family of fivemembers living in rural areas andearning less than about Rs 1,640 permonth will be below the poverty line. Asimilar family in the urban areas wouldneed a minimum of Rs 2,270 per monthto meet their basic requirements. Thepoverty line is estimated periodically(normally every five years) by conductingsample surveys. These surveys arecarried out by the National Sample SurveyOrganisation (NSSO). However, formaking comparisons between developingcountries, many internationalorganisations like the World Bank use auniform standard for the poverty line:minimum availability of the equivalent of$1 per person per day.
Let’s DiscussDiscuss the following:
• Why do different countries use differentpoverty lines?
• What do you think would be the“minimum necessary level” in yourlocality?
Poverty Estimates
It is clear from the Table 3.1 that there issubstantial decline in poverty ratios inIndia from about 55 per cent in 1973 to36 per cent in 1993. The proportion ofpeople below poverty line further camedown to about 26 per cent in 2000. If thetrend continues, people below poverty linemay come down to less than 20 per centin the next few years. Although thepercentage of people living under povertydeclined in the earlier two decades (1973–1993), the number of poor remained stablearound 320 million for a fairly long period.The latest estimates indicate a significantreduction in the number of poor to about260 million.

Poverty as a Challenge 33
Let’s Discuss
Study the Table 3.1 and answer thefollowing questions:• Even if poverty ratio declined between
1973–74 and 1993–94, why did thenumber of poor remain at about 320million?
• Are the dynamics of poverty reductionthe same in rural and urban India?
Vulnerable GroupsThe proportion of people below poverty lineis also not same for all social groups andeconomic categories in India. Socialgroups which are most vulnerable topoverty are scheduled caste andscheduled tribe households. Similarly,
Table 3.1: Estimates of Poverty in India
Poverty ratio (%) Number of poor (in millions)
Year Rural Urban Combined Rural Urban Combined
1973–74 56.4 49.0 54.9 261 60 321
1993–94 37.3 32.4 36.0 244 76 320
1999–00 27.1 23.6 26.1 193 67 260
Source: Economic Survey 2002–03, Ministry of Finance, Government of India.
among the economic groups, the mostvulnerable groups are the ruralagricultural labour households and theurban casual labour households. Thefollowing Graph 3.1 shows the percentageof poor people in all these groups.Although the average for people belowpoverty line for all groups in India is 26,51 out of 100 people belonging toscheduled tribes are not able to meet theirbasic needs. Similarly, 50 per cent ofcasual workers in urban areas are belowpoverty line. About 50 per cent of landlessagricultural workers and 43 per cent ofscheduled castes are also poor. The doubledisadvantage, of being a landless casualwage labour household in the sociallydisadvantaged social groups of the
Graph 3.1: Poverty in India 2000: Most Vulnerable Groups
Nu
mber
of
poo
r ou
t of
eve
ry100 p
erso
n f
r om
th
e ca
tego
ry
0
10
20
30
40
50
60
Scheduledtribes
Urban casuallabourers
Rural agriculturelabourers
Scheduledcastes
Average Indianpoverty ratio
51 5047
43
26
Social Groups and Economic CategoriesSource: Reports on Employment and Unemployment among Social Groups in India No. 469,472,
NSSO, Ministry of Statistics, Programme Implementation, Govt of India.
34 Economics
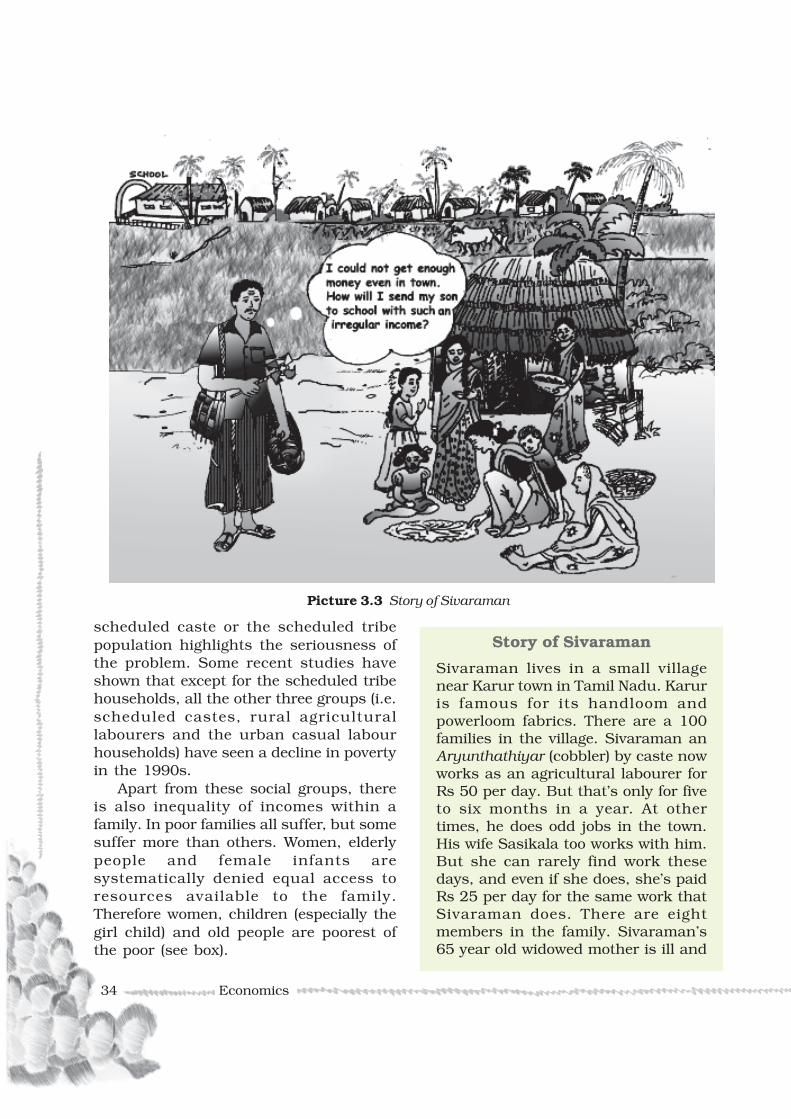
Picture 3.3 Story of Sivaraman
scheduled caste or the scheduled tribepopulation highlights the seriousness ofthe problem. Some recent studies haveshown that except for the scheduled tribehouseholds, all the other three groups (i.e.scheduled castes, rural agriculturallabourers and the urban casual labourhouseholds) have seen a decline in povertyin the 1990s.
Apart from these social groups, thereis also inequality of incomes within afamily. In poor families all suffer, but somesuffer more than others. Women, elderlypeople and female infants aresystematically denied equal access toresources available to the family.Therefore women, children (especially thegirl child) and old people are poorest ofthe poor (see box).
Story of Sivaraman
Sivaraman lives in a small villagenear Karur town in Tamil Nadu. Karuris famous for its handloom andpowerloom fabrics. There are a 100families in the village. Sivaraman anAryunthathiyar (cobbler) by caste nowworks as an agricultural labourer forRs 50 per day. But that’s only for fiveto six months in a year. At othertimes, he does odd jobs in the town.His wife Sasikala too works with him.But she can rarely find work thesedays, and even if she does, she’s paidRs 25 per day for the same work thatSivaraman does. There are eightmembers in the family. Sivaraman’s65 year old widowed mother is ill and
Poverty as a challenge 35
Let’s Discuss
Observe some of the poor familiesaround you and try to find the following:• Which social and economic group do
they belong to?
• Who are the earning members in thefamily?
• What is the condition of the old peoplein the family?
• Are all the children (boys and girls)attending schools?
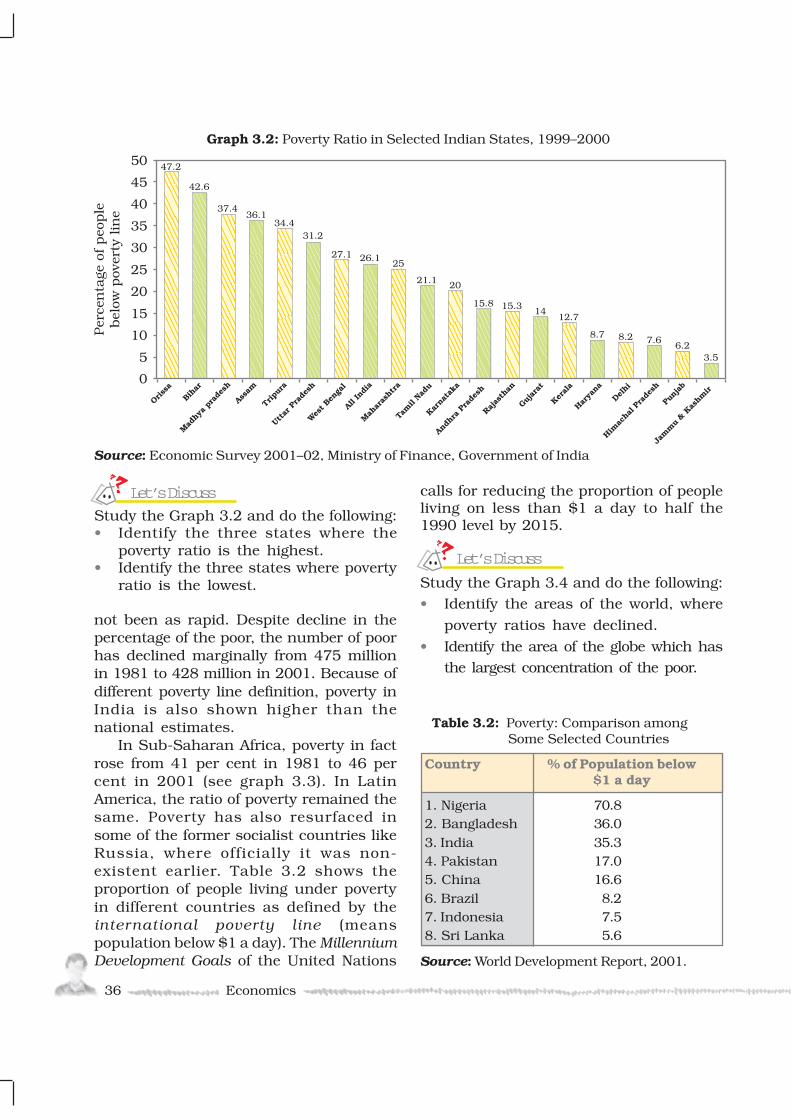
Although state level poverty has witnesseda secular decline from the levels of earlyseventies, the success rate of reducingpoverty varies from state to state. Recentestimates show that in 20 states andunion territories, the poverty ratio is lessthan the national average. On the otherhand, poverty is still a serious problemin Orissa, Bihar, Assam, Tripura andUttar Pradesh. As the Graph 3.2 shows,Orissa and Bihar continue to be the twopoorest states with poverty ratios of 47and 43 per cent respectively. Along withrural poverty urban poverty is also highin Orissa, Madhya Pradesh, Bihar andUttar Pradesh.
In comparison, there has been asignificant decline in poverty in Kerala,Jammu and Kashmir, Andhra Pradesh,Tamil Nadu, Gujarat and West Bengal.States like Punjab and Haryana havetraditionally succeeded in reducingpoverty with the help of high agriculturalgrowth rates. Kerala has focused more onhuman resource development. In WestBengal, land reform measures havehelped in reducing poverty. In AndhraPradesh and Tamil Nadu publicdistribution of food grains could have beenresponsible for the improvement.
Global Poverty ScenarioThe proportion of people in developingcountries living in extreme economicpoverty— defined by the World Bank asliving on less than $1 per day—has fallenfrom 28 per cent in 1990 to 21 per cent in2001. Although there has been asubstantial reduction in global poverty, itis marked with great regional differences.Poverty declined substantially in Chinaand Southeast Asian countries as a resultof rapid economic growth and massiveinvestments in human resourcedevelopment. Number of poors in Chinahas come down from 606 million in 1981to 212 million in 2001. In the countries ofSouth Asia (India, Pakistan, Sri Lanka,Nepal, Bangladesh, Bhutan) the decline has
needs to be helped with her dailychores. He has a 25-year -oldunmarried sister and four childrenaged between 1 year to 16 years.Three of them are girls, the youngestis a son. None of the girls go to school.Buying books and other things forschool-going girls is a luxury hecannot afford. Also, he has to get themmarried at some point of time so hedoesn’t want to spend on theireducation now. His mother has lostinterest in life and is just waiting todie someday. His sister and elderdaughter take care of the household.Sivaraman plans to send his son toschool when he comes of age. Hisunmarried sister does not get alongwith his wife. Sasikala finds her aburden but Sivaraman can’t find asuitable groom due to lack of money.Although the family has difficulty inarranging two meals a day,Sivaraman manages to buy milk oncein a while, but only for his son.
Inter-State DisparitiesPoverty in India also has another aspector dimension. The proportion of poorpeople is not the same in every state.
36 Economics
not been as rapid. Despite decline in thepercentage of the poor, the number of poorhas declined marginally from 475 millionin 1981 to 428 million in 2001. Because ofdifferent poverty line definition, poverty inIndia is also shown higher than thenational estimates.
In Sub-Saharan Africa, poverty in factrose from 41 per cent in 1981 to 46 percent in 2001 (see graph 3.3). In LatinAmerica, the ratio of poverty remained thesame. Poverty has also resurfaced insome of the former socialist countries likeRussia, where officially it was non-existent earlier. Table 3.2 shows theproportion of people living under povertyin different countries as defined by theinternational poverty line (meanspopulation below $1 a day). The MillenniumDevelopment Goals of the United Nations
Let’s DiscussStudy the Graph 3.2 and do the following:• Identify the three states where the
poverty ratio is the highest.• Identify the three states where poverty
ratio is the lowest.
calls for reducing the proportion of peopleliving on less than $1 a day to half the1990 level by 2015.
Let’s Discuss
Study the Graph 3.4 and do the following:• Identify the areas of the world, where
poverty ratios have declined.
• Identify the area of the globe which hasthe largest concentration of the poor.
45
50
40
35
30
25
20
15
10
5
0
Per
cen
tage
of
peo
ple
bel
ow p
over
ty lin
e
47.2
42.6
37.436.1
34.431.2
27.1 26.125
21.1 20
15.8 15.3 1412.7
8.7 8.2 7.66.2
3.5
Orissa
Biha
r
Mad
hya pr
ades
h
Assa
m
Tripur
a
Tam
il Nad
u
Uttar
Pra
desh
All I
ndia
Wes
t Ben
gal
Mah
aras
htra
Harya
na
Jam
mu
& Kas
hmir
Andh
ra P
rade
sh
Karna
taka
Rajas
than
Himac
hal P
rade
sh
Gujar
at
Kerala
Punj
ab
Delhi
Graph 3.2: Poverty Ratio in Selected Indian States, 1999–2000
Source: Economic Survey 2001–02, Ministry of Finance, Government of India
Table 3.2: Poverty: Comparison among Some Selected Countries
Country % of Population below$1 a day
1. Nigeria 70.82. Bangladesh 36.03. India 35.34. Pakistan 17.05. China 16.66. Brazil 8.27. Indonesia 7.58. Sri Lanka 5.6
Source: World Development Report, 2001.

Poverty as a Challenge 37
Source: World Development Indicators 2005, The World Bank.
Source: World Development Indicators 2005, The World Bank.
Graph 3.3: Share of people living on $1 a day, 1980–2001
0
10
40
20
50
30
60
70
1981 1990 2001
China
East Asia &Pacific
South Asia
Sub-Saharan Africa Sub-Saharan Africa
South Asia
China
Latin American & Carribean
Latin American & Carribean
East Asia &Pacific
Per
centa
ge
Years
1981
China
East Asia &Pacific
others
Sub-Saharan Africa
South Asia
1984 1987 1990 1993 1996 1999 20010
500
1000
1500
2000
Mil
lions
2500
Years
Graph 3.4: Number of poor by region ($ 1 per day) in millions

38 Economics
Causes of PovertyThere were a number of causes for thewidespread poverty in India. Onehistorical reason is the low level ofeconomic development under the Britishcolonial administration. The policies ofthe colonial government ruined traditionalhandicrafts and discouraged developmentof industries like textiles. The low rate ofgrowth persisted until the nineteen-eighties. This resulted in less jobopportunities and low growth rate ofincomes. This was accompanied by a highgrowth rate of population. The twocombined to make the growth rate of percapita income very low. The failure at boththe fronts: promotion of economic growthand population control perpetuated thecycle of poverty.
With the spread of irrigation and theGreen revolution, many job opportunitieswere created in the agriculture sector. Butthe effects were limited to some parts ofIndia. The industries, both in the publicand the private sector, did provide somejobs. But these were not enough to absorball the job seekers. Unable to find properjobs in cities, many people started workingas rickshaw pullers, vendors,construction workers, domestic servantsetc. With irregular small incomes, thesepeople could not afford expensive housing.They started living in slums on theoutskirts of the cities and the problemsof poverty, largely a rural phenomenonalso became the feature of the urbansector.
Another feature of high poverty rateshas been the huge income inequalities.One of the major reasons for this is theunequal distribution of land and otherresources. Despite many policies, we havenot been able to tackle the issue in ameaningful manner. Major policyinitiatives like land reforms which aimedat redistribution of assets in rural areashave not been implemented properly and
effectively by most of the stategovernments. Since lack of land resourceshas been one of the major causes ofpoverty in India, proper implementationof policy could have improved the life ofmillions of rural poor.
Many other socio-cultural andeconomic factors also are responsible forpoverty. In order to fulfil social obligationsand observe religious ceremonies, peoplein India, including the very poor, spend alot of money. Small farmers need moneyto buy agricultural inputs like seeds,fertilizer, pesticides etc. Since poor peoplehardly have any savings, they borrow.Unable to repay because of poverty, theybecome victims of indebtedness. So thehigh level of indebtedness is both thecause and effect of poverty.
Anti-Poverty MeasuresRemoval of poverty has been one of themajor objectives of Indian developmentalstrategy. The current anti-povertystrategy of the government is basedbroadly on two planks (1) promotion ofeconomic growth (2) targeted anti-povertyprogrammes.
Over a period of thirty years lastingup to the early eighties, there were littleper capita income growth and not muchreduction in poverty. Official povertyestimates which were about 45 per centin the early 1950s remained the same evenin the early eighties. Since the eighties,India’s economic growth has been one ofthe fastest in the world. The growth ratejumped from the average of about 3.5 percent a year in the 1970s to about 6 percent during the 1980s and 1990s. Thehigher growth rates have helpedsignificantly in the reduction of poverty.Therefore, it is becoming clear that thereis a strong link between economic growthand poverty reduction. Economic growthwidens opportunities and provides theresources needed to invest in humandevelopment. This also encourages people

Poverty as a challenge 39
to send their children, including the girlchild, to schools in the hope of gettingbetter economic returns from investing ineducation. However, the poor may not beable to take direct advantage from theopportunities created by economicgrowth. Moreover, growth in theagriculture sector is much belowexpectations. This has a direct bearingon poverty as a large number of poorpeople live in villages and are dependenton agriculture.
In these circumstances, there is aclear need for targeted anti-povertyprogrammes. Although there are so manyschemes which are formulated to affectpoverty directly or indirectly, some of themare worth mentioning. National RuralEmployment Guarantee Act (NREGA) 2005was passed in September 2005. The Actprovides 100 days assured employmentevery year to every rural household in 200districts. Later, the scheme will beextended to 600 districts. One third of theproposed jobs would be reserved forwomen. The central government will alsoestablish National EmploymentGuarantee Funds. Similarly stategovernments will establish StateEmployment Guarantee Funds forimplementation of the scheme. Under theprogramme if an applicant is not providedemployment within fifteen days s/he willbe entitled to a daily unemploymentallowance. Another important scheme hasbeen the National Food for Work Programme(NFWP), which was launched in 2004 in150 most backward districts of thecountry. The programme is open to allrural poor who are in need of wageemployment and desire to do manualunskilled work. It is implemented as a100 per cent centrally sponsored schemeand foodgrains are provided free of costto the states. Once the NREGA is in force,the NFWP will be subsumed within thisprogramme.
Prime Minister Rozgar Yozana (PMRY)is another scheme which was started in1993. The aim of the programme is tocreate self-employment opportunities foreducated unemployed youth in rural areasand small towns. They are helped insetting up small business and industries.Rural Employment Generation Programme(REGP) was launched in 1995. The aim ofthe programme is to create self-employment opportunities in rural areasand small towns. A target for creating 25lakh new jobs has been set for theprogramme under the Tenth Five Yearplan. Swarnajayanti Gram SwarozgarYojana (SGSY) was launched in 1999. Theprogramme aims at bringing the assistedpoor families above the poverty line byorganising them into self help groupsthrough a mix of bank credit andgovernment subsidy. Under the PradhanMantri Gramodaya Yozana (PMGY)launched in 2000, additional centralassistance is given to states for basicservices such as primary health, primaryeducation, rural shelter, rural drinkingwater and rural electrification. Anotherimportant scheme is Antyodaya AnnaYozana (AAY) about which you will bereading more in the next chapter.
The results of these programmes havebeen mixed. One of the major reasons forless effectiveness is the lack of properimplementation and right targeting.Moreover, there has been a lot ofoverlapping of schemes. Despite goodintentions, the benefits of these schemesare not fully reached to the deserving poor.Therefore, the major emphasis in recentyears is on proper monitoring of all thepoverty alleviation programmes.
The Challenges AheadPoverty has certainly declined in India.But despite the progress, povertyreduction remains India’s mostcompelling challenge. Wide disparities inpoverty are visible between rural and
40 Economics
Summary
You have seen in this chapter that poverty has many dimensions. Normally, this ismeasured through the concept of “poverty line”. Through this concept we analysedmain global and national trends in poverty. But in recent years, analysis of poverty isbecoming rich through a variety of new concepts like social exclusion. Similarly, thechallenge is becoming bigger as scholars are broadening the concept into humanpoverty.
urban areas and among different states.Certain social and economic groups aremore vulnerable to poverty. Povertyreduction is expected to make betterprogress in the next ten to fifteen years.This would be possible mainly due tohigher economic growth, increasing stresson universal free elementary education,declining population growth, increasingempowerment of the women and theeconomically weaker sections of society.
The official definition of poverty,however, captures only a limited part ofwhat poverty really means to people. It isabout a “minimum” subsistence level ofliving rather than a “reasonable” level ofliving. Many scholars advocate that wemust broaden the concept into humanpoverty. A large number of people may
have been able to feed themselves. Butdo they have education? Or shelter? Orhealth care? Or job security? Or self-confidence? Are they free from caste andgender discrimination? Is the practice ofchild labour still common? Worldwideexperience shows that with development,the definition of what constitutes povertyalso changes. Eradication of poverty isalways a moving target. Hopefully we willbe able to provide the minimum“necessary” in terms of only income to allpeople by the end of the next decade. Butthe target will move on for many of thebigger challenges that still remain:providing health care, education and jobsecurity for all, and achieving genderequality and dignity for the poor. Thesewill be even bigger tasks.
Exercises
1. Describe how the poverty line is estimated in India.2. Do you think that present methodology of poverty estimation is appropriate?3. Describe poverty trends in India since 1973.4. Discuss the major reasons for poverty in India.5. Identify the social and economic groups which are most vulnerable to poverty
in India.6. Give an account of interstate disparities in poverty in India.7. Describe global poverty trends.8. Describe current government strategy of poverty alleviation.9. Answer the following questions briefly
(i) What do you understand by human poverty?(ii) Who are the poorest of the poor?(iii) What are the main features of the National Rural Employment
Guarantee Act 2005?
Poverty as a Challenge 41
ReferencesDEATON, ANGUS AND VALERIE KOZEL (Eds.) 2005. The Great Indian Poverty Debate.
MacMillan India Limited, New Delhi.
Economic Survey 2002–2003. Ministry of Finance, Government of India, New Delhi.(Chapter on social sectors, [Online web] URL: http://indiabudget.nic.in/es_2002–03/social.htm)
Economic Survey 2004–2005. Ministry of Finance, Government of India, New Delhi.(Chapter on social sectors, [Online web] URL: http://indiabudget.nic.in/es_2004–05/social.htm)
Mid-Term Appraisal of the Tenth Five Year Plan 2002–2007. Planning Commission,New Delhi. Part II, Chapter 7: Poverty Elimination and Rural Employment,[Online web] URL: http://www.planningcommission.nic.in/midterm/english-pdf/chapter-07.pdf
National Rural Employment Guarantee Act 2005. [Online web] URL: http://rural.nic.in/rajaswa.pdf
Tenth Five Year Plan 2002–2007. Planning Commission, New Delhi. (Chapter 3.2,Poverty Alleviation in Rural India: Strategy and Programmes, [Online web] URL:http://www.planningcommission.nic.in/plans/planrel/fiveyr/10th/volume2/v2_ch3_2.pdf
World Development Report 2000–2001. Attacking Poverty, The World Bank, OxfordUniversity Press, Delhi.