chapter overview getting started eographers use many
TRANSCRIPT

19CHAPTER 2: MAPS AND MAPPING18 PEARSON geography 7
GLOSSARY
aspect the direction that a slope faces
cartographer a person who draws maps
contour the difference in height between two
interval contour lines on a map
contour lines lines on a map that join places of equal
height above sea level
density the population or number of objects per
unit of area
distribution the spread or arrangement of geographical
features on the earth’s surface
elevation the height of a point or place above
sea level
legend the part of a map that explains the
meaning of the symbols used in the map;
sometimes referred to as the key
location the position of a feature or place on the
earth’s surface
meridians of imaginary lines drawn around the
longitude earth from north to south
parallels of imaginary lines drawn around the earth
latitude from west to east, parallel to the Equator
relief a general term describing the shape of the
land, including height and steepness
scale the relationship between the distance
between two points on a map and the
actual distance on the earth’s surface
spot height the exact altitude or height above sea level
of a point on the earth’s surface
thematic map a map designed to illustrate a particular
theme; for example, annual rainfall or the
location of oil resources
topographic map a detailed, large-scale map illustrating
selected features of the physical
environment
topography the geographical features or landforms
of an area
Geographers use many different tools and skills to investigate the world in which we live. Maps are among the most important of these tools.
A map is a representation of the whole, or a part, of the earth’s surface. Increasingly, maps are stored in electronic form and can be read on computer monitors, mobile phone screens and in-car navigation systems. The people who make maps are called cartographers.
In this chapter we learn about topographic maps and atlas maps, and their principal elements: latitude and longitude, grid references and area references.
KEY IDEAS• To know the various types of maps and the
conventions used in their construction
• To know the elements of maps
• To understand scale
• To master the skills involved in using topographic maps and atlas maps
MAPS AND MAPPING
CHAPTER
2
Image taken using a hand-held 3-D mapping
laser, Zebedee
2.0
18 PEARSON geography 7 Teacher Companion 19CHAPTER 2: MAPs And MAPPing
Getting startedMI: visual–spatial, verbal–linguistic, logical–mathematical, interpersonal, intrapersonal
Why are geographical skills important in everyday life? Give students 1–2 minutes to write down or think about the question on their own. Students then pair up and discuss the question. Students can share their ideas by putting them on the whiteboard or creating a poster to display in the room.
EAL/D supportVocabulary assistanceTo help students become familiar with the glossary listed on this page, have them work in pairs to set up and play a game of ‘memory’. In pairs, students write all of the glossary terms onto separate pieces of card, then do the same for each definition. Once this is complete, students randomly place all cards face down on a desk. Students take turns revealing two cards at a time. If they turn over a word and its matching definition, they keep the two cards. If not, they turn the cards back over for the next person’s turn. The winner is the person who has collected the most cards at the end of the game.
ChAptEr oVErVIEw
what’s coming upThis chapter allows students to develop the skills and tools needed to use and understand maps. Students will:
• study various types of maps• learn why BOLTSS (border, orientation,
legend, title, scale and source) is an important cartographical acronym
• acquire skills such as area and grid referencing
• discuss latitude and longitude• learn how to read a topographic map• become familiar with spatial technologies.
pre-quizStudents create a list of different maps they have seen or used. The types of maps that students may have encountered include those found online, on television, and in atlases, magazines, brochures, travel guides and advertisements. Students then respond to the following:
1 Describe how you have used one of these maps.Student’s individual response.
2 Create a list of some characteristics that all good maps have.Consistent symbols, colours/shading and BOLTSS.
3 In your own words, explain ‘scale’ and why it is so important in Geography.Scale denotes the proportional relationship between the representation of an object or place and its actual size. For example, an accurate scale on a map helps to represent the distance between two points on a map relative to their actual distance on the earth’s surface. An accurate scale is important because it allows you to calculate the distances that a map represents on the earth’s surface.
4 Recall some symbols that you have seen or used on a map, such as railway lines, roads, windmills, rivers or dams. See Figure 2.1 for some examples.
Using the imageThe chapter opening image shows a 3D image created by Zebedee, which is a handheld 3D mapping laser. To create a 3D map, a lightweight scanner is used to map places that are difficult to access, such as underground, indoor and outdoor areas. Zebedee is a creation of the CSIRO. Students need to focus on the map and answer the following questions.
1 How does this type of map differ from a traditional type of map?
2 What are the benefits of this type of map? 3 List the different ways you could use a
3D map.
These questions can be discussed when students learn about the different types of maps.
PEARSON geography 7 RESOuRCES
Pearson Reader and eBookDocumentsTeaching program: Chapter 2
Interactive activitiesMappingTypes of mapsGrid and area referencesMappingTopographic mapsTypes of maps
TemplatesGraphic organisersBlank outline maps
Web destinations
PearsonGeog-7TC-Ch02-4pp.indd 18-19 20/09/13 3:44 PM
Sample
page
s

24 PEARSON geography 7 25CHAPTER 2: MAPS AND MAPPING
You can locate places easily on a map by using the map’s grid lines. On a topographic map, vertical grid lines are called eastings because they increase in value as you move eastwards. Horizontal grid lines are called northings because they increase in value as you move northwards.
Grid and area references2.3
Grid referencesYou can locate features on maps by using a six-figure
grid reference (GR). The first three digits refer to the
eastings and the last three digits refer to the northings
shown in Figure 2.7a–b. Each set of three digits is
referred to as a coordinate. The first two digits of each
coordinate refer to the eastings and northings that
surround the map. The third digit needed to complete
each coordinate is obtained by dividing each easting
and each northing into tenths. In Figure 2.7c, point A
is located at GR 335638.
2.9 Map extract: grid and area references
2.8 Finding area references
Area referencesFeatures such as a small lake, quarry or village are
usually located by means of a four-figure area reference
(AR). To find the AR of a feature, use the coordinates of
the lower left-hand corner of the grid square in which
the feature is located. As in grid references, eastings
come before northings in area references. In Figure 2.8,
the quarry is located in AR 3265.
Knowledge and understanding 1 Explain the difference between eastings and
northings.
Geographical skills 2 Study Figure 2.9, then answer the following
questions.a Identify the feature located at each of the
following grid references. i GR 028548 ii GR 039580 iii GR 032567 iv GR 019553
b What is the grid reference of the following features? i Swan Hill ii bridge iii boat ramp iv Smith’s Farm
c What type of vegetation is found in: i AR 0256 ii AR 0154?
d What is the elevation of Smith’s Farm?e What is the height of Swan Hill?f What is the direction of the lighthouse
from Swan Hill?
ACTIVITIES
Eastings and northings2.7
a
b
33
65 65
64 64
63 63
33
34
34
35
35
These lines are called eastings. They increase in value as you move east.
These lines are called northings. They increase in value as you move north.
Contour interval: 10 m
2.3
c
24 PEARSON geography 7 Teacher Companion 25CHAPTER 2: MAPs And MAPPing
Activity answers
Knowledge and understanding 1 Northings are horizontal and eastings
are vertical.
Geographical skills 2 a i Shipwreck
ii Lighthouseiii Surf Clubiv Pelican Island
b i 002562ii 023562iii 022555iv 019576
c i Mangroves and swampii Pine forest
d 20 metrese 65 metresf North-east
Geographical inquiry and skillsGeoskillsTreasure island
MI: visual–spatial, verbal–linguistic, logical–mathematical, interpersonal
This activity is designed to reinforce some of the geographical skills covered in Units 2.1 and 2.2.
Students create a map of an island and write a set of instructions that, when used in conjunction with the map, show the location of buried treasure.
1 Using an A3 sheet of paper (landscape), students draw up a 20 × 30 centimetre table.
2 Have students draw a 2-centimetre grid over the entire 20 × 30 centimetre table.
3 Students work out an appropriate scale. Refer them to all of the features they need to include on their map and what an appropriate scale may be, such as 2 centimetres equalling 20 kilometres.
4 Students include the following features on their map, using the appropriate map symbols:• village • roads• railway line • railway station• airport • hotel• pier • swamp • forest • river• lake • school• police station • fire station• beach.
Students should complete a rough draft before producing the final document. Remind students to apply the elements of the BOLTSS acronym (border, orientation, legend, title, scale and source) to their final draft.
5 To accompany their map, students write a set of instructions to find the buried treasure on their island. The instructions must include at least ten clues that lead to the buried treasure. The clues should be based on a combination of distance, direction and grid-referencing information.
6 When they have completed the treasure hunt instructions, students swap their maps with a partner. Can students find the buried treasure on their partner’s map?
Geographical knowledge and understandingEvaluate understandingVenn diagrams
MI: visual–spatial, verbal–linguistic, interpersonal
Venn diagrams are a great way to allow students to compare and contrast information in a visual format. Where the two circles in the diagram overlap, students
note the similarities. In the outer sections of the circles, students list the unique characteristics (differences) of each topic or element.
Provide students with a blank outline of a Venn diagram. Students list the similarities and differences between area referencing and grid referencing. When they have completed this task, students share their results in groups or with a partner in order to compare their work and add more detail to their own Venn diagrams.
EAL/D supportGeographical conceptsIt’s important for EAL/D students to grasp the geographical concept of space and the idea of area references. One way to revise this topic is to set up and play a version of the children’s board game ‘battleships’. Use the following instructions to help students play the game in class.
1 Divide the class into pairs. Have students draw up a 10 × 10 grid on two different pieces of paper.
2 Students label the axes on each grid and draw six battleships on the first grid. They should draw one battleship that covers three spaces, two that cover two spaces and three that cover one space. They can place their battleships either horizontally or vertically anywhere on their grid. However, each grid cell can only be used for one boat (boats cannot overlap each other).
3 Tell students that their second grid is a blank map of their opponent’s battleship area. Students can then take
it in turns to guess the grid references of their opponent’s ships. If there is a ship located in the grid reference guessed, their opponent must say ‘hit’. If there is no ship in the reference, the opponent says ‘miss’. Students record their hits and misses on the blank grid reference. Students get one guess for each turn.
4 Once a student has correctly guessed the grid references for each part of a ship, the other player must say ‘sunk’. The first student to sink all of their opponent’s ships wins the game.
PearsonGeog-7TC-Ch02-4pp.indd 24-25 20/09/13 3:44 PM
Sample
page
s
Skillsbuilder support
Hints and suggestionsIt takes time and patience to teach students how to measure areas using scale. To start, mock up an A4-sized map similar to Figure 2.3a. Place a 1-kilometre grid over the feature you have drawn so that students can easily add up the ticks in the squares and calculate the area of the feature. Do a couple of examples or ask students to draw a map of their own and swap with a partner. Each mock-up map must have a linear scale, where 1 centimetre represents 1 kilometre.
Applying skillsProvide a topographic map with a distinctive feature on it, such as a lake, forested region, large dam or area under irrigation. Students will find it more difficult simply because it will be more complicated than their own topographic map. Allow them more time to do the measurements on a real topographic map.
2265
64
63
62
61
60
65
64
63
62
61
60
23
80
60
40
20
20
40
6080
100 120
24
Legend
B
A
C
25 26 27 28
22 23 24 25
83
26 27 28
0 1 2 km
Contour interval 20 m
Contours
Road
Bridge
Lake
Wetland
Shipwreck
2040
Building
Pine plantation
Orchard
N
Cree
k
1 km 0 1 2 3 4
Cree
k
1 km 0 1 2 3 4
Cree
k
1 km 0 1 2 3 4
Use a pencil topivot or turnthe paper
Cree
k
1 km 0 1 2 3 4
Set the pointsof the dividerto 5 mm or 1 cm
Cree
k
1 km 0 1 2 3 4
Cree
k
1 km 0 1 2 3 4
Cree
k
1 km 0 1 2 3 4
Use a pencil topivot or turnthe paper
Cree
k
1 km 0 1 2 3 4
Set the pointsof the dividerto 5 mm or 1 cm
Cree
k
1 km 0 1 2 3 4
Cree
k
1 km 0 1 2 3 4
Cree
k
1 km 0 1 2 3 4
Use a pencil topivot or turnthe paper
Cree
k
1 km 0 1 2 3 4
Set the pointsof the dividerto 5 mm or 1 cm
Cree
k
1 km 0 1 2 3 4
Cree
k
1 km 0 1 2 3 4
Cree
k
1 km 0 1 2 3 4
Use a pencil topivot or turnthe paper
Cree
k
1 km 0 1 2 3 4
Set the pointsof the dividerto 5 mm or 1 cm
28 PEARSON geography 7 29CHAPTER 2: MAPS AND MAPPING
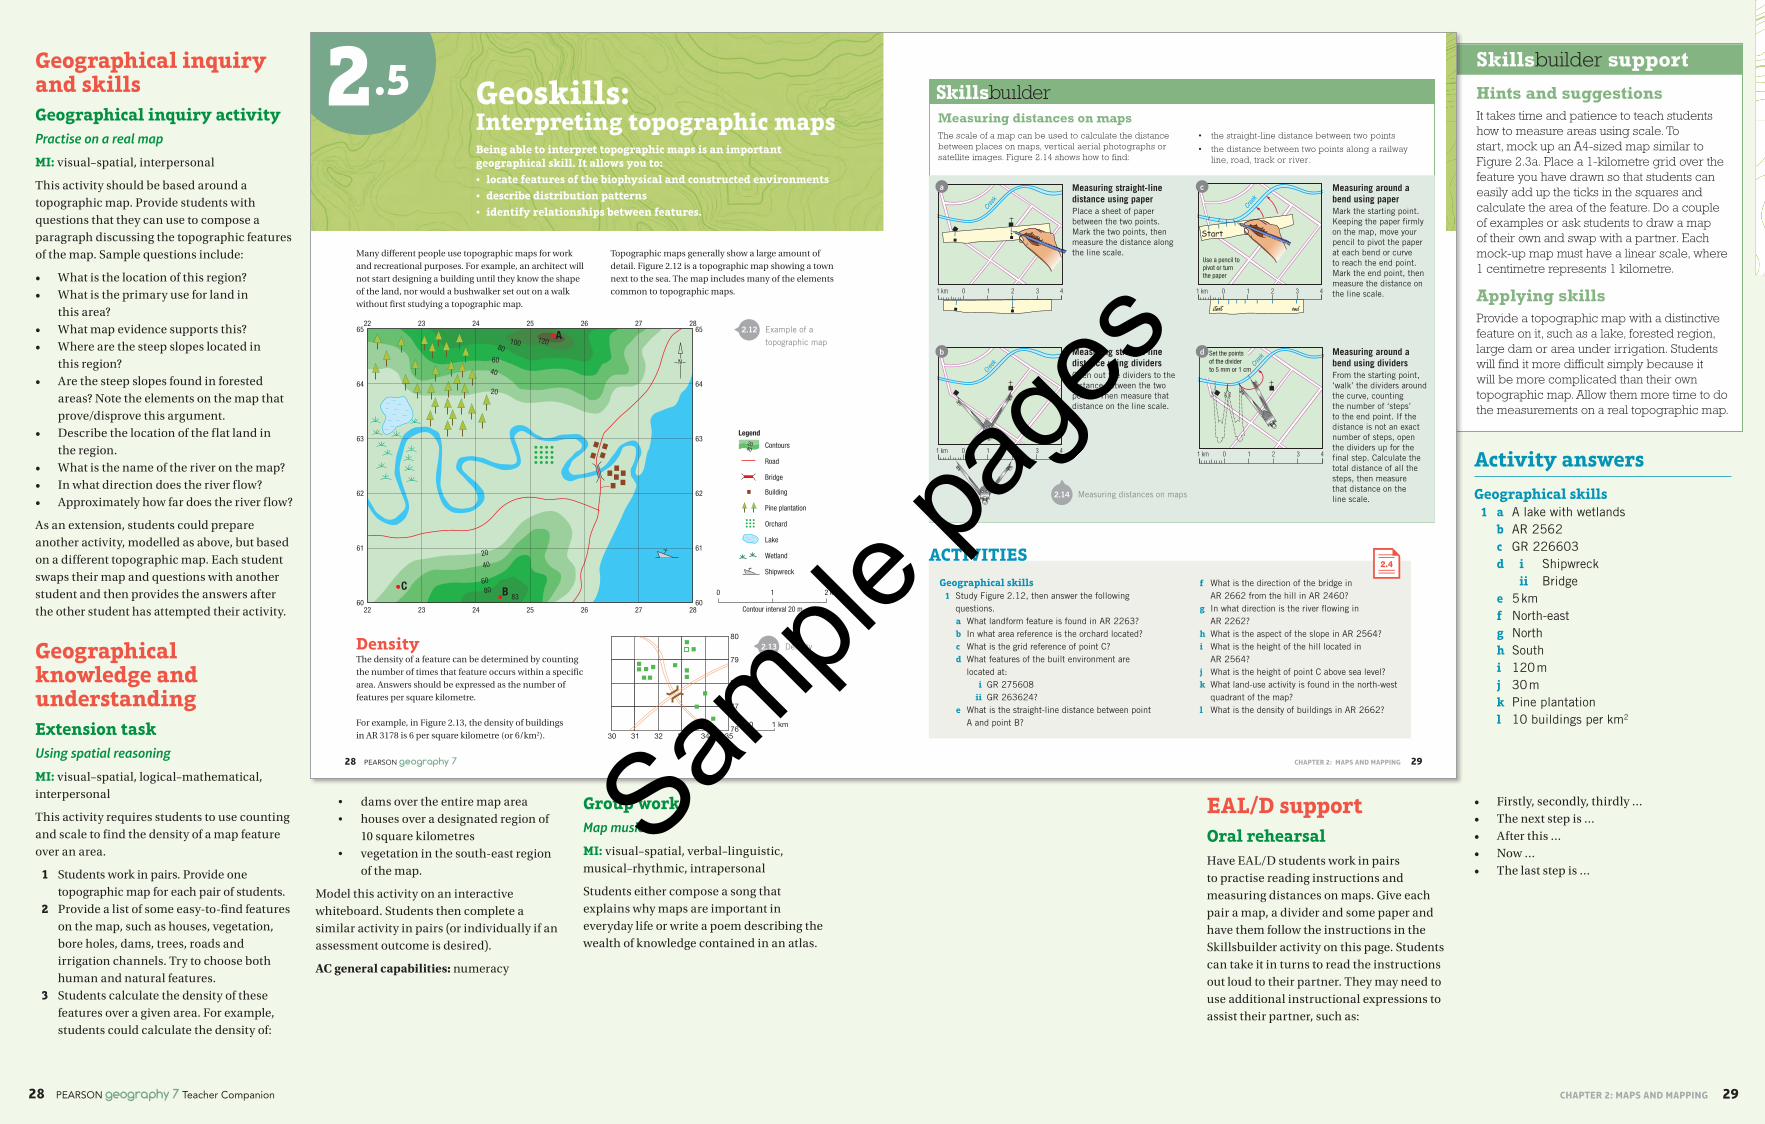
Being able to interpret topographic maps is an important geographical skill. It allows you to:• locate features of the biophysical and constructed environments• describe distribution patterns• identify relationships between features.
Geoskills:Interpreting topographic maps
2.5
2.12 Example of a
topographic map
2.14 Measuring distances on maps
Geographical skills 1 Study Figure 2.12 , then answer the following
questions.a What landform feature is found in AR 2263?b In what area reference is the orchard located?c What is the grid reference of point C?d What features of the built environment are
located at: i GR 275608 ii GR 263624?
e What is the straight-line distance between point A and point B?
f What is the direction of the bridge in AR 2662 from the hill in AR 2460?
g In what direction is the river flowing in AR 2262?
h What is the aspect of the slope in AR 2564?i What is the height of the hill located in
AR 2564?j What is the height of point C above sea level?k What land-use activity is found in the north-west
quadrant of the map?l What is the density of buildings in AR 2662?
ACTIVITIES
Measuring distances on mapsThe scale of a map can be used to calculate the distance between places on maps, vertical aerial photographs or satellite images. Figure 2.14 shows how to find:
• the straight-line distance between two points
• the distance between two points along a railway line, road, track or river.
Measuring straight-line distance using paperPlace a sheet of paper between the two points. Mark the two points, then measure the distance along the line scale.
Measuring straight-line distance using dividersOpen out the dividers to the distance between the two points. Then measure that distance on the line scale.
Measuring around a bend using paperMark the starting point. Keeping the paper firmly on the map, move your pencil to pivot the paper at each bend or curve to reach the end point. Mark the end point, then measure the distance on the line scale.
Many different people use topographic maps for work
and recreational purposes. For example, an architect will
not start designing a building until they know the shape
of the land, nor would a bushwalker set out on a walk
without first studying a topographic map.
Topographic maps generally show a large amount of
detail. Figure 2.12 is a topographic map showing a town
next to the sea. The map includes many of the elements
common to topographic maps.
a
b
c
d Measuring around a bend using dividersFrom the starting point, ‘walk’ the dividers around the curve, counting the number of ‘steps’ to the end point. If the distance is not an exact number of steps, open the dividers up for the final step. Calculate the total distance of all the steps, then measure that distance on the line scale.
DensityThe density of a feature can be determined by counting
the number of times that feature occurs within a specific
area. Answers should be expressed as the number of
features per square kilometre.
For example, in Figure 2.13, the density of buildings
in AR 3178 is 6 per square kilometre (or 6/km2).
80
79
78
77
7630 31
0 1 km
32 33 34 35
2.13 Density
2.4
28 PEARSON geography 7 Teacher Companion 29CHAPTER 2: MAPs And MAPPing
Activity answers
Geographical skills 1 a A lake with wetlands
b AR 2562c GR 226603d i Shipwreck
ii Bridgee 5 kmf North-eastg Northh Southi 120 mj 30 mk Pine plantationl 10 buildings per km2
Geographical inquiry and skillsGeographical inquiry activityPractise on a real map
MI: visual–spatial, interpersonal
This activity should be based around a topographic map. Provide students with questions that they can use to compose a paragraph discussing the topographic features of the map. Sample questions include:
• What is the location of this region?• What is the primary use for land in
this area?• What map evidence supports this?• Where are the steep slopes located in
this region?• Are the steep slopes found in forested
areas? Note the elements on the map that prove/disprove this argument.
• Describe the location of the flat land in the region.
• What is the name of the river on the map?• In what direction does the river flow?• Approximately how far does the river flow?
As an extension, students could prepare another activity, modelled as above, but based on a different topographic map. Each student swaps their map and questions with another student and then provides the answers after the other student has attempted their activity.
Geographical knowledge and understandingExtension taskUsing spatial reasoning
MI: visual–spatial, logical–mathematical, interpersonal
This activity requires students to use counting and scale to find the density of a map feature over an area.
1 Students work in pairs. Provide one topographic map for each pair of students.
2 Provide a list of some easy-to-find features on the map, such as houses, vegetation, bore holes, dams, trees, roads and irrigation channels. Try to choose both human and natural features.
3 Students calculate the density of these features over a given area. For example, students could calculate the density of:
• dams over the entire map area• houses over a designated region of
10 square kilometres• vegetation in the south-east region
of the map.
Model this activity on an interactive whiteboard. Students then complete a similar activity in pairs (or individually if an assessment outcome is desired).
AC general capabilities: numeracy
EAL/D supportoral rehearsalHave EAL/D students work in pairs to practise reading instructions and measuring distances on maps. Give each pair a map, a divider and some paper and have them follow the instructions in the Skillsbuilder activity on this page. Students can take it in turns to read the instructions out loud to their partner. They may need to use additional instructional expressions to assist their partner, such as:
• Firstly, secondly, thirdly …• The next step is …• After this …• Now …• The last step is …
Group workMap music
MI: visual–spatial, verbal–linguistic, musical–rhythmic, intrapersonal
Students either compose a song that explains why maps are important in everyday life or write a poem describing the wealth of knowledge contained in an atlas.
PearsonGeog-7TC-Ch02-4pp.indd 28-29 20/09/13 3:44 PM
Sample
page
s

2000 and over1000 and over500-1000250-500Less than 250
Mean annual rainfall (millimetres)
0 500 1000 km
Darwin
Brisbane
Tropic of Capricorn
SydneyPerth
Hobart
CanberraAdelaide
Melbourne
Alice Springs
Approximate scale
N
SydneyCanberra
Hobart
N
Adelaide
Alice Springs
Perth
36
30
24
18
18˚12
6
0
Mean daily maximum temperature(degrees Celsius)
Isotherm
Prevailing wind direction
0 500 km
Brisbane
Melbourne
Darwin
Tropic of Capricorn
30 PEARSON geography 7 31CHAPTER 2: MAPS AND MAPPING
An atlas is a collection of maps. These maps show physical features, human features or a mixture of both. Atlases also contain world maps and regional maps showing particular themes, such as climate or wealth.
Atlas maps2.6
Types of maps In an atlas there are usually maps of each continent;
more detailed maps of regions, showing particular
countries; and even more detailed maps of smaller
areas, such as cities. Cities are usually shown on maps
using dot symbols. Often, different symbols are used to
indicate cities of different sizes or a capital city.
There are also many special atlases available. These
atlases contain maps linked to a particular place or to a
theme such as population and land use. Atlases can be
viewed in print form and in electronic form. Advances
in computer technology mean that electronic atlases are
becoming increasingly sophisticated and interactive.
Physical and human features mapsThe maps in an atlas are often labelled with human
(cultural and political) features such as boundaries,
countries and cities. Physical (natural) maps show
features such as rivers, mountains, plains and lakes.
Thematic mapsAtlases contain maps that illustrate particular themes.
These maps may show, for example, the annual rainfall,
the distribution of ethnic groups or the oil resources of
a region or the whole world. Figure 2.15 is a thematic
map showing Australia’s average daily maximum
temperatures.
2.15 Thematic map of Australia showing
average daily maximum temperatures
Sketch mapsSketch maps (or précis maps, as they are sometimes
called) can be made from any map. A sketch map may
be a simple map showing where you live or it may be a
more complex map that includes a number of features.
An example of a sketch map is shown in Figure 2.16.
Sketch maps don’t try to show every feature of the
landscape. On a sketch map, the scale can only be
approximate, but it is an important feature to include
on your map. This is because you need to give an idea
of the distance between places and the area covered by
features. On sketch maps, notes can be added to identify
and explain particular features.
Contents page and indexIf you want to find a general area, such as North
America, or a theme, such as population, you should
use the contents page of your atlas. If you want to find a
particular place, such as a town or a mountain, the index
at the back of your atlas will be most useful.
Every place that is shown on a map in an atlas is listed in
the index. Places are usually listed in alphabetical order,
like words in a dictionary. This allows you to locate
places and features quickly and accurately.
2.16 A sketch map of Australia’s annual rainfall
Knowledge and understanding 1 Copy and complete the following table.
Map type Features shown Use
Physical
Political
Thematic
Geographical skills 2 Which kind of atlas map (physical, human
or thematic) would be the best source of information on the following?a the capital cities of Europeb the names of Indonesia’s main islandsc the boundaries of countries in South Americad the political divisions of Africae the population density of North Americaf the landform features of Europeg the temperature patterns of Australia and
New Zealand
ACTIVITIES
Source: Heinemann Atlas Fifth Edition
30 PEARSON geography 7 Teacher Companion 31CHAPTER 2: MAPs And MAPPing
Geographical knowledge and understandingEvaluate understandingKWL atlas chart
MI: visual–spatial, verbal–linguistic, logical–mathematical, intrapersonal
A KWL chart (what I know, what I want to know, and what I have learnt) is a three-column table that summarises a student’s prior knowledge, what they would like to know, and what they have learnt.
Students create a KWL chart and list the types of maps in their atlas that they have not seen or used before. Students should fill out the ‘L’ part of the chart at the end of the lesson.
AC general capabilities: critical and creative thinking skills
Quick fiveUsing your atlas
MI: visual–spatial, verbal–linguistic, logical–mathematical, intrapersonal
As a class, students brainstorm a list of the ways they might use an atlas. Ideas might include planning holidays, researching current affairs and learning about other subjects, such as history.
Geographical inquiry and skillsGeographical inquiry activityConnections between maps
MI: visual–spatial, verbal–linguistic, logical–mathematical
For this question, students refer to Figures 2.15 and 2.16.
1 Describe the temperature and rainfall in July in the following cities:a Alice Springs b Darwin c Melbourne d Hobart e Perth.
Activity answers
Knowledge and understanding 1 Map
typeFeatures shown Use
Phy
sica
l
Landforms, vegetation types, rivers, mountains, lakes
To study the landform and environment of a particular country or area
Pol
itica
l
Borders, capital cities, towns, country names
For the purposes of global geo-politics
Them
atic Information
relating to a ‘theme’, such as annual rainfall, average temperature or vegetation growth
To study a single theme (such as climate) and assess how this affects vegetation growth
Geographical skills 2 a Human
b Humanc Humand Humane Thematicf Physicalg Thematich Thematic
EAL/D supportVocabulary assistanceKey words appear on the maps on these pages. EAL/D students may benefit from an explanation of certain terms for each figure:
Figure 2.15:• Mean daily maximum temperature:
The average top temperature each day (the average is the sum of a list of temperatures which is then divided by how many temperatures are in the list).
• Isotherm: A line on a map connecting points that have the same temperature.
• Prevailing wind direction: A wind that mostly blows from a single general direction.
Figure 2.16:• Mean annual rainfall (millimetres):
The average number of millimetres of rain that falls each year.
• Approximate scale: A guess/estimate of the scale, although it may not be completely accurate.
• Tropic of Capricorn: One of the three most important lines of latitude that circle the earth (the other two are the Equator and the Tropic of Cancer).
PearsonGeog-7TC-Ch02-4pp.indd 30-31 20/09/13 3:44 PM
Sample
page
s

Skillsbuilder support
Hints and suggestionsTeaching and learning about latitude and longitude can be a fun exercise for students who are beginning to understand this important geographical skill. Thanks to previous units on area and grid referencing, students have already learnt how to pinpoint specific locations on the globe using latitude and longitude builds. Some tips for teaching latitude and longitude are as follows:
• Take a globe into the classroom. This provides students with a model to reference as you describe how the world is divided into the Northern and Southern hemispheres by the Equator and the Eastern and Western hemispheres by the Prime Meridian and the IDL. Demonstrate how latitude and longitude work together to pinpoint a specific location.
• Use an alphabetical clue to help students remember that the latitude coordinate is read before the longitude coordinate: the ‘A’ in latitude is before the ‘O’ in longitude, therefore latitude is read before longitude.
• When introducing students to degrees and minutes, take things slowly. A useful approach is to show an enlarged map on the data projector or interactive whiteboard, with latitude and longitude lines clearly marked. You could then draw in the sixty minutes that make up each degree.
Applying skillsDirect students to a world map or atlas, which they use to complete the activities below.
1 Name the cities located at the following coordinates:• 51°30´N 0°07´W
London• 35°19´S 149°09´E
Canberra• 0°19´N 32°35´E
Kampala• 33°56´S 18°28´E
Cape Town• 38°54´N 77°01´W
Washington D.C.
2 List the coordinates for the following cities:• New Delhi
28°37´N 77°13´E • Ulaanbaatar
47°54´N 106°52´E • Rabat
34°02´N 6°51´W • Jakarta
6°08´S 106°45´E • Suva
18°08´S 178°25´E
North Pole(90°N)
Arctic Circle
Prime Meridian or Greenwich Meridian
Parallels of latitude
Tropic of Cancer
Equator
Meridians of longitude
Tropic ofCapricorn
South Pole (90°S)
Latitude is always found and written before longitude—e.g. Luanda, Angola is 8°50'S 13°15'E
66½°N
23½°N
0°
23½°S
30°W 0° 30°E
60°W 60°E
Western Hemisphere: areas west of the Prime Meridian to 180°
North Pole
Prime Meridian or Greenwich Meridian
International Date Line (180°)
Meridiansof longitude
0° 30°E60°E
30°W
60°W
South Pole
Equator
Eastern Hemisphere: areas east of the Prime Meridian to 180°
North Pole (90°N)
Arctic Circle
Parallels of latitude
Tropic of Cancer
Equator
Tropic of Capricorn
South Pole (90°S)
66½°N
23½°N
0°
23½°S
Northern Hemisphere:areas north of the Equatorto the North Pole
Southern Hemisphere:areas south of the Equatorto the South Pole
Luanda
32 PEARSON geography 7 33CHAPTER 2: MAPS AND MAPPING
Most of the maps you will use in your study of Geography include lines of latitude and longitude. These allow you to quickly and accurately locate places and features on the earth’s surface.
Latitude and longitude2.7
LatitudeLines of latitude (see Figure 2.17) are imaginary lines
that run in an east–west direction around the earth.
Because lines of latitude are parallel to each other,
they are often referred to as parallels of latitude.
The most important line of latitude is the Equator (0°).
The Equator divides the earth into two halves: the
Northern and Southern hemispheres. All other lines
of latitude are either north or south of the Equator.
LongitudeLines of longitude (see Figure 2.18) run in a north–south
direction. They are not parallel to one another; they all
converge, or meet, at the North and South poles. Any
number of these lines can be drawn. These imaginary
lines are called meridians of longitude.
The most important line of longitude is the Prime
Meridian (0°), which passes through Greenwich
Observatory in London, United Kingdom. All other lines
of longitude are located either to the east or to the west
of the Prime Meridian. The International Date Line
2.17 Lines of latitude
2.18 Meridians of longitude 2.20
2.19 Latitude and longitude
A map extract of Japan, showing latitude and longitude, and features of the biophysical and built environments
(IDL), is on the opposite side of the world, at 180°. There
is a change of day at the IDL. The Prime Meridian and
the IDL divide the earth into two halves: the Western
and Eastern hemispheres.
Knowledge and understanding 1 Define the terms ‘parallel of latitude’ and ‘meridian
of longitude’. 2 Explain the difference between parallels of latitude
and meridians of longitude. 3 Describe the location and significance of the
Prime Meridian and the International Date Line.
Geographical skills 4 a Study Figure 2.20. Name the feature of the
physical environment located at each of the sets of coordinates below. i 36°05'N 133°00'E ii 42°30'N 132°00'E
iii 35°23'N 138°42'E iv 38°20'N 138°30'E v 41°20'N 140°15'E vi 42°N 129'E vii 33°30'N 135°45'E
b Study Figure 2.20. Name the feature of the human environment found at each of the following locations. i 35°40'N 139°45'E ii 34°23'N 132°27'E iii 31°00'N 130°30'E iv 38°15'N 140°52'E v 43°05'N 141°21'E vi 35°02'N 135°45'E
ACTIVITIES
Finding places using latitude and longitudeIf you are given the latitude and longitude of a place and asked to identify it, follow the steps below.
1 Using a world map, find the general location of the latitude and longitude you have been given.
2 Turn to a map of the region or continent, and locate the latitude and longitude more accurately.
3 Check your answer by finding the placename in the index of the atlas. Most atlas indexes include the latitude and longitude of each place.
Kobe, Japan (see Figure 2.20), for example, has a latitude of approximately 35° north of the Equator and a longitude of approximately 135° east of the Prime Meridian. To be even more accurate, each degree (°) can be divided into smaller units, called minutes ('). There are 60 minutes in each degree. Kobe’s location using degrees and minutes is latitude 34°40' north, longitude 135°12' east.
Latitude and longitudeTogether, lines of latitude and longitude form a grid
that allows you to pinpoint places on the earth’s surface
(see Figure 2.19).
40ºN
35ºN
130ºE 135ºE 140ºE
Source: Heinemann Atlas Fifth Edition
32 PEARSON geography 7 Teacher Companion 33CHAPTER 2: MAPs And MAPPing
Geographical knowledge and understandinghelpful hintLatitude
MI: visual–spatial, verbal–linguistic
Latitude relates to the imaginary lines that run in an east–west direction around the earth. The most important of these lines is the Equator (0°), which divides the world into the Northern and the Southern hemispheres.
Longitude
MI: visual–spatial, verbal–linguistic
Longitude relates to the imaginary lines that run in a north–south direction around the earth. The most important of these lines is the Prime Meridian (0°), which passes through Greenwich Observatory in London, United Kingdom, and divides the world into the Eastern and Western hemispheres. The International Date Line (IDL) is on the opposite side of the world, at 180°.
EAL/D supportVocabulary assistanceThe following quick tricks may help EAL/D students remember the difference between lines of latitude and longitude:
• Latitude is like a belt (horizontal). Longitude is like a pair of suspenders (vertical).
• When you say ‘latitude’ out loud, your mouth stretches side to side (horizontal). When you say ‘longitude’ your mouth stretches up and down (vertical).
• Latitude rhymes with ‘flatitude’ because the horizontal lines are flat. Longitude lines are long.
• Students can visually represent latitude and longitude lines by drawing the lines and directions on a paper plate (used to represent earth).
Activity answers
Knowledge and understanding 1 The term ‘parallel of latitude’ relates
to the imaginary lines that run in an east–west direction around the earth. The term ‘meridian of longitude’ refers to the lines that run in a north–south direction around the earth, converging at the North and South poles.
2 Parallels of latitude run east–west and do not converge at any point. In contrast,
meridians of latitude run north–south and converge at the North and South poles.
3 The Prime Meridian runs through Greenwich, London, United Kingdom. It is the point from which other meridians of longitude are determined. The International Date Line is on the opposite side of the globe to the Prime Meridian and marks a new calendar day. Together, these two lines of longitude divide the earth into the Western and Eastern hemispheres.
Geographical skillsTeach students how to enter the coordinates listed in the student book into an online GIS tool, such as Google Maps. An example of how to successfully enter coordinates is shown in the following table.
Location Latitude/longitude
Google Earth input
Island of Hawaii
19°35'47.52"N155°34'06.43"W
19 35' 47.52"N 155 34' 06.43"W
4 a i Chugoku Mountainsii Peter the Great Bayiii Mt Fujiiv Sado Islandv Cape Shiriyavi Changbai Mountainsvii Uchiura Bay
b i Tokyo/Yokohamaii Hiroshimaiii Pyongyangiv Seoulv Sapporovi Kyoto
PearsonGeog-7TC-Ch02-4pp.indd 32-33 20/09/13 3:44 PM
Sample
page
s