chapter one - arab academy for science, technology...
TRANSCRIPT

1
Chapter one

2
1.1 Introduction
The Market is continuing a period of dynamic change. To achieve a change in its business
environment, each party in supply chain need to understand customer requirements. This is
critical point to establishing and maintaining a competitive advantage in the market place.
Thus, Retailers are considered one of the most important customers in the supply chain, it's
important to determine their needs and how to deal with them, there are a number of
challenges that face retail management such as retaining customer responsiveness keeping
in touch and supplier relationships (Dawson, 2001) every service experience is a new
interaction with customers. For the customer, it is the people who are delivering the
services who are usually thought of as the “supply company”. Every service depends on
the context in which is delivered – time and place. All these aspects are subject to
changeability leads to inconsistent in the service that received by customers. The particular
nature of service organizations deals with the influences of the dimensions of perceived
quality, this research will measure the impact of logistics service quality dimensions
provided by supplier's retailers relationship quality based on (Palmer, 2003).
1.2 Historical background about Retailing
The retail industry is the last step in the process of getting products to customers
efficiently, and should not be confused with the wholesale activities which come first.
Wholesale establishments play an important role for retail establishments, as they generally
provide retailers with the resources they need to run their business in addition to the goods
and products they sell. The history of retail Industry began in the early 18th century in the
United States which was limited to general stores only, while specialty stores were located
only in areas with more than 5,000 populations. After the World War II, supermarkets
started to open in US and Canada. Currently, retail business has been growing fast all over
the world; the retail industry has changed greatly in the last two decades. it is increasingly

3
more common to see people doing their shopping in large mass merchandise stores,
specialty stores, or online.1 It used to be comprised of a wealth of small, often family-
operated shops, department stores, and shopping malls.2
For the producers the role of the retailer grew since the 70's, from a simple distributor to a
partner (Zentes, Janz, Morschett, 2005). Due to the transformation of production markets
to customer demand markets, (Omar 1999) defined Retail as “any business that directs its
marketing efforts towards satisfying the final consumer based upon the organisation of
selling goods and services as a means of distribution”.Marketing is consider the first reason
that retailing appearance ,retailing is a part from marketing that support customer needs ,to
make them satisfy, there are many functions that retailers will not be able to accomplished
their jobs without supporting from marketing (Collect information, Make operational
decisions, Implement operational strategy, Manage store operations, Manage human
resource and Manage store-level resources),the conclusion of the relationship between
marketing and retailing is that Retailing is selling the products and services from one
particular point and marketing is creating the demand for the products and services and
then selling them in the market. (Omar 1999) ,the role of retailers in the relationship
between the industry/ the producers and its final consumers gained importance. New
technological developments, such as scanner or computerized customer loyalty programs
allow retailers to obtain more and more information about the customers, their needs,
habits and preferences (Zentes, Janz, Morschett, 2005,). So retailers know their customers
and have a greater influence on them as producers do, for they are in direct contact with the
final consumers. Customer consider the second reason for appears the retail management.
New ways in retailing like raised competition and risk of takeovers, have generated press
on retailers to correct both inventory turnover and consumer service. Ellram(1999).A
1 www.economywatch.com
2 globaledge.msn.edu

4
sustainable competitive advantage is a advantage ever competition that can be continued
over a lot of time. Creating a competitive advantage means that a retailer constructs a
barrier around its site in a retail market. This barrier makes it hard for opponents outside
the barrier get in take customers in the retailer’s market. If the retailer has built a wall
around a good market, opponents will try to smash the wall. Over time, but by built high,
big barriers, retailers can maintain their advantage, minimize competitor pressure, and
increase output for a longer time. Therefore, creating a maintainable rival advantage is the
most important factor to keep customers in these barriers (Levy 2001). Customer service is
critical point for retailers. While consumer satisfaction results of meeting consumer
anticipation at a retail level, consumer service is considered as a part from upstream
channel connections. Customer service may be identified as a process for provided that
important outputs to give chain in cost effective way. Customer service involves such
items as order completeness, performance consistency, response to faults, exceptional
requests ,services, and data requests (Ellram1999). Distribution Channel, Manufacturer,
Wholesaler, Retailer and Consumer. Wholesalers buy products from manufacturers and
sell them to retailers while retailers take the product from wholesalers to the consumers.
While the wholesalers try to satisfy the retailers, the retailers make all the effort in
satisfying the needs of the consumers. Retailing has become an basic part of our everyday
lives and this has been evident with the nations that have enjoyed the greatest economic
and social progress have been those with a strong retail sector.(hemanth 2011).
1.3 The Importance of Retailing
The retailer is an intermediary in the marketing channel because it is a chain for both
marketer and customer, who sells to the end user to consume .he, is specialist who
maintains contact with the customers and the producers; and is an important connecting
link in a complex mechanism of marketing. Though producers may sell directly to

5
consumers, such method of distributing goods to final users is inconvenient, expansive and
time consuming as compared to the job performed by a specialist in the liner. Therefore,
frequently the manufactures depend on the retailers to sell their products to the final
consumers, the retailers, who is able to provide appropriate facilities without high prices of
goods is rewarded by larger or more loyal investment. .(hemanth 2011) Retail sales have
shown strong increase over the past ten years, the growth ranged between 5-15%.
Increasing spending power, and branded goods, and progressing economic development
have increased grocery sales figures. Retailing is one of the largest sectors in the global
economy. It employees almost 23million people in United States alone, generating about
$3 trillion in sales annually. About 50 organizations in the retail sector. Retail is one
among the fastest growing industry. Consider Wal-Mart, the biggest retailer in the world
with approximately $250 billion Growth in retail sales over the next few years is
predictable to increase progressively. This will be supported by an improving economy,
controlled inflation, and an increasing arrival of Western products, which is expected to
fuel consumer spending.(yehya 2010) this vital sector for the economy accounts for
approximately two or thirds of all economic activity around the world. In 2012, the
National Retail Federation (NRF)—the world’s largest retail trade association—reported
that retail sales around the world is growing up ,it's expected to be number one of all
economics activity in 2020. (Binkley2003)
1.4 The Retailing in Egypt
Egypt is the largest market in the Arab world. it is ranked 13th in terms of the most
attractive retail market worldwide. It is one of the most promising and fastest expanding
markets in its region. In 2009 Egypt was ranked 15th in global retailing (Consumer survey
reveals Egyptian retail purchasing habits, 2010). A population of more than 84 million
citizens makes Egypt a profitable market in the Middle East. About 42% of the population

6
is under the age of twenty (Cairo Festival City hopes to capitalize on Egyptian retail sector,
2008). Cairo, Egypt’s capital has about 17 million residents. Alexandria, the second largest
city, has over 4 million people. Egypt Retail Report forecasts the country’s retail sales to
grow from (US$30.30bn) in 2011 to (US$48.30bn) by 2015 (Egypt Retail Report
2010).According to the Al-Futtaim Group, there will be an increase in per capita income
by 9.7%) between 2009-2016. This will lead to an increase in demand for luxury products
and necessitates more modern retail technology. This shift will attract the attention of
international brands for the Egyptian retailing market. Egypt’s GDP was US $226 Billion
in 2010. Between 2010 and 2016, GDP per capita, is predicted to rise by 63.9% to U.S.
$4,463 Billion.3
Food retail sales, expected as mentioned increase , is dominated by private micro retail
enterprises (which employ less than five employees), which make up about 99% of total
retailers, although growth in the industry is driven by mass grocery retailers (MGRs),
which grew by 15.3% in 2012 and constitute about 2% of local market share. Metro
Market is the largest grocery retailer in Egypt with 90 outlets and a market share of just
under 1%. The grocer is in the latter stages of a deal in which French-based Carrefour
(managed by Dubai’s Majid Al Futtaim) will buy the grocer including the Kheir Zaman
division; this would increase Carrefour’s overall market share by 60%. Carrefour is
currently the largest hypermarket operating in Egypt, in terms of floor space and stores,
with six hypermarkets in greater Cairo and Alexandria, and 10 smaller grocery outlets in
various locations. Lebanon-based Spinneys is the country’s second largest hypermarket
operator offering higher end and imported brands at its four locations across greater Cairo.
Hyper One is the largest domestic hypermarket operator; it expects 15-20% annual sales
growth going forward, with two locations around Cairo and one planned in Alexandria. as
3 http://wwww.oxfordbusinessgroup.com

7
shown in figure 1.1, Generally speaking mass grocery retail sales are expected to increase
by two and a half-fold by 2015. (Service Sectors 2013)
Source: (Economist Intelligence Unit 2013)
Non-food retail sales chop slightly in 2012. The non-food segment, like the rest of the
retail sector is highly fragmented but is experiencing consolidation in the midst of an
arrival of malls and other types of modern retail space. Modern retail space is currently
undersupplied with 773,000 square meters in greater Cairo; this is expected to increase
92.5% by 2015. The existing malls in greater Cairo include Mall of Arabia, Dandy Mall,
Maadi City Centre, Sun City Mall, Golf City Mall, and City Stars. Other retail space under
development includes Emerald Mall, Dolphin Mall, Cairo Festival City, and Mall of Egypt.
The appearance of modern retail space has facilitated the market entry of various foreign
retailers. The Mall of Arabia, developed by Saudi-based Al Hokair Group, will be the
largest mall in the country at 180,000 square meters of gross leasable area (GLA) and
housing 900 brands when complete. It is located in Sixth of October City, a western suburb
of Cairo. Currently the mall is operating 70,000 square meters in the first phase of
operations, housing numerous international retailers such as Nine West, Tommy Hilfiger,

8
Nike, Gap, Levi’s, Zara, Spinneys, Virgin Megastore, Hallmark, and Samsonite, to name a
few. City Stars is currently the largest mall in Egypt, located in the eastern suburb of Nasr
City. It has been a shopping landmark since its beginning in 2005, operating with 150,000
square meters of GLA. The mix-use complex, which is part of a larger facility with hotels,
entertainment, and business facilities, houses over 640 stores including international brands
such as H&M, Marks & Spencer, Timberland, Radio Shack, Panasonic, Sony, Samsung,
Crocs, Aldo Shoes, Adidas, Puma, The Body Shop, Montblanc, and Eastpak, to name just
a few. Future supply of modern retail space will be driven in large part by the Mall of
Egypt and Cairo Festival City. The Mall of Egypt, a development of the Dubai-based
Majid Al Futtaim Properties, is expected to be completed by June 2016 and will include
380 stores, covering 163,000 square meters; it is located in Sixth of October City. Cairo
Festival City, another mix-use project that will include retail facilities, housing,
entertainment, and business amenities, is expected to launch its retail component in June
2013. The project, developed by Dubai-based Al Futtaim Group Real Estate, will include
168,000 square meters of GLA, which will house 17 international flagship stores,
including 34,000 square meters for the Swedish-origin Ikea, and over 310 shops and
restaurants. Other developments include Almaza City Center, in Heliopolis, a 66,000
square meter facility expected to open in 2013 and Damac’s Park Avenue mall located on
the Cairo-Alexandria Desert Road, which will include 657 retail units on over 120,000
square meters of developed land. (Service Sectors 2013)
1.5 Research problem
Many customers, in particular the retailers, have recently been expressing dissatisfaction
with the services on offer (Meczes, 2002).The main problems identified by the customers
are poor service, poor communications and not being customer-facing.The new studies
show the powerful effect of customer loyalty and customer satisfaction on improving the

9
financial performance of firms. Since then, marketing researchers began to focus on loyalty
and satisfaction researches as it became clear that the more a company can keep its
customers the more successfully it can activate. Some researchers established that
profitability is achieved through the building up of a loyal customer and customer
satisfaction base (Reichheld, 1993). In addition, a number of researchers explained the use
of relationship quality approach (Dorsch et al, 1998,S) as one of the most promising
approaches that can achieve customer loyalty (Hennig-Tburau et al, 2002). Other academic
studies established that a quality relationship could be established (Clihstopher and Peck,
2004) through efficient and effective customer service programs that are built upon
logistics capability. Most studies have concentrated neither on service quality (Brady and
Cronin, 2001) not relationship quality ( Dorsch et al, 1998). An exception is the work of
Christopher and Peck (2004), who openly theories the positive effects from logistics
capability on long term profitability that work through customer satisfaction, relationship
quality and customer retention. This study Investigates the influence of logistics service
quality dimensions (LSQ) on supplier's retailer satisfaction. While highlighting the
importance of relationship quality with retailers satisfaction on improving the performance
on suppliers – retailers relationship.
1.6 Research questions
The research problem is subdivided into two research questions The aim of the research is
looking for answering the following questions:
RQ1: Do Logistics Service Quality Dimensions positively affect retailer Satisfaction?
RQ2: Does retailer satisfaction lead to high relationship quality?
1.7 Research Aim
Recently, logistics research focuses on the ability of logistics to deliver a quality service
and generate greater satisfaction with the delivered service. Therefore, the aim of this

10
research is to analyze the "logistics service quality", "satisfaction" on "Relationship
Quality" according to the logistic service delivery context.
1.8 Research methodology
First, approach used the conceptual approach by reviewing previous studies. Second
primary data collection from the retailers in Alexandria. The data was collected through
using self administered questionnaires filled by retailers located in Alexandria. The
questionnaire items were formulated based on different scales adopted from (Logistics
service Quality, Relationship Quality scales)(Jaafar 2006)
1.8 Proposed Model and Hypotheses
Figuer 1.1 Proposed Model

11
The Research Hypotheses
H1: Logistics service quality dimensions has a positive effect on retailers' Satisfaction
H2: A higher level of retailer satisfaction leads to high relationship quality
1.10 Research objectives
The main objective of research highlights the importance and improves the retailers
relationships with their suppliers through enhancing the logistics Service quality.
1- Improving the Logistics Service Quality that presented to retailers.
2- Develop the relationship quality through the Logistics Service Quality.
3- Reflect the development in relationships on end users.
1.11 Research importance
Through the years retailing has evolved, competition has got hard and therefore marketing
has become more essential in the direct selling of wars. The methods by which stores are
getting their products into the hands of customers are developing. Because customers have
more choices, stores have to reach them through advertising, and effective promotions. So
retailing became more important around the world. According to previous studies done in
this field it was clear that a strategic business goal is a top tool to satisfaction, and
considered not sufficient enough to produce loyal customers, The need for such study
become obvious as the business competition turns out to be more strong due to the
complexity and huge growth of the suppliers in Egypt. Accordingly, this study aims to
fulfill the gap existing between LSQ dimensions factors and supplier' retailers relationship
quality in Egypt. . In addition, from academic prospective, this research contributes to
Logistics literature by addressing its research problem.

12
1.12 Samples and Data Collection
The population of this research are retailers dealing with suppliers companies in
Alexandria .A self – administrated questionnaire distributed for retailers that having special
characteristics mentioned in Chapter three.
1.13 Thesis outline
This research is divided to 5 chapters
1.13.1 Chapter 1(Introduction)
This chapter highlights a brief introduction and background about the research planning,
the aim and the importance of this research. It also Overviews of the conceptual model,
methodology, and the outlining of the thesis.
1.13.2 Chapter 2 (literature review)
This chapter discusses the theoretical framework of the study. It also reviews the literature
on supply chain management, satisfaction and service quality in logistics. It introduces
various studies measuring logistics service performance , highlights previous studies
adopted Logistics Service Quality (LSQ) model, finally discusses the relationship quality
(RQ) and the variables of this model.
1.13.3 Chapter 3 (Research design)
This Chapter provides details of the specific methodologies for each phases of the study; it
also presents the hypothesized research model and hypotheses, introducing conceptual and
operational definitions of research variables and describes the methodology and the
process of generating and testing the measurement items,
1.13.4 Chapter 4 (Analysis and Results)

13
This Chapter presents the empirical results of the study, and the analysis related to testing
the hypotheses according Logistics Service Quality model and Relationship Quality model
based on quantitative data that were collected through using questionnaires.
1.13.5 Chapter 5 (Discussion and Conclusions)
This Chapter discusses the research findings conclusions, including limitations and areas
for future research.
Figure 1.3 Structure of the Research
1. Introduction to
the Research
2. Supply chain
Management, Distribution
channels, and Retailing
2. Relationship quality in
Logistics
3. Research Methodology
4. Data Collection and
Analysis
5. Discussion and
Conclusion

14
1.14 Summary
This chapter introduced the research problem and research questions, presented the outline
of the research, the next chapter presents the literature review for Logistics service Quality
and Relationship Quality.

15
Chapter Two
Literature review

16
2.1 Introduction:
This Chapter focuses on the relationships between retailers and suppliers through
adopting Logistics service quality between the two parties and its effect on
relationship quality. The literature review is divided into 3 sections the first section
will explain Supply chain management , different distribution channels, and the
retailing, The second one will explain Logistics, service quality and how logistics and
service quality were integrated, while last part explains the relation marketing and its
effect on relationship quality.
2.2 Supply Chain Management (SCM):
Today’s organizations are faced by serious levels of international competition,
customers requirements and new competitors, reduction of the product life cycles, and
decreasing acceptable response times. Competition in many industries has been based
mainly upon strategic assets (investments in scale, scope, brand equity) and based on
the ability to organize and handle these assets. However, competition is now based
upon capabilities, or “complex group of skills and accumulated knowledge, operated
through organizational processes” (Day, 1994,p 38). The importance of effective
supply chain management (SCM) has become more and more clear in recent years.
Businesses continue to identify the role of SCM in creating and maintaining a
strategic competitive advantage through close customer relationship, increased
satisfaction and improved business profitability (Mentzer, 2001). An essential aspect
of SCM is reliable, high-quality logistics services. Logistics services need to design
and implement the operations of inter organizational systems that allow goods to
remove time and space constraints (Daskin, 1985).These reasons encourage
companies to use supply chain management (SCM) as guide for their industries

17
because the basic objective of supply chain management is to optimize performance
of the chain to add as much as value for cutting costs and to satisfy customers ,In
other words, it aims at linking all supply chain parties together to cooperate within
the firm as a way to maximize productivity and deliver the most benefits to all related
parties (Finch, 2006).
2.3 Supply chain management framework:
Mentzer et al., (2001) proposed a supply chain as a “set of three or more parties
directly involved in the upstream and downstream flow of products, services,
finances, and information from a source to the customer” with a clear importance on
management of flows. While Fleischmann et al., (2002) divided the supply chain into
four main stages or processes and described their purpose. Procurement involves the
operations of providing the raw material and resources necessary for production.
Production is the next process in the chain in which the raw materials are converted
into intermediary to finished products. Then, distribution includes the logistics to
move the products either to companies for further processing the product or to
distribution centers, and finally to point of sales figure (2.1) shows all stages of supply
chain management. All demand planning issues including customer or market
selection, forecasting, pricing strategy and order promising policies are part of the
sales process.

18
Figure (2.1) Supply chain Stages
Source: Tom McGuffog, Nick Wadsley, (1999) "The general principles of value chain management", Supply Chain Management: An International Journal, Vol. 4, pp.218 – 225.
The goal of running the supply chain is to get income growth and cost reduction, at
the same time. This mean integration between all members in supply chain working
relationships is required. SCM may require that all firms in the supply chain share
sensitive and proprietary information about customers, actual demand, point-of-sale
transactions, and corporate strategic plans, Figure 2.2 clear the key elements of supply
chain management and highlights the important integration that must take place
among a variety of business functions and across several different organizations in the
supply chain. This means a balance between the goals of customer service level and
the goals of low costs. In practice these are hard to be achieved. Low costs are
achievable for processes designed for serving customers with stable and different
needs. High customer service levels often require both product and process
flexibility.(Lambert 1999).

19
figure (2.2): The key elements of supply chain management
Source : Karl B. Mandrodt, Mary Collins Holcomb, and Richard H. Thompson
(1997) “What’s Missing in Supply Chain Management?” Supply Chain Management
Review p. 81.)
2.4 Supply Chain Management Goals
The most important goals for supply chain waste reduction and enhanced supply chain
performance come only when there are both internal and external functional
integration, sharing, and cooperation, So each firm in the supply chain must break the
barriers within its organization and promote right coordination and integration of
marketing, production, procurement, sales, and logistics. To reach to the targeted
point in supply chain, firms should follow and apply four main goals for supply chain,
Supply chain management is implemented to achieve four main goals: waste
reduction time compression, flexible response, and unit cost reduction. (Brewer 2000)
2.4.1 Waste Reduction
Firms at all levels in the supply chain often trying to maintain inventories. The most
suitable way to maintain inventories is reducing waste by minimizing duplication;
second, avoid doing the same operations between all members in supply chain it
makes all member focused on their core business and to get a high quality of products.

20
2.4.2 Time Compression
Each member in supply chain seek to deliver and finish its job in the right time ,and
make a lead time less in all operations ,when that happened all entities in the supply
chain are able to operate more efficiently, this result will effect directly on inventories
and customer satisfaction whether internal customer or final customer.
2.4.3 Flexible Response
Flexible response in order handling, including how orders are handled, product
variety, order design, order size, and many things that finally affect on customer
satisfaction , a firm that has flexibly can respond all kinds of demand any time ,it will
be flexible to deal with this demand.
2.4.4 Unit Cost Reduction
The last goal in supply chain management is to run the chain by the way that reduce
cost per unit for the final customer, "The business marketer should carefully review
the balance between level of cost and the degree of service provided", The goal is to
give an suitable value for the customer, that’s mean that cost in some cases will be
higher for significant enhancements in service. So the firms try as much as they
balance between reduce cost and to achieve their business goals
2.5 The Evolution of Supply Chain Management (SCM)
Firms can no longer effectively compete in isolation of their suppliers and other
entities in the supply chain. Awareness about supply chain concept has progressively
increased since 1950s and 1960s; most manufacturers emphasized mass production to
minimize unit production cost as the primary operations strategy, with little product or
process flexibility. In the 1970s, Material Requirements Planning (MRP) was
developed and managers realized the impact of huge Work in Process (WIP)

21
inventories on manufacturing cost, quality, product development, and delivery lead-
time. In 1980s companies were considering benefits of collaborative relationships
within and beyond their own organization and the global competition forced world-
class organizations to offer low-cost, high-quality, and reliable products with greater
design flexibility (Farmer, 1997) Table (2-1):shows evolution eras of supply chain
management. Manufacturers utilized Just-In-Time (JIT) and other management
programs to improve manufacturing efficiency and cycle time. The evolution of
(SCM) continued into the 1990s as organizations further extended best practices in
managing corporate resources to include strategic suppliers and the logistics function.
Many manufacturers and retailers are adopting the concept of (SCM) to improve
efficiency and effectiveness across the supply chain. (Jain et al., 2010).
Table (2-1): Evolution eras of supply chain management
Era
Description
1
Cost Era
In the 1950s and 1960s, most manufacturers emphasized
mass production to minimize unit production cost as the
primary operations strategy, with little product or
process flexibility. New product development was slow
and relied exclusively on in-house technology and
Capacity. (Farmer, 1997).
2
Quality Era
In the 1970s, Manufacturing Resource Planning was
introduced and managers realized the impact of huge
WIP on manufacturing cost, quality, new product
development and delivery lead-time
3
Creation Era
The term supply chain management was first coined by
an American industry consultant in the early 1980s.
However the concept of supply chain in management,
was of great importance long before in the early 20th
century, especially by the creation of the assembly line.
4
Integration Era
This era of supply chain management studies was
highlighted with the development of Electronic Data
Interchange (EDI) systems in the 1960s and developed
through the 1990s by the introduction of Enterprise
Resource Planning (ERP) systems. This era is characterized by the globalization of supply

22
5
Globalization Era
chain management in organizations with the goal of
increasing competitive advantage, creating more value-
added, and reducing costs through global sourcing
6
Specialization Era
Phase One-Outsourced
Manufacturing&
Distribution
In the 1990s industries began to focus on “core
competencies” and adopted a specialization model.
Companies abandoned vertical integration, sold off non-
core operations, and outsourced those functions to other
companies.
7
Specialization Era
Phase Two - Supply
Chain Management as
A Service
Specialization within the supply chain began in the
1980s with the inception of transportation brokerages,
warehouse management, and non asset based carriers
and has matured beyond transportation and logistics into
aspects of supply planning, collaboration, execution and
performance management
8
Supply Chain
Management
The coordination and collaboration of all supply
activities of an organization to increase creativity,
information sharing from its suppliers and partners to its
customers.
Source : Jain et al. (2010)" Supply Chain Management: Literature Review and Some Issues", Journal of Studies on Manufacturing ,Vol.1, pp. 11-25.
2.6 Definitions of Supply Chain Management (SCM):
In the literature there are a number of definitions are proposed and the idea is
discussed from many perspectives. However (Cousins et al., 2006) defined the
concept, principals, nature, and development of SCM and pointed out that there is a
strong research being conducted around the world in this field they critically assessed
developments in the theory and practice of supply management.
Scott and Brook, (1991) defined SCM as a chain linking each element of the
manufacturing and supply process from raw materials to the end user, including
several organizational boundaries. According to Ganeshan and Harrison (1995) SCM
is a network of facilities and distribution options that performs the functions of
procurement of materials, transformation of these materials into intermediate and
finished products, and the distribution of these finished products to customers. These
definitions highlighted the significance of coordination among the members in supply
chain. Jayashankar et al, (1996) stated that supply chain is a network of autonomous

23
or semi-autonomous business entities collectively responsible for procurement,
manufacturing, and distribution activities associated with one or more families of
related products. He highlighted the importance of coordination and attempts to show
usual functions of supply chain. Christopher (1998) defined the supply chain as the
network of organizations that are involved, through upstream and downstream
linkages, in the different processes and activities that produce value in the form of
products and services in the hands of the ultimate customer. These three definitions
key points are related to coordination in supply chain. On the other hand Christopher
added the value that should present to the customer. Croxton et al., (2001) extended
the scope of SCM to the integration of key business processes from end user through
original suppliers that provides products, services, and information that add value for
customers and other stakeholders. He moved on from level of coordination to
integration among all parties in supply chain. In the same line Mentzer et al., (2001)
defined SCM as The systemic, strategic coordination of the usual business functions
and the plans across these business functions within particular firms and across
businesses within the supply chain, for the purposes of improving the long-term
performance of the individual firms and the supply chain as a whole. Mentzer et al
observed that the long term relationship is a perfect solution for integration in supply
chain and also cleared the role of supply chain to serve the customer. A similar
definition from (Chan and Lee, 2005) defined SCM as the efficient management of
the end-to-end process of designing, development, anticipating and sourcing though
complex supplier networks, manufacturing, and distributing products from raw
material to the final customer, and the final disposal of the product by the customer.
They added anticipating as a part from supply chain .Although from 1991 to 2005
there is a development happened in supply chain but Ganeshan and Harrison (2006)

24
didn’t mention something new except a distribution system as a part from SCM, they
defined SCM as a network of facilities that procure raw materials, transform them into
intermediate goods and then final products, and deliver the products to customers
through a distribution system. According to the Council of Supply Chain Management
Professionals (CSCMP) (2009) Supply chain management include the planning and
organization of all activities involved in sourcing and procurement, exchange, and all
logistics management activities. Significantly, it also includes coordination and
collaboration with channel partners, which can be suppliers, intermediaries, third-
party service providers, and customers. In the core of supply chain management
integrates supply and demand management within and across companies.
Accordingly, many researches defined SCM from many perspective highlighting the
importance of (coordination, integration, collaboration, long term relationship, and
more about linking among all parties in supply chain, so supply chain management
can be defined – according to these definitions – as the entire value chain that can
transferred to the end users via integrated business organizations based on the
anticipating and forecasting. According to the literature are many functions in supply
chain existed to achieve supply chain's goals such as customer response, inventory
planning and management, supply, transportation, warehousing and distribution, This
research will explore different types of distribution channels, and will pointed out
their importance.

25
2.6.1 The Supply Chain Management and the Distribution Channels
Distribution channel one of the most important part in supply chain, The growing
awareness of the vital impact of supply chain management (SCM) on organization's
competitiveness, productivity and strategic advantage has made supply chain a truly
strategic issue and it has received increased emphasis everywhere, Supply chain
includes many main functions such as Korpela et al., (2001):
Korpela et al., (2001) determined the main fuctions of SCM as follows
Procurement of raw material
Production planning and inventory control process and;
Distribution and logistics process.
The role of distribution is to provide to a company the accomplishment of the task of
delivering the product in the right time at right place, and quantity at a minimum cost
(Bucklin, 1966). Distribution channel is defined as a combination of functions which
provides the right transfer of goods and services, from the producers to the customers,
the distribution includes along with the goods and commodity flow transactional,
informational, financial, monetary, risks flows. (Rosenbloom, 2004).According to
(Ostrow, 2009, p 59 ( "Distribution channels is The route along which goods and
services travel from producer/manufacturer through marketing intermediaries (such as
wholesalers, distributors, and retailers) to the final user. Channels of distribution
provide downstream value by bringing finished products to end users. This flow may
involve the physical movement of the product or simply the transfer of title to it. Also
known as a distribution channel, a distribution chain, a distribution pipeline, a supply
chain, a marketing channel, a market channel, and a trade channel."
Distribution has an active role in the sufficient performance of the flows involved in
the supply just in time of necessary products or services and it is an activity

26
particularly complex and heterogeneous by the diversity of intermediaries, of
operations.
Figure (2.3) Numbers of Distribution Channel Levels Source: (Coughlan et al., 2001) :
Each layer of marketing intermediaries that performs some work in bringing the
product to its final buyer is called "channel level". The figure (2.1) shows some
examples of channel levels for consumer marketing channels (Coughlan et al., 2001) :
Channel 1 is called a "direct-marketing" channel, it hasn’t intermediary levels.
In this case the manufacturer sells directly to customers.
Channel 2 contains one intermediary. In consumer markets, this is a retailer.
(Indirect-marketing channels).
Channel 3 contains two intermediary levels - a wholesaler and a retailer. The
retailers are receiving the goods from the wholesaler. (Indirect-marketing
channels).
Channel 4 contains three intermediary levels- a wholesaler, jobber and a
retailer in this one the wholesaler uses jobber to distribute their products to all
retailers (indirect-marketing channels).
This research will focus on channel 2 or 3 or 4 explain that retailers is the core of
this research and it’s a backbone in supply chain for any company, retailers more and
more taking the essential role in supply chain, as they are considered the key of
connection between producers and consumers and no longer distributors but it has a

27
critical role and ability to influence demand and drive efficiencies in the supply
system, The relationships between retailers and suppliers are important to consider for
understanding the determinants of quality, variety and prices (Dobson, 2005).
2.6.2The Distribution Channels and Retailing
The properties of the retail sector in markets may present themselves as either barriers
or opportunities for the internationalizing consumer goods manufacturer. Modern and
capable retail partner may be an essential cornerstone of success for the whole supply
chain; Retail can be defined as the various processes which help the customers to
procure the desired merchandise from the retail stores for their end use refer to retail
management. Retail includes all the steps required to bring the customers into the
store and fulfill their buying needs.4
"Retailing 2015 confirms that the retail industry is becoming more complex and
changing at an ever-increasing speed. the industry quickly adjust and modify existing
models, approaches and processes to satisfy the needs of future customers in order to
be successful and profitable. Retailing will become an industry that realizes, more and
more, that it must adapt its offerings to select customers, in order to win over
customers and promote greater customer loyalty".5 From a traditional marketing
viewpoint, the retailer is one of many possible organizations through which goods
produced by the manufacturer flow on their way to their consumer destiny. These
organizations perform various roles by being a member of a distribution channel.
Channel members, or marketing intermediaries as they are sometimes referred to,
take on activities that a manufacturer does not have the resources to perform, such as
4 http://managementstudyguide.com
5 http://www.scribd.com

28
displaying the product alongside related or alternative items in a location that is
convenient for a consumer to access during shopping Intermediaries facilitate the
distribution process by providing points where deliveries of merchandise are altered
in their physical state (such as being broken down into smaller quantities, or being
repackaged) and are made available to customers in convenient or cost-effective
locations.(Krafft M 2010)
In the retailers introducing ranges of own-branded goods (private labels) and
developing shopping environments that produce loyalty to an outlet rather than
loyalty to a product. This shift in power from the manufacturer to the retailer has been
further enhanced by information technology that has enabled retailers to gain a greater
understanding of their customers' purchasing patterns and preferences.(Krafft M
2010)
Davidson et al (2000) explain retailing as the last part of the marketing process in
which the different functions of the seller, usually a store or service establishment,
and the buyer, an individual consumer are primarily oriented to accomplishing the
exchange of economic goods and services, for purposes of personal, family or
household use. Although retailing deals mainly with the final consumer, it must be
recognized that the retail store is only one of several alternative means by which
consumers can obtain the products and services they desire. Increasingly, consumer
expenditures that might have traditionally gone through the retailing structure are
being diverted to other types of consumption markets which are being forcefully
served by a variety of both private and public enterprises. Berkowitz et al. (2000)
describe retail marketing as all activities involved in selling, renting, and providing
services to final customers for personal, business or non-business use. In the channel
of distribution, retailing is where the customer meets the product. It is through

29
retailing that exchange occurs. In terms of method of operation, retailing includes
store and direct marketing operations. Outlets also differ in terms of the breadth and
depth of their merchandise lines. Breadth here refers to the number of different items
carried, and depth refers to the assortment of each item offered. In assessing their
competitive position, retail outlets should consider their position in terms of breadth
of merchandise line and the amount of value added, which is the service level and
method of operation (Berkowitz et al., 2000).
Today, retailers place a lot of emphasis on customer service which is defined as the
sum of acts and elements that allow consumers to receive what they need or desire
from your retail establishment.(Krafft 2010),the interaction between the retailers and
their customer wouldn't be good without a good service presented to the retailers ,this
service exist in Logistics service quality that presented from suppliers to the retailers,
logistics service quality is a key that can measure the relationship between retailers
and suppliers, in a new line the following section will explain what's Service Quality,
Logistics and how its extended to be Logistics Service Quality (LSQ)
2.7 Service Quality
Service quality became a major field that the researcher start to focus on in their
studies , because it has an essential and great influence on business performance,
lower costs, customer satisfaction, customer loyalty and profitability (Guru, 2003).
Many researchers have conducted studies in measuring service quality in the past
twenty years. , McCleary and Weaver, (1982) indicated that good service is defined
on the basis of identification of measurement behaviors that are important to
customers. Zemke and Albrecht, (1985) suggested that service quality plays a vital
role in defining a firm’s competitive strategies and identified systems and strategies
for managing service. According to Parasuraman et al., (1988) "service quality" is a

30
general tool to measure perceived service quality that clear the degree of difference
between consumers’ perceptions and expectations. Thus, service quality as perceived
by consumers, comes from an evaluation of what they think service providers, provide
according to their consumers' perceptions of the service providers performance. The
high quality in products and service is the main tool in market place and this quality in
service will reflect on the performance that does produce considerable benefits in
incomes, cost savings, and market share (Anderson et al., 1994). Researchers also
indicated that service quality is the main factor to make any business successful
Parasuraman et al., (1988). The topic of measuring service quality has been studied
extensively in the past fifteen years. In (1988), Parasuraman, Zeithaml and Berry
developed a many attribute scale .The service quality (SERVQUAL) scale operations
and measures service quality along five distinct dimensions that can be viewed as
indicators of the construct of perceived service quality.
2.7.1 Service Quality Framework
While there has been significant progress with regard to how to measure the quality of
service, Researchers generally adopted two perspectives these perspectives are the
“Nordic perspective” and the “American perspective” (Brady and Cronin, 2001). The
“Nordic perspective” was proposed by Gronroos (1984) and the “American
perspective” was proposed by Parasuraman et al. (1985). The “Nordic perspective” of
service quality was the first to be published in Scholastic literature. However, the first
program dedicated to researching seriously to answer the questions, "What is the best
way to determine the quality of service?" and "What is the best way to measure it?”
was launched by Parasuraman et al., (1988) Schneider and White, (2004). This
program developed the “American perspective” of service quality. Parasuraman et al
(1985) proposed service quality to be a function of pre-purchase customer

31
expectations, perceived process quality, and perceived output quality. The researchers
found that consumers evaluate the procedure as well as the result of the service
received. In the same line, the waiting time, the smile, and the manner of the workers
are as important as the support of the results. et al. (1985) built up a 22 item service
quality scale comprising 5 dimensions (reliability, responsiveness, competence,
access, courtesy, communication credibility, security, understanding/knowing the
customer and tangibles).The following section by Parasuraman et al. (1988) resulted
in the service quality measurement scale with 22-items on 5 dimensions. The
dimensions reliability, responsiveness and tangibles were retained as identified in
(1985) whereas communication, competence, credibility, courtesy and security
merged as a new dimension “assurance”. Access and understanding knowing the
customer merged to form the dimension “empathy” as indicated in figure 2.4. (Table
2.2) shows each dimension with specific criteria that customers use Parasuraman et
al., (1988) explained this scale as SERVQUAL and defined its 5 dimensions as:
2.7.2 Service Quality Dimensions
1) Reliability is the ability to perform the promised service in a dependable and
accurate manner. The service is performed correctly on the first occasion, the
accounting is correct, records are up to date and schedules are kept.
2) Assurance feelings of trust and confidence in dealing with the organization.
this reflects the workers' knowledge and experience and their ability to build
self-confidence as well as confidence in the customers themselves.
3) Tangibles are the physical evidence of the service, for instance, the appearance
of the physical facilities, tools and equipment used to provide the service; the

32
appearance of personnel and communication materials and the presence of
other customers in the service facility.
4) Empathy the caring individualized attention that a firm provides its customers.
5) Responsiveness refers to the willingness of employees to help customers and
to provide a prompt timely service, for example, mailing a transaction slip
immediately or setting up appointments quickly.
(Table2.2) the dimensions of service quality
Source: Parasuraman, A., V.A Zeithaml, and L.L. Berry (1988) "SERVQUAL: A Multiple-Item Scale
for Measuring Customer Perceptions of Service Quality". Journal of Retailing, Vol 64, pp12-40.
Dimension
Refers to
Specific criteria that customers use
RELIABILITY
Delivering on
Promises
one's ability to perform the
promised service
dependably and
Accurately
Timeliness
Consistency/Regularity
Accuracy
ASSURANCE
Inspiring trust and
Confidence
The knowledge and
courtesy of staff; their
ability to inspire trust
and confidence
Staff competence
Respect for stakeholders
Credibility
Probity and confidentiality
Safety and security
TANGIBLES
Representing the service
physically
The physical
representations or images
of your service
Physical facilities
Equipment
Technology
Employees
Communication materials
EMPATHY
Treating customers as
individuals
The caring individualized
attention you provide your
stakeholders
Access (to staff, services,
information)
Communication (clear, appropriate,
timely)
Understanding the stakeholder
Individualized attention
RESPONSIVENESS
Being willing to help
Your willingness to help
customers and to provide prompt
service
Willingness to help
Prompt attention to requests, questions
Problem resolution
Complaint handling
Flexibility

33
Figure 2.4 Conceptual model of service quality
Source : Parasuraman, A., V.A Zeithaml, and L.L. Berry (1988) "SERVQUAL: A Multiple-Item Scale
for Measuring Customer Perceptions of Service Quality". Journal of Retailing, Vol 64,pp12-40.
Figure (2.5) SERVQUAL model created and developed by Parasuraman et al. (1985)
Source: Okumufi, A., & Duygun, A. (2008). "Service quality measurement on education service
marketing and relationship between perceived service quality and student satisfaction". Anadolu
University Journal of Social Science, Vol 8, p.p17-38.
While there is no universal consensus that either "Nordic perspective " or "American
perspective" are considered the most appropriate approach, but still the "American
perspective" controls on the researcher's literature (Schneider and White, 2004).
(Parasuraman et al., 1988) claimed that the 5 dimensions and 22 items proposed in
their “American perspective” are of a general nature and apply to all service
organizations. However, the service quality measurement scale developed by
(Parasuraman et al., 1988) has been the subject of criticism since its development
(Johnston, 1995). (Buttle 1996) provides a detailed analysis of the issues surrounding
the 5 dimensions of the (Parasuraman et al., 1988) service quality scale, mostly on the
basis of number of dimensions and contextual stability. (Carman 1990) found that the

34
5 dimensions of service quality measurement scale proposed by (Parasuraman et al.,
1988) are not so general that users should add new dimensions they believe are
important. (Parasuraman et al., 1988) suggested that the number of service quality
dimensions is dependent on the service being offered.
2.7.3 Functional and Technical Quality
Gronroos (1978) first proposed that customers’ overall evaluations of service quality
were a result of their assessment of two dimensions, which he termed functional and
technical service quality, and of the impact of an organization’s image. He proposed
that customers compared their expectations to their experience of service quality in
forming their judgments (Gronroos, 1984), it has been the work of Parasuraman et al
(1985) in developing a technology for measuring and managing service quality
SERVQUAL which has received the most attention Gronroos (1983a) as in Figure 2.6
identified the keys determinants of service quality .
Gronroos (1984, p36) identified 2 dimensions of service quality which were (technical
quality and functional quality). He defined technical quality as “what the consumer
receives as a result of interactions with a service firm” and identified employees
technical skill, employees knowing, technical solutions, technology systems and
machine quality as its 5 attributes. Gronroos (1984, p39) defined functional quality as
“the way in which the technical quality is transferred”, The functional service quality
dimension of seven attributes consists behavior, attitude, accessibility, appearance,
customer contact, internal relationships, service mindedness as its 7 attributes. The
technical dimension consists of five output attributes: ability, employees’ knowledge,
technical solutions, computerized systems, and machine quality (Gronroos, 1982;
1983). He concluded that the technical and functional quality of service built up the

35
corporate reputation of the company. Image is described by Gronroos (1982) as the
customers’ general perception of the supplier.
Figure (2.6) Managing perceived service quality
Source: Gronroos, C. (1984). "A Service Quality Model and Its Marketing Implications". European
Journal of Marketing, Vol 18,p.p 36-44.
2.7.3 SERVPERF
Cronin and Taylor (1992) in their empirical work controverter the framework of
Parasuraman, Zeithaml and Berry (1985, 1988) with respect to conceptualization and
measurement of service quality, and shown a performance-based measure of service
quality called ‘SERVPERF’ explain that service quality is a form of consumer
attitude. They argued that SERVPERF was an enhanced means of measuring the
service quality construct. Their study was later simulated and findings suggest that
little if any theoretical or empirical evidence supports the significance of the E-P=
quality gap as the basis for measuring service quality. Cronin and Taylor (1994) clear

36
that the SERVQUAL and SERVPERF scales are tools designed for the long-term
performance-based attitude measurement of service quality. They suggested that the
SERVPERF scale appears the most suitable tool available for operate service quality
by satisfying in the gap to activate SERVQUAL operation. In the same line, Brand et
al (1995) in their research give an empirical study that identifies the significance of
the recreational service sector to service marketers and practitioners, and assesses the
efficiency of the SERVPERF versus SERVQUAL scales in recreational services for
the purposes of service quality measurement. The results suggest that differing
recreational services appear to have unique properties that say whether SERVPERF or
importance-weighted SERVPERF should be used.
2.7.4 Servicescapes
Service performance should be recognized either as customer only, employee only or
as customer and employee. Relation level of involvement of customers and employees
determines whose needs should be consulted in the design of environment. Employees
and customers have special needs and requirements for their physical life, but
companies do not discriminate needs and desires specifically to any particular
individual. Most firms have tried to give the best in the eyes of the customers.
Moher et al (1990) mentioned that close examination of the scale items for each
dimension clear that a majority of all the items relate directly to the human interaction
element of service delivery by referring to Parasuraman et al (1988). Bitner (1992)
clarified how these servicescapes influence both employees and customers in
physiological, sociological, cognitive and emotional ways.
Although there have been many dimensions of performance in the literature extended
from marketing to strategic management, but this research focuses on logistic

37
performance of the relationship between suppliers and retailers in this study and it
shall discuss the literature based upon the fundamental understanding of logistic
related aspect of performance. According to the literature the following section will
introduce logistics definitions, logistics service quality and its dimensions.
2.8 Logistics
Logistics deals with the scheduling and control of material flows and related
information in organizations, both in the public and private sectors. Generally, its
mission is to get the right materials to the right place at the right time, while
optimizing a given performance measure, and satisfying a given set of constraints. In
the military context, logistics is concerned with the supply of troops with food,
weapons, ammunitions and extra parts, as well as the transport of troops themselves.
In civil organizations, logistics issues are encountered in firms producing and
distributing physical goods. The key issue is to decide how and when raw materials,
semi-finished and finished goods should be needed, moved and stored. Logistics
problems also rise in firms and public organizations producing services (Ghiani et al.,
2004). Logistics excellence has become a powerful source of competitive
differentiation within diverse marketing offerings of world-class firms. Although
researchers have suggested that logistics competencies complement marketing effort,
efforts, empirical evidence is lacking on what logistics service quality means to
customers and whether it has different meanings for separate customer segments.
(Shet et al., 2006).

38
2.9 The Definitions of Logistics
According to Council of Logistics Management (1991) defined Logistics as a Part of
the supply chain process that plans, implements, and controls the efficient, effective
forward and reverse flow and storage of goods, services, and related information
between the point of origin and the point of consumption in order to meet customers’
requirements. (Tilanus, 1997) stated that the process of forecasting customer
requirements and desires; owning the capital, materials, people, technologies, and
information necessary to satisfy their requirements and desires; optimizing the goods-
or service-producing network to carry out customer requests; and utilizing the
network to fulfill customer requests in the right time. A similar definition by
(Handfield, 2002) define logistics as a Process of moving and handling goods and
materials, from the start to the end of production, sale procedure and waste disposal,
to make customers satisfied and attain a competitive advantage. According to
(Waters, 2003) Logistics is complete process of materials and products moving into,
through, and out of firm. Inbound logistics covers the progress of material received
from suppliers. Materials management describes the movement of materials and
components within a firm. Physical distribution refers to the movement of goods
outward from the end of the assembly line to the customer. Finally, supply-chain
management is somewhat larger than logistics, and it links logistics more directly
with the users’ total communications network and with the firm’s engineering staff.
Based on the previous definitions for logistics and service quality logistics is
considered the most essential part to make customer satisfied. SERVQUAL is the tool
used to support logistics activities, and to present the service in a right way, both
definitions support customer needs, so the integration between logistics and service

39
quality will achieve customer benefits. The following section explains how the
concepts of service quality were expanded to the logistics service quality context.
2.10 Logistics service quality
By taking into consideration SERVQUAL and other service quality research in
marketing, (Mentzer et.,al 1999) extended the use of the service quality concept into
the logistics context. SERVQUAL components include marketing customer service
components that were developed in line with traditional service quality research in
marketing, which was based on the idea that logistics services involve people who
often take orders and deliver products and procedures for placing orders and handling
discrepancies. The interactions that the customers have with these people and
procedures should affect their perceptions of overall logistics services. Perreault and
(Russ, 1976 proved that logistics activities, create time, place, and form utility, and
accordingly enhance product value. This confirmation was additional proved by
(Coyle et al., 1992) in describing the seven Rs of value creation by logistics services:
delivering the right product, right amount, at the right place, in the right condition, at
the right time, with the right information, and at the right price. (Bienstock et al.,
1997) developed a suitable and reliable scale for measuring physical distribution
service quality, which was the first of its nature effort to start an integration of the
logistics and marketing service quality research streams. As a part of this effort, they
examined the marketing service quality measurement literature, particularly the
development of logistic service scale and subsequent actions aimed at application of
these logistic service dimensions in industrial service contexts.
The idea of Logistics Service Quality (LSQ) has been studied from two different
perspectives: objective and subjective quality. The first approach related to quality

40
with use the service to be service provider defined specifications. This business view
of service considers quality as a true evaluation of all the levels and operations
essential to deliver the service that of manufacturing a product. This can be reached
through considering the service as a physical object which can be noticed and with
criteria that can be evaluated (Garvin, 1984). The second approach is subjective
quality that can convey evaluation of quality to the customer (Parasuraman et al
1988).
There are number of researches have been done in Logistics service quality:
Valuable contribution to the area of LSQ based on Mentzer and other researchers
Mentzer, Gomes, and Krapfel (1989), Mentzer, Flint, and Kent (1999), Mentzer,
Bienstock, and Kahn (1993), Bienstock, Sharma, Ballou, Grewal and Levy (1995)
Christopher, Bienstock ,Mentzer, and Bird (1997), Emerson and Grimm (1998),
Christopher, Moraes and Lacombe ,Flint and Kent, Elram, Lalonde and Weber
(1999), Mentzer et.al (2001), CEL (2003), Forslun, Gustafsson (2003) Mentzer et al
(2004),Jaafar (2006); Davied and mentzer (2006) Richey et al., (2007); Ruth
Banomyong and Nucharee Supatn, (2011) Bouzaabia(2013). Most of the studies
focusing on LSQ were examined using the operational measurements whereas the
customer perspective was used a little comparing with operational perspective .
Mentzer's’ study give more importance for the customer perspective rather than the
operational dimension of the service. Deriving from the work of (Gronross 1984) in
the service quality area where technical quality refers to the service outcomes and
functional quality refers to the process of service delivery, they associated the
physical distribution aspects as the technical service parameter and customer service
aspects as the functional service parameter leading to the development of an
instrument to measure the Physical Distribution Service Quality (PDSQ) (Bienstock,

41
Mentzer, and Bird 1997). Further studies broadened the scope of physical distribution
to a component of logistics leading to the development of LSQ scale LSQ (Mentzer,
Flint, and Hult (2001) Mentzer, Flint, and Kent 1999).
Mentzer, Flint, and Kent (1999) from now referred as MFK developed and validated
their Logistics Service Quality (LSQ) scale using a single large logistics services
provider firm in the United States, namely the DLA, which provides logistics services
to internal customers. MFK proposed nine constructs for evaluating logistics service
quality by expanding the concept of service quality into logistics context. The
methodology used by Bienstock, Mentzer, and Bird (1997) to develop PDSQ scale
was used by them. The constructs conceptualized from the customers’ viewpoint are
information quality, ordering procedures, order release quantities, timeliness, order
accuracy, order quality, order condition, order discrepancy handling, and personnel
contact quality. Collier and Bienstock (2006) ,Shet et al., (2006), Chin and Lui
(2007), Richey et al. ( 2007). Jaafar, (2007) and Saura, Fraces, Contri, and Blasco
(2008) used the LSQ dimensions model for different purposes.
This research reports the testing and validation of the LSQ instruments in the
relationship quality in business to business field
The nine dimensions constructs for evaluating logistics service quality are:
information quality, ordering procedures, order release quantities, personnel contact
quality, order quality, order condition, order accuracy, order discrepancy handling and
timeliness. Mentzer et al., (2001) .The nine dimensions of LSQ are discussed below:

42
2.10.1 The nine dimensions of Logistics Service Quality (LSQ)
2.10.1.1 Personnel Contact Quality
Personnel contact quality refers to the customer direction of the supplier's logistics
contact people (Mentzer et al, 2001). Having considered the fact that logistics services
involve personnel who often receive orders and deliver products, and are involved in
procedures for placing orders and handling conflicts, Personnel contact quality
becomes one of the most critical variables in delivering service. (Mentzer et al., 2001)
highlighted the positive influence of personnel contact quality on perceptions of
timeliness in all four segments (general, textiles, electronics and construction). Most
researchers recognized that customers care more about whether customer service
personnel are knowledgeable, empathies with their situation, and help them resolve
their problems . (Parasuraman et al 1985) argue that in most service encounters,
quality perceptions are shaped during the service delivery. Similarly, (Suprenant and
Solomon, 1987) suggest service quality perceptions are joined more to the service
process, which involves personnel contact, than to the resulting service outcome.
Accordingly, personnel contact quality is considered an important aspect of the
employee-customer interface.
2.10.1.2 Order Release Quantities
Order release quantities are related to the concept of product accessibility, which
means suppliers companies have the flexibility to deliver certain order sizes (Mentzer
et ., 2001). The importance of product availability has long been realized as a key
component of logistics excellence (Mentzer et al. 2001). Customers are most satisfied
when they are able to obtain their required quantities. Failure to deliver the required
quantities leads to stock-outs followed by financial losses due to insufficient materials
for production leading to dissatisfied and disloyal customers. ( Keebler et al. 1999).

43
2.10.1.3 Information Quality
The way customers perceive the information given by the suppliers with and the
diversity of products customers may select and form the information quality that they
built. The quality of the information especially in terms of sufficiency and availability
of the products is very important to customers so that they are able to use the
information to create decisions (Mentzer et al. 2001).
2.10.1.4 Ordering Procedures
Many researchers found that customers are worried about effective and simple
procedures provided by the suppliers or service providers (Mentzer et al. 2001) Thus,
they analysis ordering procedures as efficient and effective procedures of ordering
products according to suppliers or service providers.
2.10.1.5 Order Accuracy
Customers are concerned about order accuracy, order condition and order quality
when they assess orders as complete. However, (Mentzer et al. 2001) highlighted that
these three elements are different to each other. Order accuracy refers to the ability of
the suppliers or service providers to deliver the right item at the required number as
ordered and none of the orders being replaced with other items (Bienstock et al.
1997).
2.10.1.6 Order Condition
Order condition addresses the damage levels of the products due to handling
throughout the transportation process. Damaged products are unusable to the
customers. Customers have to go through certain procedures to obtain the replacement
of the damaged products from the suppliers or service providers depending on the

44
source and level of damage. Specifically it refers to the lack of damage of the orders
(Mentzer et al. 2001).
2.10.1.7 Order Quality
Order quality addresses the damage levels of the products ordered from the suppliers
or service providers due to manufacturing of the products as opposed to damage due
to handling. It reflects the level to which the products provided by the suppliers or
service providers meet the product specifications set by the customers (Novack et al,
994).
2.10.1.8 Order Discrepancy Handling
The degree to which the suppliers or service providers deal with any discrepancies
upon the arrival of orders reflects the order discrepancy-handling dimension. When
the orders received from the suppliers or service providers are not correct, in a poor
condition, or of poor quality, customers have to go through certain procedures to
approve the orders. Thus, the way the suppliers or service providers handle these
problems forms customer perceptions on the quality of services provided. (Novack et
al, 1994).
2.10.1.9 Timelines
Customers care most that the orders must arrive as promised. In a broader perspective,
it refers to the length of time between order placement and receipt (Hult et al., 2000).
These situations are represented by the timeliness dimension. This delivery time can
be affected by the problems during transportation that may delay the transportation
time. It could also be influenced by back-order time when products ordered are not
available in stock (Mentzer et al., 2001).

45
2.10.1.10 Satisfaction
Customer satisfaction is becoming a strong point and the backbone for companies
with a rising the effect on its economic success .A high level of customer satisfaction
creates customer Loyalty. This is a target for any company to attract customers and
make them satisfied (Bruhn ,(2001). Satisfaction is to assess the consumption of
perceived quality relative to the expected quality satisfaction result happens when
they meet or exceed client-expected results and the actual outcome. Satisfaction and
dissatisfaction is often seen as opposite ends of a continuum, with identification to act
as a result of the comparison between expectations and results (Oliver, 1980). In the
LSQ process model, satisfaction was the outcome variable of the model, ( Mentzer et
al., 2001). The relationship between retailers and providers is a business-to-business
relationship in which the retailer is the consumer and the provider is the supplier. For
this reason, retailer satisfaction is a kind of customer satisfaction in business-to-
business marketing. The difference between end user and the retailer satisfaction is
the number of the decision makers. End-user satisfaction depends only on the people
who are involved in buying a product and often affecting. On the other hand the
retailer satisfaction depends on the satisfaction of the group involved in the
purchasing process. For this reason, the retailer satisfaction is more reasonable.
2.10.2 Logistics service quality in B2B
Most of researchers applied Logistics service quality on end user (B2C), (Bienstock et
al., 997) confirmed that the troubles faced in applying this field to an industrial
service context were based on the relative importance of technical versus functional
dimensions that play a very important role in consumer versus industrial service
dealings. Technical quality determines whether the service delivers the core benefit,
at the same time as functional quality addresses the process of service delivery

46
(Parasuraman et al., 1988). The logistic service dimensions are oriented toward the
functional aspects of service quality.
The activation of the dimensions of service quality is not an easy mission. According
to (Ganesan, 1994) the long term relationships are advantages for the organizations
that they have a responsibility on developing and maintaining these long term
relationships.
2.11 What is Relationship Marketing (RM)?
Database marketing, direct marketing, one-to-one marketing, key account
management, and building and maintaining customer networks have all been used to
indicate and explain business relationships or "Relation Marketing" (RM) (Tapp,
2005). Some marketers think a relationship to start when customer information is
collected and used in a database, or when any form of switch over of goods or
services takes place. More fully described establishing, maintaining and enhancing
customer relationships from the service provider’s perspective (Grönroos, 1990):
Establishing a relationship involves giving promises;
Maintaining a relationship is based on fulfillment of promises; and finally,
Enhancing a relationship means that a new set of promises are given with the
fulfillment of earlier promises as a prerequisite.
Relationships can be multifaceted and are considered as a point along a transactional-
relational scale, with one extreme including ongoing, long-term business and social
connections, and the other end-point viewed as simple one-time single transactions
(Grönroos, 1995). Two main types of relationships exist in the business literature;
business-to-business (B2B) and business-to-consumer (B2C). (Harker, 1999)
undertook a extensive literature review and uncovered 26 definitions of RM currently

47
used in the RM research literature. Although these different conceptualizations make
it difficult to communicate a shared understanding of RM theory and development,
commonalities have appeared. For example, trust and commitment are consistently
highlighted as elements central to proper relationship development and enhancement
Grönroos defined RM based on the results and key conceptualizations from his study
According to (Grönroos 1996,P.13) Relationship marketing is:
"To identify, establish, maintain, and enhance relationships with customers and other
stakeholders, at a profit, so that the objectives of all parties involved are met; and ‘this
is done by a mutual exchange and fulfillment of promises"
2.11.1 Importance of Relationship Marketing
RM theory assumed that benefits to the firm build up in the form of protecting the
customer base, by creating product differentiation and barriers to switching, and
improving profits (Berry, 1995) (Low, 1996). suggested that customers find RM
attractive because it's potential to decrease risk, enhance recognition and inform
prestige. An added advantage to both parties is the chance for the supplier to know
more about customer requests therefore having the ability to customize and know
solutions to customer needs. (Kalwani and Narayandas, 1995) they made a research
about the importance of RM, They compared two groups of firms, long-term
relationship group with the transactional group, and they concluded that long-term
relationships support the long-term competitive advantage without low in profits.
Perhaps more significantly the advantages of knowing and understanding to customer
needs went beyond simple manufacturing efficiency gains but also led to higher
profitability. The most common factors viewed as reflecting the value of RM and
influencing relationship development, maintenance and strength include (Berry,
1995):

48
Trust
Commitment
Communication
Satisfaction
Power
Cooperation
Performance
Repurchase intention
Many studies investigated value on relationship marketing; these studies generally
find in turn some direct or indirect link to trust commitment and repurchase intention
Sabol, (2002). These studies displayed that the importance of trust, commitment
quality to relationship development.
(Table 2.4) lists some of the previous studies found to influence the trust, commitment
and repurchase intention in the relationship marketing research and the effect on
relationship outcomes. This table shows and demonstrates the potential difficulty of
relationship research.

49
(Table 2.4) The link between previous studies to Influence Key Constructs of
Relationship Quality
Source: Richard, James (2008) "The Impact of Customer Relationship Management (CRM) Technology on Business-to-Business Customer Relationships", PHD, NewIsland .
Trust and commitment has been identified as a primary factors affecting on
relationship development and performance. This set of previous researchers and
constructs is similar for both business customers and consumers (Brodie, 2001).
2.11.2 B2B relationship
Effective business to business relationships are of core importance for organizations
to enhance their own ability to be more competitive in the marketplace. Academics
Previous studies Construct
Experience (Dwyer et al., 1987)
Organizational characteristics; Individual characteristics (Moorman, Deshpandé, & Zaltman, 1993)
Shared values; Cooperation; Communication; Opportunistic behavior (-ve); Use of power (-ve) (Iacobucci & Ostrom, 1996)
Investment (Morgan & Hunt, 1994)
Duration (-ve) (Doney & Cannon, 1997)
Competence (Sirdeshmukh et al., 2002)
Performance (Narayandas & Rangan, 2004)
Satisfaction (Verhoef, 2003)
TRUST
(Crosby and Stephens 1987)
(Reichheld, 1996),
(Gounaris et al., 2008),
(Lacey and Morgan,
2009), (Hennig-Thurau and Klee 1997)
(Bartet al. 2005),
(Jarvenpaa et al., 2000).
(Ha et al. 2008).
Repurchase intention
Communication; Trust; Cooperation; Investment (Morgan & Hunt, 1994)
Performance (Narayandas & Rangan, 2004)
(J. C. Anderson & Narus, 1990)
Satisfaction; Price (Verhoef, 2003)
Dependency (Ganesan, 1994)
Loyalty (Garbarino & Johnson, 1999)
COMMITMENT

50
and practitioners commonly agree that a firm’s ability to survive in a competitive
market is to some extent based on its business relationships and their combined
resourcefulness in creating sustainable competitive advantage. It is no longer
organizations that compete on their own strength but supply chains that compete with
each other (Christopher and Jutner, 2000).
2.11.3 Relationship Marketing in Retailing Management
The major center of relationship marketing is towards structure closer relationships
with customers as a strategy to overcome problems such as obtaining global
competitive advantage, coping with quickly changing technologies and reducing
delivering products to markets (Wel 2009). Relationship marketing is attracting,
maintaining and –in many service organizations- expand of customer relationship,
Servicing and selling existing customers is examined to be just as significant to long-
term marketing success as getting new customers. Good service is necessary to keep
the relationship. Good selling is necessary to enhance it. The marketing mind "set is
that the attraction of new customers is truly the first step in the marketing process.
Supporting the relationship, transforming indifferent customers into loyal ones,
servicing customers as clients" this is marketing too (Berry 2002). Relationship
marketing has established vital attention since the 1990s as consumers have become
more difficult in their exchanges with firms and competition has sharp. Marketers
have become interested in the potential of relationship marketing activities to deliver
enlarged value to the customer over and above the firm’s product or service offering.
Building strong customer relationships offers a significant competitive advantage due
to the difficulty of direct fake products by competitors. (Sherrell 2007).

51
2.11.4 Relationship Quality (RQ):
One of the roles of marketing is to establish, enhance and extend relationships with
customers. The quality of business relationships between suppliers and customers has
been investigated and measured in many ways (Hausman, 2001; Morgan and Hunt,
1994; Odekerken et al., 2003). The general opinion is that strong relationships provide
significant benefits to both parties (Grönroos, 1996). Although, previous studies of
relationship quality (Crosby et al., 1990; Bejou, Wray and Ingram, 1996; Kumar et
al.,1995; Storbacka et al., 1994;Hennig Thurau and Klee, 1997 ;Dorsch et al., 1998;;
de Wulf et al., 2001;Walter et al., 2003; Lages et al. 2005; Ivens and pardo 2007;
Palmatier 2008; Ashnai et al., 2009; Walsh et al., 2010; Vesel and Zabkar, 2010;Liu
et al., 2011;Song et al 2012; Ghzaiel and Akrout 2012; Pepur et al 2013; Gabriela
2013) has discussed and measured the concept of relationship quality in a different
research contexts, the definition of relationship quality contrast different from
research to another. However, these authors have the same opinion that the concept of
relationship quality is a higher-order construct consisting of several distinct and it has
related components or dimensions (Dorsch et al. 1998). customer orientation Palmer
and Bejou, 1994; Dorsch et al., 1998, conflict (Kumar et al., 1995), trust (Dwyer and
Oh, 1987; Bejou, Gronroos 1990; Moorman et al.,1992; Wray et al.,
1994;Kumar et al.,1995;Wray and Ingram, 1996; Hennig-Thurau and Klee 1997;
Dorsch et al. 1998;), satisfaction (Crosby et al., 1990; Dwyer and Oh., 1987; Lagace
et al., 1991), and commitment (Moorman et al.,1993; Kumar et al., 1995; Hennig-
Thurau and Klee, 1997; Dorsch et al., 1998).

52
(Table 2.5) Relationship Quality Research Summary
Source: Gabriela (2013)"Effect of Relationship Quality and Cost to Serve on Customer Value in
Business Market". Master thesis.USA.
Other researchers have developed models of relationship quality based on linking
service quality, customer satisfaction, relationship strength, relationship longevity and
relationship profitability (Storbacka et al., 1994). Given that relationship quality and
relationship strength have been researched as synonymous constructs, Table (2-4)
Shows Relationship Quality Research Summary.
Study Relationship quality Outcomes
Crosby et al. (1990) Trust and satisfaction
(performance)(with salesperson)
Anticipation of future interaction
and sales effectiveness
Storbacka,
Strandvik, &
Grönroos (1994)
Service quality, customer satisfaction,
commitment, bonds
Relationship strength, customer
profitability
Dorsch et al. (1998) Trust, satisfaction, commitment,
opportunism, customer orientation,
ethical profile
Association between
relationship quality and vendor
status
Hausman (2001) Trust, commitment Perceived performance,
relationship satisfaction and
continuance
Wong and Sohal
(2002)
Single-item scale, trust and commitment
as antecedents
Salesperson trust impacts overall
RQ. Commitment is significant
influence.
Lang and Colgate
(2003)
Antecedents = commitment,
trust, satisfaction, social bonding,
conflict,
Customer IT expectation and use
influences RQ. Social bonding not
significant.
K. Roberts et al.
(2003)
Trust (credibility and
benevolence), commitment, satisfaction,
conflict
Significantly influences loyalty
Lages et al. (2005) Information sharing,
communication quality, long term
relationship orientation, satisfaction
Quality of relationship has a
positive impact on export
performance
Ivens and pardo
(2007)
Trust ,Commitment ,Satisfaction None
Palmatier (2008) Trust, Commitment, exchange
efficiency
Customer Value (measured as
"commissions" as an indicator)

53
According to Klee (1997, P.751) defines relationship quality as the "point of
suitability of a relationship to satisfy the requirements of the customer associated with
the relationship’. Therefore, relationship quality captures the nature of a relationship,
which in turn provides positive benefits to the customer. Trust and commitment
results from previous successful suppliers/customers interactions. Researchers have
been done before in this field, the results cleared that, trust and commitment provides
short term and increasing long term benefits to both participants, as an outcome of
being in the relationship.
2.11.4.1 Trust
Creating trust has been mostly related with the development of interest in relationship
marketing in general and particularly in the context of B2B markets (Blois, 1999).
The knowing of the nature of trust and the significance of its role to loyalty will leave
a major impact on how B2B relationships are developed and managed. Several
researchers use trust as a central construct to the development of successful service
relationships in B2B markets and for getting customer loyalty. (Parasuraman et al.,
1985) introduced trust as a vital factor in successful service relationships. The authors
suggest that customers need to feel safe in dealings with suppliers and need to make
sure that their interaction is confidential in that they are able to trust their suppliers.
(Berry, 1995, P.238) suggests that “relationship marketing is built on the foundation
of trust”. Trust has been defined, used and studied broadly in the area of relationship
start, development and maintenance (Berry, 1995). Elements of trust are considered to
play a major role in these elements, and it's considering a central to the concept of RQ
(K. Roberts et al., 2003). (Doney and Cannon, 1997,P.36) emphasizes the significance
of this definition in an industrial buying context due to some degree of risk in a
purchase situation indicating the customer's trust in provider firm as well as its contact

54
person. Trust in relationships is thinking that a party's word is dependable and that a
party will fulfill its requirement and commitment in an exchange (Spekman and Mohr
1994). According to Barney and Hansen (1994) it refers to the confidence that a
partner will not use the weakness of the other. Trust provides a potential partner with
confidence that the other’s actions will be helpful rather than harmful to it (Child
1998). A more complete definition of trust in the context of business alliances is
offered by (Zaheer et al. 1998) who emphasize trustee characteristics and define trust
as: “the expectation that an actor:
Can be relied on to fulfill obligations,
Will dealing in a predictable way, and
Will act and negotiate fairly when the possibility of opportunism is present.
2.11.4.2 Commitment
Commitment is considered essential for continuance of relationship, to keep customer
retention, and to positively affect relationships. The construct of commitment has also
been shown to be an important dimension of relationship quality this is because
commitment represents a long-term orientation toward the channel relationship
(Doney and Cannon 1997) Moreover, (Dwyer et al., 1987) emphasized a relationship
as a method that evolves over time characterized by five levels of relationship life
cycle, (awareness exploration, expansion, commitment and dissolution). The life
cycle begins with realize that first party is serious to exchange with another partner
(awareness). After then followed by the search or most appropriated relational
exchange partner (exploration) in this stage, the probable exchange partners have to
consider implementations, advantages and burdens and, the possibility of exchange
before entering to the third level. In the third level (expansion), trust starts to appear

55
as the benefits gained from the relational and interdependence increases. If a high
level of input is provided to the association and both partners believe that the future
exchange is going to be effective, Commitment will then be established Dwyer et al.
(1987) According to Dwyer et al.(1987,P.19) Commitment is defined as "an implicit
or explicit pledge of relational continuity between exchange partners".
2.11.4.3 Repurchase intention
In the marketing literature, there is large agreement on the vital role of repurchase
intention as the key behavioral result for relationship marketing success Reichheld,
(1996). Customers’ repurchase intention depends on the value obtained in their
transactions that have been done before Kaynak, (2003): Bolton et al. (2000) such as:
suitable performance criteria (the benefits that the party got from dealing with another
party), competition, and cost considerations Kumar, (2002). Repurchase intention also
refers to the individual’s opinion about buying again a chosen service from the same
company, taking in consideration his current condition and likely circumstances
Lacey and Morgan, (2009). Overall, customers evaluate future purchase intentions
based on the value obtained from previous contacts, with relationship benefits being
an alternative for expectations of future benefits.
2.12 Conclusion
This research is aimed to measure the impact of Logistics service quality on relation
quality in business to business field; this research selected the relation between
retailers and suppliers due to the great value that are presented to the customer, This
chapter showed how service quality concepts are evolving and developing in logistics
and how it's extended to be Logistics service quality, dimensions of service quality
and logistics service quality were highlighted. Moreover different differentiation of

56
supply chain management were introduced based on the literature, the importance of
logistics LSQ process model in measuring customer satisfaction was highlighted.
Finally "Relation Marketing" (RM) and "Relation Quality" (RQ) in relation marketing
were highlighted besides previous studies on "Relation Quality" where presented.

57
Chapter Three
Research Methodology

58
3.1 Introduction
Based on the literature reviewed in chapter Two, This chapter presents the
hypothesized model for "Logistics Service Quality" and "Relationship Quality".
variables of the study and introducing the proposed model formulated in the first
chapter, as well as it explains research methods used in examinations of relationships
between Logistics Service Quality (independent variables) and relationship Quality
(dependent variables), mediating effect of satisfaction on customer perceived Quality
and other relationship Quality variables. This chapter also presents the research
design, the tools that chosen for this research.
3.2 Research design
Deductive approach is adopted in this study … “A deductive approach is concerned with
developing hypotheses based on existing theory, and then designing a research strategy to test
the hypothesis” (Wilson, 2010, p.7). Theories in the literature were studied carefully
and investigated empirically. The existing concept and theoretical model are the
foundation references when selecting information, putting research instruments and
methods that relate the analysis result to theories.
The empirical part will be based on primary and secondary data, Secondary data
comes from the various sources such as the case studies, reports, or different related
sources while primary data will be collected and supported by quantitative evidence
through a questionnaire adopted from literature review based on previous related
studies.

59
3.3 Research questions
RQ1: Do Logistics Service Quality Dimensions have a positive effect on Retailer
Satisfaction?
RQ2: Does Retailer Satisfaction lead to high Relationship Quality?
3.4 Research Hypotheses Development
The development of hypotheses was based on literature review and derived from the
theoretical framework combining concept of Logistics Service Quality and
Relationship Quality (Ruben, 2007) The following hypotheses were formulated form
empirical studies analysis for determining correlations and predictors effect between
independent variables and dependent variables using multiple ways, total effect
analysis of Logistics Service Quality dimensions with Satisfaction, and finally,
examine the mediating role of satisfaction in the whole model of framework.
The set of independent and dependent variables defined is based on previous studies
in (chapter 2) .Figure (3.1) shows the Theoretical framework used in the study
This figure presents the proposed model. This model was developed based on the
previous studies (refer to Figure 1.2 in Chapter One). Both technical and functional
character of Logistics Service is integrated in the Logistics Service Quality model
(Mentzer et al, 2001). They are used by nine constructs discussed in Chapter Two,
this dimensions are as follows: personnel contact Quality, order release quantity,
information Quality, ordering procedures, order accuracy, order condition, order
Quality, timeliness and satisfaction. and the relationship Quality dimensions ( trust,
commitment and repurchase intention).

60
3.5 Research Hypotheses
Based on the model that shown above, the research is divided into two sections, first
one about Logistics Service Quality (LSQ) and Satisfaction, Second one Satisfaction
and Relationship Quality (RQ).
3.5.1 Logistics Service Quality (LSQ) and Satisfaction Hypotheses:
This research aim at testing the impact of logistics service quality on satisfaction, and
the effect of retailer satisfaction on LSQ and RQ
Mentzer et al, (2001) investigated whether different groups of customers of a
particular organization with multiple market segments might place varying degrees of
importance on LSQ components, study Mentzer's study determine the degree of
importance of each LSQ component in the four customer segments of a large
logistics organization in third party organization., Jafaar (2007) tested LSQ across
industrial sectors in the UK and measured the impact of LSQ on RQ in the Business
field . Jafaar study investigated the effects of relationships among logistics service
quality, customer satisfaction and relationship quality The following hypothesis are
derived from LSQ literature with some modifications to be suitable for this research .
H1: Logistics service quality dimensions has a positive effect on retailers'
Satisfaction
(H1a) Personnel Contact Quality Positively affect Retailer Satisfaction.
(H1b)Order release quantities positively affect Retailer Satisfaction.
(H1c) Information Quality Positively affects Retailer Satisfaction.
(H1d)Order Procedures Positively affects Retailer Satisfaction.
(H1e) Order accuracy positively affects Retailer Satisfaction.
(H1f) Order Condition Positively affects Retailer Satisfaction.
(H1h) Order Quality Positively affects Retailer Satisfaction.
(H1i) Timeliness positively affects Retailer Satisfaction.
(H1J) Order Discrepancy Handling positively affects Retailer Satisfaction

61
3.5.2 Relationship Hypotheses
Jafaar (2007) measured the effect of industrial Satisfaction with Logistics Service
Quality on Relationship Quality, It is cleared that satisfaction with service quality
may have some effects on relationship quality dimensions in business to business
field. This study investigates the impact of satisfaction with LSQ on relationship
quality based on the result from Logistics Service Quality on Retailer Satisfaction.
H2: A higher level of retailer satisfaction leads to high relationship quality
The hypotheses that shown below are derived from the main one:
(H2a): A higher Level of Retailer Satisfaction Leads to Higher Level of Trust.
(H2b): A higher Level of Trust Leads to Higher Level of Commitment.
(H2c): A higher Level of Trust Leads to Higher Level of Repurchase Intention.

62
(Figure 3.1): Proposed Model in the study
Personnel Quality Contact
Order release quantities
Information Quality
Order Procedures
Order accuracy
Order Condition
Order Discrepancy
Handling
Order Quality
Timeliness
Satisfaction Trust
Commitment
Repurchase
intention
H1
H2a
H2b
H2c
H1h
H1g
H1f
H1e
H1d
H1c
H1b
H1a
H2
H1i

63
3.6 Sampling procedures
3.6.1 Definition of the sampling technique
Sampling techniques save a big range of methods that enable researcher to reduce the
amount of data needed for a study by considering only the main and important data
rather than all possible elements (Saunders et al., 2009). The purpose of sampling is
To draw conclusions about populations from samples, it must use statistics result
which enables us to determine a population`s characteristics by directly observing
only a sample of the population. Obtaining sample rather than a complete people of
the population for many reasons. Clearly, it is cheaper to observe a part rather than the
full ,
In this study non-probability sampling technique called Snowball was used .This type
of sampling was engaged for quantitative results. "Snowball" is used in those rare
cases when the population of interest cannot be identified other than by someone who
knows that a certain person has the necessary experience or characteristics to be
included” (MacNealy 1999,p 175). Snowball sampling includes previously identified
group members to recognize others who may distribute the same factors as the group
already in field (Henry 1990).The most common benefit of snow ball is no way of
knowing whether the sample is representative of the population, as for the
disadvantage of snow ball sampling techniques is the possibility to include members
of groups where no lists or particular clusters even exist (e.g., drug abusers, criminals)
(Black 1999).
3.6.2 Proposed sampling characteristics
The proposed sampling characteristics of this study that developed by the researcher
according to the Egyptian chambers of commerce is the retailers in Alexandria who

64
use over 50 % of the floor space for unbranded grocery items such as spices, sugar,
pulses, rice and flour. These shops also store some branded and packaged items like
dairy products, personal care products, and traditional fast food. They arrange space
from 100 to 8000 square meters in dimension; they have at least 5 shelves to branded
and packaged category grocery items. They have at least 2 workers and the average
sales per month shouldn’t be less than 50000.
3.7 Pilot Study
Pilot study can be defined as a trial study carried out before a research design is
finalized to assist in defining the research question or to test the reliability and validity
of the proposed study design.6This study was completed and applied on 40 samples of
retailers to test reliability and validity of the questionnaire, in order to avoid
uncertainty questions and to reformulate questions. (Konhauser 2007).The external
validity is clarified in the statements in the questionnaire that have been modified and
deleted based on expert opinions in retailing field (names) in addition to deleting 2
statements and modifying most of the questionnaire for translating the questionnaire
from English to Arabic and back translation to make sure that the meaning of the
statements didn’t change and in order to be able to distribute the last version to the
targeted retailers. Joppe (2000 p. 1) defined reliability as "The extent to which results
are consistent over time and of an accurate representation of the total population
under study and if the results of a study can be reproduced under a similar
methodology, then the research instrument is considered to be reliable". If he
reliability factor (Alpha) for the independent variables ranged from 0.55 – 0.80
(approved and accepted) and the reliability factor (Alpha) for the dependent variables
6(http://www.cirem.co.uk/definitions.html)

65
ranged from 0.70 to 0.95 (approved and accepted) the reliability of overall model is
accepted and approved .
3.8 Variables of the study
Table (3.1) Conceptual and Operational definitions of research variables
NO. Variables Conceptual Operational
1-
Personnel
Contact quality
Personnel contact quality refers to
the customer orientation of the
supplier's logistics contact people.
Specifically, customers care about
whether customer service personnel
are knowledgeable, empathize with
their situation, and help them resolve
their problems. (Bitner 1990)
A four-point Likert scale developed
by (Mentzer et al., 2001) was used to
measure the quality of the personal
that retailers are dealing with, the
four points Likert response scale
used in the current study ranged from
(1)"Strongly Agree” to (4)
“Strongly Disagree”.
2-
Information
quality
Information quality refers to
customers' perceptions of the
information provided by the supplier
regarding products from which
customers may choose (Mentzer,
Flint. and Kent 1999).
A four-point Likert scale developed
by (Mentzer et al., 2001) was used to
measure the quality of the
information that retailers received
from suppliers, the four points Likert
response scale used in the current
study ranged from from
(1)"Strongly Agree” to (4) “Strongly
Disagree”.
3-
Order Release
Quantities
is able to met request promptly.
Product availability. The
organization can challenge
customers' requests to ascertain the
need behind their volume requests(
(Mentzer 1989)
A four-point Likert scale developed
by (Mentzer et al., 2001) was used to
measure the quantity of release order
for retailers, the four points Likert
response scale used in the current
study ranged from from
(1)"Strongly Agree” to (4) “Strongly
Disagree”.
Order quality refers to how well
products work (Novack Rinehart.
A four-point Likert scale developed
by (Mentzer et al., 2001) was used to
measure the quality of the order that

66
4-
Order quality
and Langley 1994).
retailers received, the four points
Likert response scale used in the
current study ranged from from
(1)"Strongly Agree” to (4) “Strongly
Disagree”.
5-
Timeliness
Refers to the length of time between
order placement and receipt (Hult et
al. 2000).
A four-point Likert scale developed
by (Mentzer et al., 2001) was used to
measure the time between make the
order and receive it, the four points
Likert response scale used in the
current study ranged from from
(1)"Strongly Agree” to (4) “Strongly
Disagree”.
6-
Ordering
Procedures
Refer to the efficiency and
effectiveness of the procedures
followed by the supplier (Bird 1997).
A four-point Likert scale developed
by (Mentzer et al., 2001) was used to
measure the procedures that used to
make an order , the four points
Likert response scale used in the
current study ranged from from
(1)"Strongly Agree” to (4) “Strongly
Disagree”.
7-
Order condition
Refers to how closely Goods match
customers' orders upon arrival
(Wagenheim 1989).
A four-point Likert scale developed
by (Mentzer et al., 2001) was used to
measure the condition of the order
that retailers received , the four
points Likert response scale used in
the current study ranged from from
(1)"Strongly Agree” to (4) “Strongly
Disagree”.
8-
Order accuracy
refers to how closely shipments
match customers' orders upon arrival
(, Mentzer, 1997)
A four-point Likert scale developed
by (Mentzer et al., 2001) was used to
measure the accuracy of the order
that retailers received, the four points
Likert response scale used in the
current study ranged from from
(1)"Strongly Agree” to (4) “Strongly
Disagree”.
Order
Discrepancy
Order discrepancy handling refers to
how well the receiver handles any discrepancies in orders after the orders
A four-point Likert scale developed
by (Mentzer et al., 2001) was used to

67
Handling arrive.(Langley 1994) measure the handling of discrepancy
that retailers found in the goods, the
four points Likert response scale
used in the current study ranged from
1 “Strongly Disagree” to 4"Strongly
Agree”. The two statements used to
measure Order Accuracy on
satisfaction mentioned on table of
questionnaire.
9-
Satisfaction
Is a measure of how products and
services supplied by a company meet
or surpass customer expectation its
defined by the number of customers,
or percentage of total customers,
whose reported experience with a
firm, its products, or its services
(ratings) exceeds specified
satisfaction goals. (Johnson 2001)
A four-point Likert scale developed
by \Andaleeb’s(1996) was used to
measure the the satisfaction of the
retailers as a result of receiving a
service from supplier, the four points
Likert response scale used in the
current study ranged from from
(1)"Strongly Agree” to and (4)
“Strongly Disagree”.
10-
Trust
is just as important in the
online environment, affecting
customer’s perceptions and
willingness to participate and
establish relationships with suppliers
online (Gefen et al., 2003)
A four point Likert scale developed
by (Doney and Cannon 1997) was
adapted and used to measure the
customer’s perception of trust with
the supplier, the eight statements
used to measure a level of
Satisfaction on Trust mentioned on
table of questionnaire.
11-
Commitment
defined as “an exchange partner
believingthat an ongoing relationship
with another is so important as to
warrant maximum efforts at
maintaining it; that is, the committed
party believes the relationship is
worth working on to ensure that it
endures indefinitely ( Dwyer et al.
1987)
A four point Likert scale developed
by Kumar el al,1995 was adapted
and used to measure the customer’s
perception of commitment with the
supplier, from (1)"Strongly Agree”
to (4) “Strongly Disagree”.

68
12-
Repurchase
Intention
refers to the individual’s opinion
about buying again a chosen service
from the same company, taking in
consideration his current condition
and likely circumstances (Lacey and
Morgan, 2009)
The four point Likert scale
developed by (Bartet et al, 2005),
was adapted and used to measure the
customer’s perception of
commitment with the supplier, the
three statements used to measure
Trust on Repurchase intention
mentioned on table of questionnaire.

69
CHAPTER FOUR
Data Collection and Analysis

70
4.1 Introduction
The purpose of this chapter is outlining the empirical results of the hypothesized
Logistics Service Quality, and Relationship Quality Model that has been explained in
Chapter 3 based on quantitative data that were collected through a self administered
questionnaire. This chapter will present the analysis and the result of this research.
4.2 Sample presentation of targeted Retailers
The following table represents the gender classification of the respondents to the
questionnaire held. As indicated, all the samples that responded on the questionnaire
were a male 100%:
The activity of the retailers that was chosen for this research was based on 3 groups
the first group included sellers and distributor, the second group included producers,
distributors and sellers ,as for the third group it is included producers, distributors ,
sellers besides activities , the participate of the first group got the huge quote from the
questionnaire response, this group response 132 questionnaire by (92.3%) , due to the
traditional nature of the retailers' sector in Egypt, the second group response 8
questionnaire which presents (5.8%) of the sample, and the third group response 3
applications by which presents (2.1%).

71
X47 = the Activity of retailers
Figure: 4.1 Respondents’ activity of retailer
Table: 4.1 Respondents’ activity of retailer
x47
Frequency Percent Valid Percent
Cumulative
Percent
Valid distribution and selling 132 92.3 92.3 92.3
production , distribution and
selling
8 5.6 5.6 97.9
production ,distribution
,selling and "other"
3 2.1 2.1 100.0
Total 143 100.0 100.0

72
The average sales for the retailers is divided into four sections, the first one ranged
from 50000 to 100000 LE, the second one ranged from 100000 to 500000 LE, the
third one ranged from 500000 to 1000000 LE, the last one more than 1000000, as
shown below, the second group got the most response by 44.8 %, then next ,the first
one got 26.6% , then followed by the third group of average sales by 25.6, and the last
group of respondents more than 1000000LE with 2.8 %.
Table: 4.2 Respondents’ average sales
Figure 4.2 Respondents’ average sales
X48 =the average sales
x48
Frequency Percent
Valid 50000 - 100000 38 26.6
100000 - 500000 64 44.8
500000 - 1000000 37 25.9
more than 1000000 4 2.8
Total 143 100.0

73
The experience of the retailers in the markets playing a vital role in the relationship
between the retailers and their suppliers, this point is classified into five groups; these
groups represent the experience of the retailers who responded to the questionnaire,
The highest group of respondents was from 5 – 10 years by total 60 applications gets
(42 %) , then followed by the second group from 11 – 15 years by total of 36
applications (25.2%) , the third group from 16 – 20 years with a total of 26
applications with(18.2%) , followed by fourth group less than 5 years by total 15
applications with (10.5%) ,the last one more than 20 years by total 6 applications gets
(4.2%) .
Table: 4.3 Respondents’ retailers experience
Figure 4.3 Respondents’ retailers experience
X49 = the experience of the retailers
x49
Frequency Percent
Valid less than 5 years 15 10.5
5 – 10 60 42.0
11 – 15 36 25.2
16 – 20 26 18.2
more than 20 6 4.2
Total 143 100.0

74
Finally, the duration of dealing with the suppliers, as indicated in the following table
4.4 below the number of years that the targeted retailers still dealing with their
suppliers.
Table: 4.4 Respondents’ duration with the suppliers
X50 = The duration with the suppliers
x50
Frequency Percent
Valid 1 1 .7
2 6 4.2
3 11 7.7
4 16 11.2
5 13 9.1
6 1 .7
6 11 7.7
7 12 8.4
8 11 7.7
9 9 6.3
10 12 8.4
11 7 4.9
12 6 4.2
13 5 3.5
14 3 2.1
15 8 5.6
16 2 1.4
17 3 2.1
18 1 .7
19 2 1.4
20 1 .7
28 1 .7
45 1 .7
Total 143 100.0

75
Figure 4.4 Respondents’ duration with the suppliers
4.3 Data analysis
The Quantitative analysis that used in this study was presented through the
questionnaire, There are two main purposes of questionnaire formula related to data
quality: first, to decrease non-response, and second, to cut or avoid measurement error
(Alreck & Settle, 2004). Several researchers suggest that it is the most productive
method in obtaining in data (Churchifl, 1999). The questionnaire is used to study the
degree of relationship between retailers and suppliers, the questionnaire distributed in
Arabic as it is the main language of the Egyptian retailers. 200 copies distributed to
potential and targeted retailers who have classifications and specifications that were
mentioned in chapter3, at the 143 responses were distributed in 3 months which
represents 71.5% response rate of the distributed questionnaire. The questionnaire
included fifteen questions divided into three sections all included at the end of the
research in. The statements of the questionnaire are related to variables under study.

76
4.4 Assessment of the study measurement model
4.4.1 Reliability Measurement
The reliability of the research is presenting in the test of the reliability for each
variable, Cronbach’s alpha is the method that used to measure, and the measuring of
these variables was accepted ranged from .970 to 0.979 for the Logistics Service
Quality variable measured by 25 items, for Satisfaction was measured by 4 items
(0.973) Relationship Quality measured by 15 items (.970), and the overall
questionnaire reliability is .979. Bagozzi and Yi's (1988) stated that all the reliability
values exceeded the usually threshold value for acceptable reliability of .70 and the
minimum values of .60, Therefore, it is concluded that all constructs have high
reliabilities.
4.4.2 Validity Measurement
Reliability is necessary but not sufficient for construct validity, the The questionnaire
was design based on previous studies in the same field. Construct validity is the extent
to which items of the questionnaire make measures what it should measure .Validity
is important because theoretical constructs are not observable, and relationships
among unobservable constructs are tested indirectly via observed variables
(Goreskog, 1993), validity reflects how well the calculation reflects its unobservable
construct. It is recognized using relationships between observed variables and their
unobserved variable, and observed variables' relationships with other sets of observed
variables (Goreskog, 1993), a valid measure is using normally convergent and
discriminate validity (Heeler and Ray, 1972)

77
4.4.2.1 Convergent Validity
Convergent validity refers to the degree in which the measures of a construct are
highly correlated to each other (Mentzer and Flint,1997).
4.4.2.2 Discriminate validity
A stronger test of discriminate validity suggested by (Fornell and Larcker 1981) is the
average variance extracted for each construct should be higher than .50, which the
variance accounted for by each items is greater than the variance accounted for by
measurement error (Hair et al, 1998). All constructs met the standard level range from
.67 to 0.93 as shown in Table (4.7)
4.4.3 Correlation
Correlation is a measure of the strength of the relationship between two variables. The
correlation coefficient takes on values ranging between +1 and -1. Zero indicates no
relationship, +1 indicates a perfect positive relationship if one variable increases in its
values, the other variable also increases in its values, -1 indicates a perfect negative
linear relationship if one variable increases in its values, the other variable decreases
in its values, as indicated in table 4.7 the correlations between variables ranged from
.533 to .670 , the .690 between Personnel contact Quality and Satisfaction , 533
between timeliness and satisfaction , 561 between Satisfaction and trust , .641
between Trust and Commitment ,finally .670 between Trust and Repurchase
intention , we can say that a good relationship between the variables

78
(a) Standard factor loading. (b) Critical Ratio. (c) Squared Multiple Correlation. (d) Composite Reliability. (e)
Average variance extracted, (f) Cronbach Alpha.
7 Composite reliability is calculated by the square of summation of factor loadings (SMC values)/
[(Square of summation of factor loadings) + (summation of error variances)]. According to Fornell and
Larker (1981), a value of .80 or greater suggests evidence of strong composite reliability. 8 Average Variance Extracted (AVE), It could be calculated by
(summation of squared factor loadings)/ [(summation of squared factor loadings) +(summation of error
variances)]. It has been suggested that AVE should be greater than 0.50 to demonstrate significant
variance captured by the measurement model (Fornell and Larker, 1981).
Table (4.5 ) Convergent validity, discriminate validity and Reliability
Latent variables & its
Observed items Item SFLa C.R.b SMCc C R
7d AVE
8e α f
PQ
x16 0.929 Fixed 0.863 0.9569 0.88109 .941
x15 0.929 20.016 0.862
x14 0.899 18.15 0.809
Time
x25 0.518 Fixed 0.269 0.8541 0.67158
.782 x22 0.869 6.427 0.755
x21 0.855 5.909 0.731
SAF
x26 0.923 Fixed 0.852
0.9783 0.91871 .973
x27 0.966 23.726 0.934
x28 0.948 21.86 0.898
x29 0.96 22.993 0.921
Trust
x30 0.876 Fixed 0.767
0.9453 0.68968 .942
x31 0.572 7.659 0.327
x32 0.891 15.614 0.794
x33 0.929 17.308 0.863
x34 0.901 15.922 0.812
x35 0.92 16.741 0.847
x36 0.864 14.634 0.746
x37 0.589 7.935 0.347
ReI
x43 0.974 Fixed 0.949 0.9757 0.93064
.968 x44 0.981 36.921 0.961
x45 0.909 22.846 0.826
Com
x38 0.517 Fixed 0.267
0.9370 0.75596 .915 x39 0.957 6.957 0.916
x40 0.968 6.947 0.936
x41 0.859 6.653 0.738
x42 0.782 6.406 0.611

79
4.5 Assessment of the Study’s Structural Model
The hypothesized structural model was tested using AMOS 18,the first evaluation of
the structural model indicated that there is weak relationship between some variables
that have been tested to be directed relationship on satisfaction ,figure 4.8 shows the
proposed Model that has been tested .Figure 4.9 shows the actual model after analysis.
Figure 4.5 Hypothesized Model
Source: AMOS Output
OrQs= Order release quantities, ORA= Order accuracy, OrQu= Order Quality,
OrP= Order Procedures, OrC=Order Condition, PQ = Personnel Quality Contact,
InQ=Information Quality, Time= Timeliness, OrHD= Order Handling Discrepancy,
SAF =Satisfaction, Com= Commitment, ReI =Repurchase Intention
Table ( 4.6 ) Correlation matrix for measured models and AVE
PQC TL SF TR RI COMM PQC 0.881097
TL .193 0.67158
SF .476 .284 0.918713
TR .344 .152 .315 0.689689
RI .377 .298 .329 .449 0.930643
COMM .241 .226 .227 .411 .423 0.755968
Note: The values on the diagonal line (the shadowed parts) are the Average
Variance Extracted (AVE). The remaining values are the squared of the study
variables correlation coefficients.

80
Results: in order to determine the capabilities for the variable to explain the variance
for another variable, there are two ways first P (Probability) indicates significant
regression path when (P<.001), Second the path is considered as significant when the
C.R.(Critical Ratio) is at 0.5 level or more, Maximum Likelihood (ML) was used to
test the study’s proposed model As a result, findings revealed that "order release
quantities" didn’t explain the variance in "Satisfaction" (P<..944, C.R =.70). In the
same line, "Order Accuracy" didn't explain the variance in the "Satisfaction"
(P<..126, C.R =1.529),"order quality" considered a weak predictor to explain the
variance of "Satisfaction" (P<.684, C.R =.407)As for "order Procedures" had a weak
contributions to explain the variance of "satisfaction", (P<.256, C.R =1.135), In
contrast, "order condition" turned out to have a negative effect on "Satisfaction"(P
<0.005, C.R.=-.461),"Personnel Contact Quality" figured as a high and strong
predictor to explain the variance of "satisfaction"(P<.001, C.R =6.088).Moreover the
capability of "information quality" to explain the variance in the "Satisfaction" is very
low(P<.680, C.R =.412),"Timeliness" significantly explain the variance of
"satisfaction" (P<.094, C.R =1.301), "satisfaction" was examined as a predictor for
the "Trust" construct in which it played a major role in explaining the variance in the
"Trust" (P<.001, C.R =11.387), On the other hand, "Trust" construct was examined as
a predictor for the two variables "commitment and repurchase intention" the results
showed that these variables played a major role in explaining the variance
"commitment (P<.001, C.R =6.492), and repurchase intention"(P<.001, C.R =15.511)
constructs. as Figure 4.8 shows the Hypothesized Model that used in this study Based
on the results that, there are some variables eliminated and neglected from the model
to be fitted, as shown in Figure (4.9)some important modifications were done to
enhance the goodness of fit for the proposed model.

81
Figure 4.6 Hypothesized Modified Model
Source: AMOS Outpu
Results: There were some modifications done in the model to be fitted for this study,
Order release quantities ,Order Quality, Order condition, information quality , and
Order handling discrepancy ,were removed to make the model fit, "Personnel Contact
Quality" figured as a high and strong predictor to explain the variance of
"satisfaction"(P<.001, C.R =6.088).In the same line, "Timeliness" significantly
contributes to explaining the variance of "satisfaction" (P<.094, C.R =1.301),
"satisfaction" was examined as a predictor for the "Trust" construct in which it played
a major role in explaining the variance in the "Trust" construct (P<.001, C.R
=11.387), On the other hand, "Trust" construct was examined as a predictor for the
two variables "commitment and repurchase intention" the results show that these
variables played a major role in explaining the variance "commitment (P<.001, C.R
=6.492), and repurchase intention"(P<.001, C.R =15.511) constructs.

82
4.5.1 Model Goodness of Fit
In order to determine the goodness of a model fit, some measures need to be
highlighted; Chi-square is the traditional measure for evaluating overall model fit
,another statistical measures to prove that the fitting of the model CFI, CMIN, TLI
and RMSEA.
As indicated in Table (4), the Chi-square is to 716.631 which present good fit of the
model and P value indicates significant regression path when (P<.001), also the path
is considered as significant when the C.R. is at 0.5 level or more.
Table 4.7 Computation of degrees of freedom
Another indicators that measure the goodness of model fit is the CMIN/DF= 2.446,
CFI=.913, TLI=.904 and RMSEA=.101, these indicators indicated that hypothesized
model has a good fit with the sample in the study which was , supported by the chi-
square that indicated that the probability level is significant as shown in the following
table (4.10)
Number of distinct sample moments: 351
Number of distinct parameters to be estimated 58
Degrees of freedom (351 - 58): 293
Chi-square 716.631
Sample Size 143

83
Table (4.8) summarizing the model fit indices
Goodness of
Fit Measure
Explanation
Recommended
Value
Calculated
Value
Chi Square to df
Ratio: ÷2/df
CMIN/DF is the minimum
discrepancy divided by its
degrees of freedom.
Low as 2 or high as
5 (Marsh &
Hocevar, 1985).
2.446
Tucker Lewis
Index or Non-
normed Fit Index
(NNFI)
TL130
The typical range
for TLI lies between
zero and one, but it
is not limited to that
range. TLI values
close to 1 indicate a
very good fit.
(Bentler and Bonett,
(1980)
.904
CFI
Compared fit index:
compares the hypothesized
model with the independent
model
.90
(Myerscough, 2002)
.913
Figure (4.10) Fitted research model

84
4.5.2 Hypotheses Testing
The proposed model of the study develops the following hypotheses:
H1: Logistics Service Quality Dimensions has a Positive Effect on Retailer
Satisfaction
Although hypotheses cannot be proved as true or wrong, hypotheses are statistically
accepted or rejected based on levels of significance and critical ratio (CR). Therefore,
in this study the results were based on critical ratio (C.R) and P (Probability) when
(P<.001),
H1a: Personnel Contact Quality positively affect Retailer Satisfaction. (Supported)
The findings of testing H1a cleared that there is a highly significant relation between
personnel Contact Quality and Retailer Satisfaction the result of the hypothesis also
yields a high significant P value. (P<.001, CR=7.747).
H1b: Order release quantities positively affect Retailer Satisfaction. (Not supported)
Testing the relation between the two variables; Order release quantities and Retailer
Satisfaction achieved unacceptable P value (P <.944, C.R. = .070).
H1c: Information Quality positively affects Retailer Satisfaction. (Not supported)
Testing the relation between information Quality and Retailer Satisfaction, resulted in
a weak relationship (P <.680, C.R. = .412).
H1d: Order Procedures positively affects Retailer Satisfaction. (Not supported)
Personnel Contact
Quality
Timeliness
Satisfaction
Trust
Repurchase
intention
Commitment

85
Examine if there is a positive relation between Order Procedures and Retailer
Satisfaction, the relationship cleared that (P <.256, C.R. = 1.135).
H1e: Order accuracy positively affects Retailer Satisfaction. (Not supported)
The findings for this hypothesis indicated that the relationship between Order
accuracy and Retailer Satisfaction was not strong (P <.126, C.R. = 1.529).
H1f: Order Condition positively affects Retailer Satisfaction. (Not supported)
Testing the relation between Order Condition and Retailer Satisfaction cleared that
there was a weak relationship between the two variables (P <.645, C.R. = -.461).
H1h: Order Quality positively affects Retailer Satisfaction. (Not supported)
Examining the relation between Order Quality and Retailer Satisfaction reflected a
very weak relationship (P <.684, C.R. =.407).
H1i: Timeliness positively affects Retailer Satisfaction. (Supported)
Examine if there is a positive relation between Timeliness and Retailer Satisfaction
this relationship achieve (P <.001, C.R. = 2.694).
H1J: Order Discrepancy Handling positively affects Retailer Satisfaction. (Not
supported)
Examining the relation between Order Discrepancy Handling and Retailer
Satisfaction reflects a very weak relationship (P <.094, C.R. =.1675).

86
The second global hypothesis is :
H2: A higher Level of Retailer satisfaction Leads to High Relationship Quality.
H2a: A higher Level of Retailer Satisfaction Leads to Higher Level of Trust.
(Supported)
Testing H2a revealed that higher Level of Retailer Satisfaction significantly explains
the variance Trust. It reflects a good relationship (P <.001, C.R. = 11.362).
H2b: A higher Level of Trust Leads to Higher Level of Commitment. (Supported)
Testing H2a revealed that a higher Level of Trust had a big role to reach to Higher
Level of Commitment, this relation explained in (P <.001, C.R. = 6.492).
H2c: A higher Level of Trust Leads to Higher Level of Repurchase Intention.
(Supported)
Testing H2c revealed that Trust significantly explained the variance in Repurchase
Intention, this relation explained in (P <.001, C.R. = 15.508).
Table (4.9) Summary of Accepted Hypotheses
Hypothesis (H1a) personnel Contact Quality Positively affect Retailer Satisfaction.
(H1i) Timeliness positively affects Retailer Satisfaction.
(H2a) A higher Level of Retailer Satisfaction Leads to Higher Level of Trust.
(H2b) A higher Level of Trust Leads to Higher Level of Commitment.
(H2c) A higher Level of Trust Leads to Higher Level of Repurchase Intention.
Table (4.10) Summary of rejected Hypotheses
Hypothesis (H1b)Order release quantities positively affect Retailer Satisfaction.
(H1c) information Quality Positively affects Retailer Satisfaction.
(H1d)Order Procedures Positively affects Retailer Satisfaction.
(H1e) Order accuracy positively affects Retailer Satisfaction.
(H1f) Order Condition Positively affects Retailer Satisfaction.
(H1h) Order Quality Positively affects Retailer Satisfaction.
(H1J) Order Discrepancy Handling positively affects Retailer Satisfaction.

87
Table (4.13) Comparison of results between the Current Study and previous
Studies
Most of studies agreed that Personnel Quality contact, Timeliness and order quality
are the major factors that have a big effect on customer satisfactions,and also from
customer satisfaction on Trust , Commitment and Repurshase Intination,Cleared in
these studies Mentzer, Gomes, and Krapfel (1989), Mentzer, Flint, and Kent (1999),
Mentzer, Bienstock, and Kahn (1993), Bienstock, Sharma, Ballou, Grewal and Levy
(1995) Christopher, Bienstock ,Mentzer, and Bird (1997), Emerson and Grimm
(1998), Christopher, Moraes and Lacombe ,Flint and Kent, Elram, Lalonde and
Weber (1999), Mentzer et.al (2001), CEL(2003), Forslun, Gustafsson (2003) Mentzer
et al (2004),Jaafar (2006); Davied and mentzer (2006) Richey et al., (2007); Ruth
Banomyong and Nucharee Supatn, (2011) Bouzaabia(2013).
4.6 Conclusion
This chapter analyzed the sample of the study, the process of measurement
modifications and established measurement validity and reliability, a detailed
statistical analysis was presented to the results of the questionnaire that has been
Hussein 2014 Jaffar 2006 Jessica 2012 Mentzer19
99 Irene et
al 2008
Personnel Quality
Contact Supported Supported Supported Supported Supported
Order release
quantities Not Supported Not Supported Not Supported Supported
Timeliness Supported Supported Supported Supported Supported
Order Procedures Not Supported Supported - Supported - Order accuracy Not Supported Not Supported Supported Supported -
Order Condition Not Supported Supported Supported Supported - Order Quality Not Supported Not Supported - Supported Supported
Information
Quality Not Supported Not Supported - Supported Supported
Trust Supported Supported Supported -
Commitment Supported Supported Supported - Repurchase
intention Supported Supported Supported -

88
provided with highlighting the critical results using tables and figures. This chapter
also presented a structural model and the modifications for model fit, the results for
testing the hypotheses was Five of the eleven hypotheses were accepted and
significant, while six hypotheses were not significant. a new line the next chapter will
explain the conclusions and the recommendations based on the results that explained
in this chapter and discussion to the findings of research.

89
Chapter Five
Discussion and Conclusion

90
The aim of this chapter is to check if the research questions were answered, whether a
research objective was met and if the study has contributions. It begins with a
conclusion, then recommendations, followed by limitations and finally suggested
future research in the end of the chapter.
5.1 Conclusions
The concept of logistics service quality is a significant instrument for delivering a
better logistics service performance (Stock and Lambert, 2001). There many studies
focused on the definitions and descriptions of how logistics creates customer
satisfaction and competitive advantage (jaafer 2006, Mentzer et al, 2001; Novack et
al, 1994; Mentzer and Firman, 1994; Mentzer, 1993; Coyle et al, 1992; Mentzer et al,
1989; Ackerman, 1989; Lambert, 1987; Shapiro and Heskett, 1985; La Londe and
Zinszer, 1976; Perrault and Russ, 1974). The aim of this study was to examine the
Impact of Logistics Service Quality (LSQ) on relationship Quality (RQ) in business to
business (B2B) field, This study used Mentzer et al (2001) LSQ scale for measuring
logistic service quality. relationship elements in the market and the long term
relationships in business to business had a great effect on the retailers helping in
keeping those retailers in the right track , By adding the relationship quality
dimensions into the LSQ process model (Christopher and Peck, 2004; Henniig-
Thurau, 2000;Hennig-Thurau and klee, 1997). This study provides its hypothesized
model, chapter two highlights the definitions and the descriptions of Logistics Service
Quality model and the Relationship quality model, this led to formulate the research
questions via the research objectives , The first question was formulated Do Logistics
Service Quality Dimensions positively effect on Retailer Satisfaction? to answer if
there is a positive effect from Logistics Service Quality on Retailer satisfaction, the
results from chapter four based on the analyses cleared that there are some dimensions

91
that effect Retailer satisfaction, It included the nine dimensions (personnel contact
quality, order release quantities, information quality, ordering procedures, order
accuracy, order condition, order quality, timeliness and order discrepancy handling) ,
The quantitative research is measured by using a questionnaire which has been
distributed on retailers in Alexandria based on the criteria that has been mentioned in
chapter three. The second question Does Retailer Satisfaction lead to high
Relationship Quality? Clears the effect of retailer satisfaction on relationship quality,
This question has been answered on chapter four and shows a high relationship
between the two variables, the results suggested that relationship quality dimensions
prevent customer's intention from exiting from the business relationships. And it helps
to corroborate the deeply relationship between the customers in business field.
The contribution of this research linked satisfaction directly with LSQ dimensions,
Jaafar (2006) built his model based on Mentezer LSQ Model, this research used a
LSQ Model by a different way, and explained the impact of customer satisfaction on
Relationship Quality, most of the previous researches were focusing on the
relationships between business to customer (B2C), This study investigated
relationships in a business to business relationship context viewed from the customers'
perspective.
5.2 Discussions and Recommendations
From global perspective, Retail sales have increased in the last ten years due to the
expansion of international chains, variety of products offers, and increase in the level
of income levels and brand advertising. From customer perspective Egyptian
consumers are beginning to expect cleanliness, quality, and a wider variety of
products. Consumers are currently asking for convenience, and shopping at
supermarkets is becoming a leisure activity, achieve and providing these perspectives

92
consider the backbone of retailers goals , Relationships with suppliers, and the quality
of the products, improve a retailer’s value delivery network and improve customer
satisfaction. Relationships with suppliers, and the quality of these relationships,
increase retailer’s value delivery network and improve customer satisfaction. Because
the Egyptian market is currently fragmented, Egyptian retailers must find ways to
create relationships with their suppliers that help take advantage of economies of
scale, JIT inventory and other Western retailing practices. To compete with retail
chains, independent retailers should collaborate together to form cooperatives to
increase their buying power with suppliers (Runyan and Droge, 2008). Egyptian
retailers must find ways to create relationships with their suppliers these points that
mentioned below recommended to develop the retailers – suppliers relationship:
1- Take the advantage of economies of scale from suppliers.
2- Realizing the meaning of JIT 2 inventory.
3- Dealing with different suppliers whether local or foreign supplier, to make a
wider variety to products.
4- Suppliers must make sure that products are consistently available in the market
in order to build retailer satisfaction.
5- Suppliers should hire a reliable distributor to ensure that products are available
in retailer shelve all times.
6- Realizing the meaning of supply chain and the role of the retailer as a
representative of the company for the consumers, and the supplier as a
representative for the producer for retailers in supply chain.
7- the retailers should collaborate together to form cooperatives to increase their
buying power with suppliers
8- Save facilities in payment between the two parties.

93
Mentzer et al (2001) highlighted the four constructs that were hypothesized to have
direct effects on satisfaction Personnel contact quality (H1a), ordering procedures
(H1d), timeliness (H1i) and order discrepancy handling (H1j), these variables have a
great effect on satisfaction, Jaafar (2006) resulted that the strongest effect on
satisfaction was from personnel contact quality (PQ>SA .305), followed by ordering
procedures (.090) and order discrepancy handling In this study Personnel contact
quality has a strong effect on satisfaction followed by timeliness .on the other hand
most of the researches confirmed that satisfaction positively influences trust, which is
in line with previous conceptual (Crosby et al, 1990; Anderson and Narus,
1990;Storbacka et al, 1994; Ganesan, 1994; Bendapudi and Berry, 1997; Tax et al,
1998; Selnes, 1998;Narayandas and Rangan, 2004;Jaffar 2006) . Strong empirical
support was found for a positive path on trust and commitment, which verifies most
research findings (Anderson and Weitz, 1989; Achrol, 1991Moorman et al, 1992;
Morgan and Hunt, 1994 Garbarino and Johnson, 1999 Geyskens et al, 1996; Ruyter et
al, 2001;Jaffar 2006) .Finally , A strong relationship between Trust and repurchase
intention(Fornell et al., 1987;Oliver, 1993; Anderson and Sullivan 1993) confirmed
the great relationship between these variables .This study is in line with results of
previous studies exist in literature.
5.3 Limitations and Future research:
This research introduced the model of Logistics Service Quality and its effect on
Relationship Quality enhance of logistic performance, this study is presented a sample
from Alexandria city and mostly dependent upon the more general studies conducted
in the past in this field, this research lacks to generalization on Egypt, In this study
the tools used to collect the information from the retailer were mainly encompassing
the delivery and service that present to the other party (retailer dealing with) to

94
measure the logistic performance due to the scope of the research but in the future it is
recommended to test other variables that can determine the relationships between
retailers – suppliers relationship, on the other hand , The research can be expanded to
other product categories to cover the retail sector in general and not just in food
sectors.

95
References :
Aaker, D. A., Kumar, V., & Day, G. S. (2004). Marketing research ,(8th ed). New
York: John Wiley & Sons.
Abdel Hamid,M. (2012) Investigating the Factors That Influence Continue Receive
Mobile SMS Advertisements An empirical Study applied in EGYPT.PHD,UK.
Albrecht, K. and Zemke, R. (1985.Service America. Dow Jones-Irwin, Homewood, IL.
Alreck, P. L., & Settle, R. B. (2004). The survey research handbook (3rd
ed).
Boston:McGraw-Hill Irwin.
Anderson, E.W., Fornell, C., & Lehmann, D.R. (1994). Customer satisfaction, market
share and profitability: Findings from Sweden. Journal of marketing, pp. 53-56.
Agresti, A & Finlay, B. (2009) .Statistical Methods for the Social Sciences. (4thed).
New Jersey, Pearson Education, Inc.
Barney J.B and Hansen M.H. (1994) Trustworthiness as a Source of Competitive
Advantage, Strategic Management Journal, 15, 175-190
Bauer, HH, Hammerschmidt, M,. Falk T. (2005) Measuring the service quality of e-
banking portals, International Journal of Bank Marketing, 23, 153–75.
Beamon, B.M. (1998) Supply chain design and analysis: models and methods.
International Journal of Production Economics, 55(3), 281–294.
Bejou, David, Barry Wray, and Thomas N. Ingram (1996) Determinants of
relationship quality: An artificial neural networks analysis. Journal of Business
Research, 36, 137-43.
Berg, S. (2006). Snowball Sampling–I, in Encyclopedia of Statistical Sciences, edited
by Samuel Kotz, , NJ: John Wiley and Sons, Inc. 7817–7821.
Berry, L. L. (2002). Relationship Marketing of Services-Perspectives from 1983 and
2000. Journal of Relationship Marketing,1, 59-77.
Berry, L. L. (1995). Relationship marketing of services Growing interest, emerging
perspectives. Journal of the Academy of Marketing Science, 23, 236-245.
Black, T. R. (1999). Doing quantitative research in the social sciences: An integrated
approach to research design, measurement, and statistics. Thousand Oaks, CA.
Bienstock, C. C., Mentzer, J. T. and Bird, M. M. (1997). Measuring Physical
Distribution Service Quality, Journal of the Academy of Marketing Science, 25(3),1-
44.
Bienstock, C C., Royne, M. B., Stafford, T.F. (2008), An Expanded model of logistics
service quality: Incorporating logistics information technology, International Journal
of Production Economics, 113,205-222.
Binkley, J. K. and Bejnarowicz, J. (2003) Consumer Price Awareness in Food
Shopping: The Case of Quantity Surcharges, Journal of Retailing .79 , 27-35.

96
Bitner, M. J. (1990), Evaluating Service Encounters: The Effects of Physical
Surrounding and Employee Responses: Journal of Marketing.9,69-81.
Berkowitz, E. Caron, R., Hartley, S.,& Rudelius, W. (2000) Marketing Boston:
Irwin/McGraw-Hill, USA.
Blois, K. J. (1999).Trust in business to business relationships: An evaluation of its
status. The Journal of Management Studies, 36,190- 197.
Brady, M. K. & Cronin, Jr. J. J. (2001). Some New Thoughts on Conceptualizing
Perceived Service Quality: A Hierarchical Approach, Journal of Marketing, 65,34-49.
Brewer, P.& Speh, T. (2000).Using the Balanced Scorecard to measure supply chain
performance”, Journal of Business Logistics, 21, 75-93.
Bucklin, L.P., (1966) Retail Strategy and the Classification of Consumer Goods.
Journal of Marketing, 27, 50-55.
Carman, J. (1990). Consumer Perceptions of Service Quality: An Assessment of the
SERVQUAL Dimensions. ,Journal of Retailing,66, 33-55.
Cronin, J. J., and Taylor, S. A. (1994). SERVPERF versus SERVQUAL: reconciling
performance based and perceptions-minus-expectations measurement of service
quality. Journal of Marketing, 58, 125–131.
Churchill, G. A. and Peter, J. P. (1984). Research Design Effects on the Reliability of
Rating Scales: A Meta Analysis, Journal of Marketing,21,360-75.
Christopher, M. and Towill, D.R., (2000).Supply Chain Migration from Lean and
Functional to Agile and Customized. International Journal of Supply chain, 5,206-
213.
Christopher, M., & H. Peck, H. (2004).Building the resilient supply chain.
International Journal of Logistics Management , 15, 1-14.
Christopher, M. (1998).Logistics and Supply Chain Management: Strategies for
Reducing Cost and Improving Service, 2nd
ed. Great Britain: Financial Times /
Prentice Hall.
Coughlan, A. T., Anderson, E., Stern, L. W., & El-Ansary, A. I. (2001). Marketing
Channels" ,6th ed. Upper Saddle River, New Jersey: Prentice-Hall, Inc.
Cousins, P.D., Lawson, B., Squire,B. (2006) . Supply chain management: theory and
practice – the emergence of an academic discipline. International Journal of
Operations and Production Management, 26, 697 – 702.
Crosby, L. A., Evans, K. R. & Cowles, D. (1990). Relationship Quality in Services
Selling: An Interpersonal Influence Perspective. Journal of Marketing ,81. 210-225.

97
Croxton, K.L., Garcia-Dastugue, S.J., Lambert, D.M. and Rogers, D.S. (2001).The
supply chain management processes, International Journal of Logistics Management.
12 , 13-36.
Coyle, J.J., Bardi, E.J., Langley Jr., J.C. (1992). The Management of Business
Logistics, (5th ed), West, St. Paul, MN.
Coviello, N. E., & Brodie, R. J. (2001). Contemporary marketing practices of
consumer and business-to-business firms: How different are they?. The Journal of
Business & Industrial Marketing, 16, 382-400.
Royne, C. Marla B., Stafoord, Thomas F. (2008). An Expanded model of logistics
service quality: Incorporating logistics information technology. International Journal
of Production Economics .113, 205-222.
Daskin, M. S. (1985). Logistics: An Overview of the State of the Art and Perspectives
on Future Research. Transportation Research. 19,383-398.
Davidson, S.M, and Rummel, A. (2000) .Retail changes associated with Wal-Mart's
entry into Maine. International Journal of Retail & Distribution Management 28, 162-
169.
Dawson, J. (2001). Is there a new commerce in Europe? International Review of
Retail. Distribution and Consumer Research, 11, 287-299
Day, G. S. (1994). The capabilities of market driven organizations", Journal of
Marketing.13, 22-38.
Dobson, P W. (2002). Retailer Buyer Power in European Markets: Lessons from
Grocery Supply. Loughborough University Business School Research Series, No.1.
Doney, P.M. & Cannon J.P. (1997). An examination of trust in buyer-seller
relationships. Journal of Marketing. 61, 35-52.
Dorsch, M.l J., Scott, R. Swanson, & Scott W. K. (1998). The role of relationship
quality in the stratification of vendors as perceived by customers. Journal of the
Academy of Marketing Science, 26, 128-42
Dwyer, F., Schurr, P. and Oh, S. (1987). Developing buyer-supplier relationships",
Journal of Marketing. 51, 11-20.
Ellinger, A., Ellinger, A. & Keller, S. (2002). Logistics managers’ learning
environments and firm performance. Journal of Business Logistics, 5,19-37.
Economic Update Egypt: The Rise of Retail. Retrieved January 13, 2011 from
http://www1.oxfordbusinessgroup.com/economic_updates/egypt-rise-retail.
Ellram, L. M., La Londe Bernard J., Weber. (1999). Retail Logistics, International
Journal of Physical Distribution & Logistics Management, 29 (7),477-494

98
Farmer, D. (1997). Purchasing myopia revisited. European Journal of Purchasing and
Supply Management, 3,1-8 .
Finch, B.J (2006). "Operations Now: Profitability, Processes, Performance", (2nd ed),
McGraw-Hill/ Irwin, United States.
Gabriela, A. (2013). Effect of Relationship Quality and Cost to Serve on Customer
Value in Business Market. Master thesis.USA.
Gad.S. (2013) Investigating the Potential Application of Virtual Supply Chain
Concept in the Grocery Retailing Sector in Alexandria Egypt. Master thesis, Arab
Institute for Trade & Commodity Exchange, EGY.
Garbarino, E. & Johnson, M. S. (1999). The Different Roles of Satisfaction, Trust and
Commitment in Customer Relationships. Journal of Marketing,15.70-87.
Ganesan, S. (1994). Determinants of long term orientation in buyer-seller
Relationships. Journal of Marketing. 58(2),1-20.
Ganeshan, R. & Harrison, T.P. (1995). An Introduction to Supply Chain Management.
Retrived from http://silmaril.smeal.psu.edu/misc/supply_chain_intro.html.
Gefen, D., Karahanna, E., & Straub, D. W. (2003)" Trust and TAM in online
shopping: An integrated model. MIS Quarterly, 27 (1),51-90.
Ghiani, G. ,Laporte, G.,& Musmanno, R. (2004). Introduction to Logistics Systems
Planning and Control. Jhon Wiley & Sons Ltd.
Grönroos C. (1984) "A Service Quality Model and Its Marketing Implications",
European Journal of Marketing. 4,36-39.
Grönroos, C. (1995). Relationship marketing: The strategy continuum. Journal of the
Academy of Marketing Science,23(4),252-254.
Grönroos, C. (1996).Relationship marketing: Strategic and tactical implications.
Management Decision.19 pp. 5-14.
Guru, C. (2003). Tailoring e-service quality through CRM", Managing Service
Quality, 13 ,20-531.
Handfield ,R Nichols, E. (2002) .Supply Chain Redesign". Upper Saddle River (NJ):
Prentice-Hall.
Hassan, M. (2009). The Impact of Relationship Duration and Logistics Performance
on Relational Norms in Wholesaler Retailer Relationships. Master thesis, Moled
university, Norway.
Hasty, R. W & James R. (1997). Retail management, (first ed). McGraw-Hill
Companies, England.

99
Hardine, M. D. & Ferrel, O. C. (1996). The Management of Customer Contact
Employees: An Empirical Investigation. Journal of Marketing,20, 52-70.
Harker, M, J. (1999). Relationship Marketing Defined? An Examination of Current
Relationship Marketing Definitions. Marketing Intelligence & Planning . 17,13–20.
Hausman, A. (2001).Variations in relationship strength and its impact on performance
and satisfaction in business relationships. The Journal of Business & Industrial
Marketing,16(6),600-616.
Lee,H.W. & Billington C. (1995). The Evolution of Supply Chain Management
Models and Practice. Hewlett-Packard. 25, 42-63.
Hennig T. and Alexander K. (1997). The impact of customer satisfaction and
relationship quality on customer retention: A critical reassessment and model
development. Psychology and Marketing, 14(8), 737-64.
Hennig T., Gwinner K.P., & Gremler D.D. (2002). Understanding Relationship
Marketing Outcomes: An Integration of Relationship benefits and Relationship
Quality Journal of Service Research.4(3),230-47.
Hemanth ,C. (2011).Retail Marketing.(first ed),e-book Google India , India
Hult, G. T. M., Hurley, R. F., GiuniPero, L. C. and Nichols, Jr. E. L. (2000).
Organizational Learning in Global Purchasing: A Model and Test of Internal Users
and Corporate Buyers, Decision Sciences, 31 (2),293-325.
Ivens, B. R. S., & Pardo, C. (2007). Are key account relationships different?
Empirical results on supplier strategies and customer reactions. Industrial Marketing
Management, 36, 470-482.
Jafaar ,H. (2006). Logistics Service Quality and Relationship Quality in Third Party
Relationships. Loughborough University, Loughborough University PHD, UK.
Jain V., Patel N., Shah D., Patel P., & Joshi B.,(2010)" Supply Chain Management:
Literature Review and Some Issues", Journal of Studies on Manufacturing , 1, 11-25.
Jayashankar M. S., Stephen F. S., & Norman M. S.,(1996). A Multi Agent Framework
for Modeling Supply Chain Dynamics. Technical Report, the Robotics Institute,
Carnegie Mellon University.
Johnson, M. D. (2001). The evolution and future of national customer satisfaction
index models. Journal of Economic Psychology.22,217–245.
Johnston, R. (1995). The Determinants of Service Quality: Satisfiers and Dissatisfies.
International Journal of Service Industry Management. 6 (5),53–71.
Kalwani, M. U. & Narakesari N. (1995). Long-term Manufacturer-Supplier
Relationships: Do They Pay?. Journal of Marketing. 59, 1-16.

100
Mandrodt,K.B., Holcomb M.C., & Thompson R.H. (1997). What’s Missing in Supply
Chain Management?. Supply Chain Management Review, p. 81.
Kaynak, H. (2003). The relationship between total quality management practices and
their effects on firm performance. Journal of Operations Management, 21, 405-35.
Keebler, J.S ., Mandrodt, K. B., Durtsche, D. A. & Ledyard, D. M. (1999). Keep gin
Score: Measuring the Business value of Logistics in the Supply chain.Council of
Logistics Management, Chicago.
Konhauser, A. (2007). Understanding Value In B2B Buyer-Seller Relationships: Do
Matching Expectations Improve Relationship Strength ?. Master thesis, Australia.
Korpela, J., Lehmusvaara, A. & Tuominen, M. (2001). An analytic approach to supply
chain development. International Journal of Production Economics,71,(3), 145–155.
Krafft ,M . & Mantrala, M. K. (2010). Retailing in the 21st Century: Current and
Future Trends :Springer-Verlag Berlin Heidelberg,Us
Kumar, P. (2002). The impact of performance, cost, and competitive considerations on
the relationship between satisfaction and repurchase intent in business markets.
Journal of Service Research, 5 (1),55-68.
Lacey, R. & Morgan R.M. (2009). Customer advocacy and the impact of B2B loyalty
programs. Department of Management and Marketing, University of Alabama,
Tuscaloo. J. Bus. Ind. Market. 24(1),3–13.
Lagace, R. R., Dahlstrom,R., and & Gassenheimer, J.B., (1991).The Relevance of
Ethical Salesperson Behavior on Relationship Quality: The Pharmaceutical Industry.
The Journal of Personal Selling & Sales Management,11(4),39.
Levy, M., Barton A. (2001) Retailing management. (4th ed). New York: McGraw-Hill
Rinehart,L.M. and John L. J. (1994). An Internal Assessment of Logistics Value.
Journal of Business Logistics. 25,113-53.
Liu, C.- T., Guo, Y. M. & Lee, C.- H. (2011(. The effects of relationship quality and
switching barriers on customer loyalty. International Journal of Information Management,31,71-79.
Lovelock, C.H.,(1983).Classifying services to gain strategic marketing insights.
Journal of Marketing. 47.9-20.
Low, B. K. H. (1996). Long-term relationship in industrial marketing: Reality or
rhetoric?. Industrial Marketing Management, 25(1), 23-35.
Hennig-Thurau, T. and Klee, A. (1997). The Impact of Customer Satisfaction and
Relationship Quality and Customer Retention: A Critical Reassessment and model
Development. Journal of Marketing, 14, 737-64.
Henry, G. T.( 1990). Practical Sampling. London, Sage Publications. 21.

101
MacNealy, M.S. (1999). Strategies for Empirical Research in Writing. New York:
Longman.
Moorman, C., Rohit, D. & Gerald, Z. (1993). Factors affecting trust in market research
relationships", journal of Marketing, 570, 81-101
McClearly, K.W. & Weaver, P.A. (1982). Improving employee service levels through
identifying sources of customer satisfaction", International Journal of Hospitality
Management. 1(2), 9-85.
Meczes, R. (2002). Room for third party improvement?. Distribution, 105, 12-13.
Mentzer, J. T. & Firman, J. (1994). Logistics Control Systems in the 21 Century.
journal of Business logistics. l, 215-218.
Mentzer, J. T. & Kahn, K. B. (1995). "A Framework of Logistics Research", Journal
of Business logistics,16 , 231-250.
Mentzer, J. T. & Flint, D. J. (1997). Validity in Logistics Research. Journal of
Business Logistics,18(l), 199-216.
Mentzer, J. T. & Williams, L. R., (2001). The Role of Logistics Leverage in Marketing
Strategy. Journal of Marketing Channels. (3),29-48.
Mentzer, J.T.(2001).Defining Supply Chain Management. Journal of Business
Logistics. 22, (2), 1-26.
Mohr, L. A. & Bitner M. J., (1995). The Role of Employee Effort in Satisfaction with
Service Transactions. Journal of Business Research, 32 , 239–52
Novack, R. A., Rinehart, L. M., & Langley Jr., C. J. (1994). An Internal Assessment of
Logistics Value. Journal of Business logistics.15, 113-152.
Odekerken-Schroder, G., De Wulf, K., & Schumacher, P. (2003). Strengthening
outcomes of retailer-consumer relationships: The dual impact of relationship
marketing tactics and consumer personality. Journal of Business Research.56, 177-
190.
O'Malley, L., & Tynan, C. (2000).Relationship marketing in consumer markets -
Rhetoric or Reality?, European Journal of Marketing,34,797-815.
Ostrow, R. (2009). The Fairchild Dictionary of Retailing", Second ed, New York,
Fairchild Books, Inc.
Omar, O. (1999). Retail Marketing. Pitman Publishing : London .
Davila, A., Gupta, M. & Palmer, R. (2003). Moving procurement systems to the
Internet": adoption and use of e-procurement technology. European Management
Journal, 21, 11 – 23.

102
Parasuraman, A., Zeithaml, V.A., & Berry, L.L. (1985). A Conceptual Model of
Service Quality and its Implications for Future Research. Journal of Marketing, 49,41-
50.
Parasuraman, A., Zeithaml, V.A., & Berry, L.L. (1988). SERVQUAL: A Multiple-
Item Scale for Measuring Customer Perceptions of Service Quality. Journal of
Retailing, 64.12-40.
Patton, M.Q. (1990). Qualitative evaluation and research methods. SAGE
Publications: London.
Perreault, J., Russ, F.A., (1974). Physical distribution service: A neglected aspect of
marketing management. MSU Business Topics Summer, Bienstock, Carol, 37-45.
Rafid, M. and Jaafar, H.S. (2007). Measuring customers’ perceptions of logistics
service quality of 3PL service providers. Journal of Business Logistics, 28(2),159-75.
Ganeshan, R. & Harrison,T. P. (2006). An introduction to supply chain management.
Penn State University.
Reichheld,. F. (1996). Loyalty Effect: The Hidden Force Behind Growth, Profits and
Lasting Value. Harvard Business School Press, Cambridge, MA.
Richard, J. (2008). The Impact of Customer Relationship Management (CRM)
Technology on Business-to-Business Customer Relationships. PHD, Wellington
University , NewIsland .
Rosenbloom, B. (2004). Marketing channels: a management view", (7th ed), South-
Western, Cengage Learning.
Ruben,C. & Nicholas, G. (2007). Service quality, relationship satisfaction, trust,
commitment and business – to – business loyalty. Journal of Marketing.41, 836 –867.
Banomyong R., Supatn, N. (2011). Selecting logistics providers in Thailand: a
shippers' perspective", European Journal of Marketing.45, 419 - 437
Bouzaabia, R., Bouzaabia, O., & Capatina, A. (2013). Retail logistics service quality:
a cross-cultural survey on customer perceptions. International Journal of Retail &
Distribution Management, 41, 627 - 647
Saura, I. G., Frances, D. S., Contri, G.B & Blasco. M. F. (2008). Logistics service
quality: a new way to loyalty", Industrial Management & Data Systems,108(5),650-
668.
Scott, C., & Westbrook, R., (1991). New strategic tools for supply chain management.
International Journal of Physical Distribution and Logistics Management.21, 23-33.
Shahin, A., & Dabestani, R. (2010). Service Quality Improvement Based on Gap
Correlation Analysis - with a Case Study in a Four-Star Hotel. International Business
Research, 3 (3),40-46.

103
Shet, N., Deshmukh, S.G. & Vrat, P. (2006). A conceptual model for quality of service
in the supply chain", International Journal of Physical Distribution & Logistics
Management, 36 (7), 547-575.
Sherrell, D. L. & Bejou D. (2007). Assessing the Productivity of Relationship
Marketing: Moving Toward a Paradigm", Journal of Relationship Marketing ,6 ,3-7.
Sirdeshmukh, D., Singh, J., & Sabol, B. (2002). Consumer trust, value, and loyalty in
relational exchanges". Journal of Marketing, 66 (1),15-37.
Sohrabi, B., Vanani, I.R., Tahmaswbipur, K., & Fazil, S. (2012). An exploratory
analysis of hotel selection factors: A comprehensive survey of Tehran hotels.
International Journal of Hospitality Management, 31(1), 96-106.
Stank, T.P., Goldsby, T.J., Vickery, S.K. & Savitskie, K. (2003). Logistics service
performance: estimating its influence on market share”, Journal of Business Logistics,
24 (1), 27-55.
Storbacka, K., Strandvik, T., & Grönroos, C. (1994). Managing customer relationships
for profit: The dynamics of relationship quality. International Journal of Service
Industry Management, 5 (5), 21-38.
Suprenant, C. F. and Solomon, M. R. (1987). predictability and personalization in the
service encounter", Journal of Marketing,51, 86-96.
Tapp, A. (2005). Principles of direct and database marketing. (3rd
ed) Harlow,
England: Prentice Hall.
Tilanus, B. (1997). Information systems in logistics and transportation. Elsevier
Science Ltd., UK.
McGuffog, T., Wadsley, N., (1999). The general principles of value chain
management. Supply Chain Management: An International Journal, 4 ,218 – 225.
Vesel, P. & Zabkar, V. (2010). Relationship Quality Evaluation in Retailers '
Relationships with Consumers. European Journal of Marketing, (44), 1334- 1365.
Waters, D. (2003). An Introduction to supply chain management. NewYork ,NY,
Palgrave :Macmillan.
Wel C. and Bojei J. (2009) Determining Relationship Marketing Instruments. JUP
Journal of Marketing Management . 8 ,25-41.
Wilson, S. (2010). Research is ceremony: Indigenous research methods. Halifax, NS,
Canada: Fernwood.
Kersten, W., Koch, J., (2010). The effect of quality management on the service
quality and business success of logistics service providers. International Journal of
Quality & Reliability Management, 27, 185 – 200.

104
Zeithaml, V.A., Berry, L.L. & Parasuraman, A. (1996). The behavioral consequences
of service quality.. Journal of Marketing, 60,31-46.
Zentes, J., Janz, M. & Morschett, D. (2005). New dimensions in consumer goods
marketing–manufacturer-retailer relationships. Institute of Handel and International
Marketing , University of Saarlandes, Saarbrücken.

105
Appendix A: Arabic Questionnaire
,عزيزي المستقصي منه
والتااي عتق ااص بعالااك عمعااتم ماا اا مااع ,اسااة ا اتساات ا ت الت لاااا برجاا ا التماارل بم اا
(.الخ.............,و جا اتلتزال ,جع ة االدا اوامر الشراا)عتق م عت مقه من ن حاا
ثاا اتج بااا ع اال اتسااة ا ,لاا ا نرجااع التماارل ب اتااا احااد ا اا المااع ين الاا ين عتقاا م عت مق اا
.بشف فاا
و ت جمااا ال ا ناا ص عتصااك , باا ت اج باا عم عااىثر ع اال نتاا ا الد اسااا اتجم لاااا برجاا ا الق اا
وساانعافام بنتاا ا ال اا بقااد ,ب لسااريا الت مااا ولاان عسااتيدل ات فااي اارام ال اا الق مااي
.اعم مه
شمرا لمس عدعم ؛
م مع احمد حسان :اتس
03000100010:المعب يل
[email protected]:اتيمال

106
في ا القس نقعل بقا س مدي جع ه اليدم ص ال عجاستاا المقدما لشركتم من األولالقس
ع ل المع
ت اوافص بشده ت اوافص اوافص اوافص بشده
0 1 0 3 اجد القعبا في االدا امر الل ب لمماا المل عبا من ا المع ت 3
0 1 0 3 ي ي ا المع امر ط كما ص اض فاا وت اي مقعع ص 0
0 1 0 3 يستجا ا المع تمر عيفاض المماا وت اي مشم ا 1
0 1 0 3 فا مر عب ع ي االن ف ار من ا المع ن ا م ع تعي الل اا 0
0 1 0 3 ي تزل ا المع بتع يد اتالن ف المل عبا ولاست ال دي ا ل 5
0 1 0 3 يفي ا المع بتع يد ب لمما ص المل عبا وت اال ا 6
0 1 0 3 ح لا جاده يالمع عمعت ف ا من المست مال ض ا 7
0 1 0 3 المل عبا المع عل بص المعاالف ص ا ال ض المرس ا من 0
0 1 0 3 هو ماسر هس ل ا المع اجراااص استصدا امر التع يد 9
0 1 0 3 من ا المع عند االدا امر عع ياد جديد من المع هت ععجد اجراااص مققد 30
0 1 0 3 يقعل ا المع ب ل ف ظ ع ي ال ض في مي زنه و عس ام ب لا جاده 33
0 1 0 3 ال ض التي نست م من ا المع م شرة ت يعجد ب ع فا ص 30
0 1 0 3 ن ا م ع دث ع فا ص عند نقل ال ض من ا المع بس وسا ا النقل 31
0 1 0 3 يظ ر ا المع عد ا ك ارا من ال رص ع ي ا ض ن 30
0 1 0 3 مقه ع ي حل المش كل بلريقه عم اا يقمل ا المع ال ي نتق مل 35
0 1 0 3 ا المع ال ي نتق مل مقه ع ي عد ك ار من الي رة و المقرفا 36
0 1 0 3 يعفر ا المع المق عم ص المل عبا الععت المن س 037
0 1 0 3 المق عم ص التي ن صل ع ا من ا المع عمعت عاقا 30
0 1 0 3 المق عم ص التي ن صل ع ا من ا المع عمعت ك م ا 39
0 1 0 3 المق عم ص التي ن صل ع ا من ا المع عمعت ال عا 00
0 1 0 3 ي تزل ا المع بمعاعاد التس ا المتفص ع ا 03
0 1 0 3 و اتستمل من س من ا المع الععت بان استصدا امر التع يد 00
0 1 0 3 اجراااص عقدي شمعى ل ا المع بس الى في ال ض المست ما عت بشمل ماسر 01
0 1 0 3 استج با ا المع لتص اح الى في ال ض المست ما عت بشمل من س 00
0 1 0 3 عنف في وعت عصار من ا المع اجراااص عم اا المرعجق ص 05
0 1 0 3 ب لمع ال ي اعق مل مقهان اضي عن عمعتي 06
0 1 0 3 عمعتن م ا المع عقمس نعع من ال جا و السق ة بانن 07
0 1 0 3 القمعا ايج باا بانن و بان ا المع 00
0 1 0 3 شركتن اضاا ض ا ع م ب لتق مل م ا المع 09

107
في ا القس نقعل بقا س مدي جع ه اليدم ص ال عجاستاا المقدما لشركتم : ث نيالقس ال
ع ي جع ة القمعا بان الشركا و المع
ت اوافص بشده ت اوافص اوافص اوافص بشده
0 1 0 3 مع الشركا بععع ه التي يقعل بإبرام م الشركا يفي ا 10
0 1 0 3 يتصك ا المع بقدل اتم نا مقن ب لتق مل 13
0 1 0 3 ن ن ا م نمعت ع ي ثقا في المق عم ص التي يمدن ب ا المع 10
0 1 0 3 ي ت ا المع بنج ح شركتن 11
0 1 0 3 عند اعي ذ عرا م يدعمن ا المع في اعي ذه كم لع انه شريك 10
0 1 0 3 ألنه يقعل ب ت تم ل بىعم لن بشمل مستمر:ن ن نثص في ا المع 15
0 1 0 3 يتصك ا المع ب لثقا الت ما 16
0 1 0 3 نتق مل م ا المع ب 17
0 1 0 3 م مع ين جد من سا سا المنظما التق مل 10
0 1 0 3 ن ن حق ن التق مل م ا المع ألنن ع ي عمعا جاده به 19
0 1 0 3 احس سن اتيج بي عج ه ا المع من القعامل التي عدععن لمستمرا مقه 00
0 1 0 3 المع ا م عمعتن ان ا ل غ يا مم ك سامعت 03
0 1 0 3 ألنن ت يعجد لدين اا اص ااري المع ا م عمعتن نعاالل 00
0 1 0 3 لدي الناا ل شراا مره ااري من ا المع 01
0 1 0 3 من العاضح انني سعف اععل ب لشراا من ا المع مره ااري 00
0 1 0 3 سعف اوعك التق مل م ا المع في المستق ل 05

108
ال ا ن ص المتق قا ب لشركا و المستقصي منه:ث ل الالقس
:النعع
ذكر
انثي
:نعع النش ط التي عقعل الشركا به
ععزي و با فقط
انت ج و ععزي و با منتج ص الشركا فقط
انت ج و ععزي و با منتج ص الشركا ب إلض فا الي ععزي منتج ص الغار
ااري
:حج الم اق ص المتعع لشركتم امل ش ر متعسط
300000الي 50000بان
500000ال 300000بان
3000000الي 500000بان
3000000اكثر من
:الي رة القم اا لسا عم
سنعاص 5اعل من
سنعاص 30 يلاسنعاص 5من
سنه 35الي 33من
سنه 00الي 36من
فىكثر سنه 00 من
:فترة وال القمعا م المع
شهر...........سنه ...........

109
Appendix B: English Questionnaire
Strongly
disagree
Disagree agree Strongly
agree
Statement
NO.
Requisition quantities are not challenged. 1
Difficulties never occur due to maximum release
quantities.
2
Difficulties never occur due to minimum release
quantities.
3
Shipments rarely contain the wrong items 4
Shipments rarely contain an incorrect quantity 5
Shipments rarely contain substituted items. 6
Substituted items sent by provider work fine 7
Products ordered from/via the provide meet technical
requirements
8
Requisitioning procedures are effective. 9
Requisitioning procedures are easy to use. 10
The designated key contact personnel make an effort to
understand the situation
11
Problems resolved by the designated key contact
personnel
12
The knowledge experience f the key contact personnel
adequate
13
Material received from provider depots is undamaged. 14
Material received direct from vendors is undamaged. 15
Damage rarely occurs as a result of the transport
mode or carrier
16
The information communicated by this provider s
timely
17
T he information communicated by this provider s
accurate timely
18
The information communicated by this provider s
complete
19
The information communicated by this provider s
credible timely
20
Deliveries arrive on the date promised 21
Time between placing requisition and receiving
delivery is short
22
Correction of delivered quality discrepancies is
satisfactory.
23
Response to quality discrepancy reports is satisfactory. 24
The amount of time a requisitions on backorder is short 25
Our business relationship with this suppler is strong. 26
The relationship between my company and this supplier
reflects a happy situation. 27
The relationship between the two companies is very
positive. 28
My company is very satisfied with this supplier. 29

110
No. Statement Strongly
agree
Agree disagree Strongly
disagree
30 This provider keeps promises it makes to our firm
31 This provider not always honest with us.
32 We believe the information that this provider provides
us
33 This provider is genuinely concerned that our business
succeeds
34 We find it necessary to be cautious with this provider.
35 We trust this; provider keeps our best interests in
mind.
36 This provider is trustworthy
37 Even if we could, we would not drop this provider
because we like being associated with them.
38 We want to remain a customer of this provider
because we genuinely enjoy our relationship with
them.
39 Our positive feelings towards this provider are the
major reason we continue working with them.
40 It would be too expensive to terminate our relationship
with this provider.
41 We continue our relationship with this provider
because we have no other viable options.
42 I have intention to repurchase from this provider.
43 It is likely that I will repurchase from this provider
44 I expect repurchase from this provider in the future

111
General Information about you and your company
You Gender: Male Female
Type of industry in which your firm involved
Selling and distribution
Selling, distribution and production your firm products.
Selling, distribution and production your firm products in addition to
distributing other companies.
Other
Your firms' average sales volume per month
Between 50000 to 100000
Between 100000 to 500000
Between 500000 to 1000000
Greater than 1000000
You Full-time work experience:
Less than 5 years
Between 5 to 10
Between 11 to 15
Between 15 to 20
Greater than 20
Length of relationship with this supplier
Month………… Year ………..

112
(Appendix C )Model of the study
Analysis Summary
Date and Time
Date: 11 3102, نوفمبر
Time: 12:22:34 م
Title
Ahmed hussin last trail: 11 م 03:33 3102, نوفمبر
Groups
Group number 1 (Group number 1)
Notes for Group (Group number 1)
The model is recursive.
Sample size = 143
Variable Summary (Group number 1)
Your model contains the following variables (Group number 1)
Observed, endogenous variables
x16
x15
x14
x25
x22
x21
x26
x27
x28
x29
x30
x31
x32
x33
x34
x35
x36
x37
x43
x44
x45
x38
x39
x40
x41

113
x42
Unobserved, endogenous variables
SAF
Trust
ReI
Com
Unobserved, exogenous variables
PQ
e16
e15
e14
Time
e25
e22
e21
e26
e27
e28
e29
e30
e31
e32
e33
e34
e35
e36
e37
e43
e44
e45
e38
e39
e40
e41
e42
e50
e51
e52
e53
Variable counts (Group number 1)
Number of variables in your model: 62
Number of observed variables: 26
Number of unobserved variables: 36
Number of exogenous variables: 32
Number of endogenous variables: 30
Parameter summary (Group number 1)

114
Weights Covariances Variances Means Intercepts Total
Fixed 36 0 0 0 0 36
Labeled 0 0 0 0 0 0
Unlabeled 25 1 32 0 0 58
Total 61 1 32 0 0 94
Models
Default model (Default model)
Notes for Model (Default model)
Computation of degrees of freedom (Default model)
Number of distinct sample moments: 351
Number of distinct parameters to be estimated: 58
Degrees of freedom (351 - 58): 293
Result (Default model)
Minimum was achieved
Chi-square = 716.631
Degrees of freedom = 293
Probability level = .000
Group number 1 (Group number 1 - Default model)
Estimates (Group number 1 - Default model)
Scalar Estimates (Group number 1 - Default model)
Maximum Likelihood Estimates
Regression Weights: (Group number 1 - Default model)
Estimate S.E. C.R. P Label
SAF <--- PQ .747 .096 7.747 *** par_21
SAF <--- Time .493 .183 2.694 .007 par_22
Trust <--- SAF .852 .075 11.362 *** par_23
Com <--- Trust .454 .070 6.492 *** par_24
ReI <--- Trust .878 .057 15.508 *** par_25
x16 <--- PQ 1.000
x15 <--- PQ 1.083 .054 20.016 *** par_1
x14 <--- PQ .991 .055 18.150 *** par_2
x25 <--- Time 1.000
x22 <--- Time 1.662 .259 6.427 *** par_3
x21 <--- Time 1.770 .300 5.909 *** par_4
x26 <--- SAF 1.000
x27 <--- SAF 1.100 .046 23.726 *** par_5
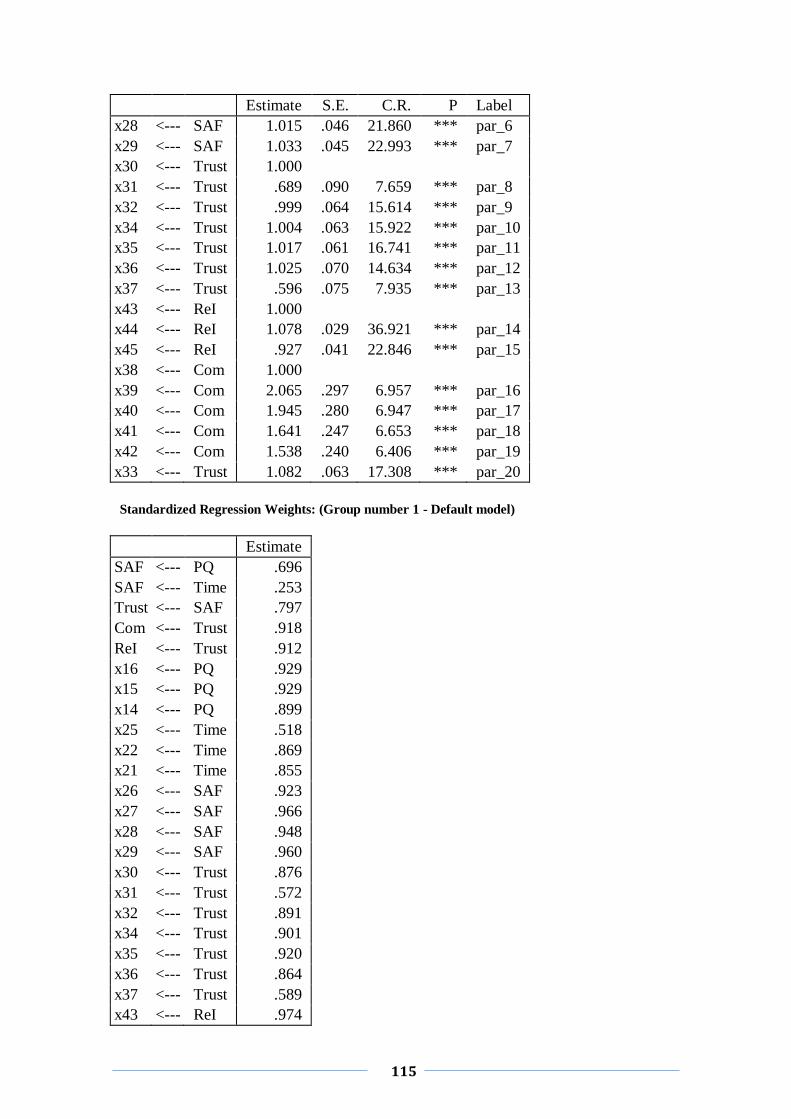
115
Estimate S.E. C.R. P Label
x28 <--- SAF 1.015 .046 21.860 *** par_6
x29 <--- SAF 1.033 .045 22.993 *** par_7
x30 <--- Trust 1.000
x31 <--- Trust .689 .090 7.659 *** par_8
x32 <--- Trust .999 .064 15.614 *** par_9
x34 <--- Trust 1.004 .063 15.922 *** par_10
x35 <--- Trust 1.017 .061 16.741 *** par_11
x36 <--- Trust 1.025 .070 14.634 *** par_12
x37 <--- Trust .596 .075 7.935 *** par_13
x43 <--- ReI 1.000
x44 <--- ReI 1.078 .029 36.921 *** par_14
x45 <--- ReI .927 .041 22.846 *** par_15
x38 <--- Com 1.000
x39 <--- Com 2.065 .297 6.957 *** par_16
x40 <--- Com 1.945 .280 6.947 *** par_17
x41 <--- Com 1.641 .247 6.653 *** par_18
x42 <--- Com 1.538 .240 6.406 *** par_19
x33 <--- Trust 1.082 .063 17.308 *** par_20
Standardized Regression Weights: (Group number 1 - Default model)
Estimate
SAF <--- PQ .696
SAF <--- Time .253
Trust <--- SAF .797
Com <--- Trust .918
ReI <--- Trust .912
x16 <--- PQ .929
x15 <--- PQ .929
x14 <--- PQ .899
x25 <--- Time .518
x22 <--- Time .869
x21 <--- Time .855
x26 <--- SAF .923
x27 <--- SAF .966
x28 <--- SAF .948
x29 <--- SAF .960
x30 <--- Trust .876
x31 <--- Trust .572
x32 <--- Trust .891
x34 <--- Trust .901
x35 <--- Trust .920
x36 <--- Trust .864
x37 <--- Trust .589
x43 <--- ReI .974

116
Estimate
x44 <--- ReI .981
x45 <--- ReI .909
x38 <--- Com .517
x39 <--- Com .957
x40 <--- Com .968
x41 <--- Com .859
x42 <--- Com .782
x33 <--- Trust .929
Variances: (Group number 1 - Default model)
Estimate S.E. C.R. P Label
PQ
.593 .082 7.260 *** par_27
Time
.180 .059 3.067 .002 par_28
e50
.116 .021 5.619 *** par_29
e51
.284 .046 6.227 *** par_30
e52
.030 .010 3.042 .002 par_31
e53
.122 .019 6.268 *** par_32
e16
.094 .016 5.731 *** par_33
e15
.111 .019 5.743 *** par_34
e14
.137 .021 6.606 *** par_35
e25
.490 .062 7.864 *** par_36
e22
.161 .036 4.513 *** par_37
e21
.207 .041 5.082 *** par_38
e26
.119 .016 7.339 *** par_39
e27
.058 .010 5.651 *** par_40
e28
.080 .012 6.698 *** par_41
e29
.062 .010 6.137 *** par_42
e30
.237 .031 7.609 *** par_43
e31
.763 .092 8.313 *** par_44
e32
.202 .027 7.547 *** par_45
e33
.144 .021 6.753 *** par_46
e34
.183 .025 7.233 *** par_47
e35
.146 .021 7.010 *** par_48
e36
.279 .036 7.738 *** par_49
e37
.522 .063 8.288 *** par_50
e43
.039 .008 4.709 *** par_51
e44
.034 .009 3.823 *** par_52
e45
.131 .017 7.630 *** par_53
e38
.525 .063 8.316 *** par_54
e39
.075 .013 5.602 *** par_55
e40
.049 .010 4.702 *** par_56
e41
.183 .024 7.702 *** par_57
e42
.288 .036 8.008 *** par_58

117
Squared Multiple Correlations: (Group number 1 - Default model)
Estimate
SAF
.831
Trust
.636
Com
.843
ReI
.831
x42
.611
x41
.738
x40
.936
x39
.916
x38
.267
x45
.826
x44
.961
x43
.949
x37
.347
x36
.746
x35
.847
x34
.812
x33
.863
x32
.794
x31
.327
x30
.767
x29
.921
x28
.898
x27
.934
x26
.852
x21
.731
x22
.755
x25
.269
x14
.809
x15
.862
x16
.863
CMIN
Model NPAR CMIN DF P CMIN/DF
Default model 58 716.631 293 .000 2.446

118
Model NPAR CMIN DF P CMIN/DF
Saturated model 351 .000 0
Independence model 26 5217.870 325 .000 16.055
RMR, GFI
Model RMR GFI AGFI PGFI
Default model .053 .723 .668 .604
Saturated model .000 1.000
Independence model .524 .088 .015 .081
Baseline Comparisons
Model NFI
Delta1
RFI
rho1
IFI
Delta2
TLI
rho2 CFI
Default model .863 .848 .914 .904 .913
Saturated model 1.000
1.000
1.000
Independence model .000 .000 .000 .000 .000
Parsimony-Adjusted Measures
Model PRATIO PNFI PCFI
Default model .902 .778 .823
Saturated model .000 .000 .000
Independence model 1.000 .000 .000
NCP
Model NCP LO 90 HI 90
Default model 423.631 348.891 506.060
Saturated model .000 .000 .000
Independence model 4892.870 4662.188 5129.967
FMIN
Model FMIN F0 LO 90 HI 90
Default model 5.047 2.983 2.457 3.564
Saturated model .000 .000 .000 .000
Independence model 36.746 34.457 32.832 36.127
RMSEA
Model RMSEA LO 90 HI 90 PCLOSE
Default model .101 .092 .110 .000
Independence model .326 .318 .333 .000
AIC

119
Model AIC BCC BIC CAIC
Default model 832.631 859.866 1004.476 1062.476
Saturated model 702.000 866.817 1741.958 2092.958
Independence model 5269.870 5282.079 5346.904 5372.904
ECVI
Model ECVI LO 90 HI 90 MECVI
Default model 5.864 5.337 6.444 6.055
Saturated model 4.944 4.944 4.944 6.104
Independence model 37.112 35.487 38.781 37.198
HOELTER
Model HOELTER
.05
HOELTER
.01
Default model 67 70
Independence model 11 11
Execution time summary
Minimization: .047
Miscellaneous: .905
Bootstrap: .000
Total: .952