chapter on model evaluation, indices of importance, and
TRANSCRIPT

Chapter
On model evaluation, indices of importance,and interaction values in rough set analysis
GüntherGediga1 andIvo Düntsch2
1 Institut für EvaluationundMarktanalysen,Brinkstr. 19,49143Jeggen,Germany,[email protected]
2 Departmentof ComputerScience,Brock University, St.Catherines,Ontario,L2S3AI,Canada,[email protected]
Abstract. As mostdatamodels,“Computingwith words”usesa mix of methodsto achieveits aims,includingseveralmeasurementindices.In this paperwe discusssomeproposalsforsuchindicesin thecontext of roughsetanalysisandpresentsomenew ones.
In the first part we investigateseveral classicalapproachesbasedon approximationqualityandthe drop of approximationquality whenleaving out elements.We show that usingtheapproximationquality index is sensiblein termsof admissibility, andpresentadditionalin-dicesfor the usefulnessandsignificanceof an approximation.The analysisof a “drop” isreinterpretedin termsof modelcomparison,anda generalframework for all theseconceptsis presented.
In thesecondpartof thepaperwepresentanexamplehow usingsimilarnomenclaturein thetheoryof Choquet-typeaggregationsof fuzzy measurementsandroughsetapproximationquality, without regardto thefinestructureof theunderlyingmodelassumptions,cansuggestconnectionswheretherearenone.
On a morepositive note,we show that so calledqualitative power andinteractionindices,which arestructurallysimilar to quantitative Choquet-typeaggregationscanbe usedin thecontext of rough set analysis.Furthermore,we proposean entropy-basedmeasurewhichallows theuseof qualitative power andinteractionindicesasanapproximation.
Co-operation for this paper was supported by EU COST Action 274 “Theoryand Applications of Relational Structures as Knowledge Instruments” (TARSKI),www.tarski.orgEqualauthorshipis implied

“Mesmerizedby asingle-purpose,mechanised‘objective’ ritual in which we convert num-bersinto othernumbersandget a yes-noan-swer, we have cometo neglect closescrutinyof wherethenumberscomefrom”. [3]
1 Introduction
Notwithstandingawidely spreadfascinationwith numbers,it is recognisedthathu-manbehaviour is oftenguidedby impreciseconcepts.In recognitionof this fact,thedirection“From computingwith numbersto computingwith words”, put forwardby Zadeh[36], callsfor a manipulationof perceptionsinsteadof measurements:
“The rationalefor computingwith wordsrestsontwo majorimperatives:1.computingwith wordsis a necessitywhentheavailableinformationis tooimpreciseto justify the useof numbersand2. whenthereis toleranceforimprecisionwhich canbeexploitedto achieve tractability, robustness,lowsolutioncostandbetterrapportwith reality” [36, p. 111].
This is not to saythat computingwith wordsdoesnot usenumbers;for example,fuzzy eventsandconstraintpropagationassumea continuousscaleof truth valuesfor propositions.Leaving asidethe questionwheretheseinitial parameterscomefrom, one finds that subsequentprocessingmay generateother numberssuchasaveragesor maxima,and the questionarisesin which sensethesemeasurementsare“meaningful”, andwhat, if anything, thesenumbersactuallymeasure.Wronginterpretationsof numbersmay leadto scalingartifacts– constructswhich applyoperationsto a model which are not justified. A classicalinstanceis a study byMiller [20]1, who, in an investigationof traffic deaths,assignednumbersto fourgroupsof people(0 - whitemale,1 - blackmale,2 - white female,3 - blackfemale),andproceededto takeaveragesandvariances.It turnedoutthatovertheinvestigatedpopulation,the averagepersonto causea fatalaccidentwasa blackmale(x 1).While thisexampleis certainlyextreme,thedangerto fall into thetrapsoadequatelydescribedaboveby Cohenisalwayspresentwhenrelationsamongnumbersareusedfor representingrelationsamongobjects.
Themaintopicof thispaperis theclassicalproblemhow to build meaningfulindicesfrom dataor from otherindices.Bothprocessesneedascalingtheory, whichenablestheuserto understandwhattheindicesmeanin termsof thedataandtheir context.It easyto declarea concept“useful” if it fits a few small examples,but usuallyquite hardto substantiatesuchclaim theoreticallyor experimentally. Even thoughsomesystemswork “in spiteof theerroneousassumptionsthatunderlythem” [1],without sucha theorya soundbasisfor interpretationof numbersasmeasuresisnot given,and,moreoften thannot, suchan interpretationwill at somestageleadto wrongresults.Dataanalysismethodswhich arenot primarily quantitative (and,
1 Reportedby Vogel[34, p.64]
consequently,donothavea“built in” scalingtheory)needto payparticularattentionto this fact.
In the presentpaper, we will be concernedwith a basicstatisticof roughsetdataanalysis,the approximationquality, andits interpretationasan ordinal or intervalscale.A main themewill be the distinction betweenadmissibilityandusefulnessof a measure.In short,we call a measureadmissibleif it satisfiesa givenstandardfor the descriptionof a situation,anduseful, if it canbe usedto give advicefordecisionmaking.We will seethatthesesituationsneeddifferenttoolsto copewiththespecificcircumstances.
As an example,we will exhibit an instancewherethe applicationof onemethod(Choquet-likemeasures)to another(roughsetapproximationquality) leadsto mea-surementswithout measure– numberswhich cannotbe meaningfullyinterpreted.We will focuson the influenceof one (or more) feature(s)on a decisionprocessasinvestigatedin multi-criteriadecisionmaking(MCDM), andtheinfluenceof one(or more)feature(s)ontheapproximationqualityof roughsetdataanalysis(RSDA)with respectto adecisionattribute.Wealsosuggestthatcapacitieswith amaximumoperatorinsteadof ∑, similar to the Sugenointegral, canbe useful in the contextof RSDA, andthat thesemeasurescanbe appliedto (rough)entropy aswell in ameaningfulway. It is not anaim of thepaperto criticise“ad hoc” methodsfor dataanalysispersewhicharecertainlyusefulin specificcases.Wealsodonotclaimthatthemethodswesuggestareuniversallybetterthanothers.Indeed,resultsof WolpertandMacready[35] show thatnoclassificationalgorithmcanalwaysoutperforman-other one.What we do want to show is that datamodelling hasto considerthescalingassumptionsof the appliedmeasuresand indices,and that thingsmay bemorecomplicatedthan they seemat first glance.It is necessaryto guaranteethemeaningfulnessof measurementsin the first place;the questionof whetheroneiscomputationallybetterthananother– or evenmoresuccessful– canbeposedafterthe first step.As expressedin the context of weightedvoting in the seminalpaperby Banzhaf[1],
“. . . its intent is only to explain the effectswhich necessarilyfollow oncethemathematicalmodelandtherulesof its operationareestablished. . . ”
The paperis organisedasfollows: We will first develop the necessarymachineryfrom roughsets,followed by a discussionof several frequentlyusedindicesandrelationsin RSDA, andwe show how the modelof a proportionalerror reductionhelps to unify the different approaches.Afterwards,we recall variouscapacitiesandaggregationmeasuresandshow how they differ. Section4.3 will investigatetheconnectionbetweenthetwo contexts,basedon a discussionof someexamples.In Section4.4 we will presentsomethoughtson a reconciliation.Finally, we willdiscusssomeexamples,in whichweshow how thedifferenttechniquesbehave,andwill closethepaperwith anoutlook.

2 Rough set theory and approximation quality
Roughsetdataanalysis(RSDA) wasintroducedby Z. Pawlak [22], andhassincegainedimportanceasan instrumentfor non-invasive dataanalysis.We invite thereaderto consult[24] for a short introductionto traditionalRSDA, and [9] for amoredetailedpresentation.
Knowledgerepresentationin roughsetdataanalysisis donevia informationsys-tems. Thesearestructuresof theform
U Ω Vx : x Ω (1)
where
U is afinite setof objects. Ω is afinite setof mappingsx : U Vx; eachx Ω is calledanattribute. Vx is thesetof attributevaluesof attributex.
EachsetP of attributesdefinesanequivalencerelationθP (andanassociatedparti-tion) onU by
xθPy a x a y for all a P (2)
Notethatθ /0 U U .
Givenaninformationsystem, a basicconstructionof RSDA is theapproximation
of a givenpartition of U by the partitiongeneratedby a setP of attributes.Forexample,onemaywantto reducethenumberof attributesnecessaryto identify theclassof anobjectx U by its featurevector– i.e. looking for a key in a relationaldatabase–,orgeneraterulesfrom adecisionsystem(whichisaninformationsystemenhancedby a decisionattribute).
By its very nature,RSDA operateson the lowestlevel of datamodelling,namely,on what is commonlycalled “raw data”, capturedin an information table as de-fined above. Thus,in the languageof measurementtheory[32], RSDA residesona nominalscalewheremeaningfuloperationsarethosethatpreserveequality. Thisparsimony2 of modelassumptionscanbe seenboth asa strengthanda weakness:Having only few modelassumptionsallows the researcherto investigatea greatervarietyof situationsthan,for example,datasampleswith apre-assumeddistributionsuchasnormalor iid, which arerequiredby many statisticalmethods.On theotherhand,theresultsobtainedby RSDA maybetooweakto allow meaningfulinferenceaboutthe situationat hand.A casein point is the basicallylogical (or algebraic)natureof RSDA: Its outcomeis a setof “if - then” rules,which arelogically true,
2 It is sometimesclaimed,thatRSDA hasno (pre-)requisites;a moment’s reflectionshowsthatthiscannotbetrue:To beableto distinguishobjectsby their featurevector, onehastoassumethatthedatacontainedin thevectorareaccurate.
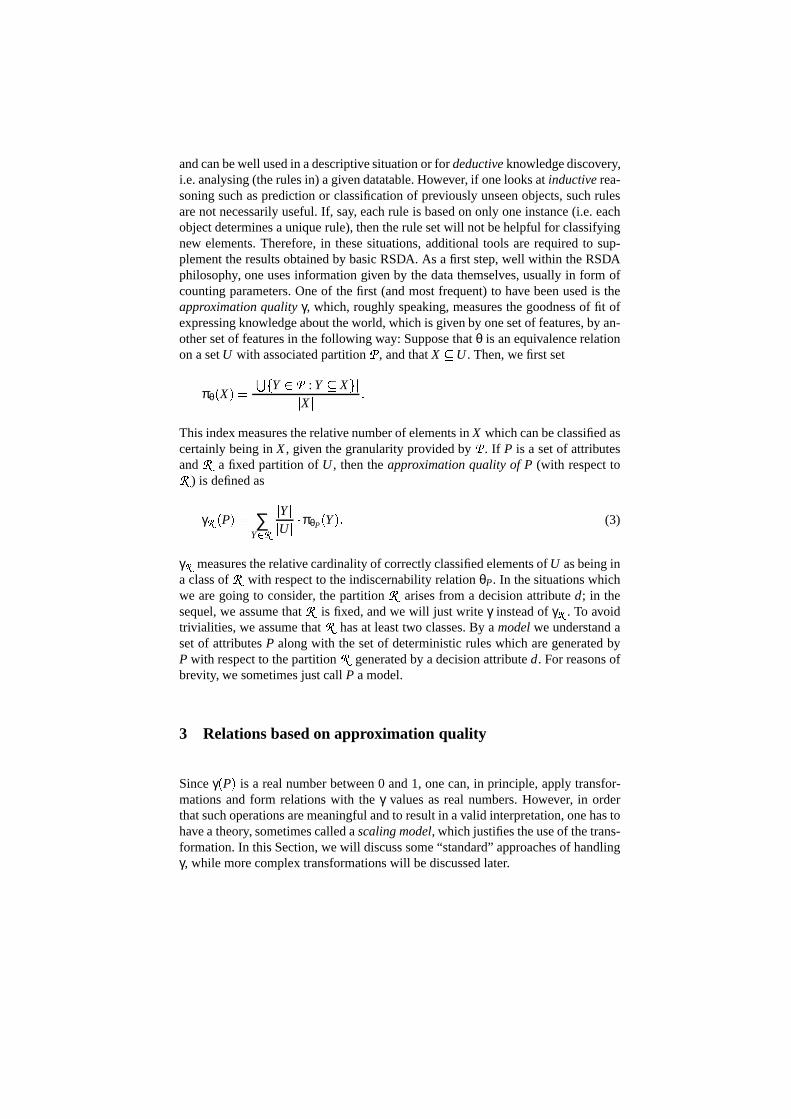
andcanbewell usedin adescriptivesituationor for deductiveknowledgediscovery,i.e.analysing(therulesin) agivendatatable.However, if onelooksat inductiverea-soningsuchaspredictionor classificationof previously unseenobjects,suchrulesarenot necessarilyuseful.If, say, eachrule is basedon only oneinstance(i.e. eachobjectdeterminesauniquerule), thentherulesetwill not behelpful for classifyingnew elements.Therefore,in thesesituations,additionaltools arerequiredto sup-plementtheresultsobtainedby basicRSDA. As a first step,well within theRSDAphilosophy, oneusesinformationgivenby thedatathemselves,usuallyin form ofcountingparameters.Oneof thefirst (andmostfrequent)to have beenusedis theapproximationquality γ, which, roughlyspeaking,measuresthegoodnessof fit ofexpressingknowledgeabouttheworld, which is givenby onesetof features,by an-othersetof featuresin thefollowing way:Supposethatθ is anequivalencerelationon asetU with associatedpartition , andthatX U . Then,wefirst set
πθ X Y ! : Y X
X
This index measurestherelativenumberof elementsin X whichcanbeclassifiedascertainlybeingin X, giventhegranularityprovidedby . If P is a setof attributesand a fixedpartition of U , thenthe approximationquality of P (with respectto ) is definedas
γ "# P ∑Y $ "
Y
U&% πθP Y ' (3)
γ " measurestherelativecardinalityof correctlyclassifiedelementsof U asbeingina classof with respectto theindiscernabilityrelationθP. In thesituationswhichwe aregoing to consider, the partition arisesfrom a decisionattributed; in thesequel,we assumethat is fixed,andwe will just write γ insteadof γ " . To avoidtrivialities,we assumethat hasat leasttwo classes.By a modelwe understandasetof attributesP alongwith thesetof deterministicruleswhich aregeneratedbyP with respectto thepartition generatedby adecisionattributed. For reasonsofbrevity, we sometimesjustcall P amodel.
3 Relations based on approximation quality
Sinceγ P is a realnumberbetween0 and1, onecan,in principle,apply transfor-mationsand form relationswith the γ valuesasreal numbers.However, in orderthatsuchoperationsaremeaningfulandto resultin avalid interpretation,onehastohaveatheory, sometimescalledascalingmodel, whichjustifiestheuseof thetrans-formation.In thisSection,wewill discusssome“standard”approachesof handlingγ, while morecomplex transformationswill bediscussedlater.
3.1 Comparing approximation qualities
One approachis the comparisonof γ with a fixed number0 ( c ) 1. Choosingtheconstantc is up to theuseror investigator, andis drivenby practicalnecessities;having scannedtheliteratureonappliedRSDA, wehavefoundthatc is neverchosenlessthan0 5 andoften closeto 1 0. The usualinterpretationsaysthat any setofattributesP with γ P*( cshowsa“bad” approximationof , andany P with γ P*+c is “admissible”for theapproximationof ; this approachis usedto define“iso-gamma”reductsandcore[24, p. 51].
This is a straightforwardandseeminglyunequivocal interpretationof γ, andthus,thistechniqueis frequentlyused.However, thequestionariseswhetherit is basedona meaningfulinterpretationof theapproximationquality. Theansweris: It dependson the context, andwe have to distinguishbetweenadmissibilityandusefulness:Supposethatc ) γ P .1. If P is claimedto be admissiblefor the approximationof , we do not run
into problems,becausetheapproximationquality inducedby P is not lessthanthe requiredrelative numberc of elementswhich arecorrectlyclassifiedwithrespectto ; therefore,theapproximationof is admissiblewith respectto c.This interpretationis basedpurelyon thealgebraicstructureof theequivalencerelations,andassumesthat the datais correct“as given”. In otherwords,theapproximationquality countsthe relative numberof elementswhich can becapturedby the deterministicrulesassociatedwith P. In this sense,γ countswhatis “logically true”.
2. If P is claimedto be useful(i.e. it canor shouldbe used)for the approxima-tion of – suchasin decisionsupportandmedicaldiagnosis–, the situationis morecomplicated:Onehasto take into accountthatattainingthestandardcmayhave comeaboutby randominfluences(“noise”, “error”), andthat,there-fore, theapplicationof P for theapproximationof is not necessarilyuseful[7]. A simpleexampleof divergenceof admissibilityandusefulnessis aninfor-mationsystemconsistingof a runningnumberanda decisionattribute.Here,we have γ 1, andtherunningnumberis helpful to identify any casewithouterror. However, knowing therunningnumberwithout knowing thevalueof thedecisionattributedoesnot help– for thispurposeγ 1 is not useful.
A furtherexample,shown in Table1 onthefacingpage,shallillustratehow randomprocessesmay influencetheresultsin caseof very low approximationqualities.If is thepartitionassociatedwith thedecisionattributed, then
γ p γ q 0 (1)
Whereasp is essentialto predictd with only a classswitch of 4 and8 achievingperfectapproximationquality, q is only requiredto “separate”4 and8 from theirrespective p-classes.In otherwords,a mis-classificationof 4 and8 maywell havetakenplace,owing to randominfluencesin representingthedata.

Table 1. A simpledecisionsystem[7]
U p q d U p q d1 0 0 0 5 1 0 12 0 2 0 6 1 2 13 0 2 0 7 1 2 14 1 1 0 8 0 1 1
Theinterpretationas“usefulness”needsanadditionaltool to copewith randomness.Thereare – at least– two different ways to evaluatethe usefulnessof P: Crossvalidationmethodsor statisticaltestingof “randomadmissibility”. We prefer thelatter approach,becausecrossvalidationmethodsrequireadditional(non–rough!)model assumptionsfor the classificationof unseencasesin the learningsample,while testingusefulness– as“randomadmissibility” – doesnot.
Theγ statisticis alsousedto defineanordinalrelationamongsubsetsof theattributesetby setting
P , γ Q - γ P.) γ Q'The interpretation“Q is at leastasadmissibleasP” causesno difficulty, becausechoosinga criterion c with γ P/) c ) γ Q resultsin suchan interpretation.Ontheotherhand,interpreting , γ by assigningtheterm“better than” (in thesenseof“more useful”) to the definedrelation is not meaningful:Sincethis interpretationonly makessensein a numericalsystemin which a ) relationis established3, thenotation“betterthan”cannotbefilled by anempiricalinterpretation.
3.2 Comparing differences of approximation qualities
Fromits earlydays,identificationof “importantfeatures”hasbeenanintegral partof RSDA:
“The ideaof attribute reductioncanbe generalisedby an introductionofthe conceptof significance4 of attributes, which enablesan evaluationofattributes. . .by associatingwith an attributea real numberfrom the 0 0 11closedinterval; thisnumberexpressestheimportanceof theattributein theinformationtable.” [16]
3 Note,thatthenumbersontheshirtsof soccerplayersare 2 related,but thisdoesnot inducea “betterthan” relationamongsoccerplayers.
4 The terminology“significance” is somewhat unfortunate,becausethe namehasa fixed(andquitediverging)meaningin Statistics.Wethink thename“importanceof anattribute”wouldbea betterchoice.

The first approachto analysethe “significance” of an attribute with respectto agiven attribute setwas the inspectionof the “drop” of the approximationqualitywhenleaving out anattributea from a setP definedby
d1 P a γ P43 γ P 56 a (2)
seee.g. [23], p. 59. The analysisof the drop startsafter P hasbeenchosenasanadmissibleattributeset,for example,a reduct.Therefore,thedifferencecannot,ingeneral,be interpretedin termsof admissibility, becauseγ P 57 a may have asmallervaluethanthechosenstandardc, which setsthestandardfor admissibility.
Onecanargue that d1 is meaningful,becauseγ forms an interval scale.In termsof admissibility, this is anadditionalconditionwhich hasasoneconsequencethata differencefrom γ P8 0 1 to γ P 5/ a 9: 0 0 is assumedto be identical (intermsof setapproximation)to the differenceamongγ P. 1 0 andγ P 5: a 0 9. One hasto be aware,however, that – contraryto the approximationqualitycomparison,which relies only on a monotonerelationshipamongthe numericalmeasures– the interpretationof differencesneedsmuchstrongerassumptionsthana comparisonof numericalvalues.The problemthat “dif ferencesignorethe baserate” occursin otherdisciplinesaswell; in descriptive statistics,for instance,theodd-ratioquotientof two probabilitiesis often usedto describethe “dif ference”amongprobabilitiesin a meaningfulway. Building the odd-ratioof probabilitiesrequiresanextra scalingtheory, which servesasa foundationfor theinterpretationof theodd-ratio.Obviously, somethingcomparablewould beneededin thecontextof RSDA aswell. As farasweareaware,therehasbeennoattemptto providesucha theory.
Simpledifferencesshouldnotbeinterpretedin termsof usefulness,becausethestepfrom 0 0 to 0 1 caneasilyexplainedby randomprocesses,whereasit is muchharder– givencomparabledistributionsof attributevalues– to resultin a stepfrom 0 9 to1 0.
The problemof dealingwith differenceshasbeenaddressedby a newer approachfor measuringthe“significance”of anattribute[16, 31]:
d2 P a γ P43 γ P 56 a γ P 1 3 γ P 56 a 9
γ PIt is notatall clearhow this functionshouldbeinterpreted,andit hassomepeculiarproperties:Given identicallineardifferenceswith differentbaserates,onecanob-serve that thed2 differenceswill besmaller, with anincreasingbaserate.We have,for example,
γ P γ P 56 a d1 P a d2 P a1.0 0.9 0.1 0.10.6 0.5 0.1 0.1670.2 0.1 0.1 0.5
This propertyof d2 P a is not satisfactory, because– asthepreceedingdiscussionshows – a constantgain shouldbe result in larger values,if the baserateis at theupperendof thescale.
3.3 Averaging of approximation qualities
Anotherwayof treatinginterval scaleinformationis formingaverages.If thisoper-ationis appliedto setapproximationqualities,weagainrun into problems.Supposethat ; is a collectionof attributesets.Theaverage
E 0 ;<1= 1 ; ∑P $?> γ P
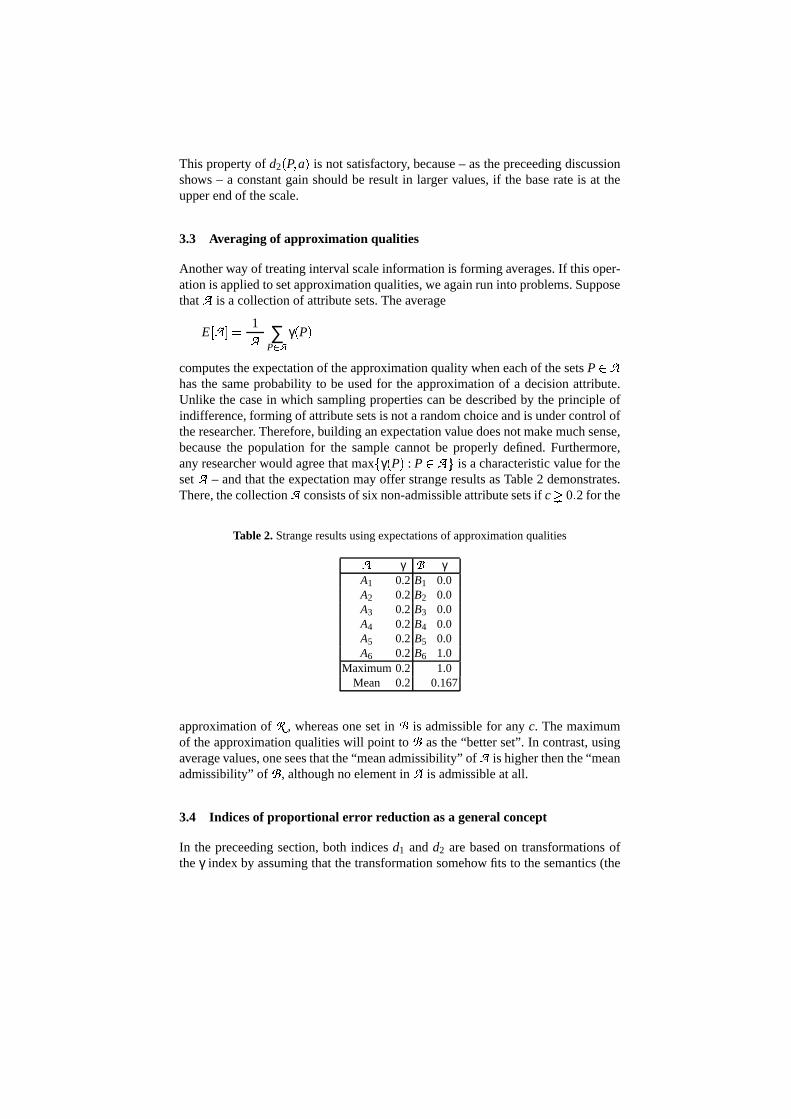
computestheexpectationof theapproximationqualitywheneachof thesetsP @;hasthe sameprobability to be usedfor the approximationof a decisionattribute.Unlike thecasein which samplingpropertiescanbedescribedby the principle ofindifference,formingof attributesetsis notarandomchoiceandis undercontroloftheresearcher. Therefore,building anexpectationvaluedoesnotmakemuchsense,becausethe populationfor the samplecannotbe properly defined.Furthermore,any researcherwould agreethatmax γ P : P -;A is a characteristicvaluefor theset ; – andthat theexpectationmayoffer strangeresultsasTable2 demonstrates.There,thecollection; consistsof six non-admissibleattributesetsif c B 0 2 for the
Table 2. Strangeresultsusingexpectationsof approximationqualities
Cγ D γ
A1 0.2 B1 0.0A2 0.2 B2 0.0A3 0.2 B3 0.0A4 0.2 B4 0.0A5 0.2 B5 0.0A6 0.2 B6 1.0
Maximum 0.2 1.0Mean 0.2 0.167
approximationof , whereasonesetin E is admissiblefor any c. Themaximumof theapproximationqualitieswill point to E asthe“betterset”. In contrast,usingaveragevalues,oneseesthatthe“meanadmissibility”of ; is higherthenthe“meanadmissibility” of E , althoughno elementin ; is admissibleatall.
3.4 Indices of proportional error reduction as a general concept
In the preceedingsection,both indicesd1 andd2 arebasedon transformationsoftheγ index by assumingthat thetransformationsomehow fits to thesemantics(the

“significance”or “importance”).We have shown thatd1 andd2 arenot necessarilymeaningful,eitherfor admissibilityor usefulness,dueto a lack of a soundtheorywhich guidestheindex building process.
In [10] we have introducedthe PRE(ProportionalReductionof Errors) approachof Hildebrandet al. [15] into RSDA, which – in the generalcase– describestheerrorreductionwhena modelis applied,basedon theerrorsof a givenbenchmarkmodel.In the context of RSDA, we saythat an “error” is an objectwhich cannotbeexplainedadeterministicrule. In line with this interpretation,theapproximationqualitybecomes
γ P 1 3 1 3 γ P1 3 γ /0
which meansthatγ P measurestheproportionalerror reductionof a modelusingthe attribute setP in comparisonto the “worst case”benchmarkmodel in whicheveryobjectis countedasanerror.
AdaptingthePREapproachto the“importance”problem,wefind that
d3 P aF
0 if γ P 5G a 9* 1 1 3 1 H γ I PJ
1 H γ I PKML a NOJ otherwise,(3)
is a suitableindex for thecomparisonof a modelusingtheattributesetP againstamodelusingtheattributesetP 5 a . Theindex d3 P a measurestheerrorreductionwhenusingthesetof attributesP comparedwith thebenchmarkmodelwhich usesthesetof attributesP 5. a . Thisvaluecanbecomparedto athresholdvaluecg, andtherefored3 P a canbeinterpretedasameasurefor theadmissibilityof thegain.
Comparingthemeasuresd1, d2 andd3, we observe that thebehaviour of d3 is asitshouldbe:
γ P γ P 5G a 9 d1 P a d2 P a d3 P a1.0 0.9 0.1 0.1 1.00.6 0.5 0.1 0.167 0.20.2 0.1 0.1 0.5 0.111
Theevaluationof differencesgivena smallbaserateis lower thanthesamediffer-enceswhengivenhighbaserate.
Becauseadmissibilitygaindoesnot take into accountrandominfluences,an indexfor a usefulnessgain hasto bedefinedaswell. To this end,theresultsof [7] canbeusedto derivea descriptivemeasurefor ausefulnessgain
Descriptive indicessuchasadmissibilityor usefulnessestimatethe actualsizeofan effect, given a fixed setof model assumptions;therefore,suchindicesareof-ten calledeffect sizemeasures. In statisticalapplications,oneoften considersonekind of effect sizemeasure.However, this canonly bedoneunderratherrestrictiveassumptions.For instance,if it is assumedthat two variablesrepresenta bivariate

normaldistribution, the admissibilityandusefulnessof the correlationcoefficientareidentical.If thisassumptionis dropped,this identitydoesnot hold in general.
Becauseeffect sizesin termsof PRE-measuresare usedin many contexts, thereexistsa rule of thumbhow to assesseffect sizesfor expectation– basedbenchmarkmodels[2]:
Effectsize(ES) InterpretationES ( 0 1 no effect0 10 ) ES ( 0 3 smalleffect0 30 ) ES ( 0 5 mediumeffectES + 0 5 largeeffect
Effect sizemeasuresmustrely on empiricaldatain orderto estimatethe rangeofeffectsin real life data– this is just theway, Cohen[2] arrivedat the interpretationof effect sizes.But until thereexists a databasefor empirical studieswhich havebeendoneon the basisof RSDA, the given rule of thumbcanbe usedas a firstapproximation.
The PRE-measuresdiscussedin this sectionshow a peculiarbehaviour in caseofγ P 1. In this situationany PRE-measurewill only resultin 0 (if thebenchmarkmodelresultsin 1 aswell) or 1. In termsof admissibility, this binarynatureof theindex cannotbe resolved, but if a statisticalbenchmarkmodel is used,it is easyto replacethe descriptive PRE-measureby a measurefrom inferencestatisticsbycomputingthe positionof the observederror in the distribution of expectederrorsgiventhebenchmarkmodel.Thispositionis called(statistical)significanceandthevalueshouldbesmall(conventionallysmallerthan5%) for agoodmodel.It shouldbe noted,that usability and significanceare two differentconcepts– which maydissociate–, althoughbothareusingidenticalrandomprocesses.Whereassignifi-canceis changedwhenincreasingthenumberof observations,theusabilityremainsunchanged.
Table3 on thenext pagecollectsall approaches– PRE-measuresandsignificance– discussedso far, enhancedby setgains, which area simplegeneralisationof thepreceedingindicesby choosingS P or S P a respectively.
4 Capacities, power indices and values of interaction
The influenceand power of an attribute, as well as the interactionof several at-tributes,have beenextensively studiedin GameTheoryandMulticriteria DecisionAnalysis(MCDA). For anoverview of earlierwork, we invite thereaderto consultthe collectionof essayseditedby Roth [26], andfor morerecentadvancesthe ar-ticle by Grabisch[11]. Sincetheapproximationquality hasthesamemathematicalpropertiesasa capacityor fuzzy measure(explainedbelow), it hasbeenclaimedthat

Table 3. PREindicesasdescriptive measuresandsignificancevaluesin RSDA
Q σ := Setof attributesets,whichareconstructedby randomassignmentof elementsto theattributesP.R σ := Setof attributesets,whichareconstructedby randomassignmentof elementsto theattributesS.C σ := Setof attributesets,whichareconstructedby randomassignmentof elementsto theattributea.Errorof themodel Errorof thebenchmarkmodel Interpretation Source
1 S γ T PU 1 S γ T /0 UWV 1 admissibility [10]1 S γ T PU 1 S#XZY γ T RU?[R \ Q σ ] usefulness [10]1 S γ T PU 1 S γ T P ^`_ aabUWV 1 S γ TT P ^`_ aa'Uc /0 U admissiblegain this text1 S γ T PU 1 SdX Y γ TT P ^4_ aa'Uc RUe[R \ C σ ] usablegain [7]1 S γ T PU 1 S γ T P ^ SUfV 1 S γ TT P ^ SUc /0 U admissiblesetgain this text1 S γ T PU 1 S#X Y γ TT P ^ SUc RUe[R \ R σ ] usablesetgain this text
Errorof themodelPositionof theerrorgiventhebenchmarkmodel Interpretation Source
1 S γ T PU p g 1 S γ T RU`2 1 S γ T PUe[R \ Q σ h significance [10]
1 S γ T PU p g 1 S γ iT P ^4_ aa'Uc Rjk2 1 S γ T PUe[R \ C σ h significantgain [10]
1 S γ T PU p g 1 S γ i T P ^ SUc Rj 2 1 S γ T PUe[R \ R σ h significantsetgain this text
“Due to this equivalence,it is possibleto usedifferentindicesdefinedonfuzzymeasuresto assesstherelativevalueof informationsuppliedby eachattributeandto analyzeinteractionbetweenattributes.” [13].
After introducingthenecessarymachinery,weshallshow in thisSectionthatusingγasanintervalscaledcapacityleadsto scalingartifactswhichdonottakeinto accountthebasicmodelassumptionsof theindices,andthus,they providea “measurementwithoutmeasure”.Alternatives,whicharemorepromisingevaluationtools,arepre-sentedaswell.
4.1 Quantitative indices of power and interaction
In decisiontheory, theaggregationof criteriais usuallydoneby weightedarithmeticmeans,or, asthey aresometimescalled,discreteintegrals,andwewill definebelowthe mostoften usedindices.Throughout,we supposethatU l 1 Mmn n is a finiteset,which, in the presentcontext, canbe interpretedasa setof criteria or a setofplayers.
A functionµ : 2U o0 0 11 is calleda capacityor fuzzymeasure if for all X U
µ /0 0 µ X p) 1 (1)
A B X impliesµ Ap) µ B' (2)
Wewill usuallyidentify singletonswith theelementthey contain,e.g.wewill writeµ p insteadof µ O p 9 .
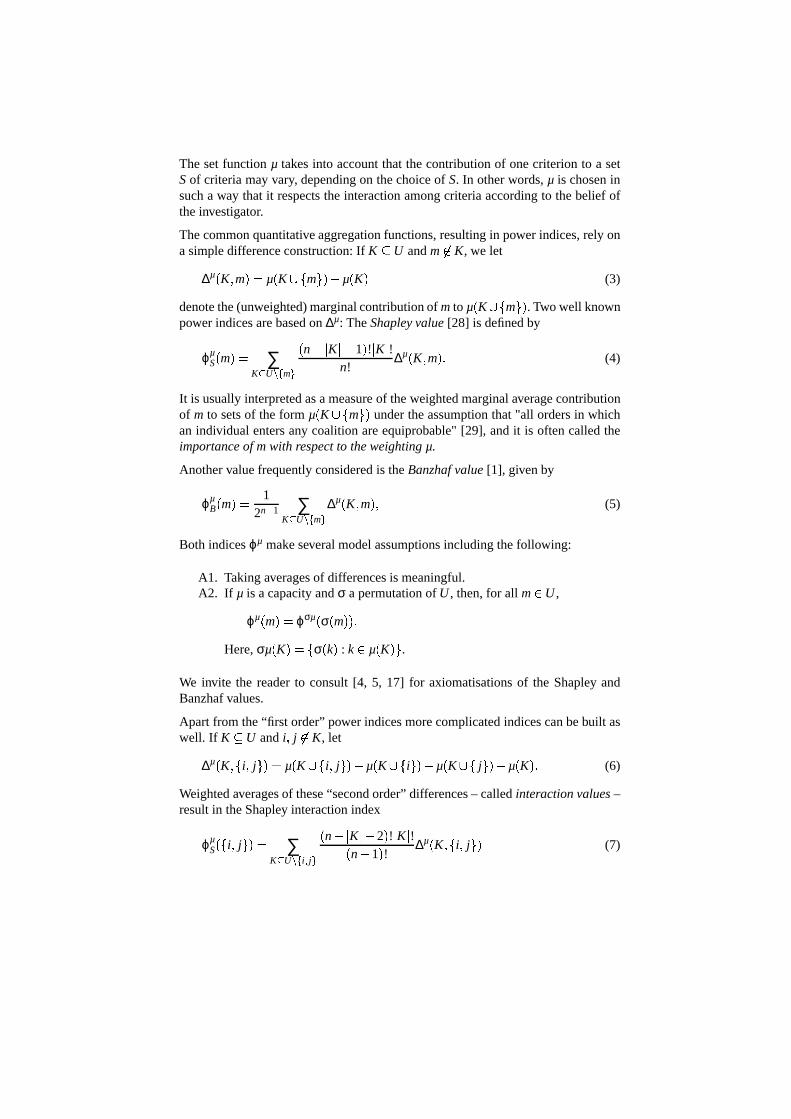
Thesetfunctionµ takesinto accountthat thecontribution of onecriterion to a setSof criteriamayvary, dependingon thechoiceof S. In otherwords,µ is choseninsucha way that it respectsthe interactionamongcriteriaaccordingto thebelief oftheinvestigator.
Thecommonquantitativeaggregationfunctions,resultingin power indices,rely ona simpledifferenceconstruction:If K U andm q K, we let
∆µ K m µ K r m 943 µ K (3)
denotethe(unweighted)marginalcontributionof m to µ K rs m . Two well knownpower indicesarebasedon ∆µ: TheShapley value[28] is definedby
ϕµS m ∑
K t U KuL mN n 3 K 3 1 ! K !
n!∆µ K m (4)
It is usuallyinterpretedasameasureof theweightedmarginalaveragecontributionof m to setsof theform µ K r m 9 undertheassumptionthat"all ordersin whichan individual entersany coalitionareequiprobable"[29], andit is oftencalledtheimportanceof m with respectto theweightingµ.
Anothervaluefrequentlyconsideredis theBanzhafvalue[1], givenby
ϕµB m 1
2n H 1 ∑K t U KuL mN ∆µ K m (5)
Both indicesϕµ makeseveralmodelassumptionsincludingthefollowing:
A1. Takingaveragesof differencesis meaningful.A2. If µ is acapacityandσ a permutationof U , then,for all m U ,
ϕµ m ϕσµ σ muHere,σµ K vw σ k : k µ K e .
We invite the readerto consult[4, 5, 17] for axiomatisationsof the Shapley andBanzhafvalues.
Apart from the“first order”power indicesmorecomplicatedindicescanbebuilt aswell. If K U andi j q K, let
∆µ K u i j µ K r i j 43 µ K rA i 43 µ K r j 9=x µ K (6)
Weightedaveragesof these“secondorder”differences– calledinteractionvalues–resultin theShapley interactionindex
ϕµS O i j 9 ∑
K t U KuL i y j N n 3 K 3 2 ! K ! n 3 1 ! ∆µ K u i j 9 (7)
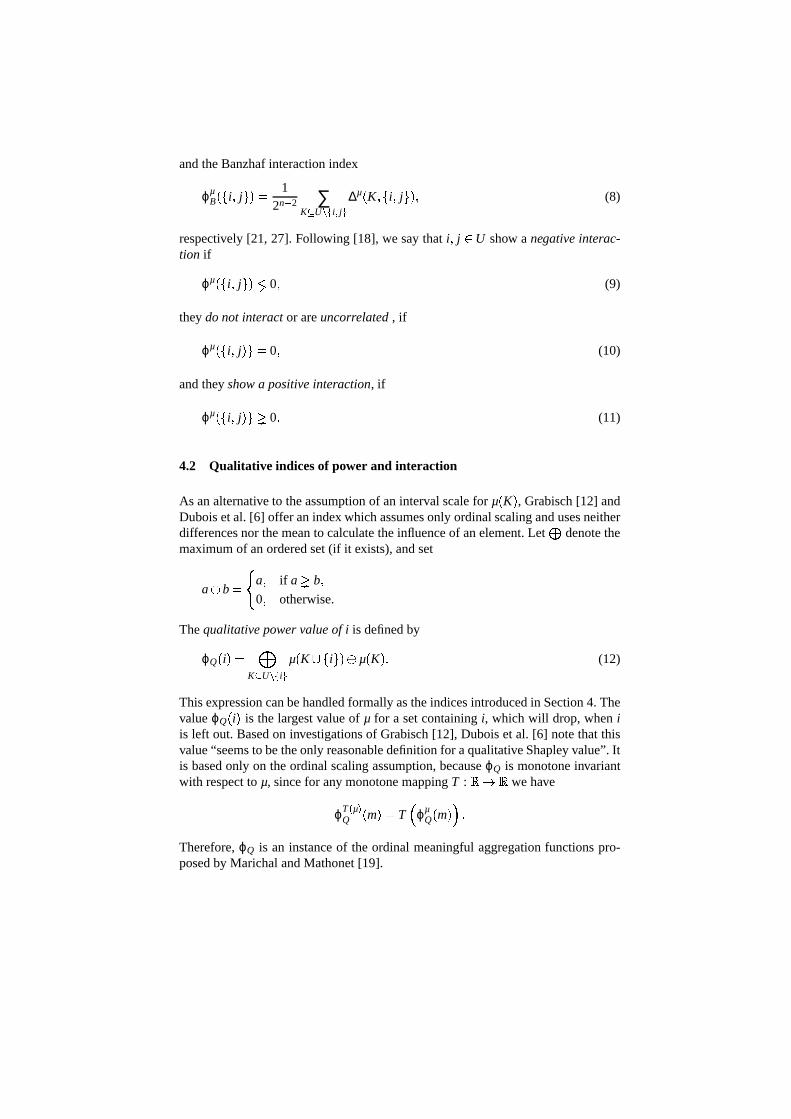
andtheBanzhafinteractionindex
ϕµB i j 9 1
2n H 2 ∑K t U KuL i y j N ∆µ K u i j (8)
respectively [21, 27]. Following [18], we saythat i j U show a negativeinterac-tion if
ϕµ O i j G( 0 (9)
they donot interact or areuncorrelated, if
ϕµ O i j e 7 0 (10)
andthey showa positiveinteraction, if
ϕµ O i j e zB 0 (11)
4.2 Qualitative indices of power and interaction
As analternative to theassumptionof aninterval scalefor µ K , Grabisch[12] andDuboisetal. [6] offer anindex whichassumesonly ordinalscalingandusesneitherdifferencesnor themeanto calculatetheinfluenceof anelement.Let denotethemaximumof anorderedset(if it exists),andset
a | b F
a if a B b 0 otherwise.
Thequalitativepowervalueof i is definedby
ϕQ i K t U KuL i N µ K r i 9=| µ K (12)
Thisexpressioncanbehandledformally astheindicesintroducedin Section4. ThevalueϕQ i is the largestvalueof µ for a setcontainingi, which will drop,wheniis left out.Basedon investigationsof Grabisch[12], Duboiset al. [6] notethat thisvalue“seemsto betheonly reasonabledefinitionfor aqualitativeShapley value”.Itis basedonly on theordinalscalingassumption,becauseϕQ is monotoneinvariantwith respectto µ, sincefor any monotonemappingT : ~~ we have
ϕT I µJQ m T ϕµ
Q muzTherefore,ϕQ is an instanceof the ordinal meaningfulaggregationfunctionspro-posedby MarichalandMathonet[19].

Although ϕQ sharessomestructuralpropertieswith ϕB andϕS, the interpretationof ϕQ is quitedifferent:WhereasϕQ computesa maximum,thequantitative coun-terpartscomputeanaverage(basedondifferentweights).Anotherdifferenceis duethe monotoneinvarianceof ϕQ: Becauseany monotonetransformationof µ is ad-missible,thereis no needto restrictµ to theinterval 0 0 11 .It is interestingto note,thattheapplicationof ϕQ is not restrictedto capacities,butis meaningfulwith any setfunction:Evenif wedroptheassumptionof monotony ofµ with respectto , thevalueof ϕQ i is of interest,becauseits valueis thelargestonefor which i showsa non-redundantcontribution to µ.
Let usnotethefollowing “relativecommutativity" of theoperation| :
Lemma 1. a | b| c a | c| b for all a b c.
Proof. Theconclusionfollows from thefollowing table:
a | b a | c a | b| c a | c| ba a a aa 0 0 00 a 0 00 0 0 0
It is now straightforwardto definea qualitativevalueof interactionaswell, usingthe and | operators5:
ϕQ O i j K t U KuL i y j N µ K r i j 9=| µ K r i M| µ K r j ' (13)
By Lemma1, ϕQ O i j 9 is well defined,andit canbe shown that this expressionis formally the sameas the quantitative interactionindices.The index ϕQ i j 9addressesthe largestvalueof µ for which i j truly interactin the sensethat bothelementscontribute a part to µ, that cannotbe expressedby the otherelement.IfϕQ i j . 0, no suchinteractionamongi j is observable.BecauseϕQ usesmono-toneinvariantoperators,it is monotoneinvariantaswell, andthename“qualitativevalueof interaction”is justified.
4.3 Applications of capacities in Rough Set Data Analysis
Choquet-typeaggregationmeasureshavebeenconsideredin thecontext of RSDA:
“All theseindices can be useful to study the informational dependenceamongtheconsideredattributesandto choosethebestreducts.. . . theShap-ley values. . .can be interpretedasmeasuresof importanceof the corre-spondingattributesin theroughapproximation.” [13, p. 102f]
5 Thisconstructionmaybeknown

We will investigatebelow, whethertheaimsaddressedin thequotecanbefulfilledby quantitativepower indicesin question.
Westartwith aminorobservation:If quantitativepower indicesareused,onehastodifferentiatebetweentheinterpretationof theShapley andtheBanzhafindex, sinceit is possiblethatϕS p.( ϕS q andϕB p6B ϕB q [33, for anexampleseeTable4]. Therefore,it is not clearwhich of theseindices,if any, tells ussomethingabout
Table 4. A non-monotonerelationshipof Banzhaf-andShapley-values
K µ wS T K U ∆ T K pU ∆ T K qU wS T K U ∆ T K pU wS T K U ∆ T K qU/0 0 0.25 0.5 0 0.125 0_ r a 0 0.0833 0.5 0.8 0.0417 0.0667_ sa 0 0.0833 0.5 0.8 0.0417 0.0667_ pa 0.5 0.0833 0 0_ qa 0 0.0833 0.5 0.0417_ r sa 0 0.0833 1 1 0.0833 0.0833_ r pa 0.5 0.0833 0.5 0.0417_ r qa 0.8 0.0833 0.2 0.0167_ s pa 0.5 0.0833 0.5 0.0417_ s qa 0.8 0.0833 0.2 0.0167_ r s pa 1 0.0833 0 0_ r s qa 1 0.0833 0 0
Sum: 3.4 3.6 0.3668 0.3
the“informationaldependenceof theconsideredattributes”[14].
A moresevereproblemis the fact that comparingBanzhaf– or Shapley – valuesleadsdirectly to acomparisonof averagesbasedonacollectionof sets, whichmayleadto “strange”results,astheexamplein Section3.3demonstrates.This canalsobeseenquiteeasilyasfollows: If we comparesetfunctionsof thetype
ϕµ i v ∑K t U KuL i N w
K % µ K r i 43 µ K M
a straightforwardcalculationshows that
ϕµ i W3 ϕµ j p ∑K t U KuL i y j N w
K x w K x 1u % µ K r i 43 µ K rA j 9u
Therefore,thedifferenceof Banzhafvaluescanberewrittenas
ϕµB i 43 ϕµ
B j v 12n H 2 ∑
K t U KuL i y j N µ K r i 9 3 12n H 2 ∑
K t U KML i y j N µ K rA j This leadsto a very simple interpretationof Banzhafvaluedifferences:i B j if fϕµ
B i `3 ϕµB j 6( 0, which meansthat the averageof µ basedon the setsK r i is
lessthantheaverageof µ basedon thesetsK r j .

For differencesof Shapley valueswe find
ϕµS i 43 ϕµ
S j v ∑K t U KuL i y j N
n 3 K 3 2 ! K ! n 3 1 ! µ K r i 43 µ K rA j 9 whichaddressesthecomparisonof Shapley-weightedaveragesof µ-valuesbasedondifferentsets.
ComparingBanzhafor Shapley valuesleadsto a comparisonof meanvaluesbasedon disjoint sets– which is exactly the situationwe have discussedin Section3.3.Onemight arguethat this cannotbeobserved in RSDA, but a morerefinedexam-plecanbeconstructed. Usingthedatain Table5 we observeγ O p 9 γ O a p 9*
Table 5. Informationsystemwhich approximationqualitiesshouldnotbeaveraged
conditionattributesdecisionattr. conditionattributesdecisionattr.a b c p q d a b c p q d1 1 0 0 1 0 1 1 1 1 1 42 1 0 0 2 0 2 1 1 1 2 41 1 0 1 2 1 1 1 1 1 2 52 2 0 1 1 1 2 2 1 1 1 51 2 0 1 1 2 1 2 1 1 1 62 2 0 1 2 2 2 2 1 1 2 61 2 0 1 2 3 1 2 1 1 2 72 1 0 1 1 3 2 1 1 1 1 7
γ b p W γ O c p 4 γ a b p 9W γ a c p 9W γ b c p 9W 0 125,γ a b c p 40 25,γ q 9W γ O a q W γ O b q W γ O c q W γ O a b q 9W γ a c q 4 γ O b c q W0 0,andγ O a b c q 9f 1.Now it is easyto calculatethat0 140 ϕµ
B pB ϕµB q4
0 125,andonceagain,a setof attributesetswith very low approximationqualitiesdominatesanothersetwith oneperfectattributecombination.
Whateverpower index will beused,it shouldbenotedthatthis index cannotbein-terpretedin termsof usefulness.As anexample,considerthecasewhereΩ p q ,γ pv c with c ( 1, andγ q 1. TheBanzhafvaluesandqualitativeShapley val-uesare
ϕB p: 12M 1 3 1=x c 3 0f c
2
ϕB q: 12M 1 3 c=x 1 3 0f 1 3 c
2
ϕQ p: max 1 | 1 c | 0 p c ϕQ q: max 1 | c 1 | 0 p 1
Now, ϕx p:( ϕx q holdsfor every x B S Q andany valueof c strictly lessthan1, regardlessof the“quality” of theattributeq – it maybearunningnumberor

anattributewith low entropy. It is easyto constructsituationsin which attribute pis moreusefulthanattributeq, but neitherof thepower indiceswould detectthis.
Recall from (10) that in MCDM two objectsp q are“uncorrelated”or “indepen-dent”, if µ p q 96 µ p*x µ q . The applicationof the quantitative interactionvaluesin RSDA areproblematicaswell, but theterm“uncorrelated”shouldbeusedwith caution:Assumeanattributeq with γ q 0 anduseanotheranotherattributeq , whichgeneratesthesamepartitiononU . Thenq andq show no interactionwithd andcanbecalled“uncorrelated”,but their dependency is maximal.
4.4 A qualitative power value based on rough entropy
In [8] wehavenotedthatγ is aconditionalmeasure,andtherefore,comparisonsof γvaluesareonly valid in socallednestedmodels, whichmeansthatγ P andγ Q areonly comparablein a meaningfulmannerif eitherP Q or Q P holds.To allowmodelselectionfrom all possibleattribute setswithin RSDA, we have presenteda measurecalledentropy of deterministicroughapproximationwhich is basedonthemaximumentropy principleasa worstcase.Supposewe have a fixeddecisionattribute d generatingthe equivalencerelationθd on U . If Q is a setof attributesgeneratingθQ, we defineanew equivalenceθ uQ by
xθ uQ y F
xθQy if θQ xv θQ y andθQ x. θd z for somez U x y otherwise
Itsassociatedprobabilitydistribution,basedontheprincipleof indifference,is givenby ψK : K -! θ MQ e with
ψ K K
n(14)
Theentropyof deterministicroughapproximation(with respectto Q andd) is nowdefinedby
H u Q ∑K
ψ K % log2 1ψ K
If
H d ∑L $9 d
L
n% log2
nL
H u? Q canbestandardisedby
NRE Q : 1 3 H u? Q43 H d log2 nW3 H d (15)

assumingH d :( log2 n . We obtaina measureof approximationsuccesswithinRSDA, which canbeusedto comparedifferentmodelsin termsof thecombinationof codingcomplexity anduncertaintyoutsidetheapproximationin thesensethataperfectapproximationresultsin NRE Q 1, andtheworstcaseis atNRE Q 0.Unlike γ, NRE is an unconditionalmeasure,becauseboth, the complexity of therulesgeneratedby the independentattributesandthe uncertaintyafterapproxima-tion, aremergedinto onemeasure.
We arenow ableto definethequalitativepowerindex of an attributem usingNREby
ϕ m max NRE K r m | NRE K : K U 56 m & & (16)
This valueis meaningful,becauseit addressesthevalueof themaximumNRE (orminimum roughentropy) for which attribute m contributesa non-zeroamountofadditionalinformation.It is easyto seethat
maxm
ϕ m maxK
NRE K sothatthemaximumof ϕ alsois thehighestNRE overall subsetsof U .
5 An example
Oneof the first publishedapplicationsof RSDA wasa studywhich describespa-tientsafterhighly selectivevagotomyfor duodenalulcer[25]. An enhanceddatasetof 122patientswasusedin [30], andthis datasetwill beusedin thesequel.
Theinformationsystemconsistedof 11conditionattributesandadecisionattribute“Visick grading” . Comparingapproximationqualities,it wasdecidedthat the at-tributesetP, consistingof
3: Durationof disease4: Complication5: BasicHCI concentration6: BasicVol. of gastricjuice9: StimulatedHCI concentration10: StimulatedVol. of gastricjuice
is a good basisto approximateattribute “Visick grading” with an approximationquality γ P6 0 795. Inspectingthe declineof the approximationquality (2) un-der theassumptionof anadmissibilitythresholdof c 0 55, it wasfoundthat theattributesets
A 4 5 6 9 10 B 3 4 6 9 10 C 3 4 5 6 9

Table 6. Analysisof theduodenalulcerdata,I
Attributeset γ Interpretation d3 Interpretation3,4,5,6,9,10(P) 0.795 admissible ,4,5,6,9,10(A) 0.590 admissible0.500nonadmissiblegain3, ,5,6,9,10 0.516notadmissible0.576 admissiblegain3,4, ,6,9,10(B) 0.680 admissible0.359nonadmissiblegain3,4,5, ,9,10 0.549notadmissible0.545 admissiblegain3,4,5,6, ,10(D ) 0.631 admissible0.444nonadmissiblegain3,4,5,6,9, (C) 0.648 admissible0.418nonadmissiblegain
arecandidatesfor future research.Thesearepresentedin Table6; it turnsout theattributesetD G 3 4 5 6 10 with γ 0 631shouldhave beenincludedaswellfor furtheranalysis.
Thegainanalysiswith d3 canbeinterpretedin thesameway: Leaving out attribute4 or 6 resultsin models,which arenot admissible,if we setcg 0 5. Theanalysisof gaincomplementsthesetadmissibility:If asubsetof P is labelledasadmissible,the gain is labelledto be non admissibleandvice versa.This result is not a trivi-ality, becausetheadmissibilitylabelsfor setsandgainsaredrivenby thedifferentconstantsc andcg.
As we have discussedabove, the analysisof usefulnessandsignificancerequiresa simulationframe:The results,basedon 1000simulatedrandomisationsfor eachanalysis,aregatheredin Table7.Column1 showstheattributesunderconsideration,column2 theobservedapproximationqualityγ of thisset,column3 theexpectationof γ given the benchmarkmodel,column4 the correspondingPRE-measure(use-fulness),andcolumn5 theestimatedpositionof γ in thedistribution of therandommatchingassumption(significance).
Thefirst partof Table7 presentstheresultsof usefulnessandsignificancefor sets.Theadmissiblesets(P A B C D ) aresignificantaswell. P offersa mediumeffectsize,whereastheusefulnessof theadmissiblesubsetsof P is smaller.
Theanalysisof gainwithin P (secondpartof Table7) achievesanastonishingre-sult:All attributesareconditionalcasualwithin P. Thismeansthattherearealwaysonly a few of the122observationswhich canbeapproximatedadditionallyby in-troducingtheattributeunderstudyinto theset.Thus,onecanarguethatthenumberof observationsin theduodenalulcerinformationsystemis too small,andthegoodresultsof P arepusheddueto overfitting.Becauseroughentropy is helpful to checkthecomplexity of therule systembasedon theattributes– andthereforehelpful topreventagainstoverfitting–, inspectionof thenormedRoughEntropy (NRE)valuesin Table8 providesfurtherinsight:Amongthegivenalternatives,setC hasthehigh-estNRE(or thelowestcomplexity) , andfrom thispointof view canberegardedasa favourablemodel.

Table 7. Analysisof theduodenalulcerdata,II
Analysisof theattributesetAttributeset γ X Y γ ] UsefulnessSignificance Interpretation3,4,5,6,9,10 0.7950.703 0.311 0.013 significant,mediumusefulness ,4,5,6,9,10(A) 0.5900.554 0.081 0.153 not significant, notuseful3, ,5,6,9,10 0.5160.484 0.063 0.199 notsignificant,notuseful
3,4, ,6,9,10(B) 0.6800.579 0.241 0.018 significant,smallusefulness3,4,5, ,9,10 0.5490.487 0.121 0.084 notsignificant,low usefulness
3,4,5,6, ,10(D ) 0.6310.515 0.240 0.008 significant,smallusefulness3,4,5,6,9, (C) 0.6480.524 0.259 0.011 significant,smallusefulness
Analysisof thegainwithin _ 3 4 5 6 9 10aAttribute γ XZY γ ] UsefulnessSignificance Interpretation
3 0.7950.769 0.112 0.182 notsignificant,low usefulness4 0.7950.751 0.178 0.099 notsignificant,low usefulness5 0.7950.792 0.017 0.394 notsignificant6 0.7950.760 0.145 0.107 notsignificant,low usefulness9 0.7950.763 0.137 0.127 notsignificant,low usefulness10 0.7950.786 0.044 0.310 notsignificant
Table 8. Analysisof theduodenalulcerdata,III
Attributeset γ NRE3,4,5,6,9,10 0.7950.063 ,4,5,6,9,10(A) 0.5900.0463, ,5,6,9,10 0.5160.0703,4, ,6,9,10(B) 0.6800.0793,4,5, ,9,10 0.5490.0643,4,5,6, ,10(D ) 0.6310.0763,4,5,6,9, (C) 0.6480.092
Finally, wepresenttheresultsof thequalitativepower index analysisfor thisexam-ple in Table9. In termsof NRE, the uniqueoptimal set is 3 4 6 10 andthere-
Table 9. Analysisof theduodenalulcerdata,IV
Attribute ϕQ Dueto attributeset3 0.1006 3,4,6,104 0.1006 3,4,6,105 0.0982 3,4,5,96 0.1006 3,4,6,109 0.0947 3,4,910 0.1006 3,4,6,10

fore, by constructionof ϕQ in Section4.2,we resultin ϕQ 3v ϕQ 4v ϕQ 6vϕQ 10f NRE O 3 4 6 10 . For theelements5and9 thereexist two furtheruniqueconditionaloptimalsets,whichareusedto determinetheirqualitativepowerindices.
To sum up, we concludethat setC seemsto be the optimal choice:It shows anadmissibleapproximationquality, its usefulnessis neartheoptimalvalue,it is sig-nificant,andits complexity is closeto theoptimalvalueaswell.
6 Conclusion
Thepaperdemonstratesthat thereis morethanoneway to evaluatea non-numericmodel,but it showsaswell thatan“anythinggoes”approachdoesnot work: Form-ingsimpledifferencesoraveragesposesproblemsfor interpretationandtheChoquet-typeaggregationschemeswill achieve strangeresultsundercertaincircumstances.This doesnot meanthat the suchapproacheswill not work mostof the time, butthereis no guaranteethat they do. It is notable,thatBanzhaf[1] beginshis analy-sisof voting schemeswith exactly thesameideas.Thereplacementof quantitativeindicesby their qualitativecounterpartsis a cure,but theresultsof thesequalitativeindicesarenotoverwhelming:They aresimply pointersto maximalvaluesof somebasicevaluationfunction(γ, NRE) andmostof theresultsareachievedwithout theneedof anextra theory, simply by readingout theresultsof theoptimisationof thebasicevaluationfunction.
Becausethereareseveral indices,onehasto find a guidelinewhenandhow theseindicesshouldbe applied.The examplesdemonstratethat in RSDA a reasonablestartof evaluationis theinspectionof theapproximationquality, becauseit is veryeasyto seta first restrictionfor a goodmodel.A further restrictioncanbe setbycomparingthe usefulnesswith the given standardsof effect sizes– modelswithvery low effect sizes( ( 0 1) have to be excluded,and the final modelshouldbenot too far away from the maximumeffect size.The approximationquality of thefinal modelmustbesignificant,andits complexity (NRE)shouldbenearlyoptimal.Theexamplesdemonstrateaswell, that thesefour qualitiesneednot be presentinonemodel.Furthermore,thereneednot even be a successfulcombinationat all:We have shown that the indicesmay dissociate,becausethey are looking only atpartiallyoverlappingfeaturesof amodel.It mayhappenthatapproximationqualityis high, but eitherusefulnessis very low or significanceis lacking; in suchcases,thedatado not votefor usingRSDA – andthis is a fair resultaswell.
Bibliography
[1] Banzhaf,J.F. (1965).Weightedvotingdoesn’t work: A mathematicalanalysis.RutgersLaw Review, 19:317–343.
[2] Cohen,J. (1988). Statisticalpoweranalysisfor the behavioral sciences. Erl-baum,Hillsdale,NY.
[3] Cohen,J. (1990). Things I have learned(so far). AmericanPsychologist,45:1304–1312.
[4] Dubey, P. (1975).Ontheuniqienessof theShapley value.InternationalJournalof GameTheory, 4:131–139.
[5] Dubey, P. and Shapley, L. (1979). Mathematicalpropertiesof the Banzhafpower index. Mathematicsof OperationsResearch, 4(2):99–131.
[6] Dubois,D., Grabisch,M., Modave,F., andPrade,H. (1997).Relatingdecisionunderuncertaintyandmulticriteria decisionmakingmodels. Technicalreport,IRIT-CNRSUniversitéP. Sabatier, ToulouseCedex.
[7] Düntsch,I. andGediga,G. (1997). Statisticalevaluationof roughsetdepen-dency analysis.InternationalJournalof Human–ComputerStudies, 46:589–604.
[8] Düntsch,I. andGediga,G. (1998). Uncertaintymeasuresof roughsetpredic-tion. Artificial Intelligence, 106(1):77–107.
[9] Düntsch,I. andGediga,G. (2000). Roughsetdata analysis:A road to non-invasiveknowledge discovery, volume2 of MethoδosPrimers. MethoδosPub-lishers(UK), Bangor.
[10] Gediga,G. andDüntsch,I. (2001). Roughapproximationquality revisited.Artificial Intelligence, 132:219–234.
[11] Grabisch,M. (1996). Theapplicationof fuzzy integralsin multicriteriadeci-sionmaking.EuropeanJournalof OperationalResearch, 89:445–456.
[12] Grabisch,M. (1997). k-additive andk-decomposablemeasures.Proceedingsof theLinz Seminar.
[13] Greco,S., Matarazzo,B., and Słowinski (1998). Fuzzy measuretechniquefor rough set analysis. In Zimmermann,H.-J., editor, Proceedingsof the 6thEuropeanCongresson IntelligentTechniquesandSoftComputing(EUFIT’98),pages99–103,Aachen.Mainz Wissenschaftsverlag.
[14] Greco,S.,Matarazzo,B., andSłowinski,R.(2001).Roughsetstheoryfor mul-ticriteria decisionanalysis.EuropeanJournal of Operational Research, 129:1–47.
[15] Hildebrand,D., Laing, J., and Rosenthal,H. (1974). Predictionlogic andquasi-independencein empirical evaluationof formal theory. Journal of theMathematicalSociology, 3:197–209.
[16] Komorowski, J.,Pawlak, Z., Polkowski, L., andSkowron, A. (1999). Roughsets:A tutorial. In Pal, S.andSkowron,A., editors,RoughFuzzyHybridization,pages3–98.Springer–Verlag.
[17] Laruelle,A. andValenciano,F. (2001). Shapley-ShubikandBanzhafindicesrevisited. Mathematicsof OperationsResearch. To appear.

[18] Marichal,J.-L. (2000).An axiomaticapproachof thediscretechoquetintegralasa tool to aggregateinteractingcriteria. IEEE Transactionson FuzzySystems,8(6).
[19] Marichal, J.-L. andMathonet,P. (2000). On comparisonmeaningfulnessofaggregationfunction. Journalof MathematicalPsychology, 45:213–223.
[20] Miller, F. (1966). Computerstudyinto thecausesof 1965-1966traffic deathsin Jacksonville, Florida. Unpublished.
[21] Murofushi,T. andSoneda,S. (1993). Techniquesfor readingfuzzy measuresiii: Interactionindex (in japanese).In Proc.9th FuzzySystemSymposium, pages693–696.Sapporo,Japan.
[22] Pawlak, Z. (1982).Roughsets.Internat.J. Comput.Inform.Sci., 11:341–356.[23] Pawlak, Z. (1991). Roughsets:Theoretical aspectsof reasoningaboutdata,
volume9 of SystemTheory, KnowledgeEngineeringandProblemSolving. Klu-wer, Dordrecht.
[24] Pawlak, Z. (1997).Roughsetapproachto knowledge-baseddecisionsupport.EuropeanJournalof OperationalResearch, 99(1):48–57.
[25] Pawlak, Z., Słowinski, K., andSłowinski, R. (1986). Roughclassificationofpatientsafterhighlyselectivevagotomyfor duodenalulcer. InternationalJournalof Man-MachineStudies, 24:413–433.
[26] Roth,A. E., editor (1976). TheShapley value– Essaysin honorof Llloyd S.Shapley. CUP, Cambridge.
[27] Roubens,M. (1996). Interactionbetweencriteria throughthe useof fuzzymeasures.TechnicalReport96.007,Institutede Mathématique,UniversitédeLiège,Liège.
[28] Shapley, L. S. (1953). A value for n-persongames. In Kuhn, H. W. andTucker, A. W., editors,Contributionsto theTheoryof GamesII , pages307–317.PrincetonUniversityPress,Princeton.
[29] Shubik,M. (1997).Gametheory, complexity, andsimplicity.[30] Słowinski, K. (1992). Roughclassificationof HSV patients. In Słowinski,
R., editor, Intelligentdecisionsupport:Handbookof applicationsandadvancesof roughsettheory, volume11 of SystemTheory, Knowledge EngineeringandProblemSolving, pages77–94.Kluwer, Dordrecht.
[31] Stepaniuk,J.(2000).Knowledgediscoveryby applicationof roughsetmodels.In Polkowski, L., Tsumoto,S., andLin, T. Y., editors,RoughSetMethodsandApplications. Physika,Heidelberg.
[32] Stevens,S. S. (1951). Mathematics,measurement,and psychophysics.InStevens,S.S.,editor, Handbookof ExperimentalPsychology. Wiley, new York.
[33] Straffin, P. D. (1976). The Shapley – ShubikandBanzhafpower indicesasprobabilities.In [26], pages71–81.
[34] Vogel, F. (1975). Problemeund Verfahren der numerischenKlassifikation.Vandenhoeck& Ruprecht,Göttingen.
[35] Wolpert, D. H. and Macready, W. G. (1995). No free lunch theoremsforsearch.TechnicalReportSFI-TR-95-02-010,SantaFeInstitute,SantaFe,NM.
[36] Zadeh,L. A. (1999). From Computingwith Numbersto ComputingwithWords - From Manipulationof Measurementsto Manipulationof Perceptions.IEEETransactionsin CircuitsandSystems, 45(1):105–119.