chapter no.: 1 title name: ftocdownload.e-bookshelf.de/download/0009/9957/02/l-g-0009995702... ·...
TRANSCRIPT

Chapter No.: 1 Title Name: <TITLENAME> ftoc.inddComp. by: <USER> Date: 22 May 2017 Time: 06:50:08 PM S t a g e : < S T A G E > WorkFlow:<WORKFLOW> Page Number: xii

Protein Analysis using Mass Spectrometry
WILEY SERIES ON PHARMACEUTICAL SCIENCE AND BIOTECHNOLOGY: PRACTICES, APPLICATIONS, AND METHODS
Series Editor:
Mike S. LeeMilestone Development Services
Mike S. Lee • Integrated Strategies for Drug Discovery Using Mass Spectrometry
Birendra Pramanik, Mike S. Lee, and Guodong Chen • Characterization of Impurities and Degradants Using Mass Spectrometry
Mike S. Lee and Mingshe Zhu • Mass Spectrometry in Drug Metabolism and Disposition: Basic Principles and Applications
Mike S. Lee (editor) • Mass Spectrometry Handbook
Wenkui Li and Mike S. Lee • Dried Blood Spots—Applications and Techniques
Mike S. Lee and Qin C. Ji . • Protein Analysis using Mass Spectrometry: Accelerating Protein Biotherapeutics from Lab to Patient
Ayman F. El-Kattan • Oral Bioavailability Assessment: Basics and Strategies for Drug Discovery and Development
Protein Analysis using Mass Spectrometry
Accelerating Protein Biotherapeutics from Lab to Patient
Edited By Mike S. Lee and Qin C. Ji
This edition first published 2017
© 2017 John Wiley & Sons, Inc.
All rights reserved. No part of this publication may be reproduced, stored in a retrieval system, or transmitted, in any form or by any means, electronic, mechanical, photocopying, recording or otherwise, except as permitted by law. Advice on how to obtain permission to reuse material from this title is available at http://www.wiley.com/go/permissions.
The right of Mike S. Lee and Qin C. Ji to be identified as the authors of the editorial material in this work has been asserted in accordance with law.
Registered OfficeJohn Wiley & Sons, Inc., 111 River Street, Hoboken, NJ 07030, USA
Editorial Office111 River Street, Hoboken, NJ 07030, USA
For details of our global editorial offices, customer services, and more information about Wiley products visit us at www.wiley.com.
Wiley also publishes its books in a variety of electronic formats and by print-on-demand. Some content that appears in standard print versions of this book may not be available in other formats.
Limit of Liability/Disclaimer of WarrantyIn view of ongoing research, equipment modifications, changes in governmental regulations, and the constant flow of information relating to the use of experimental reagents, equipment, and devices, the reader is urged to review and evaluate the information provided in the package insert or instructions for each chemical, piece of equipment, reagent, or device for, among other things, any changes in the instructions or indication of usage and for added warnings and precautions. While the publisher and authors have used their best efforts in preparing this work, they make no representations or warranties with respect to the accuracy or completeness of the contents of this work and specifically disclaim all warranties, including without limitation any implied warranties of merchantability or fitness for a particular purpose. No warranty may be created or extended by sales representatives, written sales materials or promotional statements for this work. The fact that an organization, website, or product is referred to in this work as a citation and/or potential source of further information does not mean that the publisher and authors endorse the information or services the organization, website, or product may provide or recommendations it may make. This work is sold with the understanding that the publisher is not engaged in rendering professional services. The advice and strategies contained herein may not be suitable for your situation. You should consult with a specialist where appropriate. Further, readers should be aware that websites listed in this work may have changed or disappeared between when this work was written and when it is read. Neither the publisher nor authors shall be liable for any loss of profit or any other commercial damages, including but not limited to special, incidental, consequential, or other damages.
Library of Congress Cataloging-in-Publication Data
Names: Lee, Mike S., 1960- editor. | Ji, Qin C., editor.Title: Protein analysis using mass spectrometry : accelerating protein
biotherapeutics from lab to patient / edited by Mike S. Lee, Qin C. Ji.Description: 1st edition. | Hoboken, NJ : John Wiley & Sons, Inc., 2017. |
Includes bibliographical references and index.Identifiers: LCCN 2016058010| ISBN 9781118605196 (cloth) | ISBN 9781119359357
(epub)Subjects: LCSH: Proteins--Analysis. | Proteins--Therapeutic use. | Mass
spectrometry.Classification: LCC QP551 .P748 2017 | DDC 572/.6--dc23 LC record available at https://lccn.loc.gov/2016058010
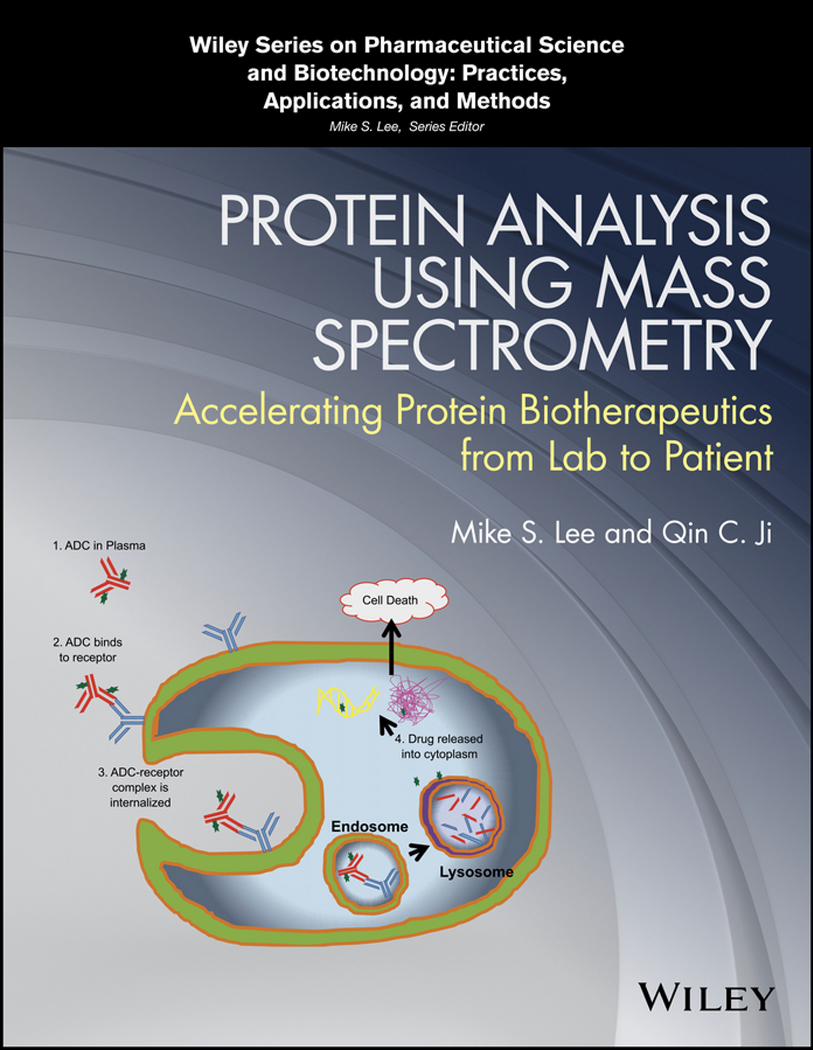
Cover image: © me4o/Gettyimages; (Inset Image) Courtesy of Yongjun XueCover design by Wiley
Set in 10/12pt Warnock by SPi Global, Chennai, India
Printed in the United States of America
10 9 8 7 6 5 4 3 2 1
v
Contents
List of Contributors xiii Foreword xvii Preface xix
1 Contemporary Protein Analysis by Ion Mobility Mass Spectrometry 1Johannes P.C. Vissers and James I. Langridge
1.1 Introduction 11.2 Traveling-Wave Ion Mobility Mass Spectrometry 11.3 IM–MS and LC–IM–MS Analysis of Simple and Complex Mixtures 21.3.1 Cross Section and Structure 21.3.2 Separation 41.3.3 Sensitivity 51.4 Outlook 7 Acknowledgment 8 References 8
2 High-Resolution Accurate Mass Orbitrap and Its Application in Protein Therapeutics Bioanalysis 11Hongxia Wang and Patrick Bennett
2.1 Introduction 112.2 Triple Quadrupole Mass Spectrometer and Its Challenges 112.3 High-Resolution Mass Spectrometers 122.4 Quantitation Modes on Q Exactive Hybrid Quadrupole Orbitrap 132.5 Protein Quantitation Approaches Using Q Exactive Hybrid Quadrupole Orbitrap 142.6 Data Processing 162.7 Other Factors That Impact LC–MS-based Quantitation 162.7.1 Sample Extraction to Reduce Matrices 162.7.2 Internal Standard 172.8 Conclusion and Perspectives of LC–HRMS in Regulated Bioanalysis 18 References 18
3 Current Methods for the Characterization of Posttranslational Modifications in Therapeutic Proteins Using Orbitrap Mass Spectrometry 21Zhiqi Hao, Qiuting Hong, Fan Zhang, Shiaw-Lin Wu, and Patrick Bennett
3.1 Introduction 213.2 Characterization of PTMs Using Higher-Energy Collision Dissociation 233.2.1 Oxidation 243.2.2 Deamidation 243.3 Application of Electron Transfer Dissociation to the Characterization of Labile PTMs 263.3.1 Performing ETD Experiments in Orbitrap Instruments 273.3.2 Structure Elucidation of Glycopeptides Using Multiple Fragmentation Mechanisms
in Orbitrap Instruments 28
Contentsvi
3.4 Conclusion 31 Acknowledgment 32 References 32
4 Macro- to Micromolecular Quantitation of Proteins and Peptides by Mass Spectrometry 35Suma Ramagiri, Brigitte Simons, and Laura Baker
4.1 Introduction 354.2 Key Challenges of Peptide Bioanalysis 364.2.1 Key Benefits of the LC/MS/MS Peptide Quantitation Workflow 384.3 Key Features of LC/MS/MS-Based Peptide Quantitation 384.3.1 Sensitivity 394.3.2 Selectivity 394.3.2.1 MRM3 394.3.2.2 Differential Mobility Spectrometry (DMS) 394.3.3 High-Resolution Accurate-Mass Spectrometry 394.3.4 Software 404.4 Advantages of the Diversity of Mass Spectrometry Systems 414.5 Perspectives for the Future 41 References 42
5 Peptide and Protein Bioanalysis Using Integrated Column-to-Source Technology for High-Flow Nanospray 45Shane R. Needham and Gary A. Valaskovic
5.1 Introduction – LC–MS Has Enabled the Field of Protein Biomarker Discovery 455.2 Integration of Miniaturized LC with Nanospray ESI-MS Is a Key for Success 465.3 Micro- and Nano-LC Are Well Suited for Quantitative Bioanalysis 475.4 Demonstrating Packed-Emitter Columns Are Suitable for Bioanalysis 495.5 Future Outlook 51 References 52
6 Targeting the Right Protein Isoform: Mass Spectrometry-Based Proteomic Characterization of Alternative Splice Variants 55Jiang Wu
6.1 Introduction 556.2 Alternative Splicing and Human Diseases 556.3 Identification of Splice Variant Proteins 566.3.1 Global Profiling of Splicing Variant Proteins 566.3.2 Characterization of Relative Expression of Protein Splice Variants 576.3.3 Quantitation of Splice Variants by MRM-MS 626.4 Conclusion 64 References 64
7 The Application of Immunoaffinity-Based Mass Spectrometry to Characterize Protein Biomarkers and Biotherapeutics 67Bradley L. Ackermann and Michael J. Berna
7.1 Introduction 677.1.1 The Importance of Protein Measurement 677.1.2 Ligand Binding Assays 687.1.3 The Introduction of Hybrid IA-MS Methods 687.2 Overview of IA-MS Methods 697.2.1 Classification of IA-MS Methods 697.2.2 Stable-Isotope-Labeled Internal Standards 717.2.3 IA Capture Formats 717.2.4 Liquid Chromatography 727.2.5 MS Detection 74
Contents vii
7.3 IA-MS Applications – Biomarkers 747.3.1 Peptide Biomarkers 747.3.2 Protein Biomarkers – Anti-Protein Capture 787.3.3 Protein Biomarkers – Anti-Peptide Capture 807.4 IA-MS Applications – Biotherapeutics 817.4.1 Therapeutic Peptides 817.4.2 Therapeutic Antibodies 837.4.3 Antibody–Drug Conjugates 847.5 Future Direction 84 References 85
8 Semiquantification and Isotyping of Antidrug Antibodies by Immunocapture-LC/MS for Immunogenicity Assessment 91Jianing Zeng, Hao Jiang, and Linlin Luo
8.1 Introduction 918.2 Multiplexing Direct Measurement of ADAs by Immunocapture-LC/MS for Immunogenicity Screening,
Titering, and Isotyping 938.3 Indirect Measurement of ADAs by Quantifying ADA Binding Components 958.4 Use of LC–MS to Assist in Method Development of Cell-Based Neutralizing Antibody Assays 968.5 Conclusion and Future Perspectives 97 References 97
9 Mass Spectrometry-Based Assay for High-Throughput and High-Sensitivity Biomarker Verification 99Xuejiang Guo and Keqi Tang
9.1 Background 999.2 Sample Processing Strategies 1009.3 Advanced Electrospray Ionization Mass Spectrometry Instrumentation 1029.4 Conclusion 105 References 105
10 Monitoring Quality of Critical Reagents Used in Ligand Binding Assays with Liquid Chromatography Mass Spectrometry (LC–MS) 107Brian Geist, Adrienne Clements-Egan, and Tong-Yuan Yang
10.1 Introduction 10710.2 Case Study Examples 11410.2.1 Case Study #1: Confirmation of Correct Reagent Construct Prior to Use in Development of an LBA
Method 11410.2.2 Case Study #2: Monitoring the Integrity of the Reagent Cell Line Production System 11610.2.3 Case Study #3: Investigation of the Loss of LBA Specificity During Clinical Development 11610.2.3.1 Prestudy Investigation 11610.2.3.2 In-Study Investigation 11910.2.4 Case Study #4: Monitoring the Incorporation Ratio of Conjugated Critical Reagent Used in LBAs 12210.3 Discussion 12210.3.1 Keys to Reagent Management 12210.3.2 Importance of LC–MS Characterization 12310.3.3 The Analytical Toolbox and a “Fit-for-Purpose” Approach for Reagent Management 125 Acknowledgment 126 References 126
11 Application of Liquid Chromatography-High Resolution Mass Spectrometry in the Quantification of Intact Proteins in Biological Fluids 129Stanley (Weihua) Zhang, Jonathan Crowther, and Wenying Jian
11.1 Introduction 12911.2 Workflows for Quantification of Proteins Using Full-Scan LC-HRMS 13111.2.1 Sample Preparation 131
Contentsviii
11.2.1.1 Solid-Phase Extraction (SPE) 13111.2.1.2 Affinity Enrichment 13111.2.1.3 Depletion of High-Abundant Proteins 13111.2.1.4 Solution Fractionation 13211.2.1.5 Protein Precipitation for PEGylated Proteins 13211.2.2 LC-HRMS 13211.2.2.1 HPLC 13211.2.2.2 Full-Scan HRMS Data Acquisition and Analysis 13311.3 Internal Standard Strategy 13311.3.1 Stable Isotope Labeled Protein 13411.3.2 Protein Analog 13511.4 Calibration and Quality Control (QC) Sample Strategy 13511.5 Common Issues in Quantification of Proteins Using LC-HRMS 13511.5.1 Stability 13511.5.2 Adsorption 13611.5.3 Specific Protein Binding 13611.5.4 Posttranslational Modifications (PTMs) 13611.6 Examples of LC-HRMS-Based Intact Protein Quantification 13711.7 Conclusion and Future Perspectives 138 Acknowledgment 140 References 140
12 LC–MS/MS Bioanalytical Method Development Strategy for Therapeutic Monoclonal Antibodies in Preclinical Studies 145Hongyan Li, Timothy Heath, and Christopher A. James
12.1 Introduction: LC-MS/MS Bioanalysis of Therapeutic Monoclonal Antibodies 14512.2 Highlights of Recent Method Development Strategies 14612.2.1 Strategy for Surrogate Peptide Selection and Optimization 14612.2.2 Sample Preparation 14812.2.2.1 Immunoaffinity-Based Sample Preparation 14812.2.2.2 Nonimmunoaffinity-Based Sample Preparation 15112.2.3 Accelerated Trypsin Digestion 15212.2.4 Internal Standard Selection 15312.2.4.1 SIL-Peptide IS 15412.2.4.2 Cleavable Flanking SIL-Peptide IS 15412.2.4.3 SIL-mAb IS 15412.3 Case Studies of Preclinical Applications of LC–MS/MS for Monoclonal Antibody Bioanalysis 15412.3.1 Case Study #1 15412.3.1.1 Key Analytical Method Features 15412.3.2 Case Study #2 15512.3.2.1 Key Analytical Method Features 15512.4 Conclusion and Future Perspectives 156 References 158
13 Generic Peptide Strategies for LC–MS/MS Bioanalysis of Human Monoclonal Antibody Drugs and Drug Candidates 161Michael T. Furlong
13.1 Introduction 16113.2 A Universal Peptide LC–MS/MS Assay for Bioanalysis of a Diversity of Human Monoclonal Antibodies
and Fc Fusion Proteins in Animal Studies 16113.2.1 Identification of a Candidate Universal Surrogate Peptide to Enable Quantification of Human mAb and Fc
Fusion Protein Drug Candidates 161
Contents ix
13.2.2 Application of an Exploratory Universal (Peptide 1) LC–MS/MS Assay to a Monkey Pharmacokinetic Study 162
13.2.3 Potential Applicability of a Peptide 1 Variant to Bioanalysis of Human IgG2-Based mAbs and Fc Fusion Proteins 163
13.2.4 Impact of Peptide 1 Asparagine Deamidation on Human mAb Quantification Can Be Mitigated 16413.3 An Improved “Dual” Universal Peptide LC–MS/MS Assay for Bioanalysis of Human mAb Drug Candidates
in Animal Studies 16513.3.1 Identification and Evaluation of “Dual” Universal Peptide LC–MS/MS Assay Candidates 16513.3.2 Quantitative Evaluation and Comparison of Light and Heavy Chain Dual Universal Peptide
Candidates 16713.3.3 Assessing the Level of Quantitative Agreement Between Peptide 1 and Peptide 2 in Assay Performance
Evaluation Runs 16713.3.4 Deployment of the Exploratory Dual Universal Peptide Assay in Support of a Monkey Pharmacokinetic
Study 16813.3.5 Considerations for Calibration Curve/QC Replicate Acceptance Criteria When a Dual Peptide Assay Is
Employed 16813.3.6 Interpreting and Reporting Study Sample Concentration Data Generated with a Dual Peptide Assay 16813.3.7 Related Studies: Generic LC–MS/MS Assays for Human mAb Bioanalysis in Animal Studies 16913.4 Extending the Universal Peptide Assay Concept to Human mAb Bioanalysis in Human Studies 17013.4.1 Potential Expansion of the Universal LC–MS/MS Assay Concept into Human Studies 17013.4.2 Development and Evaluation of an Exploratory Universal IgG4 Clinical LC–MS/MS Assay 17113.4.3 Evaluation of the Impact of Anti-mAb Antibodies on Exploratory Universal IgG4 LC–MS/MS Assay
Performance 17313.5 Internal Standard Options for Generic Peptide LC–MS/MS Assays 17313.5.1 Stable Isotopically Labeled Peptide Internal Standards 17313.5.2 Stable Isotopically Labeled Protein Internal Standards 17413.5.3 “Flanked” Stable Isotopically Labeled Peptide Internal Standards 17513.6 Sample Preparation Strategies for Generic Peptide LC–MS/MS Assays 17513.6.1 Direct Digestion, Pellet Digestion, and Solid-Phase Extraction 17513.6.2 Affinity Capture 17613.6.3 Additional Sample Preparation Approaches for Generic Peptide LC–MS/MS Assays 17613.7 Limitations of Generic Peptide LC–MS/MS Assays 17713.8 Conclusion 178 Acknowledgments 178 References 178
14 Mass Spectrometry-Based Methodologies for Pharmacokinetic Characterization of Antibody Drug Conjugate Candidates During Drug Development 183Yongjun Xue, Priya Sriraman, Matthew V. Myers, Xiaomin Wang, Jian Chen, Brian Melo, Martha Vallejo, Stephen E. Maxwell, and Sekhar Surapaneni
14.1 Introduction 18314.2 Mechanism of Action 18314.2.1 Linker Chemistry 18514.2.2 Toxins 18514.2.3 ADME 18514.2.4 Unique Bioanalytical Challenges 18514.3 Mass Spectrometry Measurement for DAR Distribution of Circulating ADCs 18614.3.1 Immunocapture of ADCs from Plasma or Serum 18614.3.2 Deglycosylation for Captured ADCs 18714.3.3 Mass Spectrometry Measurement for DAR Distribution of Circulating ADCs 18814.4 Total Antibody Quantitation by Ligand Binding or LC–MS/MS 18914.4.1 Ligand Binding Assay 18914.4.2 LC–MS/MS Assay for Total Antibody Quantitation 190
Contentsx
14.4.2.1 Predigestion Treatment 19014.4.2.2 Enzymatic Digestion 19114.4.2.3 Postdigestion Treatment 19114.4.2.4 LC–MS/MS Analysis 19114.4.3 Ligand Binding versus LC–MS/MS Assays 19214.5 Total Conjugated Drug Quantitation by Ligand Binding or LC–MS/MS 19314.5.1 Ligand Binding Assays for ADC Quantitation 19314.5.1.1 DAR-Sensitive Total Conjugated Drug Assay 19314.5.1.2 DAR-Insensitive Total Conjugated Antibody Assay 19314.5.2 LC–MS/MS for the Total Conjugated Drug Quantitation 19414.5.2.1 Predigestion Treatment 19414.5.2.2 Enzymatic or Chemical Digestion 19414.5.2.3 Postdigestion Treatment 19514.5.2.4 LC–MS/MS Analysis 19514.5.3 Ligand Binding versus LC–MS/MS 19514.6 Catabolite Quantitation by LC–MS/MS 19614.6.1 Sample Preparation 19614.6.2 LC–MS/MS Analysis 19714.7 Preclinical and Clinical Pharmacokinetic Support 19714.8 Conclusion and Future Perspectives 198 References 198
15 Sample Preparation Strategies for LC–MS Bioanalysis of Proteins 203Long Yuan and Qin C. Ji
15.1 Introduction 20315.2 Sample Preparation Strategies to Improve Assay Sensitivity 20515.2.1 Protein Precipitation 20515.2.2 Solid-Phase Extraction 20515.2.3 Derivatization 20615.2.4 Depletion of High-Abundance Proteins 20715.2.5 Immunoaffinity Purification 20815.2.5.1 Immunocapture of a Specific Peptide 20815.2.5.2 Immunocapture of a Specific Protein 20815.2.5.3 Generic Immunocapture 21015.2.6 Online Sample Preparation 21115.3 Sample Preparation Strategies to Differentiate Free, Total, and ADA-Bound Proteins 21315.4 Sample Preparation Strategies to Overcome Interference from Antidrug Antibodies or Soluble Target 21415.5 Protein Digestion Strategies 21415.6. Conclusion 215 Acknowledgment 216 References 216
16 Characterization of Protein Therapeutics by Mass Spectrometry 221Wei Wu, Hangtian Song, Thomas Slaney, Richard Ludwig, Li Tao, and Tapan Das
16.1 Introduction 22116.2 Variants Associated with Cysteine/Disulfide Bonds in Protein Therapeutics 22116.2.1 Thiolation Isoforms 22216.2.2 Disulfide Isoforms 22216.2.3 Free Sulfhydryl 22416.2.4 Thioether/Trisulfide Bond 22416.2.5 Disulfide Bond in Antibody Drug Conjugates 22416.3 N–C-Terminal Variants 22516.4 Glycation 226
Contents xi
16.5 Oxidation 22616.5.1 Methionine Oxidation 22716.5.2 Metal-Catalyzed Oxidation (MCO) 22716.5.3 Photooxidation 22716.5.4 Deamidation 22816.5.5 Effect of Sequence and Structure on Deamidation 22816.6 Discoloration 22816.7 Sequence Variants 23016.8 Glycosylation 23216.8.1 Glycoprotein Structure 23216.8.2 Intact Glycoprotein Analysis 23516.8.3 Glycopeptide Analysis 23716.8.4 Tandem MS of Glycopeptides 23716.8.5 Free Glycan Analysis 23816.8.6 Release of Glycans from Glycoproteins 23816.8.7 Detailed Sequence and Linkage Analysis of Glycans 23916.9 Conclusion 240 References 240
Index 251

Chapter No.: 1 Title Name: <TITLENAME> ftoc.inddComp. by: <USER> Date: 22 May 2017 Time: 06:50:08 PM S t a g e : < S T A G E > WorkFlow:<WORKFLOW> Page Number: xii
Chapter No.: 1 Title Name: <TITLENAME> fbetw01.inddComp. by: <USER> Date: 22 May 2017 Time: 06:50:12 PM Stage: <STAGE> WorkFlow:<WORKFLOW> Page Number: xiii
xiii
Bradley L. AckermannEli Lilly and CompanyIndianapolis, IN, USA
Laura BakerSCIEXFramingham, MA, USA
Patrick BennettPPD,Richmond, VA, USA
Michael J. BernaEli Lilly and CompanyIndianapolis, IN, USA
Jian ChenCelgeneSummit, NJ, USA
Adrienne Clements-EganJanssen Research & Development, LLCSpring House, PA, USA
Jonathan CrowtherOrtho Clinical DiagnosticsRaritan, NJ, USA
Tapan DasMolecular and Analytical DevelopmentBristol-Myers Squibb Company, USA
Michael T. FurlongPPD Bioanalytical Lab, Middleton, WI, USA
Brian GeistJanssen Research & Development, LLCSpring House, PA, USA
Xuejiang GuoPacific Northwest National LaboratoryRichland, WA, USA
and
Nanjing Medical UniversityNanjing, PR China
Zhiqi HaoThermo Fisher ScientificSan Jose, CA, USA
Timothy HeathAmgen Inc.Thousand Oaks, CA, USA
Qiuting HongEurofins Lancaster Laboratories, Inc.Lancaster, PA, USA
Christopher A. JamesAmgen Inc.Thousand Oaks, CA, USA
Qin C. JiAnalytical & Bioanalytical OperationsBristol-Myers SquibbPrinceton, NJ 08543, USA
Wenying JianJanssen Research and Development, Johnson & JohnsonSpring House, PA, USA
Hao JiangAnalytical and Bioanalytical Operations, Bristol-Myers Squibb Co.Princeton, NJ, USA
James I. LangridgeWaters CorporationWilmslow, UK
List of Contributors
List of Contributorsxiv
Hongyan LiAmgen Inc.Thousand Oaks, CA, USA
Richard LudwigMolecular and Analytical DevelopmentBristol-Myers Squibb Company, USA
Linlin LuoAnalytical and Bioanalytical Operations, Bristol-Myers Squibb Co.Princeton, NJ, USA
Stephen E. MaxwellCelgeneSummit, NJ, USA
Brian MeloCelgeneSummit, NJ, USA
Matthew V. MyersCelgeneSummit, NJ, USA
Shane R. NeedhamAlturas AnalyticsMoscow, ID, USA
Suma RamagiriSCIEXFramingham, MA, USA
Brigitte SimonsSCIEX,Framingham, MA, USA
Thomas SlaneyMolecular and Analytical DevelopmentBristol-Myers Squibb Company, USA
Hangtian SongMolecular and Analytical DevelopmentBristol-Myers Squibb Company, USA
Priya SriramanCelgeneSummit, NJ, USA
Sekhar SurapaneniCelgeneSummit, NJ, USA
Keqi TangPacific Northwest National LaboratoryRichland, WA, USA
Li TaoMolecular and Analytical DevelopmentBristol-Myers Squibb Company, USA
Gary A. ValaskovicNew Objective Inc.Woburn, MA, USA
Martha VallejoCelgeneSummit, NJ, USA
Johannes P.C. VissersWaters CorporationWilmslow, UK
Hongxia WangThermo Fisher ScientificSan Jose, CA, USA
Xiaomin WangCelgeneSummit, NJ, USA
Jiang WuShire PharmaceuticalsLexington, MA, USA
Shiaw-Lin WuBioAnalytix Inc.Cambridge, MA, USA
and
Northeastern UniversityBoston, MA, USA
Wei WuMolecular and Analytical DevelopmentBristol-Myers Squibb Company, USA
Y.-J. XueCelgeneSummit, NJ, USA
Long YuanAnalytical & Bioanalytical OperationsBristol-Myers SquibbPrinceton, NJ, USA

List of Contributors xv
Tong-Yuan YangJanssen Research & Development, LLCSpring House, PA, USA
Fan ZhangNortheastern UniversityBoston, MA, USA
Stanley (Weihua) ZhangOrtho Clinical DiagnosticsRaritan, NJ, USA
Jianing ZengAnalytical and Bioanalytical Operations, Bristol-Myers Squibb Co.Princeton, NJ, USA

Chapter No.: 1 Title Name: <TITLENAME> fbetw01.inddComp. by: <USER> Date: 22 May 2017 Time: 06:50:12 PM Stage: <STAGE> WorkFlow:<WORKFLOW> Page Number: xvi
Chapter No.: 1 Title Name: <TITLENAME> fbetw02.inddComp. by: <USER> Date: 22 May 2017 Time: 06:50:15 PM Stage: <STAGE> WorkFlow:<WORKFLOW> Page Number: xvii
xvii
This book explores recent advances in mass spectrome-try and related technology, and the innovative approaches used in measuring and characterizing peptides and pro-teins as part of bringing new medicines to patients in need. Qin and Mike have brought together a wide range of leading scientists to provide a clear picture of the vari-ety and depth of technology and techniques.
As you will see in each chapter, fundamental LC–MS knowledge has been used in each innovative advance. Sample preparation techniques for peptides and proteins rely on the core of historic approaches used for small molecule drug analyses but have been expanded to address a host of requirements related to protein struc-ture, including reduction and alkylations, acid dissocia-tion, protein digestion, and the specificity possible with immunocapture. Liquid chromatography techniques from regular to ultrahigh‐performance approaches and
downward to micro‐ and nanoflow are covered, as well as utilization of 2‐D chromatography. Triple quadrupole and high‐resolution mass spectrometers, with their recent advances in sensitivity and selectivity, are promi-nent in the discussions as their advances are central to making possible many advances in peptide and protein analyses.
I hope that the readers find this book to be an engaging learning experience; one that provides insights and causes a cascade to the discovery of further advances in peptide and protein analysis by liquid chromatography mass spectrometry.
Mark E. ArnoldBioanalytical Solution Integration LLC
[email protected]/in/markearnoldphd
Foreword

Chapter No.: 1 Title Name: <TITLENAME> fbetw02.inddComp. by: <USER> Date: 22 May 2017 Time: 06:50:15 PM Stage: <STAGE> WorkFlow:<WORKFLOW> Page Number: xviii
Chapter No.: 1 Title Name: <TITLENAME> fpref.inddComp. by: <USER> Date: 22 May 2017 Time: 06:50:18 PM Stage: <STAGE> WorkFlow:<WORKFLOW> Page Number: xix
xix
We had a discussion on LCMS analysis of proteins for drug development dating back to the early 2000s. At that time, Qin’s group at Abbott Laboratories had just pub-lished a manuscript in analytical chemistry for an LCMS bioanalytical method for a small protein (MW > 10 kDa). Through the years, multiple discussions on the topic continued at various conferences, including conversa-tions held at several Annual Land O’Lakes Bioanalytical Conferences where Mike was invited to give lectures. Although mass spectrometry protein analysis has been a popular topic in proteomic research for several decades, it was only in the late 2000s it started to receive increas-ing attention of scientists in drug development. In this book, we present 16 chapters from industry leaders who have first‐hand experience in developing new mass spec-trometry technologies, knowing the issues and needs of the analysis in drug discovery and development, forming assay strategies, and interpreting assay results with their respective project teams.
The authors of Chapters 1–4 have experience and expertise with mass spectrometry instrumentation as well as with analytical research and development. Johannes and James from Waters discussed extensively the history and theory of ion mobility mass spectrometry and its application in protein analysis. As they pointed out, “The next few years should see significant improve-ments in both the technology, and the informatics and workflows to use the information generated from ion mobility mass spectrometry for both qualitative and quantitative analyses.” In Chapters 2 and 3, Jessica, Zhiqi, and their colleagues discuss the characteristics and capa-bilities of high‐resolution mass spectrometry, especially, the Thermo Orbitrap mass spectrometry and its application in protein therapeutics bioanalysis and the characterization of posttranslational modifications in therapeutic proteins. In Chapter 4, Suma and her col-leagues from SCIEX discuss the workflow of quantitative analysis of proteins using mass spectrometry, especially the triple quadrupole time‐of‐flight mass spectrometry system. Although the benefit of using low flow liquid chromatography mass spectrometry has been well under-
stood theoretically and widely used in the proteomic research area, the application of this technology in quan-titative analysis of proteins in biological matrix is still not widely accepted. In Chapter 5, Shane and Gary describe the success and routine usage of New Objective’s inte-grated nanoflow LC column and nanoelectrospray emit-ter system for the bioanalysis of proteins in biological matrices with excellent assay ruggedness and high assay throughputs. Jiang at Shire is one of the industry leaders in drug discovery mass spectrometry. Jiang comments that understanding relative expression and structure–function relationship of the splice isoforms are essential for the discovery and development of more specific ther-apeutics and biomarkers. In Chapter 6, Jiang describes the advanced mass spectrometry characterization of gene splice variants in conjunction with high‐throughput tran-scriptomics as an example of protein mass spectrometry analysis in proteomic research for supporting drug dis-covery. Bradley and Michael from Lilly are among the pioneers in mass spectrometry biomarker analysis. In Chapter 7, they provide a comprehensive review of the immunoaffinity mass spectrometry technology and its application in protein biomarkers and biotherapeutics characterization. Immunogenicity refers to immune responses of humans or animals to antigens, such as bio-therapeutics. The technologies, methodology, and regu-latory requirements for the immunogenicity test evolved rapidly in recent years. In Chapter 8, Jianing and her cow-orkers at BMS describe recent advances in using immu-nocapture LCMS for immunogenicity assessment from “semiquantitative analysis of antidrug antibody” to “assisting the method development of cell‐based neutral-izing antibody assays.” Keqi is well known in the mass spectrometry field for his design of mass spectrometry ionization sources and ion optics for high ion transfer efficiency. In Chapter 9, Xuejiang Guo and Keqi from PNNL discuss recent advances in methodology and mass spectrometry instrumentation for the sensitive and high‐throughput mass spectrometry biomarker analysis. In Chapter 10, Tong‐Yuan and his coworkers at JNJ describe the mass spectrometry ligand binding assay reagent
Preface

Prefacexx
characterization, which is one of the fast growing areas in the bioanalytical scientific field and has shown significant impacts on improving ligand binding bioanalytical assays. In Chapter 11, Stanley and his coworkers at JNJ describe the recent advances in using high‐resolution mass spec-trometry in improving selectivity for the mass spectrom-etry bioanalysis of proteins in biological matrices. In Chapter 12, Hongyan and his coworkers at Amgen dis-cuss the advantages and their assay development strategy of LCMS quantitative analysis of therapeutic monoclonal antibodies (mAbs) in biological matrices in supporting preclinical studies. In Chapter 13, Michael at PPD dis-cusses generic peptide strategies (he is one of the pio-neers who developed this approach) for LC–MS bioanalysis of human monoclonal antibody drugs and drug candidates. The advantages of this strategy include significant cost saving and accelerated progress for drug discovery and early drug development. In Chapter 14, Y‐J and his coworkers at Celgene describe comprehensively the strategy and methodology of mass spectrometry support of antidrug conjugate (ADC) drug development, one of the most active areas recently in drug develop-ment. In Chapter 15, Long and Qin at BMS provide a
survey of the sample preparation strategies for LCMS protein bioanalysis, which range from traditional organic solvent protein precipitation, solid‐phase extraction to more advanced chemical derivatization, and immuno-capture sample preparation. In Chapter 16, Wei and his coworkers at BMS describe the mass spectrometry char-acterizations of protein therapeutics in drug manufactur-ing process to ensure the quality and integrity of dug product ingredients.
We would like to take this opportunity to thank all the authors for their diligent work in describing the advances in the protein mass spectrometry analysis in supporting from early‐stage basic researches to delivering the safe, efficacious drug to patient bedside. We also would like to thank Wiley for the opportunity to bring this book to our readers, which will further stimulate the advances of mass spectrometry technology and methodology to ben-efit patients’ lives.
Mike S. Lee and Qin C. JiDecember 2016
Princeton, NJ
Protein Analysis using Mass Spectrometry: Accelerating Protein Biotherapeutics from Lab to Patient, First Edition. Edited by Mike S. Lee and Qin C. Ji.© 2017 John Wiley & Sons Inc. Published 2017 by John Wiley & Sons Inc.
Chapter No.: 1 Title Name: <TITLENAME> c01.inddComp. by: <USER> Date: 22 May 2017 Time: 06:50:31 PM Stage: <STAGE> WorkFlow:<WORKFLOW> Page Number: 1
1
1.1 Introduction
The use of ion mobility as an analytical technique to detect and separate biomolecules dates back to the break of the century with the application of the method for proteomics (Valentine et al. 2006; McLean et al. 2005; Gabryelski and Froese 2003), glycomics (Taraszka et al. 2001; Jin et al. 2005; Hoaglund et al. 1997), and metabolomics (Dwivedi et al. 2008). It is a technique that separates gas-phase ions based upon their mobility in a buffer gas. This separation is related to ion size, shape, as well as m/z, and charge. The basis for separation by traditional drift tube ion mobility at a low electric limit can be derived from the Mason–Schamp equation:
Kk T
zeN
=
316
21 2
πµ B
/
Ω
where K = drift velocity vd/electric field strength E, μ = reduced mass of the ion (neutral given by (mneutralmion)/(mneutral + mion), kB = Boltzmann constant, T = temperature, z = charge state of the analyte ion, e = charge on an electron, N = number density of the drift gas, and Ω = average collision cross section. The hyphen-ation of ion mobility spectrometry (IMS) with MS is often referred to as ion mobility–mass spectrometry (IM–MS). The most common mass analyzer coupled with IMS comprises a time-of-flight (TOF) instrument due to the inherent high sampling rate, although other mass detection systems have been described (Kanu et al. 2008). Four different methods of ion mobility separation are currently used in combination with MS, including drift-time ion mobility spectrometry (DTIMS), aspira-tion ion mobility spectrometry (AIMS), differential mobility spectrometry (DMS), also called field-asym-metric waveform ion mobility spectrometry (FAIMS), and traveling-wave ion mobility spectrometry (TWIMS). A description of these methods is beyond the scope of
this chapter, particularly since they have been reviewed in great detail elsewhere (Kanu et al. 2008; Lanucara et al. 2014).
The innovative demonstration of protein conformer separation by means of IMS by Clemmer et al. 1995 has prompted instrumental IM–MS designs and the broader application of IMS as an analytical tool. The designs by Pringle et al. 2007 and Baker et al. 2007, both orthogonal acceleration time-of-flight (oa-TOF) based IM–MS plat-form, but utilizing different IMS geometries, have been commercialized and applied for numerous applications and include drug metabolism/metabolites (Dear et al. 2010), lipids (Kliman et al. 2011), trace impurities (Eckers et al. 2007), carbohydrates (Vakhrushev et al. 2008, Schenauer et al. 2009), macromolecular protein species and viruses (Ruotolo et al. 2005, Bereszczak et al. 2014), metal-based anticancer drugs (Williams et al. 2009), and PEGylated conjugates (Bagal et al. 2008). In this chapter, the application of IMS for the identification, quantifica-tion, and characterization of proteins is illustrated by application examples that demonstrate the benefits of integrating IMS into the analytical schema in terms of increased resolution and sensitivity, as well as those obtained from collision cross section measurements.
1.2 Traveling-Wave Ion Mobility Mass Spectrometry
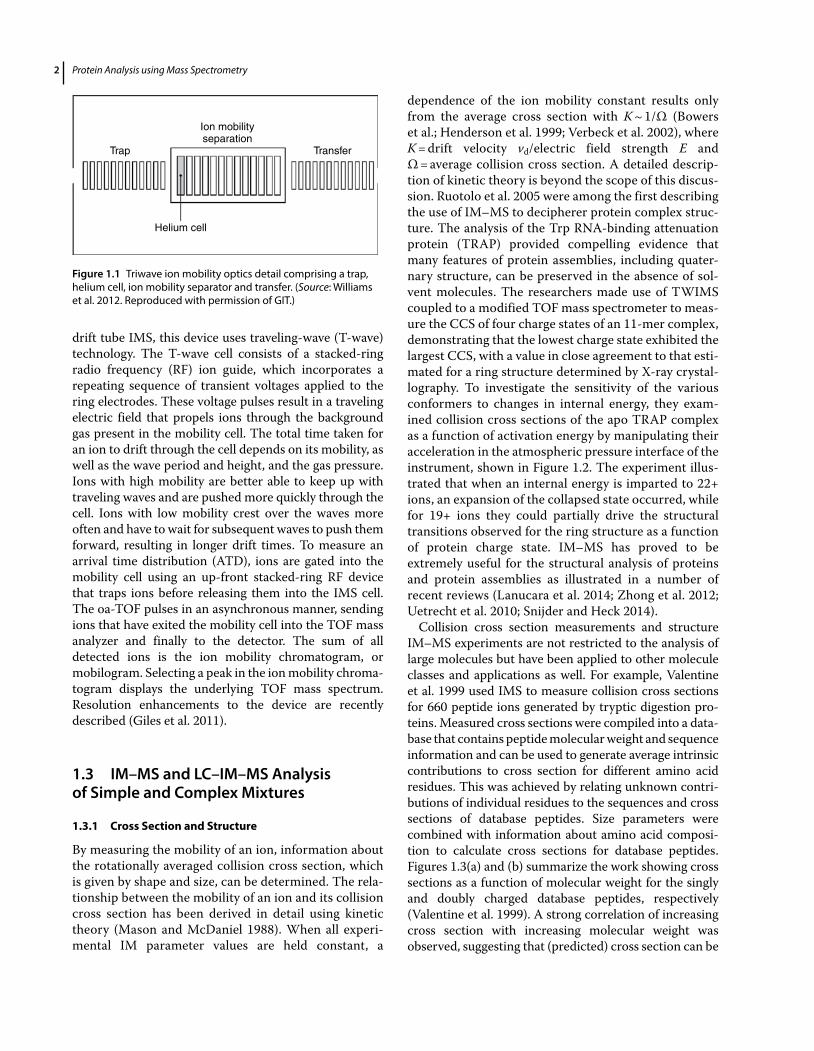
The principle of TWIMS is briefly discussed as it forms the basis of subsequent sections. A schematic of the device is shown in Figure 1.1. Details can be found in the papers of Pringle et al. 2007 and Giles et al. 2004. Ions are formed by electrospray ionization (ESI) in the source and subsequently pass through a quadrupole for mass selection before injection into the ion mobility cell. Unlike our other instruments, which use a uniform electric field across the cell for ion mobility experiments, so-called
1
Contemporary Protein Analysis by Ion Mobility Mass SpectrometryJohannes P.C. Vissers and James I. Langridge
Waters Corporation, Wilmslow, UK
Protein Analysis using Mass Spectrometry2
drift tube IMS, this device uses traveling-wave (T-wave) technology. The T-wave cell consists of a stacked-ring radio frequency (RF) ion guide, which incorporates a repeating sequence of transient voltages applied to the ring electrodes. These voltage pulses result in a traveling electric field that propels ions through the background gas present in the mobility cell. The total time taken for an ion to drift through the cell depends on its mobility, as well as the wave period and height, and the gas pressure. Ions with high mobility are better able to keep up with traveling waves and are pushed more quickly through the cell. Ions with low mobility crest over the waves more often and have to wait for subsequent waves to push them forward, resulting in longer drift times. To measure an arrival time distribution (ATD), ions are gated into the mobility cell using an up-front stacked-ring RF device that traps ions before releasing them into the IMS cell. The oa-TOF pulses in an asynchronous manner, sending ions that have exited the mobility cell into the TOF mass analyzer and finally to the detector. The sum of all detected ions is the ion mobility chromatogram, or mobilogram. Selecting a peak in the ion mobility chroma-togram displays the underlying TOF mass spectrum. Resolution enhancements to the device are recently described (Giles et al. 2011).
1.3 IM–MS and LC–IM–MS Analysis of Simple and Complex Mixtures
1.3.1 Cross Section and Structure
By measuring the mobility of an ion, information about the rotationally averaged collision cross section, which is given by shape and size, can be determined. The rela-tionship between the mobility of an ion and its collision cross section has been derived in detail using kinetic theory (Mason and McDaniel 1988). When all experi-mental IM parameter values are held constant, a
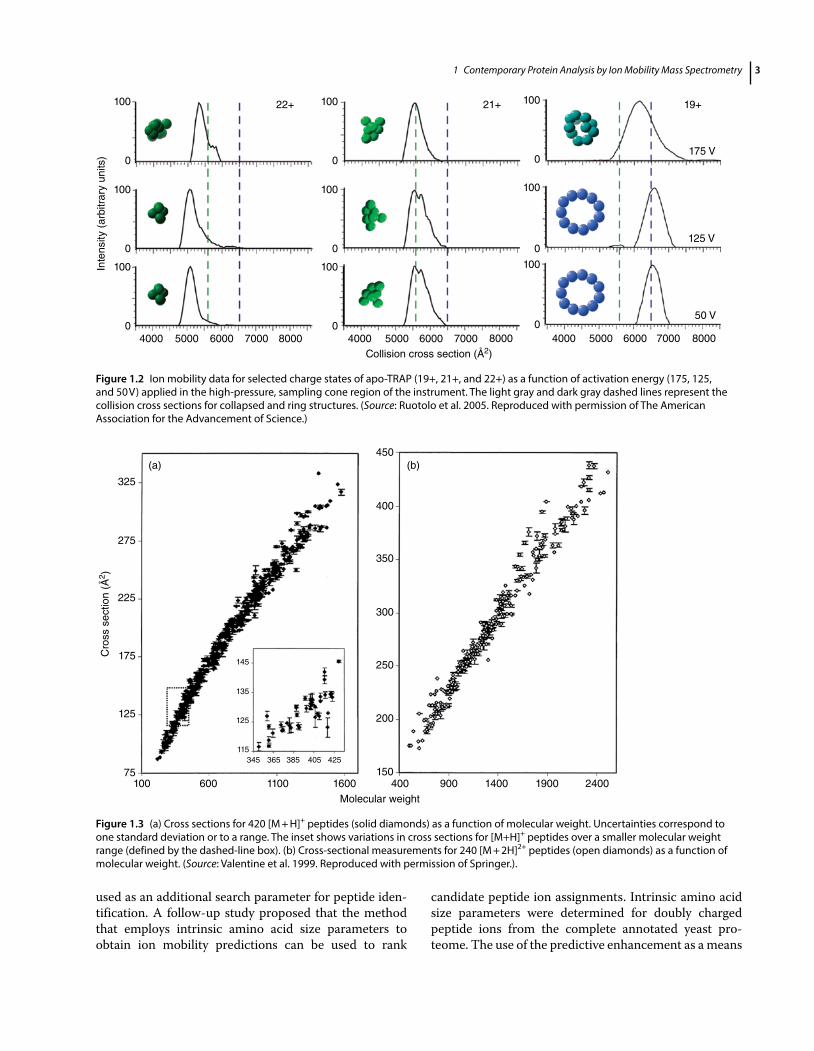
dependence of the ion mobility constant results only from the average cross section with K ~ 1/Ω (Bowers et al.; Henderson et al. 1999; Verbeck et al. 2002), where K = drift velocity vd/electric field strength E and Ω = average collision cross section. A detailed descrip-tion of kinetic theory is beyond the scope of this discus-sion. Ruotolo et al. 2005 were among the first describing the use of IM–MS to decipherer protein complex struc-ture. The analysis of the Trp RNA-binding attenuation protein (TRAP) provided compelling evidence that many features of protein assemblies, including quater-nary structure, can be preserved in the absence of sol-vent molecules. The researchers made use of TWIMS coupled to a modified TOF mass spectrometer to meas-ure the CCS of four charge states of an 11-mer complex, demonstrating that the lowest charge state exhibited the largest CCS, with a value in close agreement to that esti-mated for a ring structure determined by X-ray crystal-lography. To investigate the sensitivity of the various conformers to changes in internal energy, they exam-ined collision cross sections of the apo TRAP complex as a function of activation energy by manipulating their acceleration in the atmospheric pressure interface of the instrument, shown in Figure 1.2. The experiment illus-trated that when an internal energy is imparted to 22+ ions, an expansion of the collapsed state occurred, while for 19+ ions they could partially drive the structural transitions observed for the ring structure as a function of protein charge state. IM–MS has proved to be extremely useful for the structural analysis of proteins and protein assemblies as illustrated in a number of recent reviews (Lanucara et al. 2014; Zhong et al. 2012; Uetrecht et al. 2010; Snijder and Heck 2014).
Collision cross section measurements and structure IM–MS experiments are not restricted to the analysis of large molecules but have been applied to other molecule classes and applications as well. For example, Valentine et al. 1999 used IMS to measure collision cross sections for 660 peptide ions generated by tryptic digestion pro-teins. Measured cross sections were compiled into a data-base that contains peptide molecular weight and sequence information and can be used to generate average intrinsic contributions to cross section for different amino acid residues. This was achieved by relating unknown contri-butions of individual residues to the sequences and cross sections of database peptides. Size parameters were combined with information about amino acid composi-tion to calculate cross sections for database peptides. Figures 1.3(a) and (b) summarize the work showing cross sections as a function of molecular weight for the singly and doubly charged database peptides, respectively (Valentine et al. 1999). A strong correlation of increasing cross section with increasing molecular weight was observed, suggesting that (predicted) cross section can be
Helium cell
Trap Transfer
Ion mobilityseparation
Figure 1.1 Triwave ion mobility optics detail comprising a trap, helium cell, ion mobility separator and transfer. (Source: Williams et al. 2012. Reproduced with permission of GIT.)
1 Contemporary Protein Analysis by Ion Mobility Mass Spectrometry 3
used as an additional search parameter for peptide iden-tification. A follow-up study proposed that the method that employs intrinsic amino acid size parameters to obtain ion mobility predictions can be used to rank
candidate peptide ion assignments. Intrinsic amino acid size parameters were determined for doubly charged peptide ions from the complete annotated yeast pro-teome. The use of the predictive enhancement as a means
100 22+ 21+ 19+
175 V
125 V
50 V
0
100
Inte
nsity
(ar
bitr
ary
units
)
0
100
04000 5000 6000 7000 8000 4000 5000 6000
Collision cross section (Å2)7000 8000 4000 5000 6000 7000 8000
100
0
100
0
100
0
100
0
100
0
100
0
Figure 1.2 Ion mobility data for selected charge states of apo-TRAP (19+, 21+, and 22+) as a function of activation energy (175, 125, and 50 V) applied in the high-pressure, sampling cone region of the instrument. The light gray and dark gray dashed lines represent the collision cross sections for collapsed and ring structures. (Source: Ruotolo et al. 2005. Reproduced with permission of The American Association for the Advancement of Science.)
325
275
(a) (b)
225
Cro
ss s
ectio
n (Å
2 )
175
125
75100 600 1100
145
135
125
115345 365 385 405 425
1600Molecular weight
400
450
400
350
300
250
200
150900 1400 1900 2400
Figure 1.3 (a) Cross sections for 420 [M + H]+ peptides (solid diamonds) as a function of molecular weight. Uncertainties correspond to one standard deviation or to a range. The inset shows variations in cross sections for [M+H]+ peptides over a smaller molecular weight range (defined by the dashed-line box). (b) Cross-sectional measurements for 240 [M + 2H]2+ peptides (open diamonds) as a function of molecular weight. (Source: Valentine et al. 1999. Reproduced with permission of Springer.).
Protein Analysis using Mass Spectrometry4
to aid peptide ion identification was discussed and a simple peptide ion scoring scheme presented.
1.3.2 Separation
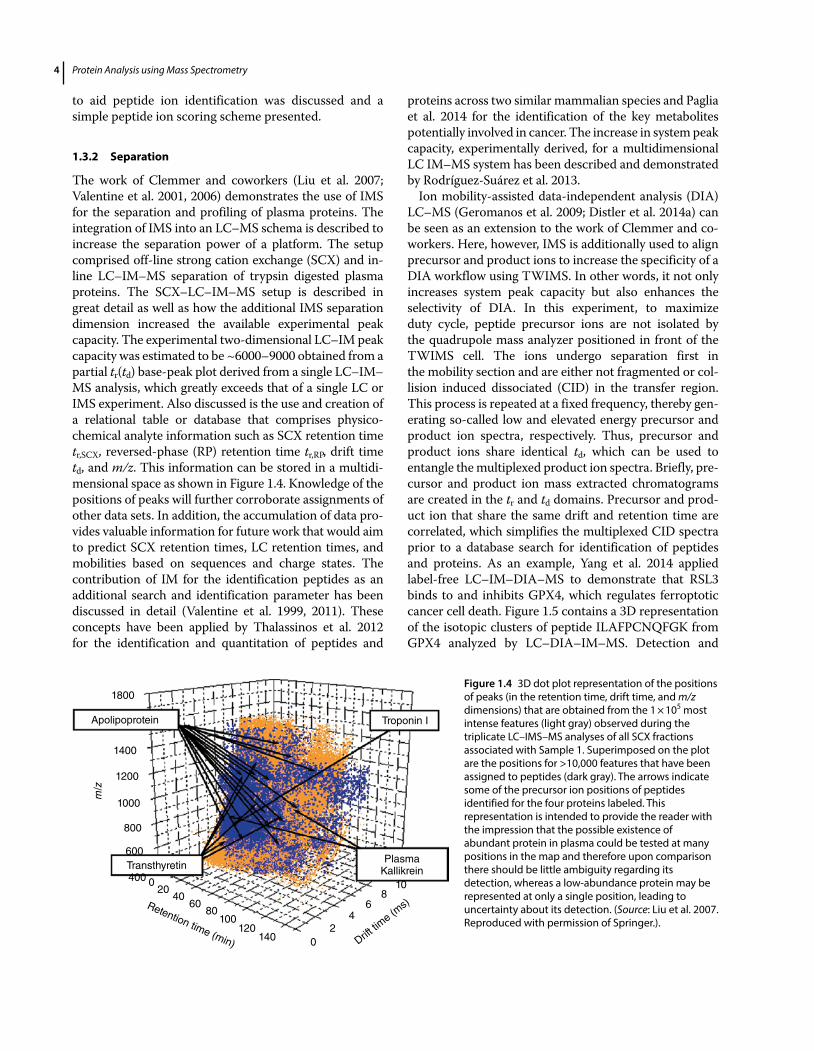
The work of Clemmer and coworkers (Liu et al. 2007; Valentine et al. 2001, 2006) demonstrates the use of IMS for the separation and profiling of plasma proteins. The integration of IMS into an LC–MS schema is described to increase the separation power of a platform. The setup comprised off-line strong cation exchange (SCX) and in-line LC–IM–MS separation of trypsin digested plasma proteins. The SCX–LC–IM–MS setup is described in great detail as well as how the additional IMS separation dimension increased the available experimental peak capacity. The experimental two-dimensional LC–IM peak capacity was estimated to be ~6000–9000 obtained from a partial tr(td) base-peak plot derived from a single LC–IM–MS analysis, which greatly exceeds that of a single LC or IMS experiment. Also discussed is the use and creation of a relational table or database that comprises physico-chemical analyte information such as SCX retention time tr,SCX, reversed-phase (RP) retention time tr,RP, drift time td, and m/z. This information can be stored in a multidi-mensional space as shown in Figure 1.4. Knowledge of the positions of peaks will further corroborate assignments of other data sets. In addition, the accumulation of data pro-vides valuable information for future work that would aim to predict SCX retention times, LC retention times, and mobilities based on sequences and charge states. The contribution of IM for the identification peptides as an additional search and identification parameter has been discussed in detail (Valentine et al. 1999, 2011). These concepts have been applied by Thalassinos et al. 2012 for the identification and quantitation of peptides and
proteins across two similar mammalian species and Paglia et al. 2014 for the identification of the key metabolites potentially involved in cancer. The increase in system peak capacity, experimentally derived, for a multidimensional LC IM–MS system has been described and demonstrated by Rodríguez-Suárez et al. 2013.
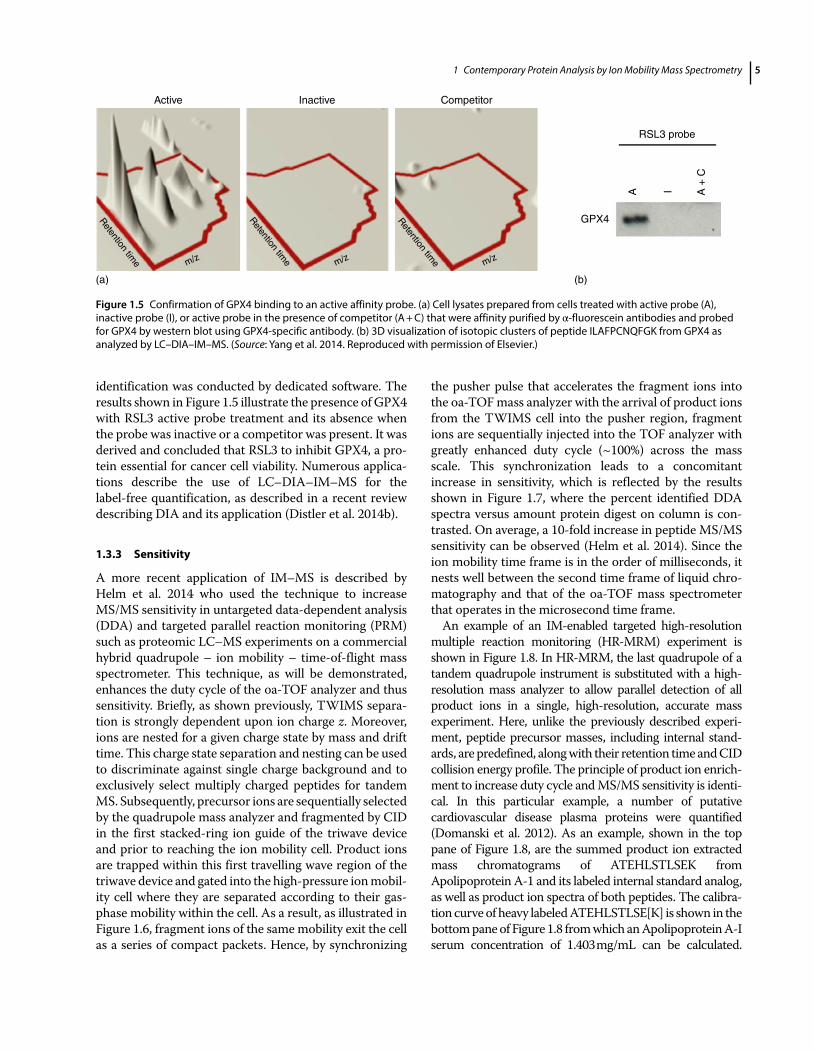
Ion mobility-assisted data-independent analysis (DIA) LC–MS (Geromanos et al. 2009; Distler et al. 2014a) can be seen as an extension to the work of Clemmer and co-workers. Here, however, IMS is additionally used to align precursor and product ions to increase the specificity of a DIA workflow using TWIMS. In other words, it not only increases system peak capacity but also enhances the selectivity of DIA. In this experiment, to maximize duty cycle, peptide precursor ions are not isolated by the quadrupole mass analyzer positioned in front of the TWIMS cell. The ions undergo separation first in the mobility section and are either not fragmented or col-lision induced dissociated (CID) in the transfer region. This process is repeated at a fixed frequency, thereby gen-erating so-called low and elevated energy precursor and product ion spectra, respectively. Thus, precursor and product ions share identical td, which can be used to entangle the multiplexed product ion spectra. Briefly, pre-cursor and product ion mass extracted chromatograms are created in the tr and td domains. Precursor and prod-uct ion that share the same drift and retention time are correlated, which simplifies the multiplexed CID spectra prior to a database search for identification of peptides and proteins. As an example, Yang et al. 2014 applied label-free LC–IM–DIA–MS to demonstrate that RSL3 binds to and inhibits GPX4, which regulates ferroptotic cancer cell death. Figure 1.5 contains a 3D representation of the isotopic clusters of peptide ILAFPCNQFGK from GPX4 analyzed by LC–DIA–IM–MS. Detection and
1800
1400
1200
m/z
1000
800
600
400 020
4060
80100
120140 0
24
68
10
Apolipoprotein
Transthyretin
Retention time (min) Drift tim
e (ms)
Troponin I
PlasmaKallikrein
Figure 1.4 3D dot plot representation of the positions of peaks (in the retention time, drift time, and m/z dimensions) that are obtained from the 1 × 10⁵ most intense features (light gray) observed during the triplicate LC–IMS–MS analyses of all SCX fractions associated with Sample 1. Superimposed on the plot are the positions for >10,000 features that have been assigned to peptides (dark gray). The arrows indicate some of the precursor ion positions of peptides identified for the four proteins labeled. This representation is intended to provide the reader with the impression that the possible existence of abundant protein in plasma could be tested at many positions in the map and therefore upon comparison there should be little ambiguity regarding its detection, whereas a low-abundance protein may be represented at only a single position, leading to uncertainty about its detection. (Source: Liu et al. 2007. Reproduced with permission of Springer.).
1 Contemporary Protein Analysis by Ion Mobility Mass Spectrometry 5
identification was conducted by dedicated software. The results shown in Figure 1.5 illustrate the presence of GPX4 with RSL3 active probe treatment and its absence when the probe was inactive or a competitor was present. It was derived and concluded that RSL3 to inhibit GPX4, a pro-tein essential for cancer cell viability. Numerous applica-tions describe the use of LC–DIA–IM–MS for the label-free quantification, as described in a recent review describing DIA and its application (Distler et al. 2014b).
1.3.3 Sensitivity
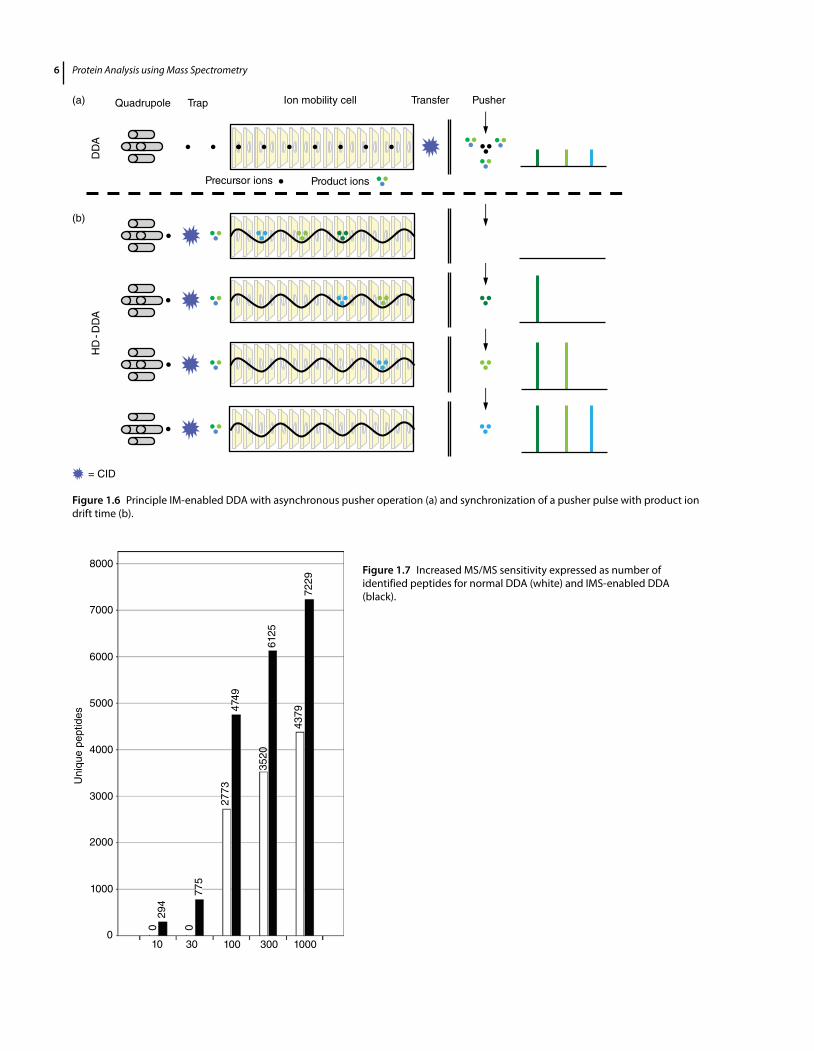
A more recent application of IM–MS is described by Helm et al. 2014 who used the technique to increase MS/MS sensitivity in untargeted data-dependent analysis (DDA) and targeted parallel reaction monitoring (PRM) such as proteomic LC–MS experiments on a commercial hybrid quadrupole – ion mobility – time-of-flight mass spectrometer. This technique, as will be demonstrated, enhances the duty cycle of the oa-TOF analyzer and thus sensitivity. Briefly, as shown previously, TWIMS separa-tion is strongly dependent upon ion charge z. Moreover, ions are nested for a given charge state by mass and drift time. This charge state separation and nesting can be used to discriminate against single charge background and to exclusively select multiply charged peptides for tandem MS. Subsequently, precursor ions are sequentially selected by the quadrupole mass analyzer and fragmented by CID in the first stacked-ring ion guide of the triwave device and prior to reaching the ion mobility cell. Product ions are trapped within this first travelling wave region of the triwave device and gated into the high-pressure ion mobil-ity cell where they are separated according to their gas-phase mobility within the cell. As a result, as illustrated in Figure 1.6, fragment ions of the same mobility exit the cell as a series of compact packets. Hence, by synchronizing
the pusher pulse that accelerates the fragment ions into the oa-TOF mass analyzer with the arrival of product ions from the TWIMS cell into the pusher region, fragment ions are sequentially injected into the TOF analyzer with greatly enhanced duty cycle (~100%) across the mass scale. This synchronization leads to a concomitant increase in sensitivity, which is reflected by the results shown in Figure 1.7, where the percent identified DDA spectra versus amount protein digest on column is con-trasted. On average, a 10-fold increase in peptide MS/MS sensitivity can be observed (Helm et al. 2014). Since the ion mobility time frame is in the order of milliseconds, it nests well between the second time frame of liquid chro-matography and that of the oa-TOF mass spectrometer that operates in the microsecond time frame.
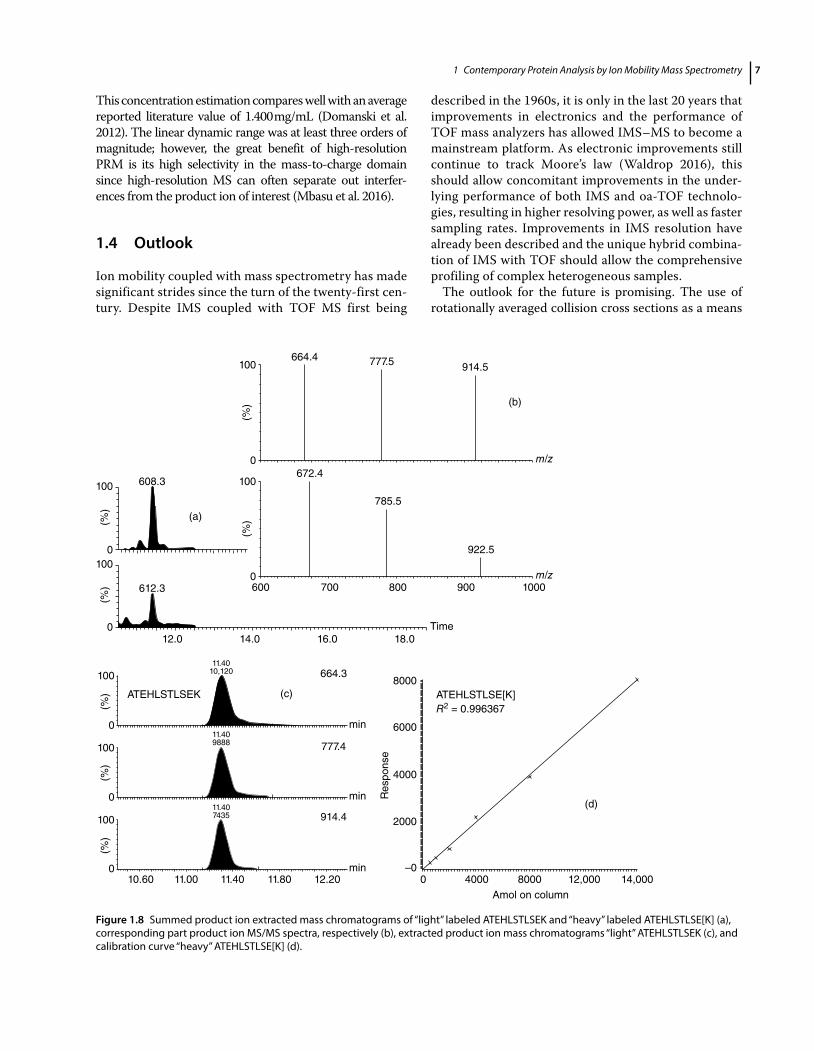
An example of an IM-enabled targeted high-resolution multiple reaction monitoring (HR-MRM) experiment is shown in Figure 1.8. In HR-MRM, the last quadrupole of a tandem quadrupole instrument is substituted with a high-resolution mass analyzer to allow parallel detection of all product ions in a single, high-resolution, accurate mass experiment. Here, unlike the previously described experi-ment, peptide precursor masses, including internal stand-ards, are predefined, along with their retention time and CID collision energy profile. The principle of product ion enrich-ment to increase duty cycle and MS/MS sensitivity is identi-cal. In this particular example, a number of putative cardiovascular disease plasma proteins were quantified (Domanski et al. 2012). As an example, shown in the top pane of Figure 1.8, are the summed product ion extracted mass chromatograms of ATEHLSTLSEK from Apolipoprotein A-1 and its labeled internal standard analog, as well as product ion spectra of both peptides. The calibra-tion curve of heavy labeled ATEHLSTLSE[K] is shown in the bottom pane of Figure 1.8 from which an Apolipoprotein A-I serum concentration of 1.403 mg/mL can be calculated.
Active
(a) (b)
Inactive Competitor
GPX4Retention time
Retention timem/z m/z m/z
Retention time
RSL3 probe
A I A +
C
Figure 1.5 Confirmation of GPX4 binding to an active affinity probe. (a) Cell lysates prepared from cells treated with active probe (A), inactive probe (I), or active probe in the presence of competitor (A + C) that were affinity purified by α-fluorescein antibodies and probed for GPX4 by western blot using GPX4-specific antibody. (b) 3D visualization of isotopic clusters of peptide ILAFPCNQFGK from GPX4 as analyzed by LC–DIA–IM–MS. (Source: Yang et al. 2014. Reproduced with permission of Elsevier.)
Protein Analysis using Mass Spectrometry6
8000
7000
6000
5000
4000
3000
2000
1000
010
029
4
077
5
2773
4749
Uni
que
pept
ides
3520
4379
6125
7229
30 100 300 1000
Figure 1.7 Increased MS/MS sensitivity expressed as number of identified peptides for normal DDA (white) and IMS-enabled DDA (black).
Quadrupole(a)
(b)
Trap Ion mobility cell Transfer Pusher
Precursor ions Product ions
DD
A
HD
-DD
A
= CID
Figure 1.6 Principle IM-enabled DDA with asynchronous pusher operation (a) and synchronization of a pusher pulse with product ion drift time (b).
1 Contemporary Protein Analysis by Ion Mobility Mass Spectrometry 7
This concentration estimation compares well with an average reported literature value of 1.400 mg/mL (Domanski et al. 2012). The linear dynamic range was at least three orders of magnitude; however, the great benefit of high-resolution PRM is its high selectivity in the mass-to-charge domain since high-resolution MS can often separate out interfer-ences from the product ion of interest (Mbasu et al. 2016).
1.4 Outlook
Ion mobility coupled with mass spectrometry has made significant strides since the turn of the twenty-first cen-tury. Despite IMS coupled with TOF MS first being
described in the 1960s, it is only in the last 20 years that improvements in electronics and the performance of TOF mass analyzers has allowed IMS–MS to become a mainstream platform. As electronic improvements still continue to track Moore’s law (Waldrop 2016), this should allow concomitant improvements in the under-lying performance of both IMS and oa-TOF technolo-gies, resulting in higher resolving power, as well as faster sampling rates. Improvements in IMS resolution have already been described and the unique hybrid combina-tion of IMS with TOF should allow the comprehensive profiling of complex heterogeneous samples.
The outlook for the future is promising. The use of rotationally averaged collision cross sections as a means
100
0
664.4
672.4
600 700 800 900 1000
785.5
922.5
100
(a)
608.3
612.3
12.0
ATEHLSTLSEK
664.3
777.4
914.4
(c)
(d)
11.4010,120
11.409888
11.407435
100
100
100
0
0
010.60 11.00 11.40 11.80 12.20
(%)
(%)
(%)
14.0 16.0 18.0
8000
6000
4000
2000
–00 4000 8000
Amol on column
ATEHLSTLSE[K]R2 = 0.996367
Res
pons
e
12,000 14,000
Time
min
min
min
100
1000
0
(%)
(%)
0
777.5 914.5
m/z
m/z
(b)
(%)
(%)
Figure 1.8 Summed product ion extracted mass chromatograms of “light” labeled ATEHLSTLSEK and “heavy” labeled ATEHLSTLSE[K] (a), corresponding part product ion MS/MS spectra, respectively (b), extracted product ion mass chromatograms “light” ATEHLSTLSEK (c), and calibration curve “heavy” ATEHLSTLSE[K] (d).