chapter © jsnyderdesign / istockphoto 6 performance evaluation variance analysis
TRANSCRIPT

CHAPTER
© jsnyderdesign / iS
tockphoto
6PERFORMANCE EVALUATION
VARIANCE ANALYSIS

6
THE BUDGET PLAN FOR 4TH QUARTER
► Sell in 4th quarter:• 70,000 pants• 25,000 jerseys• 9,000 award jackets
► Control inventory► Manage cash

6
WHAT’S UP?
► C&C sold more award jackets than budgeted. Managers thought that would be a good thing.
► Turns out, workers took too long to make the extra jackets. And they were paid overtime to meet customer delivery dates.
► Net income was $144,800 lower than budgeted, even though more jackets were sold.

FLEXIBLE BUDGETSA PERFORMANCE EVALUATION TOOL
Unit 6.1
61.Unit 6.2 Unit 6.3
© Tom
wang112 / iS
tockphoto
Unit 6.4

6
TOTAL VARIANCE
Actual results achieved
Budgeted (expected) results
Variance
A variance is any difference between what you expected and what you achieved.

6
Actual StaticBudget
Variance
Sales $2,457,525 $2,335,000 $122,525 F
Cost of goods sold 1,724,150 1,582,757 141,393 U
Gross margin 733,375 752,243 (18,868) U
Selling and administrative expenses 385,139 360,753 24,386 U
Operating income 348,236 391,490 (43,254) U
Financing costs 2,256 1,880
376 U
Income before taxes 345,980 389,610 (43,630) U
Income taxes 103,794 116,883 (13,089) F
Net income $242,186 $272,727 ($30,541) U
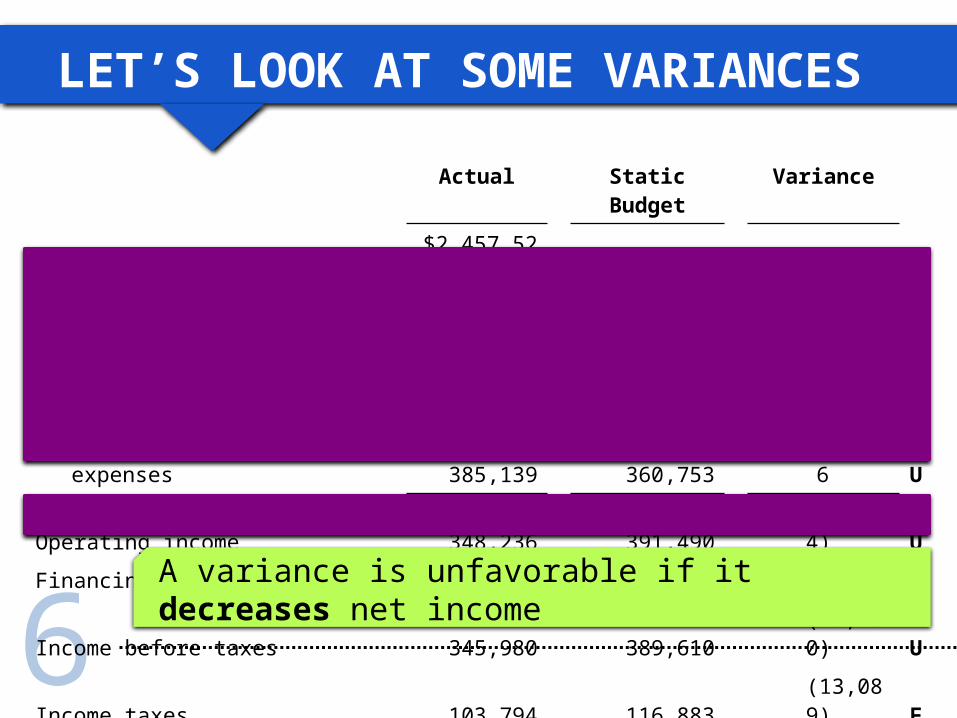
LET’S LOOK AT SOME VARIANCES
A variance is favorable if it increases net income
6
Actual StaticBudget
Variance
Sales $2,457,525 $2,335,000 $122,525 F
Cost of goods sold 1,724,150 1,582,757 141,393 U
Gross margin 733,375 752,243 (18,868) U
Selling and administrative expenses 385,139 360,753 24,386 U
Operating income 348,236 391,490 (43,254) U
Financing costs 2,256 1,880 376 U
Income before taxes 345,980 389,610 (43,630) U
Income taxes 103,794 116,883 (13,089) F
Net income $242,186 $272,727 ($30,541) U
LET’S LOOK AT SOME VARIANCES
A variance is unfavorable if it decreases net income

6
YOUR PERFORMANCE REPORT
The month has just ended, and your department has been very productive. You were able to crank out 38,000 units! That’s 3,000 more than were budgeted for the month. You figure this must be good for a bonus, so let’s see how well you did.

6
YOUR PERFORMANCE REPORTActual Results Static Budget Variances
Units produced 38,000 35,000 3,000
Variable expenses
Direct labor $86,500 $80,500 $6,000 U
Direct materials 26,000 21,000 5,000 U
Power 15,700 14,000 1,700 U
Maintenance 44,900 42,000 2,900 U
Fixed expenses
Depreciation 80,000 80,000 ---
Maintenance 92,400 92,000 400 U
Supervision 38,000 38,000 ---
Total expenses $383,500 $367,500 $16,000 U
These variances are unfavorable because actual expenses were greater than what was budgeted, thus lowering net income.
Do these unfavorable variances mean that you have done a poor job controlling costs?

6
THE QUESTION…
Think about it.
By definition, the total variable costs would be higher. Working more machine hours
should result in higher costs. But some of the higher costs could be a result of poor
management as well.
How can we tell the difference?

6
THE ANSWER…
We have to…
the budget to match the actual activity level achieved.

6
FLEXIBLE BUDGETS
► Present a budget for any level of activity actually achieved.• Variable expenses change with activity level.• Fixed expenses remain constant regardless of
activity level, as long as you remain within the relevant range.

6
LET’S PRACTICE: FIX THE FLEXActual Results Static Budget Variances
Units produced 38,000 35,000 3,000
Variable expenses
Direct labor $86,500 $80,500 $6,000 U
Direct materials 26,000 21,000 5,000 U
Power 15,700 14,000 1,700 U
Maintenance 44,900 42,000 2,900 U
Fixed expenses
Depreciation 80,000 80,000 ---
Maintenance 92,400 92,000 400 U
Supervision 38,000 38,000 ---
Total expenses $383,500 $367,500 $16,000 U

6
COMPONENTS OF THE STATIC BUDGET VARIANCE

6
LET’S LOOK AT EXHIBIT 6-4

6
SOME GENERAL POINTS…
► Always identify a variance as “favorable” (F) or “unfavorable” (U)
► A favorable variance is not necessarily a good thing, just as an unfavorable variance is not necessarily a bad thing
► Variance analysis provides an opportunity to benchmark against established standards to control operations

VARIANCE ANALYSISDIRECT MATERIALS
Unit 6.1
62.Unit 6.2 Unit 6.3
© Tom
wang112 / iS
tockphoto
Unit 6.4

6
ANALYZING THE FLEXIBLE BUDGET VARIANCE

6
PRICE VARIANCE CALCULATION
AQ × AP SP × SQ
Flexible Budget Variance
AQ × SP
or
AQ (AP - SP)
Price Variance
Actual Results Flexible Budget
This measures the difference between the actual price of inputs and the standard price of inputs

6
QUANTITY VARIANCE CALCULATION
or
SP (AQ - SQ)
AQ × AP SP × SQ
Flexible Budget Variance
AQ × SP
Price Variance
Actual Results Flexible Budget
Quantity Variance
This measures the difference between the actual quantity of inputs used and the standard quantity of inputs that should have been used

6
DIRECT MATERIALS VARIANCES

6
C&C’S DIRECT MATERIAL VARIANCES

6
INTERPRETING DM PRICE VARIANCES
Purchased in bulk and received quantity discount
Purchased lower-quality goods at a cheaper price
Received discount from supplier to get business
Suppliers decreased price
Purchased smaller-than-normal quantity and lost quantity discounts
Purchased higher-quality goods at a higher price
Suppliers increased price
Placed rush order with overnight delivery
FAVORABLE VARIANCE UNFAVORABLE VARIANCE

6
INTERPRETING DM QUANTITY VARIANCES
Use of higher-quality goods resulted in reduced waste
Highly-skilled workers generated a lower scrap rate
Use of lower-quality goods resulted in increased waste
Low-skilled worked generated a higher scrap rate
Machine problems ruined some units
Poor supervision allowed extra scrap and waste
Employee theft
FAVORABLE VARIANCE UNFAVORABLE VARIANCE

6
THINGS TO CONSIDER ON MATERIAL VARIANCES
► Price variance should be calculated at time of purchase, quantity variance at time of use
► Price and quantity variances may stem from the same cause

VARIANCE ANALYSISDIRECT LABOR
Unit 6.1
63.Unit 6.2 Unit 6.3
© Tom
wang112 / iS
tockphoto
Unit 6.4
6
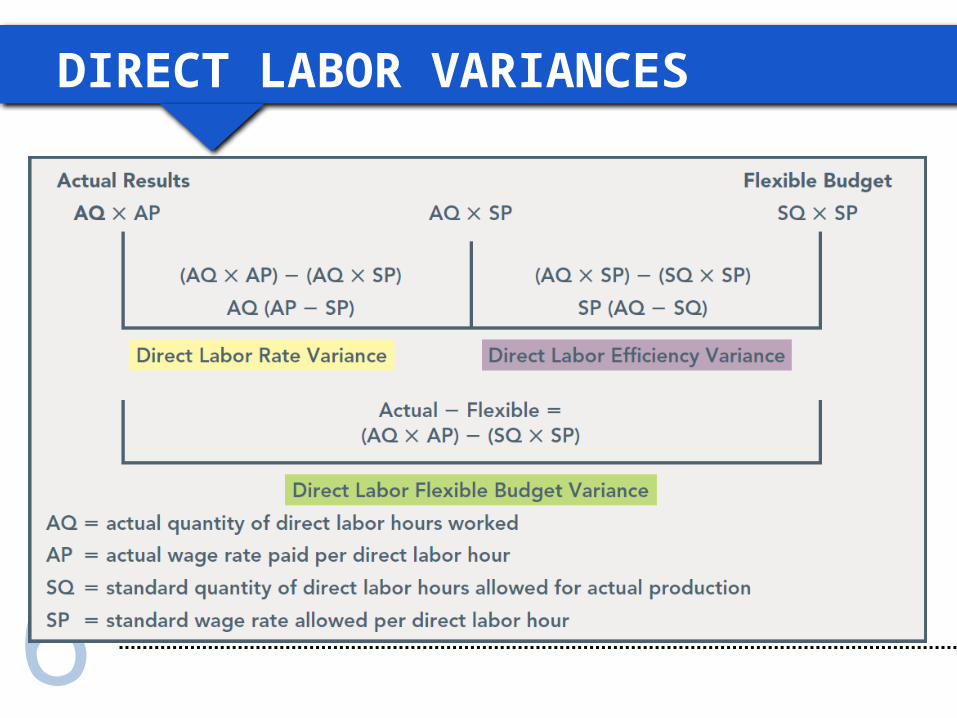
DIRECT LABOR VARIANCES

6
C&C’s DIRECT LABOR VARIANCES

6
INTERPRETING DL RATE VARIANCES
Used less skilled (lower paid) workers
Market wage rates decreased
Used higher skilled (higher paid) workers
Employees worked overtime and received overtime pay
Market wage rates increased
FAVORABLE VARIANCE UNFAVORABLE VARIANCE

6
INTERPRETING DL EFFICIENCY VARIANCES
Used more highly skilled (higher paid) workers than allowed in the standard
Used higher quality materials that needed less handling
New employees were still learning their jobs
Overtime caused fatigue and reduced workers’ efficiency
Low quality materials required longer production time
Poor supervision resulted in employees “goofing off”
Excessive machine downtime
FAVORABLE VARIANCE UNFAVORABLE VARIANCE

VARIANCE ANALYSISMANUFACTURING OVERHEAD
Unit 6.1
64.Unit 6.2 Unit 6.3 Unit 6.4
© Tom
wang112 / iS
tockphoto

6
VARIABLE OVERHEAD VARIANCES
► Variable overhead variances are calculated just like labor variances• Variable overhead spending variance• Variable overhead efficiency variance

6
VARIABLE OVERHEAD VARIANCES

6
C&C’s VARIABLE OVERHEAD VARIANCES

6
INTERPRETING VOH SPENDING VARIANCES
Paid less than expected for variable overhead items
FAVORABLE VARIANCE

6
INTERPRETING VOH EFFICIENCY VARIANCES
Efficient use of activity base
Inefficient use of activity base
FAVORABLE VARIANCE UNFAVORABLE VARIANCE

6
FOH SPENDING VARIANCE
► Since fixed costs do not change with changes in volume, the flexible budget amount for FOH is the same as the static budget amount
► FOH spending variance is the difference between the actual amount spent and the budgeted amount.
Actual FOH – Budgeted FOH = FOH Spending Variance

6
THIS IS JUST THE BEGINNING…
► The calculation of the variances is the easy part► Unless you investigate the cause of the
variance, the whole process is useless► What variances should you investigate? All of
them?