chapter - iv progress of dairy industry in india and...
TRANSCRIPT

87
CHAPTER - IV
PROGRESS OF DAIRY INDUSTRY IN
INDIA AND TAMILNADU
4.0 Introduction
The objective of the present piece of research is to examine
the problems and prospects in production and marketing of milk
in the district of Kanyakumari. Hence, before examining these
issues it becomes pertinent to understand the situation of the
dairy industry and factors influencing the overall performance of
milk sector at the macro level. The present chapter is directed
towards this end.
4.1 Features of Dairying in India
Dairying in India is exemplary of smallholder dairying as
practiced in much of Asia and Africa—with some wrinkles. Like
smallholder dairying in general, the Indian milk production
sector is characterized by a very large number of very small
herds. Milk from small herds is collected immediately after each
milking at centralized cooling facilities to maintain a cold chain.
Also typical of smallholder dairying, a majority of the milk
produced (more than 80 percent) is distributed as drinking milk
or home-based manufactured products through an informal
marketing system. [Ahluwalia, Montek S. (2005)]1

88
The unique aspects of smallholder dairying in India
include: [Banerjee (1994)]2
� Production of milk from buffalo exceeds cow milk
production. Buffalo yield less milk than crossbred cows,
but are well-adapted to the extreme heat and humidity of
India. Moreover, many Indians prefer buffalo milk over cow
milk because of its higher butterfat content.
� Cows are considered sacred in the Hindu religion that
predominates in India, and cow slaughter is rare. Some
buffalo are slaughtered, but the high incidence of
vegetarianism limits domestic markets for buffalo meat.
Consequently, cull dairy animals; represent a disposal cost
rather than a source of income to Indian dairy farmers.
� Feed for Indian dairy animals consists mainly of crop
residues and by products. Forage and feed grain
production is limited due to pricing incentives to grow
cereals and pulses to feed India's vast population.
� India has an extensive government-supported dairy
cooperative structure. Cooperatives not only market their
members' milk, but also supply feeds and many dairy
services. Private dairy companies tend to duplicate the
operating procedures of the cooperatives.

89
4.2 The Indian Milk Production Sector
4.2.1 General Characteristics
India surpassed the United States in 1998 to become the
largest single milk producing country in the world. In 2005,
Indian milk production represented 14.6 percent of world milk
production, exceeding the combined production of the top five
dairy countries in the EU.
Milk production has grown steadily and rapidly over the
last 25 years, from 50 million MT in 1979-80 to 92 million MT in
2004-05. Growth in milk production has exceeded the growth in
India's population, elevating per capita milk availability over the
same period from 75 grams/day to more than 225 grams/day.
The dairy production sector of India is atomistically (perhaps
micro-atomistically) structured. Milk production is primarily a
supplementary occupation for small landholders or landless
laborers. There are no official counts of dairy farms and
estimates vary widely among sources. Best estimates indicate
that approximately 70 million rural households (primarily small
and marginal farmers and landless laborers) are engaged in milk
production. The average herd size is about two milking animals,
and average daily milk production per herd is about four liters.
Cattle are fed primarily on byproducts from crop
production. Green forage occupies about 4 percent of India's

90
arable cropland. Concentrate feeds do not usually contain feed
grains, but could include starch from rice and wheat milling and
molasses from sugar production. Green forages include berseem
clover, oats, ryegrass and sorghum. Villages in some areas often
have unimproved common pasture lands.
Manure is a valuable resource for fuel and fertilizer. Much
of the manure from dairies is formed into dung pies and dried
for use or sale as a heating and cooking fuel. Manure that is not
used for fuel is applied directly to cropland, reducing chemical
fertilizer needs.
Dairying is practiced throughout India, but concentrated in
the northwestern states where the climate is more temperate.
The top five states account for more than one-half of current
production. Major surplus producing states (percent of milk
production more than twice the percentage of population) are
Punjab and Haryana. West Bengal and Bihar are major milk
deficit states.
More than one-half of India's milk production comes from
buffalo. The predominant buffalo breed is the Murrah, a river
type buffalo that has been selected for milk production. Buffalo
milk is preferred to cow milk by consumers in many parts of
India because of its relatively high butterfat content. The percent

91
of total milk coming from buffalo has remained practically
constant at about 55 percent since the early 1960s.
India's dairy cow population is a combination of
indigenous cattle and cross-breed (mostly Holsteins) with
indigenous stock. Purebred dairy cows do not tolerate the heat
and animal diseases prevalent in India. Cross breeding increases
milk production while preserving native heat tolerance and
disease resistance. Milk production capacity is highest in cross
breeds followed by buffalo and native cattle. The cow population
has been growing at a considerably smaller rate than buffalo.
But more rapid increases in yields from increasing adoption of
cross-breeding have resulted in the relative shares of cow and
buffalo milk remaining constant. [Chand R. (2005)]3
4.2.2 Milk Production Costs
On average, milk production costs in India are very low by
international standards. In its 2005 annual dairy report, the
International Farm Comparison Network (IFCN) reported 2004
costs and returns for eleven Indian dairies in four states. Cash
costs less non-milk returns, ranged from US$2.50 to US$15 per
100 kg (US$1.13 to US$6.80 per hundredweight). Total costs
ranged from US$15 to US$23 per 100 kg (US$6.80 to US$10.43
per hundredweight). All but one of the eleven representative

92
farms had herds of from two to six dairy animals (cows and/or
buffalo).
These are impressively low costs of production, compared to
U.S. total costs (less non-milk returns) in the neighborhood of
US$11.80 to US$13.60 per hundredweight. They result from
very low labor costs (paid labor and opportunity costs for family
and operator labor), feed costs, depreciation, and opportunity
cost for land. For example, labor costs for some of the smaller
representative farms were reported at US$0.20 per hour. Land
cost for some farms is zero. Indian dairy farmers' cash expenses
and overhead costs are low enough to more than offset the
negative effect on unit costs of production of very low milk yields
per animal.
But Indian costs of milk production must be interpreted
carefully. While they may accurately represent average costs
under existing conditions, they do not likely reflect marginal
costs, especially if ambitious expanded production goals are
achieved and economic conditions in rural areas improve. [FAO
(2002)]4
4.2.3 Milk Prices
Each cooperative and most private dairy firm set and
moves their milk price independently, based on the profitability
of final product sales, local competition, and other factors. There

93
is no systematic milk price reporting, probably because of wide
variability in prices among and within plants and the difficulty of
obtaining reliable price data from thousands of reporting units.
The Food and Agricultural Organization of the United
Nations (FAO) does report a country average time series of milk
prices by species. Prices for both cow and buffalo milks have
been gradually increasing with significant gains since 2002. The
gap between buffalo and cow milk prices has been steady in
percentage terms at about a 30 percent premium for buffalo
milk. India cow milk prices between 1991 and 2005 averaged 70
percent of U.S. milk prices; buffalo milk prices averaged 92
percent. Indian milk prices as reported by FAO were very stable
compared to U.S. prices.
4.3 Processing Sector
4.3.1 General Description
A primary characteristic of milk processing and dis-
tribution in India is the dominance of the informal sector. About
one-third of the milk produced is retained on the farm for food
and feed. Of the two-thirds leaving the farm, approximately 75
percent goes to the unorganized or informal sector and the
remaining 25 percent is handled by the formal sector.
The large informal sector exists partly because consumers
have been unwilling to pay the additional costs of pasteurization
94
and packaging, which can raise retail prices by more than 100
percent. Moreover, consumers often regard raw milk and
traditional products obtained from reliable vendors as of better
quality than formally processed dairy products.
In the informal sector, raw milk may be sold directly to the
consumer by the farmer or the farmer may sell it to a "milkman"
who re-sells to consumers or to a creamery. The creamery also
sells to consumers but may sell to sweet shops and restaurants.
The informal sector encompasses the marketing of raw milk and
traditional products such as locally manufactured ghee, fresh
cheese and sweets. This sector is quite well organized, with a
complex net of market agents. It may also not be entirely
informal, since some market agents pay municipal fees and
possess vendor licenses.
The formal sector is relatively new in historical terms, and
consists of western-style dairy processing based on
pasteurization, although adapted to the Indian market in terms
of products. The formal sector consisted of 678 dairy plants in
2002, registered under the Milk and Milk Products Order
(MMPO) and has grown rapidly during the last decade.
4.3.2 Milk Procurement and Processing
About 110,000 dairy cooperative village societies, involving
about 12 million farmer members, had been organized by 2003-

95
04 to supply milk to processing firms and directly to consumers.
Until the early 1990s, milk processing was mainly reserved for
the cooperative sector through licensing. As part of domestic
economic reforms and commitments to the WTO, the Indian
dairy sector was liberalized in a phased manner starting in
1991. The government removed all restrictions on setting up new
milk-processing capacity in March 2002.
Following partial decontrol of the dairy sector in the early
1990s, many private sector processors entered the market and
established milk-processing facilities, mostly in milk surplus
areas. Some of the private sector plants also adopted the
cooperative model of making informal contracts with local
farmers and providing various inputs and services to the
farmers. Nestle made large investments in its milk shed to
improve productivity levels and the quality of raw milk. However,
a large proportion of private dairy plants depend on
contractors/subcontractors to meet their raw material
requirement.
Based on 1999-2000 sales, the largest Indian dairy
companies/cooperatives were: Gujarat Cooperative Milk
Marketing Federation (GCMMF), Mother Dairy, Nestle India,
Hindustan Lever Ltd., Britannia, Andhra Pradesh Dairy
Development Cooperative Federation (APDDCF), Hatsun Agro,

96
and Vadial. The GCMMF dominates the processing sector, and
has about three times the sales of its nearest competitor.
4.4. Milk and Product Distribution
4.4.1 Past and Present Systems
Sale and distribution of fluid milk may occur directly from
the farm or the milk collection stations or through local
distributors. The remaining milk is cooled, transported to
processing plants, and converted into market (fluid) milk and
milk products that are distributed by a variety of means. Loose
or bulk pasteurized milk is dispensed to the consumer in the
Mother Dairy kiosks. Each dairy cooperative has its own
channels for distributing milk and other products. Private dairy
companies distribute products through local shops because
refrigerated distribution channels are sparse. Initiatives are
beginning to enlarge their markets into other states. Larger
cooperatives are beginning to expand through their own and
franchised market outlets.
The principal outlet for the popular traditional sweets
made from condensed milk is sweetshops or halwais. These are
located in markets of virtually every city and are generally
subject to government oversight. A limited number of dairy
outlets are in newly-built shopping centers in the upper-middle
and upper class sections of cities like New Delhi, Mumbai,
97
Bangalore, etc. Fashioned after western-style merchandizing,
they handle Indian dairy products and imported items such as
cheeses from a number of European and Oceanic countries.
4.4.2 Future Trends
Emergence of a more affluent segment of the Indian
population, albeit small as percent of total population but large
in numbers, seems to be prompting a shift to more value-added
dairy products. Packaged market milk is gaining in popularity
compared to "loose" milk. Markets for UHT milk and flavored
milks are growing but are still niche markets. It must be
remembered, however, that a niche market of 0.1 percent of the
Indian population is more than 1.1 million persons.
Traditional Indian dairy products such as paneer and
dairy-based sweets, with longer shelf-life, are being marketed as
branded products by cooperative and private companies. Butter,
ghee and ice cream are competitive markets dominated by a few
firms that have the manufacturing and merchandizing
capabilities to compete in these markets.
In spite of a dispersed market, a competitive climate, and
the present uncertainty about the nature and rate of change of
dairy product marketing and consumption in India, a number of
foreign investments have been made in recent years. Of
particular interest are two firms located in Wisconsin. Schreiber
98
Foods, Green Bay, has recently acquired 51 percent of Dynamic
Dairy Industries Ltd., which produces a broad range of products
including process cheese. A plan to market buffalo milk
Mozzarella cheese in the USA is part of collaboration between
Winona Foods, Green Bay, and Himalaya International.
While dairy products undoubtedly are now widely regarded
as premium foods in India, it may become more difficult for dairy
products to keep this status when more people enter the middle
and upper income groups. It seems likely that middle and upper
income consumers would not be satisfied with the sort (two to
four day shelf-life) of milk sold by processors in the formal sector
in parts of India. The formal dairy processing sector will benefit
if it can capitalize on the demands of upper and middle income
people for convenience, hygiene and quality.
The affordability of dairy products varies widely across
India. Middle and upper income consumers— possibly as many
as 450 million people in the future— will have the purchasing
power to purchase desired quantities of dairy products. However,
the remainder of the population, including many people living in
rural areas, will be subject to important income constraints.
As in many parts of the world, India's dairy industry will
witness increases in demand for dairy products from the food
service industry, the ingredients market, and away-from-home

99
food consumption businesses. Improved milk quality would
likely increase the importance of these sources of milk and dairy
product demand in India.
4.5 Trade Issues
4.5.1 India's Dairy Trade
Dairy trade is a small part of India's small agricultural
trade portfolio. In 2004, FAO reported Indian dairy exports of
US$78 million and imports valued at US$11 million. Exports
were record high in 2004, buttressed by large exports of casein
(reported as SMP by FAO). Together with SMP, whole milk
powder and butter/ghee comprised 94 percent of 2004 dairy
export value.
India's dairy imports consist mainly of butter/ghee, some
hard cheeses, and dry whey products. Butter/ ghee imports
were one-fifth of exports.
Both imports and exports are highly variable from year-to-
year. India's dairy trade balance has ranged from US$-30
million to US$65 million between 1989 and 2004. India's very
small volume of imports of dairy products is due partly to
restricted market access through import tariffs and partly to
sanitary requirements for some products. In 2001, India
removed all quantitative restrictions on agricultural imports.
100
4.5.2 U.S. - India Dairy Trade
U.S.-India dairy trade is small and decidedly one sided. In
2005, the U.S. exported less than US$3 million in dairy products
to India and imported US$60 million. Nearly all of the U.S. dairy
imports from India in 2005 were in the form of casein and
casein-ates. Casein imports totaled US$53 million, and India
was the third largest supplier of casein, behind Ireland and New
Zealand. The value of casein imports from India nearly doubled
between 2004 and 2005.
Most U.S. dairy products are restricted from India by
sanitary/heath certification rules adopted in 2004. Among other
things, these rules prohibit imports of dairy products derived
from animals administered supplemental recombinant Bovine
Somatatropin (rBST or BGH) or subjected to estrogenic
treatment. Since these products are widely-used in the U.S.,
most exporters cannot meet these standards.
4.5.3 India Dairy Trade Prospects
Dairy imports are a contentious issue in India. While
government policy generally supports more open trade, dairy
interests are strongly opposed to allowing great access to
imports. Some of this opposition seems to reflect a
misunderstanding of India's current dairy trade balance, or,
101
perhaps, a general negative perception regarding the possible
benefits of expanded trade.
Opposition also comes from those concerned about the
impact of more open trade on the fate of rural residents and
rural communities. The Government of India and many
agricultural trade groups have expressed a strong interest in
maintaining self-sufficiency in dairy and other agricultural
products. However, India may experience pressures to import
more dairy products in the future if demand for dairy products
unfolds strongly in response to increases in population and
incomes. [Foreign Agriculture Service (2005)]5
Alternatively, if strong internal demand for dairy products
fails to materialize, India, as the largest milk producer in the
world, may feel pressures to export dairy products. For example,
if India's real GDP growth should moderate to 4.5 percent and
assuming an income elasticity of demand of 0.6 percent and
population increases of 1.4 percent year, then domestic dairy
product purchases in India might increase at only about 4.1
percent per year. Under such a scenario, projected domestic
supplies of dairy products could put strong downward pressure
on prices and increase the incentives of dairy firms to export.

102
4.6 Government Policies Affecting Dairy
4.6.1 General Agricultural Policies
Since independence in 1947, a primary goal of Indian
agricultural policy has been food self- sufficiency. This goal has
been pursued through direct and indirect support for the
farming sector to reduce cash costs of production and through
setting minimum prices for food crops that stabilize and
enhance revenue.
Direct support includes input subsidies for production
inputs and services. The largest subsidies are for fertilizer and
irrigation. Fertilizer subsidies go to both farmers and fertilizer
manufacturers. Fertilizer is made available to farmers at fixed
prices under market. For imported fertilizer, the difference
between the import cost and the fixed price is subsidized. For
fertilizers produced domestically, manufacturers are paid a sub-
sidy representing their economic costs of manufacturing and
distributing fertilizers. The total fertilizer subsidy in 2005-06 is
estimated at $3.7 billion.
Irrigation is subsidized in two ways; through charging less
than market rates for electrical power used for pumping
groundwater and through public investment in surface water
distribution systems and covering distribution costs. Power and

103
water subsidies were estimated to total about $6.4 billion in
2003-04.
Minimum procurement prices apply to a large number of
crops. For rice and wheat, the primary food crops, the minimum
prices serve as intervention prices. That is, the government
purchases these commodities for storage and distribution under
the Indian Public Distribution System, which supplies foodstuffs
at subsidized prices to the poor. Since the government accepts
all rice and wheat offered at the announced support prices,
purchases vary according to crop size and private sector
demand.
Good crops and reduced consumption in the late 1990s led
to large government purchases and a buildup of government rice
and wheat stocks. The Indian government was forced to
subsidize exports in order to reduce stocks to a manageable
level. Later, stocks were depleted and in 2006, the government
needed to import wheat in order to meet its distribution needs.
Indirect forms of government support for farmers include
agricultural research and outreach, underwriting crop
insurance, and financial and institutional support for
cooperatives, including farm credit cooperatives.
Direct support in the form of subsidies and minimum
prices is limited to the crop sector of Indian agriculture.

104
Livestock and dairy are not directly supported, but receive some
indirect support through induced production of crops that yield
byproducts and residues for feeding to livestock. But at the same
time, subsidies and price guarantees for specific crops restrict
the area devoted to other, unsupported crops, notably fodder.
More generally, current agricultural supports have been
criticized for "locking in" crop production patterns that are
becoming increasingly separated from domestic consumption
patterns. Expanding consumer incomes in areas with strong
economic growth has increased demand for horticultural crops,
poultry and dairy products, and edible oils. Current support
policies provide little incentives for shifting production to higher-
demand products. Subsidies have also been criticized for
causing mining of groundwater and for restricting private
investment in agriculture.
The 2004 Indian national elections resulted in a new
coalition government (United Progressive Alliance, or UPA) led by
the Indian National Congress Party. The UPA-selected Indian
Prime Minister, Dr. Manmohan Singh, has publicly supported
making agriculture more market-oriented. But agricultural
reform is not an easy task in India because of the involvement of
states— states must agree to and implement policies recom-
mended and funded by the central government. Given the

105
diversity of agriculture among states, acrimony is more likely
than harmony.
4.6.2 Dairy Policies
Economic conditions existing in India in the decade
following independence created an environment that gave rise to
unique policies and institutions that shaped development of the
country's dairy industry. In the 1950s and 1960s, India was one
of the largest dairy importing countries in the world. For
example, India's commercial imports of milk powder peaked at
over 50 thousand metric tons in 1963-64. This contrasts sharply
with the zero milk powder imports recorded by India in 2005.
The large dairy imports in the 1960s stunted development
of India's dairy industry, causing milk production in the country
to plateau at about 20 to 22 million metric tons per year in that
decade. This happened partly because frequently it was cheaper
for India's domestic firms to import milk powder and butter or
butter oil and make reconstituted milk, rather than buy milk
from India's farmers.
This situation concerned India's policy makers who
reasoned that an expanding domestic dairy industry would be a
good vehicle for promoting employment and rural development.
Moreover, government officials and persons in the dairy industry
recognized that India's population growth, urbanization, income

106
growth, the high income elasticity of demand for dairy products,
and changes in consumption habits, all might support profitable
expansion of the country's dairy industry. Hence, the
government of India embarked on an import substitution policy
that would produce near self-sufficiency in dairy products.
Initially, this policy was basically a dairy cooperative
development initiative.
The foundation for this initiative was the cooperative
movement in the state of Gujarat. In 1952, the Kaira District
Cooperative Milk Producers' Union (currently the Gujarat
Cooperative Milk Marketing Federation) gained the right to
supply the Bombay market with fluid milk. This assured market
allowed the cooperative to grow rapidly but also provided a
challenge in maintaining a cold chain and balancing milk
production with fluid milk demand. The cooperative adopted a
unique tiered system of milk collection and processing. Village
cooperative societies collected and cooled milk from tens of
thousands of small dairy farmers throughout the state. District
unions consolidated society shipments and operated
manufacturing plants to handle fluid surpluses. Marketing and
coordination were at the state level. The cooperative adopted the
AMUL brand and developed nationwide brand recognition.
107
The tiered system ultimately became known as the Anand
Model (for the location of the cooperative federation
headquarters), and was promoted and financially supported by
the Indian government through the National Dairy Development
Board (NDDB), created in 1965.
4.6.3 Government Support for Operation Flood
The purpose of Operation Flood was to create a white flood
of milk throughout India by widely replicating and financially
supporting the Anand Model. The first phase of Operation Flood
was launched in 1970 under an agreement with the World Food
Program. This agreement provided aid and financing in the form
of 126,000 tons of skim milk powder and 42,000 tons of butter
oil-surplus dairy products obtained from the then European
Economic Community (EEC). In brief, the Operation Flood
program carried out the following functions:
� Organized village dairy cooperatives.
� Created the physical and institutional infrastructure
for milk procurement, processing, marketing and
production enhancement services.
� Established dairies at India's major metropolitan
centers—i.e., Bombay, Calcutta, Delhi and Madras.
� The second phase of the program was implemented
between 1981 and 1985. It incorporated state dairy

108
development projects that had been undertaken with
assistance of the Indian Dairy Corporation into an
overall program. This effort was financed with $150
million from the World Bank and commodity assis-
tance from the EEC.
� The third phase focused on making the cooperative
efforts self-sustaining. Employing World Bank, EEC
and the NDDB's internal resources, this phase
expanded the production, processing, marketing and
professional management capabilities of the dairy
industry.
� In addition to financial support, the Government of
India sharply limited commercial dairy imports from
the early years of Operation Flood until the early
1990s. This action was justified in part as protection
for an "infant industry." The permitted dairy imports
were "canalized" (channeled) through the NDDB as
importing agency.
4.6.4 The Lifting of Restrictions on India's Domestic Dairy
Industry
India's dairy sector was regulated and protected through
restrictions on imports and exports of dairy products and
domestic regulations until the early 1990s. The industry became

109
progressively more liberalized after 1991 as a result of changes
that culminated in the repeal of certain licensing requirements
and changes in the Milk and Milk Products Order (MMPO) to
reform India's dairy economy. Among the restrictive measures
contained in the MMPO that were eventually eliminated was one
that specified the milksheds from which dairy processors could
procure milk.
Prior to the 1990s, milk procurement, processing and
supply to urban consumers was primarily in the hands of
cooperatives. The entry of most big proprietary firms into the
processing sector was restricted through licenses. As part of
broader economic reforms introduced in 1991, licensing of dairy
industry firms ended and the industry was opened to private
competition.
Within a year after the 1991 reforms, more than 100 new
private sector dairy plants were set up in the India's dairy
industry. Unfortunately, some of the new private plants sold
adulterated and contaminated milk products. Consequently, the
government brought back a licensing system under the MMPO of
1992, requiring state regulation of dairy plants producing
10,000 to 75,000 liter of milk per day or manufacturing of milk
products containing 500 to 3,750 tons of milk solids per year.
Plants producing over 75,000 liters of milk per day or handling
110
more than 3,750 tons of milk solids per year had to be registered
with the central government.
The 1992 MMPO defined "milksheds" in reference to the
region from which the marketable surplus of milk was to find its
way to a processing plant. The edict in the 1992 MMPO relating
to milksheds was implemented by state or central government
Registering Authorities.
In 2001 the MMPO was amended to require compulsory
registration only for larger dairy plants that processed over
20,000 liters pay day. The MMPO was last amended in 2002 to
raise the registration requirement to 200,000 liters per day and
to eliminate state authority to assign milksheds. Most private
companies applauded the end of milk shed definition by the Reg-
istering Authority. Some of them were able to substantially
expand their procurement area. [Indian Dairy (2005)]6
4.7 State Wise Production Performance in Milk As noted earlier, in the present section it is attempted to
examine the performance of states in terms of milk production
and the inequality in them.
4.7.1 Trends in State Wise Production of Milk The performance of the state at the macro level, with
dispersion or deviation in it, is being determined by the
performance by its district. Based on this view, before embarking

111
upon the analysis of the production of milk at the micro level, in
the present section it is attempted to examine the state wise
production of milk and the inequality in production.
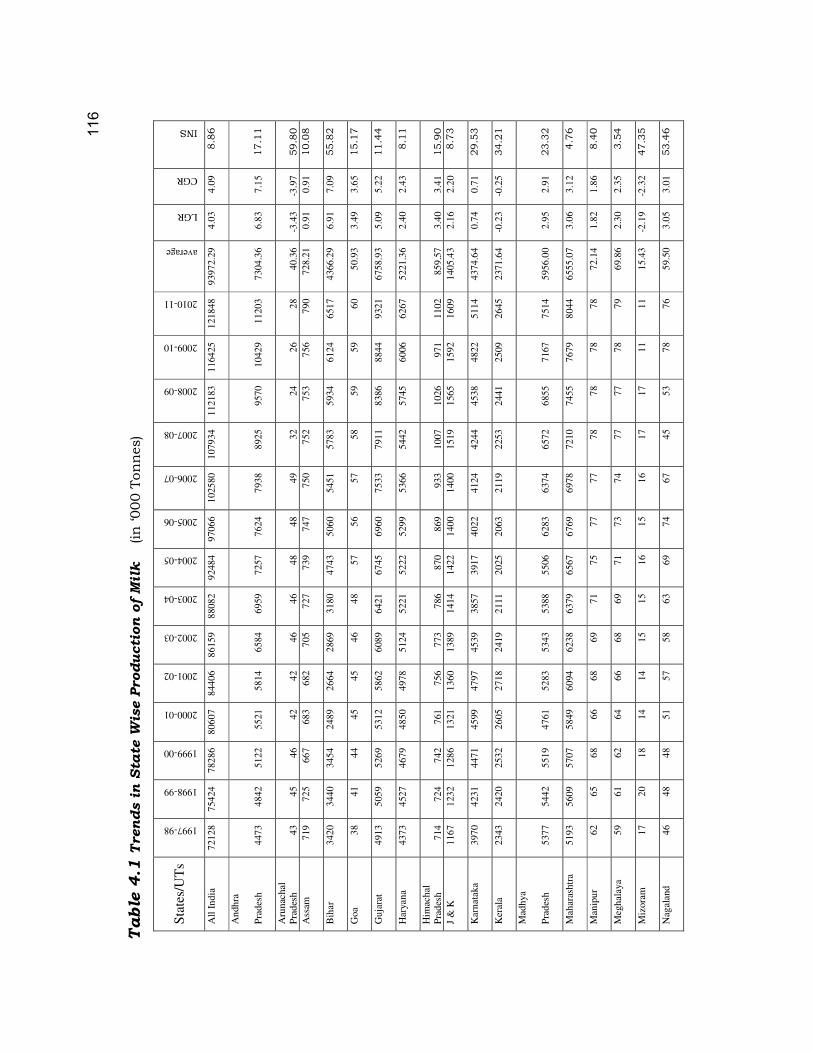
As it could be seen in table 5.1, the total production of milk
in India in the year 1997-98 stood at 721.28 million tonnes. A
state wise analysis of milk production in the same year indicates
that the highest level of milk production has been registered by
Uttar Pradesh with 129.34 lakh tonnes of milk production. This
state alone constituted 17.93 per cent of the country’s total milk
production. This is being followed by the other states in the
declining order of milk production as: Punjab (71.65 lakh
tonnes), Rajasthan (64.87 lakh tonnes), Madhya Pradesh (53.77
lakh tonnes), Maharashtra (51.93 lakh tonnes), Gujarat (49.13
lakh tonnes), Andhra Pradesh (44.73 lakh tonnes), Haryana
(43.73 lakh tonnes), Tamil Nadu (40.61 lakh tonnes), Karnataka
(39.7 lakh tonnes), Bihar (34.2 lakh tonnes), West Bengal (34.15
lakh tonnes), Kerala (23.43 lakh tonnes), J & K (11.67 lakh
tonnes), Assam (7.19 lakh tonnes), Himachal Pradesh (7.14 lakh
tonnes), Orissa (6.72 lakh tonnes), Delhi (2.67 lakh tonnes),
Manipur (0.62 lakh tonnes), Meghalaya (0.59 lakh tonnes),
Tripura (0.57 lakh tonnes), Nagaland (0.46 lakh tonnes),
Arunachal Pradesh (0.43 lakh tonnes), Chandigarh (0.43 lakh
tonnes), Goa (0.38 lakh tonnes), Pondicherry (0.36 lakh tonnes),
112
Sikkim (0.35 lakh tonnes), A&N Islands (0.22 lakh tonnes),
Mizoram (0.17 lakh tonnes), D & N Haveli (0.04 lakh tonnes),
Daman & Diu (0.01 lakh tonnes) and Lakshadweep (0.01 lakh
tonnes). The states like, Chhattisgarh, Uttaranchal and
Jharkhand did not show any milk production as these states
were separated only after 1997-98.
In the year 2010-11, the total milk production stood at
1218.48 lakh tonnes which is a 4.03 per cent increase in
production during the 14 years period of time. In the same year,
the order of the states in terms of milk production can be given
as: Uttar Pradesh (210.31 lakh tonnes), Rajasthan (132.34 lakh
tonnes), Andhra Pradesh (112.03 lakh tonnes), Punjab (94.23
lakh tonnes), Gujarat (93.21 lakh tonnes), Maharashtra (80.44
lakh tonnes), Madhya Pradesh (75.14 lakh tonnes), Tamil Nadu
(68.31 lakh tonnes), Bihar (65.17 lakh tonnes), Haryana (62.67
lakh tonnes), Karnataka (51.14 lakh tonnes), West Bengal (44.71
lakh tonnes), Kerala (26.45 lakh tonnes), Orissa (16.71 lakh
tonnes), J & K (16.09 lakh tonnes), Jharkhand (15.55 lakh
tonnes), Uttaranchal (13.83 lakh tonnes), Himachal Pradesh
(11.02 lakh tonnes), Chhattisgarh (10.29 lakh tonnes), Assam
(7.9 lakh tonnes), Delhi (4.8 lakh tonnes), Tripura (1.04 lakh
tonnes), Meghalaya (0.79 lakh tonnes), Manipur (0.78 lakh
tonnes), Nagaland (0.76 lakh tonnes), Goa (0.6 lakh tonnes),

113
Pondicherry (0.47 lakh tonnes), Chandigarh (0.45 lakh tonnes),
Sikkim (0.43 lakh tonnes), Arunachal Pradesh (0.28 lakh
tonnes), A&N Islands (0.25 lakh tonnes), Mizoram (0.11 lakh
tonnes), D&N Haveli (0.11 lakh tonnes), Lakshadweep (0.02 lakh
tonnes) and Daman & Diu (0.01 lakh tonnes).
A comparison of the state wise production in the year
1997-98 and 2010-11 would indicate that between these two
years there is a wide change in the order of the states in terms of
production. While some of the states could increase their milk
production and reach a higher rank, the production in some
states like, Arunachal Pradesh, Kerala, Mizoram have
experienced a decline in the production which made them to get
relegate to the back in terms of their ranks.
The order of the states in terms of average level of milk
production for the entire study period can be given as: Uttar
Pradesh (165.739 lakh tonnes), Rajasthan (91.3929 lakh
tonnes), Punjab (84.75 lakh tonnes), Andhra Pradesh (73.0436
lakh tonnes), Gujarat (67.5893 lakh tonnes), Maharashtra
(65.5507 lakh tonnes), Madhya Pradesh (59.56 lakh tonnes),
Tamil Nadu (53.9543 lakh tonnes), Haryana (52.2136 lakh
tonnes), Karnataka (43.7464 lakh tonnes), Bihar (43.6629 lakh
tonnes), West Bengal (38.065 lakh tonnes), Kerala (23.7164 lakh
tonnes), Jammu and Kashmir (14.0543 lakh tonnes), Orissa

114
(11.8564 lakh tonnes), Jharkhand (9.82 lakh tonnes),
Uttaranchal (9.4164 lakh tonnes), Himachal Pradesh (8.5957
lakh tonnes), Assam (7.2821 lakh tonnes), Chhattisgarh (6.7614
lakh tonnes), Delhi (3.4064 lakh tonnes), Tripura (0.8521 lakh
tonnes), Manipur (0.7214 lakh tonnes), Meghalaya (0.6986 lakh
tonnes), Nagaland (0.595 lakh tonnes), Goa (0.5093 lakh
tonnes), Chandigarh (0.4436 lakh tonnes), Sikkim (0.4171 lakh
tonnes), Pondicherry (0.41 lakh tonnes), Arunachal Pradesh
(0.4036 lakh tonnes), Andaman and Nicobar Islands (0.235 lakh
tonnes), Mizoram (0.1543 lakh tonnes), D&N Haveli (0.0764 lakh
tonnes), Lakshadweep (0.0171 lakh tonnes) and Daman & Diu
(0.01 lakh tonnes).
The growth rates worked out for the study period would
provide a clear view on the order of the states in terms of their
performance in the milk production. Accordingly, in terms of
linear growth rate worked out, the order of the states can be
given as: Jharkhand (12.77 per cent), Uttaranchal (10.9 per
cent), Chhattisgarh (10.75 per cent), Orissa (7.24 per cent),
Bihar (6.91 per cent), Andhra Pradesh (6.83 per cent), Rajasthan
(5.59 per cent), Gujarat (5.09 per cent), Delhi (4.67 per cent),
Tamil Nadu (4.18 per cent), Uttar Pradesh (3.78 per cent), Goa
(3.49 per cent), Himachal Pradesh (3.4 per cent), D&N Haveli
(3.36 per cent), Maharashtra (3.06 per cent), Nagaland (3.05 per
115
cent), Tripura (3 per cent), Madhya Pradesh (2.95 per cent),
Lakshadweep (2.82 per cent), Pondicherry (2.44 per cent),
Haryana (2.4 per cent), Meghalaya (2.3 per cent), Punjab (2.22
per cent), J & K (2.16 per cent), West Bengal (2.15 per cent),
Sikkim (2.01 per cent), Manipur (1.82 per cent), Assam (0.91 per
cent), A&N Islands (0.78 per cent), Chandigarh (0.77 per cent)
and Karnataka (0.74 per cent). Daman & Diu do not experience
any growth in output, while the districts like Kerala (-0.23 per
cent), Mizoram (-2.19 per cent) and Arunachal Pradesh (-3.43
per cent) have shown a declining growth during the study period.
11
6
Table
4.1
Tren
ds i
n S
tate
Wis
e P
roducti
on o
f M
ilk
(in
‘000 T
on
nes)
Sta
tes/
UT
s
1997-98
1998-99
1999-00
2000-01
2001-02
2002-03
2003-04
2004-05
2005-06
2006-07
2007-08
2008-09
2009-10
2010-11
average
LGR
CGR
INS
All
In
dia
7
21
28
754
24
782
86
806
07
844
06
86
15
9
8808
2
9248
4
9706
6
1025
80
1079
34
1121
83
1164
25
1218
48
9397
2.2
9
4.0
3
4.0
9
8.8
6
An
dh
ra
Pra
des
h
447
3
484
2
512
2
55
21
58
14
6584
6959
7257
7624
7938
8925
9570
1042
9
1120
3
7304
.36
6.8
3
7.1
5
17.1
1
Aru
nac
hal
Pra
des
h
43
45
46
42
42
46
46
48
48
49
32
24
26
28
40.3
6
-3.4
3
-3.9
7
59.8
0
Ass
am
719
7
25
66
7
683
682
705
727
739
747
750
752
753
756
790
728
.21
0.9
1
0.9
1
10.0
8
Bih
ar
342
0
344
0
345
4
24
89
26
64
2869
3180
4743
5060
5451
5783
5934
6124
6517
4366
.29
6.9
1
7.0
9
55.8
2
Goa
38
41
44
45
45
46
48
57
56
57
58
59
59
60
50.9
3
3.4
9
3.6
5
15.1
7
Gu
jara
t 4
91
3
505
9
526
9
53
12
58
62
6089
6421
6745
6960
7533
7911
8386
8844
9321
6758
.93
5.0
9
5.2
2
11.4
4
Har
yan
a 4
37
3
452
7
467
9
48
50
49
78
5124
5221
5222
5299
5366
5442
5745
6006
6267
5221
.36
2.4
0
2.4
3
8.1
1
Him
ach
al
Pra
des
h
714
7
24
74
2
761
756
773
786
870
869
933
1007
1026
971
1102
859
.57
3.4
0
3.4
1
15.9
0
J &
K
116
7
123
2
128
6
13
21
13
60
1389
1414
1422
1400
1400
1519
1565
1592
1609
1405
.43
2.1
6
2.2
0
8.7
3
Kar
nat
aka
397
0
423
1
447
1
45
99
47
97
4539
3857
3917
4022
4124
4244
4538
4822
5114
4374
.64
0.7
4
0.7
1
29.5
3
Ker
ala
234
3
242
0
253
2
26
05
27
18
2419
2111
2025
2063
2119
2253
2441
2509
2645
2371
.64
-0.2
3
-0.2
5
34.2
1
Mad
hya
Pra
des
h
537
7
544
2
551
9
47
61
52
83
5343
5388
5506
6283
6374
6572
6855
7167
7514
5956
.00
2.9
5
2.9
1
23.3
2
Mah
aras
htr
a 5
19
3
560
9
570
7
58
49
60
94
6238
6379
6567
6769
6978
7210
7455
7679
8044
6555
.07
3.0
6
3.1
2
4.7
6
Man
ipu
r 6
2
65
68
66
68
69
71
75
77
77
78
78
78
78
72.1
4
1.8
2
1.8
6
8.4
0
Meg
hal
aya
59
61
62
64
66
68
69
71
73
74
77
77
78
79
69.8
6
2.3
0
2.3
5
3.5
4
Miz
ora
m
17
20
18
14
14
15
15
16
15
16
17
17
11
11
15.4
3
-2.1
9
-2.3
2
47.3
5
Nag
alan
d
46
48
48
51
57
58
63
69
74
67
45
53
78
76
59.5
0
3.0
5
3.0
1
53.4
6

11
7
Ori
ssa
672
7
33
85
0
876
929
941
997
1283
1342
1431
1625
1598
1651
1671
1185
.64
7.2
4
7.8
2
22.5
4
Pu
nja
b
716
5
739
4
770
6
77
77
79
32
8173
8391
8554
8909
9168
9282
9387
9389
9423
8475
.00
2.2
2
2.2
7
5.4
4
Raja
sth
an
648
7
692
3
728
0
74
55
77
58
7789
8054
8310
8713
1030
9
1137
7
1193
1
1233
0
1323
4
9139
.29
5.5
9
5.6
0
26.4
5
Sik
kim
3
5
35
35
35
37
45
48
46
48
49
42
42
44
43
41.7
1
2.0
1
2.1
5
34.7
8
Tam
il N
adu
406
1
427
3
458
6
49
10
49
88
4622
4752
4784
5474
6277
6540
6651
6787
6831
5395
.43
4.1
8
4.2
3
23.1
6
Tri
pu
ra
57
76
77
77
90
79
84
86
87
89
91
96
100
104
85.2
1
3.0
0
3.1
8
21.2
2
Utt
ar P
rades
h
129
34
136
18
141
52
138
57
146
48
15
28
8
1594
3
1651
2
1735
6
1809
4
1886
1
1953
7
2020
3
2103
1
1657
3.8
6
3.7
8
3.8
5
7.6
0
Wes
t B
engal
3
41
5
344
1
346
5
34
71
35
15
3600
3686
3790
3891
3983
4087
4176
4300
4471
3806
.50
2.1
5
2.1
5
7.2
4
A&
N I
slan
ds
22
22
23
22
23
26
25
24
20
23
24
26
24
25
23.5
0
0.7
8
0.7
7
23.2
8
Chand
igar
h
43
43
42
43
43
43
44
43
46
46
47
47
46
45
44.3
6
0.7
7
0.7
7
8.0
7
D&
N H
avel
i 4
8
8
8
8
8
8
4
5
5
10
10
10
11
7.6
4
3.3
6
3.2
9
96.3
0
Dam
an &
Diu
1
1
1
1
1
1
1
1
1
1
1
1
1
1
1.0
0
0.0
0
0.0
0
0.0
0
Del
hi
267
2
90
29
0
291
294
296
299
303
310
288
445
450
466
480
340
.64
4.6
7
4.4
5
45.9
0
Laksh
adw
eep
1
2
1
2
2
2
1
1
2
2
2
2
2
2
1.7
1
2.8
2
3.4
1
89.0
4
Pon
dic
herr
y
36
36
37
37
37
37
40
41
43
45
46
46
46
47
41.0
0
2.4
4
2.4
7
10.2
0
Chh
atti
sgar
h
0
0
0
777
795
804
812
831
839
849
866
908
956
1029
676
.14
10.7
5
65.1
3
114.6
5
Utt
aran
chal
0
0
0
10
25
10
66
1079
1188
1195
1206
1213
1221
1230
1377
1383
941
.64
10.9
0
69.3
8
112.3
7
Jhar
khan
d
0
0
0
910
940
952
954
1330
1335
1401
1442
1466
1463
1555
982
.00
12.7
7
72.4
3
88.2
5
Sou
rce:
Na
tion
al D
air
y D
evelo
pm
en
t B
oard
, 2012.
Note
:
LG
R –
Lin
ear
Gro
wth
Rate
CG
R =
Com
pou
nd G
row
th R
ate
INS
= I
nstu
bilit
y In
dex
118
In terms of compound growth rate, the order of the states
can be given as: Jharkhand (72.43 per cent), Uttaranchal (69.38
per cent), Chhattisgarh (65.13 per cent), Orissa (7.82 per cent),
Andhra Pradesh (7.15 per cent), Bihar (7.09 per cent), Rajasthan
(5.6 per cent), Gujarat (5.22 per cent), Delhi (4.45 per cent),
Tamil Nadu (4.23 per cent), Uttar Pradesh (3.85 per cent), Goa
(3.65 per cent), Himachal Pradesh (3.41 per cent), Lakshadweep
(3.41 per cent), D&N Haveli (3.29 per cent), Tripura (3.18 per
cent), Maharashtra (3.12 per cent), Nagaland (3.01 per cent),
Madhya Pradesh (2.91 per cent), Pondicherry (2.47 per cent),
Haryana (2.43 per cent), Meghalaya (2.35 per cent), Punjab (2.27
per cent), J & K (2.2 per cent), Sikkim (2.15 per cent), West
Bengal (2.15 per cent), Manipur (1.86 per cent), Assam (0.91 per
cent), A&N Islands (0.77 per cent), Chandigarh (0.77 per cent)
and Karnataka (0.71 per cent).
While the state of Daman & Diu (0 per cent) has
experienced no growth in milk production, the states like, Kerala
(-0.25 per cent), Mizoram (-2.32 per cent) and Arunachal
Pradesh (-3.97 per cent) have recorded a negative growth rate.
The instability index, a sophisticated technique to measure
stability or the volatility in the growth in production of milk by
states indicates that Meghalaya (3.54 per cent) has recorded the

119
least volatility. The order of the other states in terms of
increasing instability index can be given as: Maharashtra (4.76
per cent), Punjab (5.44 per cent), West Bengal (7.24 per cent),
Uttar Pradesh (7.6 per cent), Chandigarh (8.07 per cent),
Haryana (8.11 per cent), Manipur (8.4 per cent), J & K (8.73 per
cent), Assam (10.08 per cent), Pondicherry (10.2 per cent),
Gujarat (11.44 per cent), Goa (15.17 per cent), Himachal
Pradesh (15.9 per cent), Andhra Pradesh (17.11 per cent),
Tripura (21.22 per cent), Orissa (22.54 per cent), Tamil Nadu
(23.16 per cent), A&N Islands (23.28 per cent), Madhya Pradesh
(23.32 per cent), Rajasthan (26.45 per cent), Karnataka (29.53
per cent), Kerala (34.21 per cent), Sikkim (34.78 per cent), Delhi
(45.9 per cent), Mizoram (47.35 per cent), Nagaland (53.46 per
cent), Bihar (55.82 per cent), Arunachal Pradesh (59.8 percent),
Jharkhand (88.25 per cent), Lakshadweep (89.04 percent), D&N
Haveli (96.3 per cent), Uttaranchal (112.37 per cent) and
Chhattisgarh (114.65 per cent).
Thus from the analysis it can be concluded that all the
states, except a few have shown positive growth in the
production of milk. [Economic Survey (20050-06)]7
120
4.7.2 Ranking of States by Production Performance in Milk
The above analysis on the trends in the growth of milk
production of Indian states and the inequality in the growth as
measured by the instability indicated a mixed trend. This
means, in terms of quantity of production as measured in terms
of the average production for the study period, in terms of
growth rates and in terms of instability, different states showed
different performance and hence it is difficult to identify the
overall production performance of the states. To overcome this
problem and to understand the order of the states in terms of
their production performance, the Composite Rank Index has
been worked out. The composite Rank Index is the ranking of the
rank sum total of the indicators used to measure production
performance. The indicators used to measure the performance
are the average production of the states during the study period,
the linear and compound growth rates and the instability index.
Among these measures, the average, linear growth rate and
instability index are considered to arrive at the rank sum total.

121
Table 4.2 Composite rank index of production performance
of milk by states
States/UTs
RANKING
Average LGR Instability Rank Sum
Total
Composite
Rank
A&N Islands 31 29 20 80 32
Andhra Pradesh 4 6 16 26 3.5
Arunachal Pradesh 30 35 30 95 35
Assam 19 28 11 58 21
Bihar 11 5 29 45 11
Chandigarh 27 30 7 64 25.5
Chhattisgarh 20 3 35 58 22
D&N Haveli 33 14 33 80 31.5
Daman & Diu 35 32 1 68 27
Delhi 21 9 26 56 19.5
Goa 26 12 14 52 17
Gujarat 5 8 13 26 3.5
Haryana 9 21 8 38 9
Himachal Pradesh 18 13 15 46 12.5
J & K 14 24 10 48 16
Jharkhand 16 1 31 48 16
Karnataka 10 31 23 64 25.5
Kerala 13 33 24 70 29
Lakshadweep 34 19 32 85 33
Madhya Pradesh 7 18 21 46 12.5
Maharashtra 6 15 3 24 2
Manipur 23 27 9 59 23
Meghalaya 24 22 2 48 16
Mizoram 32 34 27 93 34
Nagaland 25 16 28 69 28
Orissa 15 4 18 37 7.5
Pondicherry 29 20 12 61 24
Punjab 3 23 4 30 5
Rajasthan 2 7 22 31 6
Sikkim 28 26 25 79 30
Tamil Nadu 8 10 19 37 7.5
Tripura 22 17 17 56 19.5
Uttar Pradesh 1 11 6 18 1
Uttaranchal 17 2 34 53 18
West Bengal 12 25 5 42 10
Source: Computed from Table5.1.
The average level of production and the linear growth rate
are ranking in the declining (descending) order of the sates while
the instability index is measured in terms of increasing

122
(ascending) value. This is so because, while the increasing
average and growth rate are indicators of favourable nature of
production, the increasing value of instability is an indication of
higher volatility which is not preferable.
The ordering or the states by each indicator and the
composite Rank Index arrived at indicates that Uttar Pradesh
has taken up the first rank in terms of milk production
performance. The order of the other states in terms of
performance can be given as: Maharashtra, Andhra Pradesh,
Gujarat, Punjab, Rajasthan, Orissa, Tamil Nadu, Haryana, West
Bengal, Bihar, Himachal Pradesh, Madhya Pradesh, Jammu and
Kashmir, Jharkhand, Meghalaya, Goa, Uttaranchal, Delhi,
Tripura, Assam, Chhattisgarh, Manipur, Pondicherry,
Chandigarh, Karnataka, Daman & Diu, Nagaland, Kerala,
Sikkim, D&N Haveli, Andhaman &Nicobar Islands,
Lakshadweep, Mizoram and Arunachal Pradesh. [Government of
India (2003)]8
Thus from the analysis it can be concluded that the overall
production performance is favourable for Uttar Pradesh.
Tamilnadu is endowed with a sizeable livestock population.
The department of Economics and Statistics conduct periodical
livestock survey in the state.

123
The following table gives an idea of the changes in the
livestock population as recorded in the 1997, 2001, and 2004.
Table 4.3 Livestock census of Tamilnadu (in lakhs)
Year Cattle Buffaloes Total
1997
2001
2004
90.47
91.82
91.41
27.41
27.08
16.58
117.88
118.90
107.99
Source: Tamilnadu – An Economic Appraisal – Various Issues.
It is possible to know from the contents of the above table
that the number of cattle remains the same, the number of
buffaloes in Tamilnadu is progressively declining from 27.4 lakhs
in 1997 to 16.58 in 2004, resulting in a total decline.
The buffaloes used to serve a dual propose to provide milk
as well as ploughing the field. With increasing mechanization of
agriculture the importance of buffaloe is slowly declining.
Further, fodder requirements in the case of buffaloes are
comparatively larger and with increasing cost of fodder, the
number of buffaloes maintained is on the decrease.
The state is very much interested in the production of milk.
The objective is to increase productivity of cattle. It is found that
with the introduction of exotic and cross breed of cow, it is

124
possible to raise, productivity by replacing the indegeous breed
with exotic and cross breed. The following table gives
information regarding the average yield rate of milk (Kgs.). per
animal/per day.
Table 4.4 Average yield rate of milk/animal in Tamilnadu
Breed 2000-01 2001-02 2002-03
Exotic and Cross breed
Indigenous
6.002
2.698
6.244
2.696
6.150
2.554
Source: Tamilnadu – An Economic Appraisal – Various Issues.
Turning to the situation in Kanyakumari district, the
following table gives the trends in the number of milk animals
enumerated in the three livestock censuses.
Table 4.5 Livestock census of Kanyakumari district (‘000)
Year Cattle Buffaloes Total
1997
2001
2004
82.656
(0.91)
101.3
(1.10)
101.712
(2.00)
14.416
(0.52)
11.9
(0.43)
6.077
(0.36)
97.072
(0.82)
113.2
(0.95)
107.789
(0.99)
Source: Tamilnadu – An Economic Appraisal – Various Issues.

125
As in the state, in the district also the proportion of
buffaloe is decreasing. It is possible to know from the contents
of the table that the district which has 2.68 percent of the state
population had 0.91 percent, 1.18 percent and 2.0 percent in
1997, 2001 and 2004 of the state’s cattle population.
Table 4.6 Estimated milk production in Tamilnadu
(in 000 tonnes)
Year
Cows
Indigenous Exotic
and cross breed
Total Buffaloes Total
2000-01
2001-02
2002-03
2003-04
2004-05
2005-06
2006-07
2007-08
2008-09
2009-10
1285.35
1266.88
1271.28
1278.58
1264.71
812.89
811.05
799.900
791.752
789.214
1811.51
1904.68
1885.77
2044.45
2102.29
3889.95
3984.17
4026.98
4121.65
4227.43
3096.86
3171.56
3157.05
3323.03
3367.00
4702.84
4795.22
4826.82
4913.40
5016.65
1811.77
1816.53
1465.22
1429.70
1416.75
770.77
765.25
759.32
760.32
761.46
4908.63
4988.09
4622.27
4752.73
4783.75
5473.61
5560.47
5568.15
5673.32
5778.11
Source: Statistical Handbook of Tamilnadu, Various Issues.
The contents of the above table show the trend in milk
production over a ten year period (2000-01 to 2009-10). It is
observed that over the period, while the contribution of buffaloes
has decreased from 811.79 tonnes to 761.461 tonnes that of
cows increased from 3096.86 tonnes to 5016.65 tonnes. It is

126
also found that while the contribution of indigenous cows
decreased from 1285.35 tonnes to 789.17 tonnes, that of exotic
and cross breed cows registered to phenomenal increase from
1311.51 tonnes to 4227.43 tonnes by 2.33 times. This reflects
the trend in substituting indigenous cows with exotic and cross
breeds of cows and the higher productivity of the latter.
(Statistical Hand Book, Tamilnadu, 2011)9
Table 4.7 Estimated milk production in Kanyakumari
district (in 000 tonnes)
Year
Cow’s Milk
Total
Buffaloes Total
Indigenous Exotic and cross breed
2000-01
2001-02
2002-03
2003-04
2004-05
2005-06
2006-07
2007-08
2008-09
2009-10
13.313
13.494
12.447
8.178
2.147
0.735
1.557
1.500
1.175
1.327
90.927
85.681
59.520
66.526
87.324
99.274
100.678
112.132
132.741
139.04
104.242
98.521
1.967
74.704
89.47
100.009
102.23
113.63
133.916
140.375
14.714
14.270
5.385
4.842
3.453
2.053
3.013
4.011
4.924
2.683
119.006
112.791
77.352
79.546
92.92
102.062
103.24
117.64
138.840
143.058
Source: Statistical Handbook of Tamilnadu, Various Issues.
The table above shows the trends in milk production in
Kanyakumari district over the ten year period. It shows
instability declining between 2002-03 and 2004-05 and then
picking up crowning the 2000-01 level in the last two years. In

127
the district also, while the contribution of indigenous cows is
declining (from 13.318 1000 tonnes in the start first 1327 tonnes
in 2009-10. The share of buffaloes has declined from 14764
tonnes to 2683 tonnes in the period. The last column shows
production in the district as a percentage of production in the
state which also shows a declining trend, from 2.42% in 2000-01
to 1.67% in 2003-04. Bettering since then and atleast
recovering to the initial level in 2008-09. Here also the decline in
the contribution of indigenous cows from the start, has been
compensated by the contribution of oxotic and cross breeds in
later years (since 2004-05).
Constraints to Expanding Milk Production
The major limiting factors to increasing India's milk
production are:
• Crop residual/byproduct ration. Opportunities to expand
milk yields by improving the quality of crop residuals and
byproducts are limited. Moreover, the demand for food grains
to feed India's large and growing population restricts the
availability of grain for dairy animals and largely precludes
displacing grain crops with green forage crops.
• Building dairy management skills. A major challenge to
expanding Indian milk production is improving cow
128
management expertise for the vast number of dairy farmers
in India. Many of these farmers are women who suffer a
lower literacy rate than the male population, making training
difficult.
• Adherence to the smallholder model. There is a mind set—
perhaps a good and reasonable mind set—that the
smallholder model must be maintained to alleviate rural
poverty. While larger, more productive dairy operations are
tolerated by government officials, they are viewed with some
skepticism because of their perceived effect on rural
employment and income distribution. But larger farms may
be necessary if demand grows rapidly and India wishes to
remain self-sufficient in milk production.

129
REFERENCES
1. Ahluwaltia, Montek S. “Reducing Poverty and Hunger in India: The Role of Agriculture. Essays: Lessons Learned from the Dragon (China) and the Elephant (India)”, Annual Report. International Food Policy Research Institute, 2005, pp. 235-238.
2. Bannerjee, A. “Dairying Systems in India”, World Annual
Review, Vol. 79. United Nations Food and Agricultural Organization. 1994, p.115.
3. Chand, R., Dairying in India: Experiences and Development Prospects, Paper presented at Australian Bureau of Agricultural Economics Seminar. August 2005, pp. 67-70.
4. Food and Agricultural Organization of the United Nations. FAO Statistical Databases, 2002, pp.5-7.
5. Foreign Agricultural Service, U.S. Department of Agriculture, Dairy: World Markets and Trade, Circular Series FD 2-05. December 2005, pp. 67-69.
6. India Dairy and Products Annual, 2005, p.95.
7. Economic Survey, 2005-06, p.35.
8. Government of India. Ministry of Agriculture, Department of Animal Husbandry, Dairying & Fisheries, Animal Husbandry Statistics.
9. Statistical Hand Book of Tamilnadu, 2011.