chapter iv growth of textile industry in...
TRANSCRIPT

53
Chapter IV
GROWTH OF TEXTILE INDUSTRY IN INDIA
4.1 Introduction
The phenomenal growth of textile industry in India has been striking features
in the economic development of the country since independence. It has contributed to
the overall growth of the country in terms of Gross Domestic Product (GDP),
employment generation and export. It has acquired a prominent place in the socio-
economic development of the country during the past four and a half decades.
Performance of the textile sector, which forms a major part of industrial sector, has
therefore got direct impact on the growth of the national economy. The present
section deals with the growth of Indian textile industry during the period from 1980-
81 to 2009-10 which represents pre liberalization (1980-81 -1991-92) and post-
liberalization (1992-93-2004-05) and post-MFA regime (2005-06-2009-10)
The evolution of textile policy in India has been along a trajectory intend to
make the industry more efficient and competitive. In the textile policy of 1985;
greater emphasis was given to modernization through up-gradation of technology by
ensuring the availability of adequate funds under soft loan scheme of IDBI (Industrial
Development Bank of India). The policy removed unnecessary controls and
regulations on the existing units and closure of unviable mills (Roychowdhury, 1995).
While the textile policy of 1985 made some efforts to make the plants more efficient,
the policies skipped off from significant structural changes like elimination of
licenses that would have made the industry more competitive. Further, there were no
changes in the restrictive labour laws and reservation of markets for small-scale firms
which were the key barriers to the capacity expansion to benefit from the economies
of scale.
Economic Reforms of 1991 in India brought some changes in the industrial
policies which sought to deregulate industries and expose firms to international
competition. It represented both a challenge, and an opportunity, to the protected
manufacturing sector.
54
The process of liberalization opened-up textile sector to potential entrants.
Besides eliminating the system of licensing, the textile sector was removed from the
list of reservation for the small scale industries. In 2000, a new textile policy was
announced by the Government with the aim of modernizing the textile industry to
meet the global competition and implemented in a time bound manner with the
technology up-gradation fund scheme covering all manufacturing sectors of the
textile industry. The policy relaxed the restrictions on foreign investment, foreign
technology and foreign equipment to make the domestic industry more efficient and
competitive.
Indian textile industry started to integrate fully with WTO from January 2005.
The system of bilateral quotas regulating global textile industry for many years in the
name of MFA was phased out before 31 December 2004. The MFA was replaced by
the ATC which incorporated a series of stages of phasing out quantitative restrictions,
occurring at the beginning of 1995, 1998, 2002 and 2005, Nagaraj (1989) studied
trends in compound annual growth rates of textile industry during 1986-87 and
concluded that unregistered units recorded a better growth rate 5.8 percent than the
registered units (3.3 percent and entire manufacturing sector recorded a growth of
4.6 percent during the period under review. Porter (1992) made a strong case for
India’s garment sector in the post-MFA regime and cautioned that in garments too,
there is no room for India to be complacent as there will be tough competition from
countries like China, which manufacture in a much larger scale using better
technology. Chandra (1999) recorded that the global textile trade regime changed
drastically from the year 2005 with phase-out of MFA. The implication of the policies
is that firm have been improving their capabilities are the ones that are going to
benefit the most. The study discussed the nature of competition that Indian textile
firms are going to face domestically and globally. Some of the characteristics of
competitive firms that will emerge in the ensuing period are indicated. Landes et al.,
(2005) examined the growth prospects of India’s cotton and textile industries. They
argued that the demand for cotton and man-made fibers of India will increase in
response to rising consumer demand in India and increasing in exports of textiles and
apparel the removal of the Multi-fiber arrangement quotas, and various studies related
to growth have been undertaken. The major studies are from Sasidaran and
Shanmugam, (2008). Kathuriya and Bhardwaj (1998), Bernard Sinclair-Desgagne
55
(2002), Pulapre Balakrishnan and M. Suresh Babu (2003), C. Veeramani (2004),
Ratan Kumar Ghosal (2006), J. Stan Metcalfe, John Foster and Ronnie Ramlogan
(2006), Fulvio Castellacci (2006), L.G.Burange (2006), Sheila Devi (2008),
Nagraj(2008).
Research work pertaining to the impact of economic reforms on growth and
exclusively textiles manufacturing industry were very few and scanty. More over the
studies have not dealt with reform periods except that of Pradeesh (2008) and Nagaraj
(2008) that too in textile industries. Issues and the number of sub-sectors considered
in the estimation of growth and its sources on Indian textile industry is very much
limited and there is hardly any study which considered post-MFA scenario Hence this
study has been undertaken to fill the gap.
The analysis is undertaken in the present study is based on the product groups
which are identified in terms of product codes. The codes and their corresponding
product names are indicated in appendix: 1 . The study examined the performance of
textile industry in terms of growth indicators and product groups.
4.2 Growth Indicators and Product Groups of the Textile Industry
The growth indicators which have been considered to analyze the growth of
the industry in India, are (i) Number of Factories (ii) Gross Fixed Capital Formation
(Gross block) (iii) Employment (number of persons engaged) and (iv) Gross Value
Added (output) in various product groups of the textile industry.
4.2.1 Number of Factories
Increases in the number of factories, against the backdrop of regulation by
government and local bodies on the establishments are bound to throw light on the
implications of reforms. This is the analytical rationale for choosing the number of
factories as a growth indicator in the reform era. In the study, the number of factories
is a taken as real variable. It has got the following limitations.
56
1. Irrespective of the value of assets, size of capital, employment and output, each
unit gets equal weightage which is a serious limitation especially in a
comparative analysis.
2. The status of premises in which the unit is located may also be a limitation.
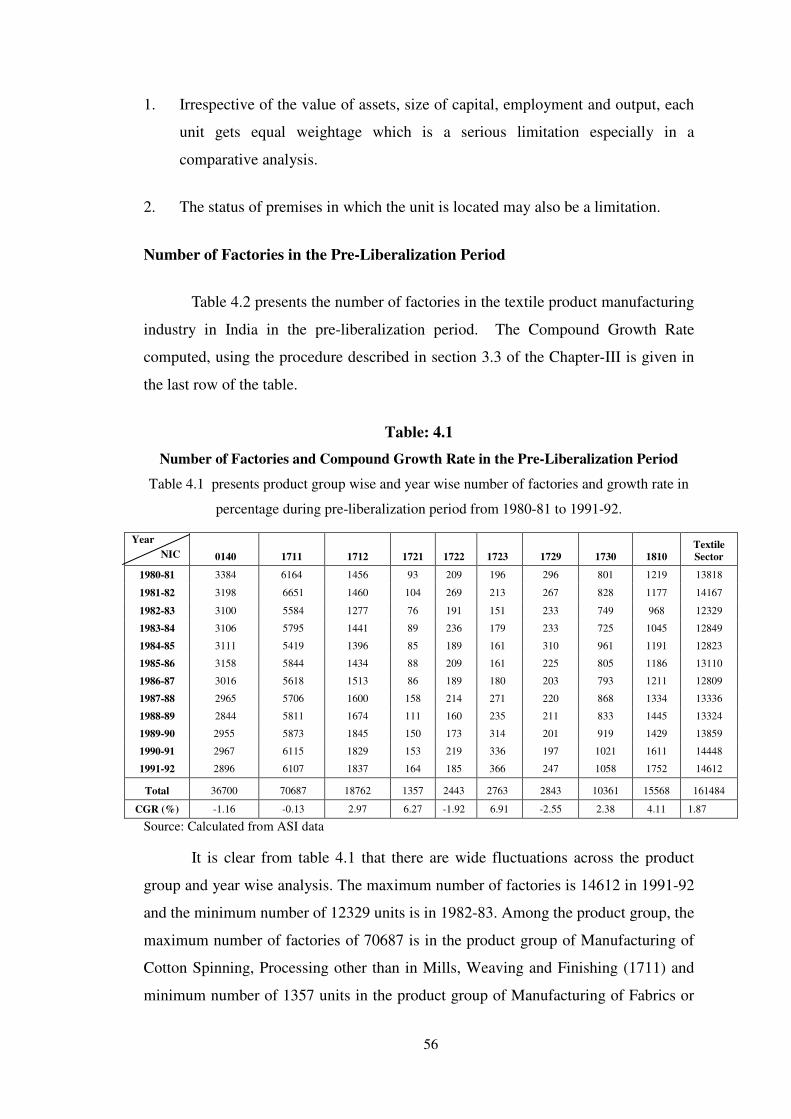
Number of Factories in the Pre-Liberalization Period
Table 4.2 presents the number of factories in the textile product manufacturing
industry in India in the pre-liberalization period. The Compound Growth Rate
computed, using the procedure described in section 3.3 of the Chapter-III is given in
the last row of the table.
Table: 4.1
Number of Factories and Compound Growth Rate in the Pre-Liberalization Period
Table 4.1 presents product group wise and year wise number of factories and growth rate in
percentage during pre-liberalization period from 1980-81 to 1991-92.
Year
NIC 0140 1711 1712 1721 1722 1723 1729 1730 1810
Textile
Sector
1980-81 3384 6164 1456 93 209 196 296 801 1219 13818
1981-82 3198 6651 1460 104 269 213 267 828 1177 14167
1982-83 3100 5584 1277 76 191 151 233 749 968 12329
1983-84 3106 5795 1441 89 236 179 233 725 1045 12849
1984-85 3111 5419 1396 85 189 161 310 961 1191 12823
1985-86 3158 5844 1434 88 209 161 225 805 1186 13110
1986-87 3016 5618 1513 86 189 180 203 793 1211 12809
1987-88 2965 5706 1600 158 214 271 220 868 1334 13336
1988-89 2844 5811 1674 111 160 235 211 833 1445 13324
1989-90 2955 5873 1845 150 173 314 201 919 1429 13859
1990-91 2967 6115 1829 153 219 336 197 1021 1611 14448
1991-92 2896 6107 1837 164 185 366 247 1058 1752 14612
Total 36700 70687 18762 1357 2443 2763 2843 10361 15568 161484
CGR (%) -1.16 -0.13 2.97 6.27 -1.92 6.91 -2.55 2.38 4.11 1.87
Source: Calculated from ASI data
It is clear from table 4.1 that there are wide fluctuations across the product
group and year wise analysis. The maximum number of factories is 14612 in 1991-92
and the minimum number of 12329 units is in 1982-83. Among the product group, the
maximum number of factories of 70687 is in the product group of Manufacturing of
Cotton Spinning, Processing other than in Mills, Weaving and Finishing (1711) and
minimum number of 1357 units in the product group of Manufacturing of Fabrics or
57
Plastic Sheeting, Manufacture of made up Textile Articles (1721). The Compound
Growth Rate in the number of factories during the pre-liberalization period is
estimated to be 1.87 percent. (Bracketed figures show the product code, the details are
given in appendix: 1
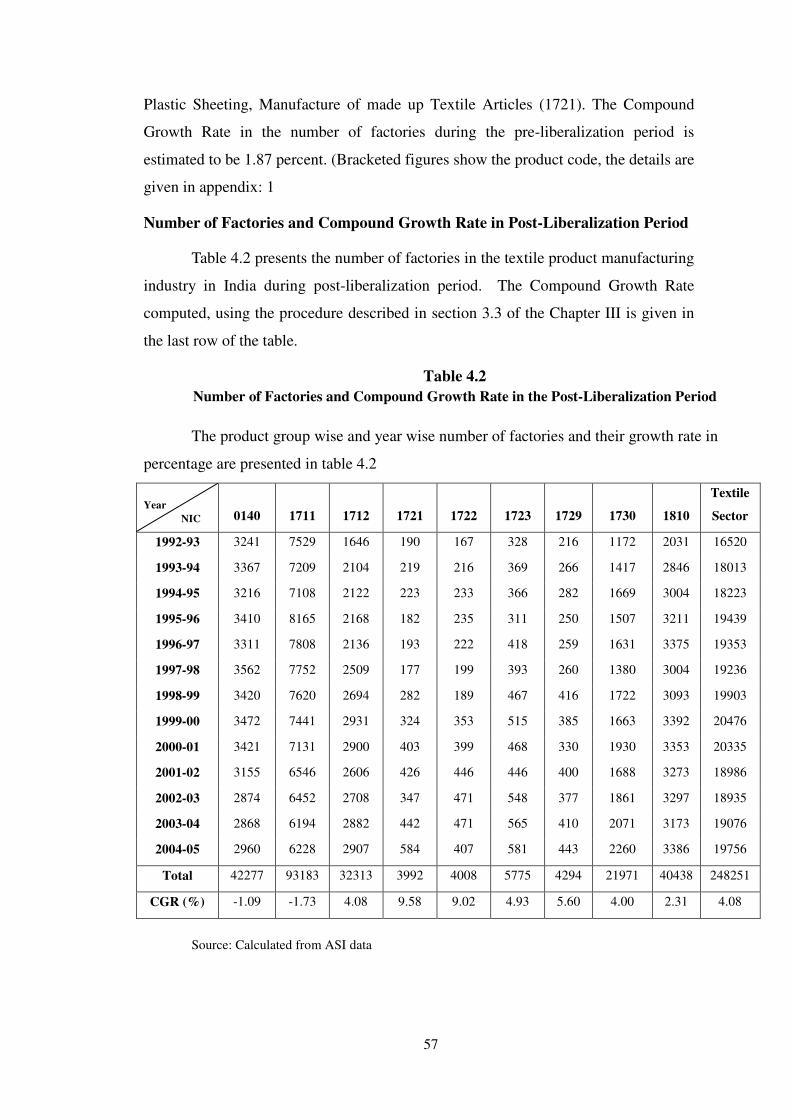
Number of Factories and Compound Growth Rate in Post-Liberalization Period
Table 4.2 presents the number of factories in the textile product manufacturing
industry in India during post-liberalization period. The Compound Growth Rate
computed, using the procedure described in section 3.3 of the Chapter III is given in
the last row of the table.
Table 4.2
Number of Factories and Compound Growth Rate in the Post-Liberalization Period
The product group wise and year wise number of factories and their growth rate in
percentage are presented in table 4.2
Source: Calculated from ASI data
Year
NIC 0140 1711 1712 1721 1722 1723 1729 1730 1810
Textile
Sector
1992-93 3241 7529 1646 190 167 328 216 1172 2031 16520
1993-94 3367 7209 2104 219 216 369 266 1417 2846 18013
1994-95 3216 7108 2122 223 233 366 282 1669 3004 18223
1995-96 3410 8165 2168 182 235 311 250 1507 3211 19439
1996-97 3311 7808 2136 193 222 418 259 1631 3375 19353
1997-98 3562 7752 2509 177 199 393 260 1380 3004 19236
1998-99 3420 7620 2694 282 189 467 416 1722 3093 19903
1999-00 3472 7441 2931 324 353 515 385 1663 3392 20476
2000-01 3421 7131 2900 403 399 468 330 1930 3353 20335
2001-02 3155 6546 2606 426 446 446 400 1688 3273 18986
2002-03 2874 6452 2708 347 471 548 377 1861 3297 18935
2003-04 2868 6194 2882 442 471 565 410 2071 3173 19076
2004-05 2960 6228 2907 584 407 581 443 2260 3386 19756
Total 42277 93183 32313 3992 4008 5775 4294 21971 40438 248251
CGR (%) -1.09 -1.73 4.08 9.58 9.02 4.93 5.60 4.00 2.31 4.08

58
While looking at the growth rate in the number of factories over the years,
1999-2000 recorded maximum number of 20476 units and minimum number of
16520 in 1992-93. Among the product groups, maximum number of 93183 units are
recorded in the product group of Manufacturing of Cotton Spinning, Processing other
than in Mills (1711) and minimum number is in the product group in the
Manufacturing of made up Textile Articles (1721) with 3992 units. It is also seen that
there are product wise and year wise fluctuations in the number of factories. The
Compound Growth Rate in the number of factories in the post liberalization period is
recorded as 4.08 percent.
Number of Factories in the Post -MFA Regime
The number of factories in the textile product manufacturing industry in India
in the post-MFA regime is given in the table 4.3. The Compound Growth Rate
computed, using the procedure described in section 3.3 of the Chapter III is given in
the last row of the table 4.3.
Table: 4.3
Number of Factories and Compound Growth Rate in the Post -MFA Regime
Table 4.3 records the year wise and product group wise number of factories
and their compound growth rate in the post-MFA regime from 2005-06 to 2009-10.
Source: Calculated from ASI data
Year
NIC 0140 1711 1712 1721 1722 1723 1729 1730 1810
Textile
sector
2005-06 3185 7319 3153 490 365 642 376 2259 4438 22227
2006-07 3187 7386 3269 529 376 679 385 2370 4714 22895
2007-08 3190 7453 3390 571 388 717 395 2486 5008 23598
2008-09 3192 7520 3515 617 401 758 404 2609 5320 24336
2009-10 3142 7181 3246 558 387 675 400 2396 4573 22562
Total 15896 36859 16573 2765 1917 3471 1960 12120 24053 115618
CGR (%) -0.25 -0.20 1.32 4.23 1.85 2.14 1.76 2.17 1.83 1.65
59
Among the five year period of the post-MFA regime, the year 2008-09 marked
the maximum number of 24336 factories and the year 2005-06 with the minimum
number 2of 2227 factories. Among the product group, the maximum number of
factories of 36859 is recorded in the product group of Manufacturing of Cotton
Spinning, Processing other than in Mills, Weaving and Finishing of Cotton Textiles
on Handlooms (1711) and the minimum of 1917 factories in the product group of
Manufacturing of Making of Blankets, Shawls, Carpets (1722). The CGR attained during
the Post-MFA regime is 1.65 percent. The complete phasing out of MFA is a
significant policy shift as far as Indian textile industry is concerned.
Number of Factories in the Pre- Liberalization, Post- Liberalization and Post-
MFA Regime
A concise presentation of the growth rate of the number of factories for the
nine product group in the pre-liberalization (1980-81 to 1991-92), post-liberalization
period (1992-93 to 2004-05) and post-MFA regime (2005-06 to 2009-10) has been
made below using the diagram for easy comprehension.
60
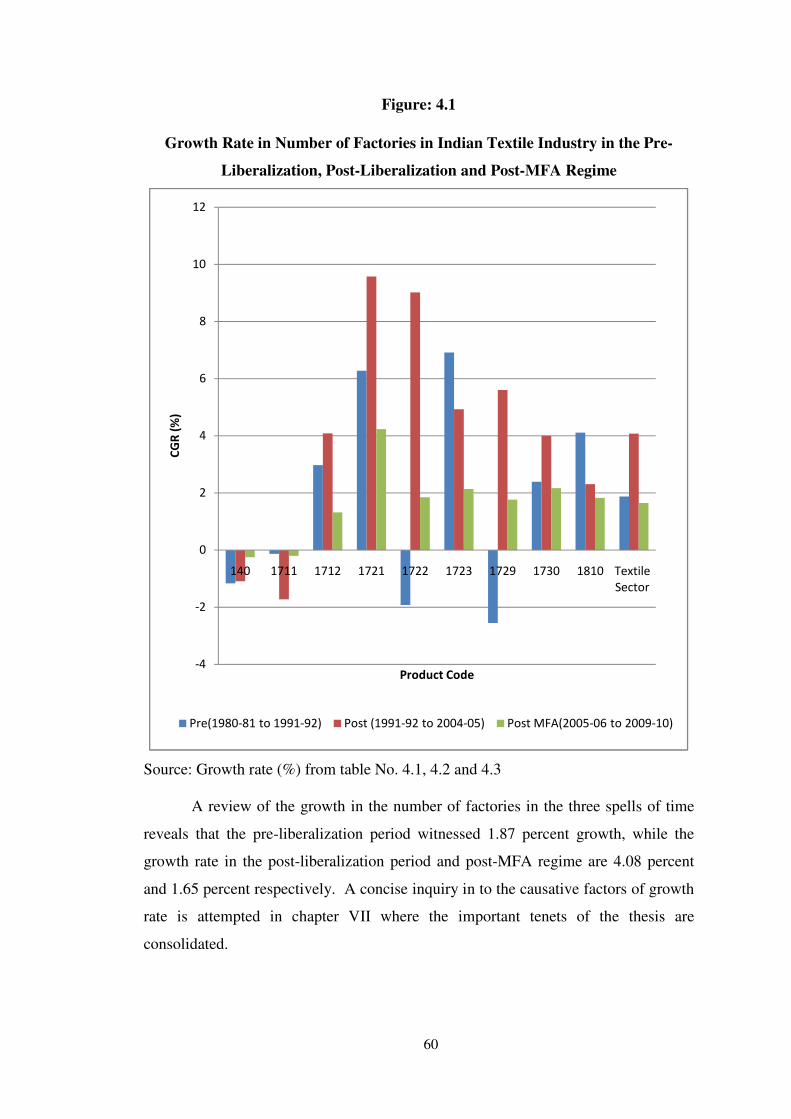
Figure: 4.1
Growth Rate in Number of Factories in Indian Textile Industry in the Pre-
Liberalization, Post-Liberalization and Post-MFA Regime
Source: Growth rate (%) from table No. 4.1, 4.2 and 4.3 A review of the growth in the number of factories in the three spells of time
reveals that the pre-liberalization period witnessed 1.87 percent growth, while the
growth rate in the post-liberalization period and post-MFA regime are 4.08 percent
and 1.65 percent respectively. A concise inquiry in to the causative factors of growth
rate is attempted in chapter VII where the important tenets of the thesis are
consolidated.
-4
-2
0
2
4
6
8
10
12
140 1711 1712 1721 1722 1723 1729 1730 1810 Textile
Sector
CG
R (
%)
Product Code
Pre(1980-81 to 1991-92) Post (1991-92 to 2004-05) Post MFA(2005-06 to 2009-10)

61
4.2.2 Gross Fixed Capital Formation/Gross Block
Uchikawa (2001) has shown that there was a sharp acceleration in gross
investment in the first half of the 1990s. The gross fixed capital stock as per Annual
Survey of Industries (ASI) increased at the rate of 10.1 per cent per annum at 1980-81
year. A regression equation estimated for the time-series of capital stock showed that
a multiplicative dummy for the post-1990 period was significant at the 5 percent
level, confirming the acceleration of investment after the economic reforms.
Mazumdar and Sarkar (2004) showed that there was substantial increase in the
fixed capital of manufacturing industries from Rs. 16.74 lakh crores in 1980-81 to Rs.
239.28 lakh crores in 1995-96 and investment rose from 15.57 percent to 54.92
percent. The index of real capital growth had also zoomed to 280 in 1995-96 from
174 in 1980-81.Rani and Unni (2004) reported that the growth rate in fixed capital of
organized sector for the period from 1989 to 95 was 13.56 per cent and it marginally
declined to 12.09 per cent during 1994-2000. Whereas in the unorganized sector it
was 5.25 percent in 1989-95 and increased to 6.39 percent in 1994-2001. In
particular, the fixed capital growth rate in organized textile industry was 14.75
percent during 1989-95 and declined to 13.29 percent during the period between
1994-2001. The scenario was entirely different in the unorganized sector with 5.62
percent during 1989-95 and 4.28 percent in 1994-2001.Nagaraj (2008) recorded that
the Indian economy turned around after 2002-03, clocking a growth rate of 8.7 per
cent per annum based on an industrial recovery and the growth has been underpinned
by an unprecedented rise in the fixed investment. The India’s fixed investment rate –
gross fixed capital formation (GFCF) as a ratio of domestic output – has gone up by 7
percentage points in five years to reach 33 percent in 2006-07 – up from around 25
percent in the second half of the 1990s. It represents the largest increase in the
investment rate India ever witnessed, taking it close to those attained by the East
Asian Economies in their phase of rapid economic growth. Also the gross fixed
capital formation has risen from 22.8 percent of GDP at current prices in 2001-02 to
35.9 percent in 2006-07.
Thus the emerging hypotheses is that Indian manufacturing sector in general
and Indian textile industry in particular showed more inclination towards capital
intensification especially in a liberalized environment and this section seeks to
explore that hypothesis.
62
In this section the average annual trend growth in gross fixed capital
formation and its acceleration/deceleration in Indian textile industry in the pre-
liberalization period, post-liberalization period and post-MFA period is discussed.
Gross Fixed Capital Formation in the Pre-Liberalization Period
The gross fixed capital formation expressed in lakhs of rupees in 9 textile
product manufacturing industry in India in pre-liberalization period is presented in
table 4.4 The Compound Growth Rate (GCR) computed using the methods briefly
described in section 3.3 of the Chapter III is given in the last row of the table
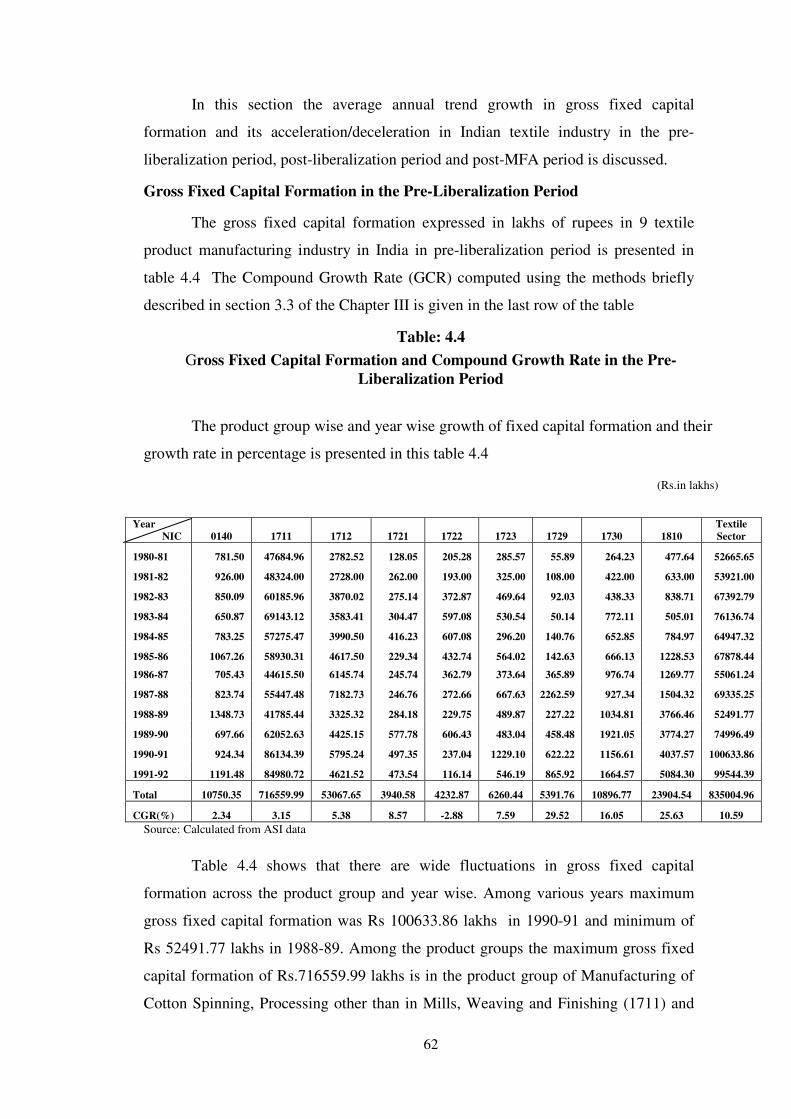
Table: 4.4
Gross Fixed Capital Formation and Compound Growth Rate in the Pre-
Liberalization Period
The product group wise and year wise growth of fixed capital formation and their
growth rate in percentage is presented in this table 4.4
(Rs.in lakhs)
Source: Calculated from ASI data
Table 4.4 shows that there are wide fluctuations in gross fixed capital
formation across the product group and year wise. Among various years maximum
gross fixed capital formation was Rs 100633.86 lakhs in 1990-91 and minimum of
Rs 52491.77 lakhs in 1988-89. Among the product groups the maximum gross fixed
capital formation of Rs.716559.99 lakhs is in the product group of Manufacturing of
Cotton Spinning, Processing other than in Mills, Weaving and Finishing (1711) and
Year
NIC 0140 1711 1712 1721 1722 1723 1729 1730 1810
Textile
Sector
1980-81 781.50 47684.96 2782.52 128.05 205.28 285.57 55.89 264.23 477.64 52665.65
1981-82 926.00 48324.00 2728.00 262.00 193.00 325.00 108.00 422.00 633.00 53921.00
1982-83 850.09 60185.96 3870.02 275.14 372.87 469.64 92.03 438.33 838.71 67392.79
1983-84 650.87 69143.12 3583.41 304.47 597.08 530.54 50.14 772.11 505.01 76136.74
1984-85 783.25 57275.47 3990.50 416.23 607.08 296.20 140.76 652.85 784.97 64947.32
1985-86 1067.26 58930.31 4617.50 229.34 432.74 564.02 142.63 666.13 1228.53 67878.44
1986-87 705.43 44615.50 6145.74 245.74 362.79 373.64 365.89 976.74 1269.77 55061.24
1987-88 823.74 55447.48 7182.73 246.76 272.66 667.63 2262.59 927.34 1504.32 69335.25
1988-89 1348.73 41785.44 3325.32 284.18 229.75 489.87 227.22 1034.81 3766.46 52491.77
1989-90 697.66 62052.63 4425.15 577.78 606.43 483.04 458.48 1921.05 3774.27 74996.49
1990-91 924.34 86134.39 5795.24 497.35 237.04 1229.10 622.22 1156.61 4037.57 100633.86
1991-92 1191.48 84980.72 4621.52 473.54 116.14 546.19 865.92 1664.57 5084.30 99544.39
Total 10750.35 716559.99 53067.65 3940.58 4232.87 6260.44 5391.76 10896.77 23904.54 835004.96
CGR(%) 2.34 3.15 5.38 8.57 -2.88 7.59 29.52 16.05 25.63 10.59
63
minimum of Rs 3940.58 lakhs for the product group of Manufacturing of Fabrics or
Plastic Sheeting, Manufacture of made up Textile Articles (1721). The Compound
Growth Rate in the gross fixed capital formation in the pre-liberalization period is
estimated to be 10.59 percent.
Gross Fixed Capital Formation and Compound Growth Rate in the Post-
Liberalization Period
The gross fixed capital formation expressed in lakhs of rupees in the 9 textile
product manufacturing industry in India in the post-liberalization period is presented
in table 4.5. The Compound Growth Rate has been computed using the methods
briefly described in section 3.3 of the chapter III and is given in the last row of the
table 4.5.
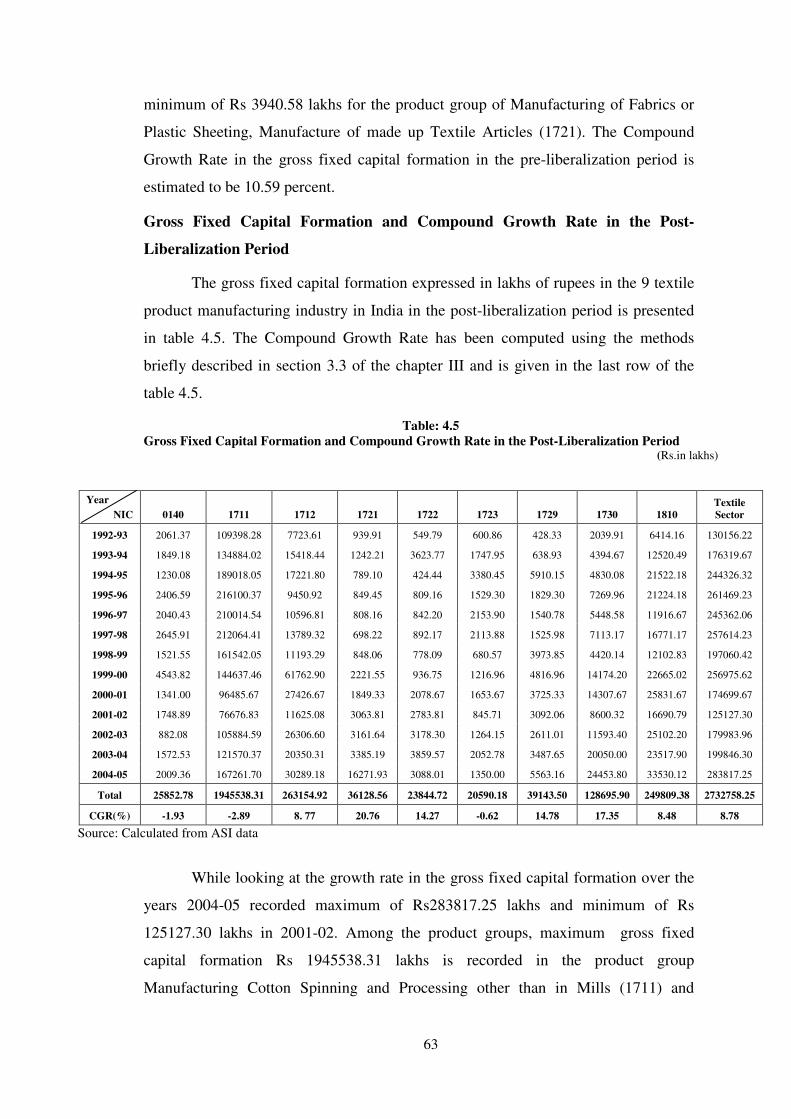
Table: 4.5
Gross Fixed Capital Formation and Compound Growth Rate in the Post-Liberalization Period (Rs.in lakhs)
Source: Calculated from ASI data
While looking at the growth rate in the gross fixed capital formation over the
years 2004-05 recorded maximum of Rs283817.25 lakhs and minimum of Rs
125127.30 lakhs in 2001-02. Among the product groups, maximum gross fixed
capital formation Rs 1945538.31 lakhs is recorded in the product group
Manufacturing Cotton Spinning and Processing other than in Mills (1711) and
Year
NIC 0140 1711 1712 1721 1722 1723 1729 1730 1810
Textile
Sector
1992-93 2061.37 109398.28 7723.61 939.91 549.79 600.86 428.33 2039.91 6414.16 130156.22
1993-94 1849.18 134884.02 15418.44 1242.21 3623.77 1747.95 638.93 4394.67 12520.49 176319.67
1994-95 1230.08 189018.05 17221.80 789.10 424.44 3380.45 5910.15 4830.08 21522.18 244326.32
1995-96 2406.59 216100.37 9450.92 849.45 809.16 1529.30 1829.30 7269.96 21224.18 261469.23
1996-97 2040.43 210014.54 10596.81 808.16 842.20 2153.90 1540.78 5448.58 11916.67 245362.06
1997-98 2645.91 212064.41 13789.32 698.22 892.17 2113.88 1525.98 7113.17 16771.17 257614.23
1998-99 1521.55 161542.05 11193.29 848.06 778.09 680.57 3973.85 4420.14 12102.83 197060.42
1999-00 4543.82 144637.46 61762.90 2221.55 936.75 1216.96 4816.96 14174.20 22665.02 256975.62
2000-01 1341.00 96485.67 27426.67 1849.33 2078.67 1653.67 3725.33 14307.67 25831.67 174699.67
2001-02 1748.89 76676.83 11625.08 3063.81 2783.81 845.71 3092.06 8600.32 16690.79 125127.30
2002-03 882.08 105884.59 26306.60 3161.64 3178.30 1264.15 2611.01 11593.40 25102.20 179983.96
2003-04 1572.53 121570.37 20350.31 3385.19 3859.57 2052.78 3487.65 20050.00 23517.90 199846.30
2004-05 2009.36 167261.70 30289.18 16271.93 3088.01 1350.00 5563.16 24453.80 33530.12 283817.25
Total 25852.78 1945538.31 263154.92 36128.56 23844.72 20590.18 39143.50 128695.90 249809.38 2732758.25
CGR(%) -1.93 -2.89 8. 77 20.76 14.27 -0.62 14.78 17.35 8.48 8.78
64
minimum gross fixed capital formation among the product group is in the
Manufacturing of Making of Blankets and Shawls (1723) with Rs 20590.18 lakhs. It is
also seen that there are product wise and year wise fluctuation in the gross fixed
capital formation. The Compound Growth Rate in the gross fixed capital formation
in the post- liberalization period is recorded as 8.78 percent.
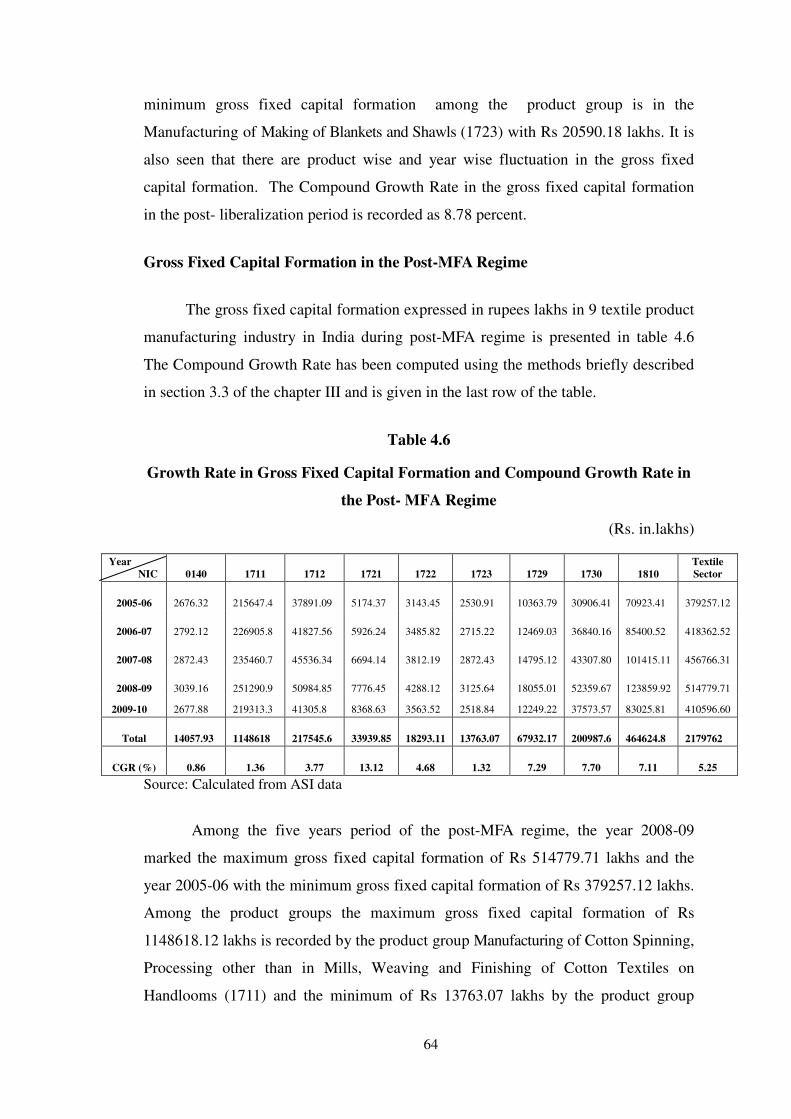
Gross Fixed Capital Formation in the Post-MFA Regime
The gross fixed capital formation expressed in rupees lakhs in 9 textile product
manufacturing industry in India during post-MFA regime is presented in table 4.6
The Compound Growth Rate has been computed using the methods briefly described
in section 3.3 of the chapter III and is given in the last row of the table.
Table 4.6
Growth Rate in Gross Fixed Capital Formation and Compound Growth Rate in
the Post- MFA Regime
(Rs. in.lakhs)
Year
NIC 0140 1711 1712 1721 1722 1723 1729 1730 1810
Textile
Sector
2005-06 2676.32 215647.4 37891.09 5174.37 3143.45 2530.91 10363.79 30906.41 70923.41 379257.12
2006-07 2792.12 226905.8 41827.56 5926.24 3485.82 2715.22 12469.03 36840.16 85400.52 418362.52
2007-08 2872.43 235460.7 45536.34 6694.14 3812.19 2872.43 14795.12 43307.80 101415.11 456766.31
2008-09 3039.16 251290.9 50984.85 7776.45 4288.12 3125.64 18055.01 52359.67 123859.92 514779.71
2009-10 2677.88 219313.3 41305.8 8368.63 3563.52 2518.84 12249.22 37573.57 83025.81 410596.60
Total 14057.93 1148618 217545.6 33939.85 18293.11 13763.07 67932.17 200987.6 464624.8 2179762
CGR (%) 0.86 1.36 3.77 13.12 4.68 1.32 7.29 7.70 7.11 5.25
Source: Calculated from ASI data
Among the five years period of the post-MFA regime, the year 2008-09
marked the maximum gross fixed capital formation of Rs 514779.71 lakhs and the
year 2005-06 with the minimum gross fixed capital formation of Rs 379257.12 lakhs.
Among the product groups the maximum gross fixed capital formation of Rs
1148618.12 lakhs is recorded by the product group Manufacturing of Cotton Spinning,
Processing other than in Mills, Weaving and Finishing of Cotton Textiles on
Handlooms (1711) and the minimum of Rs 13763.07 lakhs by the product group
65
Manufacturing of all types of Threads, Cordage, Ropes, Twines and Nets etc (1723).
The CGR attained during the Post-MFA regime is 5.25 percent. The complete phasing
out of MFA is a significant policy shift as far as Indian textile industry is concerned.
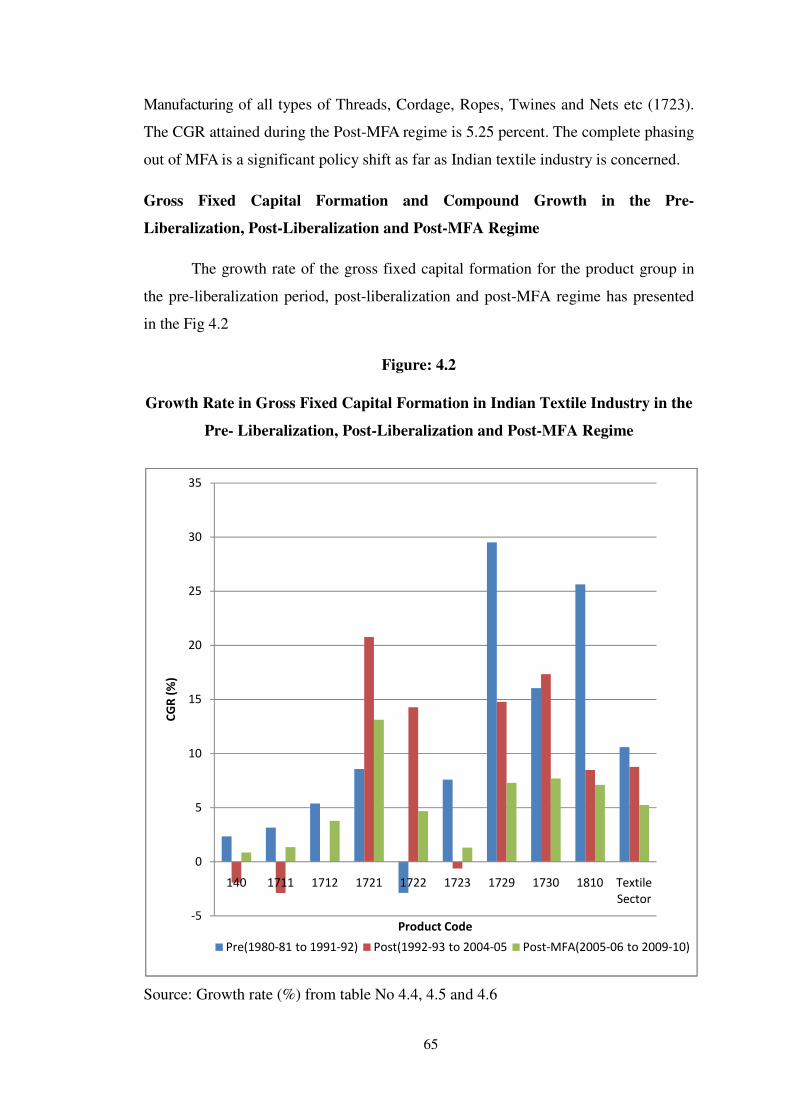
Gross Fixed Capital Formation and Compound Growth in the Pre-
Liberalization, Post-Liberalization and Post-MFA Regime
The growth rate of the gross fixed capital formation for the product group in
the pre-liberalization period, post-liberalization and post-MFA regime has presented
in the Fig 4.2
Figure: 4.2
Growth Rate in Gross Fixed Capital Formation in Indian Textile Industry in the
Pre- Liberalization, Post-Liberalization and Post-MFA Regime
Source: Growth rate (%) from table No 4.4, 4.5 and 4.6
-5
0
5
10
15
20
25
30
35
140 1711 1712 1721 1722 1723 1729 1730 1810 Textile
Sector
CG
R (
%)
Product Code
Pre(1980-81 to 1991-92) Post(1992-93 to 2004-05 Post-MFA(2005-06 to 2009-10)
66
Gross Fixed Capital Formation growth rate in the pre- liberalization, post-
liberalizationand post-MFA regime is given figure 4.2 Growth rate for the period of
pre-liberalization is 10.59 percent, for the post-liberalization period it is 8.78 percent
and post-MFA regime recorded 5.25 percent.
4.2.3 Employment
There is unanimity amongst the scholars that the organized manufacturing
sector registered “jobless growth” during the period from1980-81 to 1990-91. While
the average annual rate of growth of gross value added during this period was about
8.66 percent the corresponding average annual employment growth was merely 0.53
percent. The resultant employment elasticity was 0.06 (Kannan and Raveendran,
2009).
The employment stagnation in the 1980s was also confirmed by the studies of
World Bank (1989), Fallon and Lucas (1993), Papola (1994), Ghose (1994), Nagaraj
(1994), Kannan (1994) Bhalotra (1998), Dutta Roy (1998) and Goldar (2000).
The growth of employment in the organized manufacturing sector during the
1990’s has also been analyzed by a number of researchers and the general consensus
has been that employment growth picked up considerably during the first half of the
1990s. Goldar (2000) showed that employment in the organized manufacturing sector
registered an impressive growth of 4.03 percent during the period from 1990-91 to
1995-96 comparing favorably with the growth rate achieved in the 1970s (3.8 per
cent). Kannan and Raveendran, (2009) again argue that for the period as a whole as
well as for two separate periods – the pre and post reform phases – the picture that
emerges is one of “jobless growth”. One set of industries was characterized by
employment creating growth while another set by employment displacing growth.
Over this period there has been acceleration in capital intensity at the expense of
employment generation.
Many studies argued that the effects of economic reforms on the employment
situation in India have been pessimistic in the post-reform period also (Mundle 1992,
1993; Deshpande 1992; Bhattacharya and Mitra 1993, Agarwal and Goldar 1995;
Kundu 1997). The impression that one would gather from these studies about the
prospects of employment growth in manufacturing in the post-reform period is
67
proven to be wrong by the marked acceleration that has taken place in employment
growth in organized manufacturing in the 1990s.
This is the background against which this section examines the employment
implications of growth performance in terms of growth in employment so as to
further probe the “jobless growth” phenomenon reported for earlier but shorter
periods and to subject the examination of the growth and employment performance in
terms of product groups to find if there are any discernible patterns in Indian textile
industry.
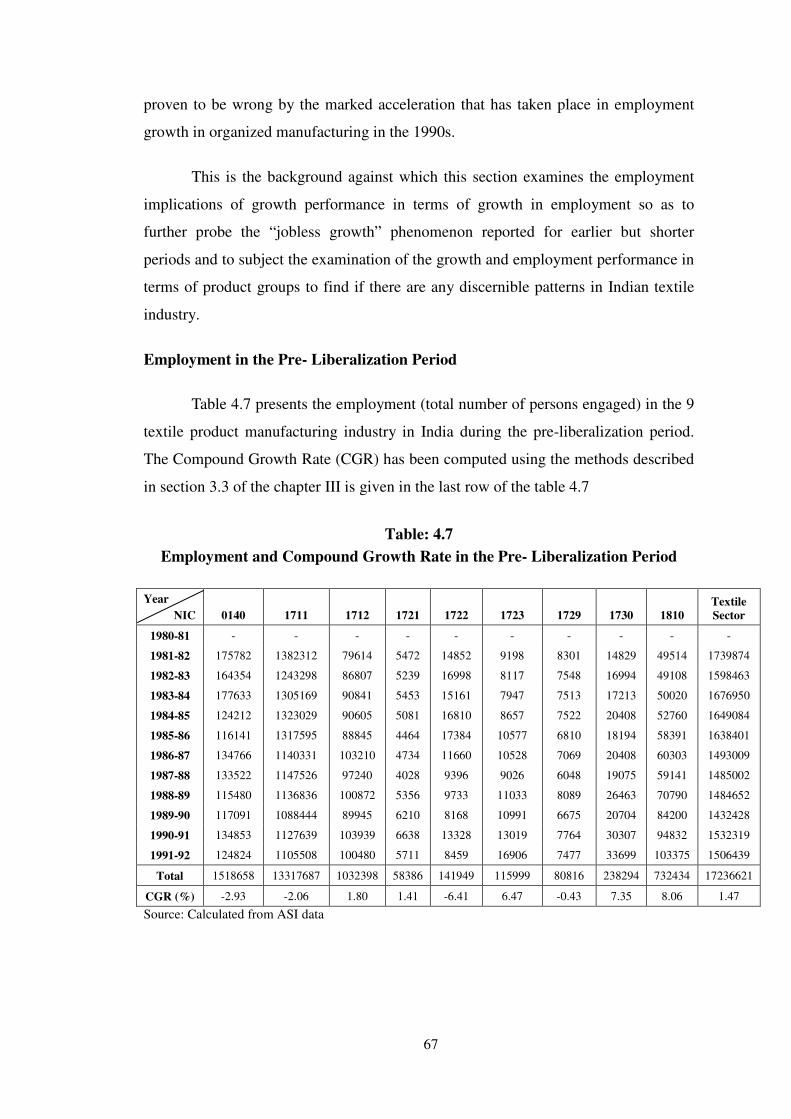
Employment in the Pre- Liberalization Period
Table 4.7 presents the employment (total number of persons engaged) in the 9
textile product manufacturing industry in India during the pre-liberalization period.
The Compound Growth Rate (CGR) has been computed using the methods described
in section 3.3 of the chapter III is given in the last row of the table 4.7
Table: 4.7
Employment and Compound Growth Rate in the Pre- Liberalization Period
Source: Calculated from ASI data
Year
NIC 0140 1711 1712 1721 1722 1723 1729 1730 1810
Textile
Sector
1980-81 - - - - - - - - - -
1981-82 175782 1382312 79614 5472 14852 9198 8301 14829 49514 1739874
1982-83 164354 1243298 86807 5239 16998 8117 7548 16994 49108 1598463
1983-84 177633 1305169 90841 5453 15161 7947 7513 17213 50020 1676950
1984-85 124212 1323029 90605 5081 16810 8657 7522 20408 52760 1649084
1985-86 116141 1317595 88845 4464 17384 10577 6810 18194 58391 1638401
1986-87 134766 1140331 103210 4734 11660 10528 7069 20408 60303 1493009
1987-88 133522 1147526 97240 4028 9396 9026 6048 19075 59141 1485002
1988-89 115480 1136836 100872 5356 9733 11033 8089 26463 70790 1484652
1989-90 117091 1088444 89945 6210 8168 10991 6675 20704 84200 1432428
1990-91 134853 1127639 103939 6638 13328 13019 7764 30307 94832 1532319
1991-92 124824 1105508 100480 5711 8459 16906 7477 33699 103375 1506439
Total 1518658 13317687 1032398 58386 141949 115999 80816 238294 732434 17236621
CGR (%) -2.93 -2.06 1.80 1.41 -6.41 6.47 -0.43 7.35 8.06 1.47
68
It is clear from the table 4.7 that there are wide fluctuations across the product
group and year wise. The aggregate employment in terms of total number of persons
engaged is 1739874 in 1981-82 which is the maximum and the minimum number of
persons engaged is 1432428 in 1989-90. Among the product group the maximum
number of persons engaged is 13317687 in the product group of the Manufacturing
of Cotton Spinning and Processing other than in Mills (1711) and minimum number
of person engaged is 58386 for the product group of Manufacturing of Fabrics or
Plastic Sheeting, Manufacture of made up Textile Articles (1721). The Compound
Growth Rate in the number of people engaged during the pre-liberalization period is
estimated to be 1.47 percent.
Employment in the Post- Liberalization Period
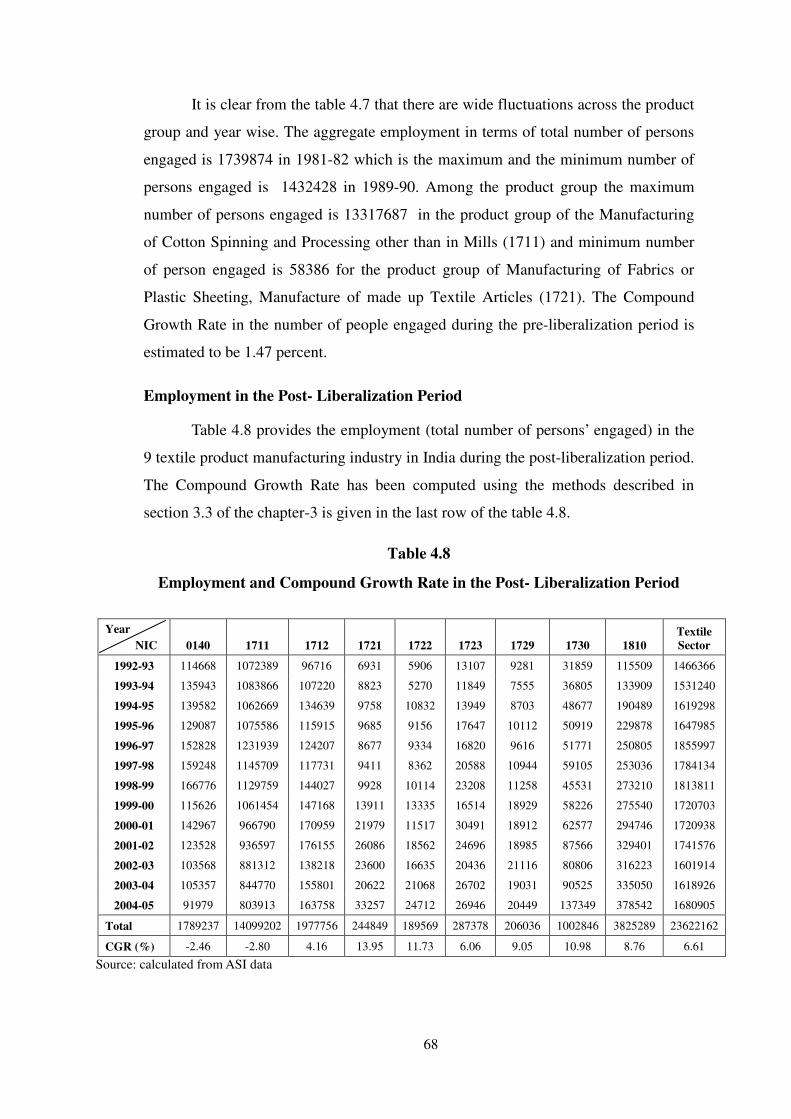
Table 4.8 provides the employment (total number of persons’ engaged) in the
9 textile product manufacturing industry in India during the post-liberalization period.
The Compound Growth Rate has been computed using the methods described in
section 3.3 of the chapter-3 is given in the last row of the table 4.8.
Table 4.8
Employment and Compound Growth Rate in the Post- Liberalization Period
Source: calculated from ASI data
Year
NIC 0140 1711 1712 1721 1722 1723 1729 1730 1810
Textile
Sector
1992-93 114668 1072389 96716 6931 5906 13107 9281 31859 115509 1466366
1993-94 135943 1083866 107220 8823 5270 11849 7555 36805 133909 1531240
1994-95 139582 1062669 134639 9758 10832 13949 8703 48677 190489 1619298
1995-96 129087 1075586 115915 9685 9156 17647 10112 50919 229878 1647985
1996-97 152828 1231939 124207 8677 9334 16820 9616 51771 250805 1855997
1997-98 159248 1145709 117731 9411 8362 20588 10944 59105 253036 1784134
1998-99 166776 1129759 144027 9928 10114 23208 11258 45531 273210 1813811
1999-00 115626 1061454 147168 13911 13335 16514 18929 58226 275540 1720703
2000-01 142967 966790 170959 21979 11517 30491 18912 62577 294746 1720938
2001-02 123528 936597 176155 26086 18562 24696 18985 87566 329401 1741576
2002-03 103568 881312 138218 23600 16635 20436 21116 80806 316223 1601914
2003-04 105357 844770 155801 20622 21068 26702 19031 90525 335050 1618926
2004-05 91979 803913 163758 33257 24712 26946 20449 137349 378542 1680905
Total 1789237 14099202 1977756 244849 189569 287378 206036 1002846 3825289 23622162
CGR (%) -2.46 -2.80 4.16 13.95 11.73 6.06 9.05 10.98 8.76 6.61
69
The table 4.8 shows that there are wide fluctuations across the product group
and in different years during the post-liberalization period. The aggregate
employment in terms of total number persons engaged among the years, maximum
number of persons engaged is 1855997 in 1996-97 and minimum number of persons
engaged is 1466366 in 1992-93. Among the product group the maximum number of
persons engaged is 14099202 in the product group of Manufacturing of Cotton
Spinning, Processing other than in Mills (1711) and minimum number of person
engaged is 189569 for the product group of Manufacturing of Fabrics or Plastic
Sheeting, Manufacturing of Making of Blankets and Shawls (1722). The Compound
Growth Rate in the number of persons engaged during the post-liberalization period is
estimated to be 6.61 percent.
Employment in the post- MFA Regime
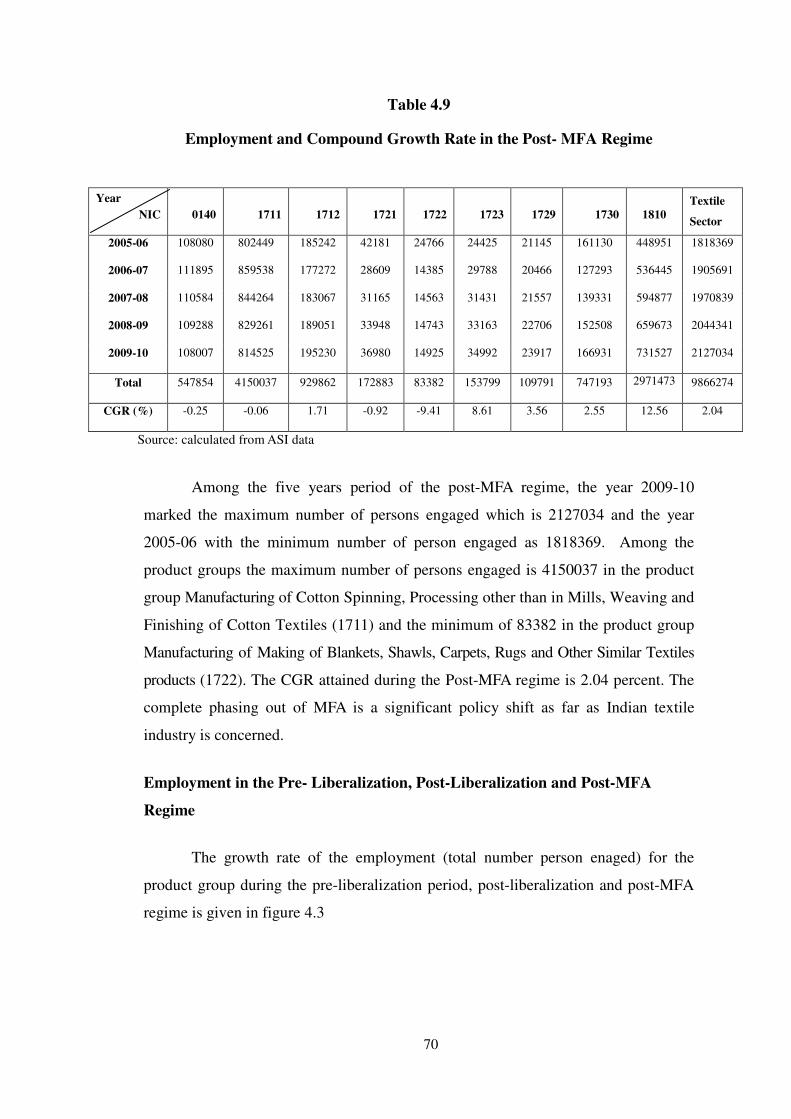
Table 4.9 presents the employment (total number of persons engaged) in the 9
textile product manufacturing industry in India during the post-MFA regime. The
Compound Growth Rate has been computed using the methods described in section
3.3 of the chapter III is given in the last row of the table 4.9.
70
Table 4.9
Employment and Compound Growth Rate in the Post- MFA Regime
Source: calculated from ASI data
Among the five years period of the post-MFA regime, the year 2009-10
marked the maximum number of persons engaged which is 2127034 and the year
2005-06 with the minimum number of person engaged as 1818369. Among the
product groups the maximum number of persons engaged is 4150037 in the product
group Manufacturing of Cotton Spinning, Processing other than in Mills, Weaving and
Finishing of Cotton Textiles (1711) and the minimum of 83382 in the product group
Manufacturing of Making of Blankets, Shawls, Carpets, Rugs and Other Similar Textiles
products (1722). The CGR attained during the Post-MFA regime is 2.04 percent. The
complete phasing out of MFA is a significant policy shift as far as Indian textile
industry is concerned.
Employment in the Pre- Liberalization, Post-Liberalization and Post-MFA
Regime
The growth rate of the employment (total number person enaged) for the
product group during the pre-liberalization period, post-liberalization and post-MFA
regime is given in figure 4.3
Year
NIC 0140 1711 1712 1721 1722 1723 1729 1730 1810
Textile
Sector
2005-06 108080 802449 185242 42181 24766 24425 21145 161130 448951 1818369
2006-07 111895 859538 177272 28609 14385 29788 20466 127293 536445 1905691
2007-08 110584 844264 183067 31165 14563 31431 21557 139331 594877 1970839
2008-09 109288 829261 189051 33948 14743 33163 22706 152508 659673 2044341
2009-10 108007 814525 195230 36980 14925 34992 23917 166931 731527 2127034
Total 547854 4150037 929862 172883 83382 153799 109791 747193 2971473 9866274
CGR (%) -0.25 -0.06 1.71 -0.92 -9.41 8.61 3.56 2.55 12.56 2.04

71
Figure: 4.3
Growth Rate in Employment in Indian Textile industry in the Pre-
Liberalization, Post-Liberalization and Post-MFA regime
Source: Growth rate (%) from table No 4.7, 4.8 and 4.9
The analysis of growth rate in employment for the pre- liberalization (1980-81
to 1991-92), post-liberalization (1991-92 to 2004-05) and post-MFA regime (2005-06
to 2009-10) shows that they are 1.47 percent and 6.67 percent and 20.04 percent
respectively.
-15
-10
-5
0
5
10
15
20
140 1711 1712 1721 1722 1723 1729 1730 1810 Textile
Sector
CG
R (
%)
Product code
Pre (1980-81 to 1991-92) Post (1992-93 to 2004-05) Post-MFA 2005-06 to 2009-10
72
4.2.4 Gross Value Added (Output)
Uchikawa (1999) observed that the growth rate of gross value added (GVA) is
a good indicator of market conditions. As rapid growth of GVA in an industry
generates an expectation that the industry will grow in the future, investment in the
industry will increase. Gross value added and gross fixed capital formation of textile
products including wearing apparel industry had grown throughout the 1980s and
their growth rates of GVA and GFCF accelerated in the 1990s. Goldar (2000) studied
the growth rate of gross value added (at constant prices) for different two-digit
industries have reported that the growth rate of GVA in Indian manufacturing sector
was 8.67 percent in 1980s and marginally declined to 7.43 percent in the 1990s. The
rate of growth in Indian textile products was 10.44 per cent during 1990-97 as
compared to 14.63 per cent during 1980s.
Balakrishnan and Babu (2003) found that the annual average rate of growth in
the nineties had risen almost across the board at two digit level of industry.
Nevertheless, they argued that the acceleration is not particularly impressive for what
is often hailed as the most significant policy regime shift since 1950. Rani and Unni
(2004) have shown that value added in the organized manufacturing sector registered
an impressive growth rate of 8.25 per cent during 1989-95 as compared to 1984-90 at
7.20 per cent and 1994-2000 at 6.94 per cent. Whereas in the unorganized sector it
was negative 0.99 per cent in 1989-95 and increased to 6.92 per cent in 1994-2001.
The growth rate in organized textile industry was 6.41 per cent during 1989-95 and
declined to 2.86 per cent in 1994-2000. In the unorganized textile industry growth in
value added was (-2.88) per cent in 1989-95 and it grew by 6.26 percent in 1994-
2001.The analysis indicates that economic reform policies have differential impact on
various industry groups.
Nagaraj’s (2003) findings show that while the total manufacturing gross value
added grew at over 8 per cent per annum in real terms during 1981-87, the registered
manufacturing segment recorded a growth over 10 per cent per annum with reference
to National Account Statistics (NAS) data 1989.
Further, it is observed that, since 1980-81 output in the manufacturing sector
has grown at 7 per cent per year. Nagaraj (2003) It is further records that, industrial
73
output growth during the last two decades has improved compared to the previous
period of relative stagnation. But contrary to both the euphoria and apprehension with
the acceleration of reforms there has been little change in the trend growth rate of
output in the 1990s compared to the previous decade. Moreover, since the mid 1990s,
there are distinct signs of a slowdown in growth for seven years now and “stalled”
reforms since the mid-1990s are widely believed to be responsible for the industrial
deceleration. Balakrishnan (2005) does not provide any support for his argument
about acceleration in the rate of growth during the post-reform period. Kaur (2007)
argued that there is no denying the fact that reforms ushered in a new era of growth
and development. The liberalized policies adopted since 1991-92 not only accelerated
the overall growth rates but also develop the confidence of foreign investors in the
Indian industry. Kannan and Raveendran (2009) pointed out that, in terms of output
growth, all the manufacturing industries seem to have done quite well, and many of
them registered double digit growth rates during the post-reform period. Unlike in the
case of employment, no polarization is discernible. The growth rate of GVA in Indian
textile industry was 4.33 per cent for the period from 1981-82 to 1991-92 and
increased to 5.34 per cent in the period beween1992-93 to 2004-05.
As opposed to the common view that acceleration in average growth is
credited to policy reforms initiated in 1991, Delong (2004) argued that acceleration
began in the early or mid 1980s could not be due to policy in initiatives, though it is
further admitted that the rapid growth in the second half of the 1980’s could not be
sustained without the second wave of reforms of the 1990’s. Rodrik (2004) joins
Delong in stating that the reforms undertakes in the 1990’s cannot be accepted as a
turning point in the Indian manufacturing.
As the debate continues for and against the positive impact of reforms on the
growth of acceleration of Indian manufacturing industries, the present study re-
examine the issues with reference to Indian textile industry.
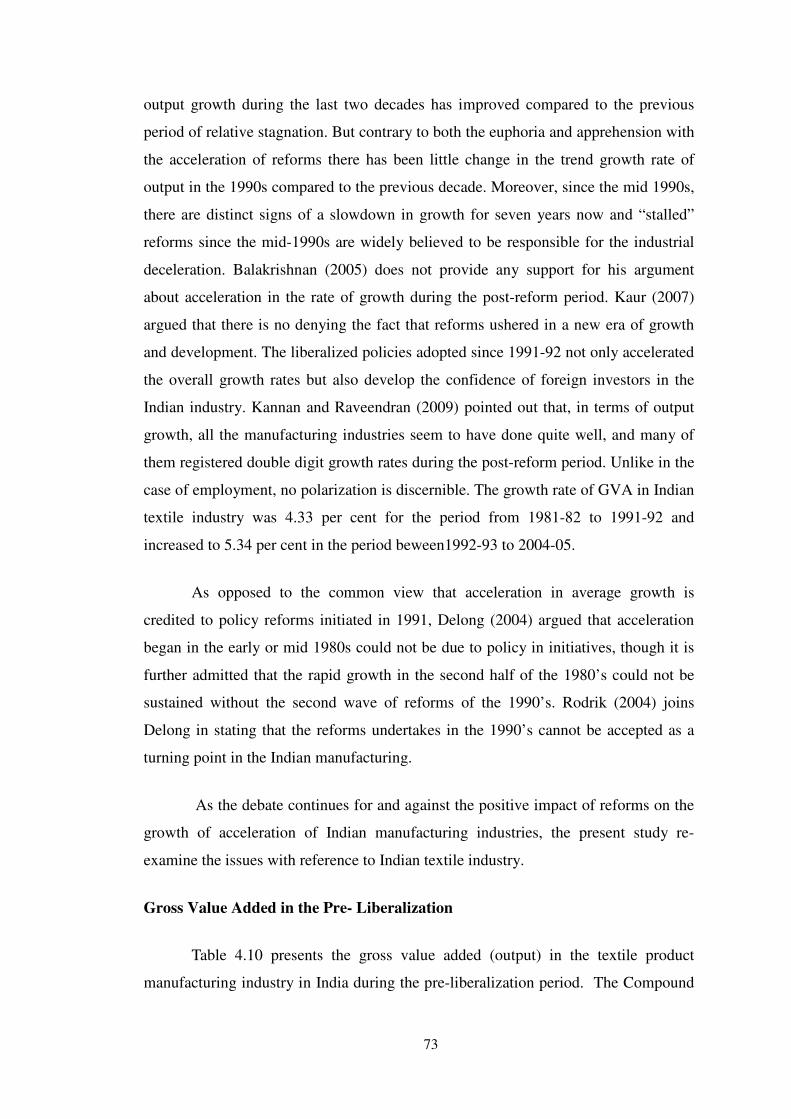
Gross Value Added in the Pre- Liberalization
Table 4.10 presents the gross value added (output) in the textile product
manufacturing industry in India during the pre-liberalization period. The Compound
74
Growth Rate (CGR) has been computed using the methods described in section 3.3 of
the chapter-3 is given in the last row of the table 4.10.
Table: 4.10
Gross Value Added and Compound Growth Rate in the Pre- Liberalization Period
(Rs. in.Lakhs)
Source: Calculated from ASI data
It is clear from the table 4.10 that there are wide fluctuations of gross fixed
capital formation across the product group and year wise. Among the various years
maximum gross value added was Rs 384145.3 lakhs in 1990-91 and minimum of Rs
229532.7 lakhs in 1981-82. Among the product group the maximum gross value
added is Rs.2773155.66 lakhs in the product group of Manufacturing of Cotton
Spinning, Processing other than in Mills, Weaving and Finishing (1711) and the
minimum of Rs 17068.2 lakhs for the product group of Manufacturing of Embroidery
Work, Zari Work and Making ornamental Trimmings (1729). The Compound Growth
Rate in the gross value in the pre-liberalization period is estimated to be 8.09 percent.
Year
NIC 140 1711 1712 1721 1722 1723 1729 1730 1810
Textile
Sector
1980-81 4176.41 207716.73 9644.15 1140.12 1720.77 1830.65 1046.37 2120.97 5116.94 234513.1
1981-82 4081.89 197547.12 12004.65 1194.76 2457.38 1928.34 1136.92 3331,09 5854.65 229532.7
1982-83 5337.6 197128.94 11999.02 1100.39 2894.69 2261.81 1175.2 3387.8 6684.06 231969.5
1983-84 9292.68 232136.96 14090.06 1078.8 2254.22 2652.91 1143.53 4891.18 6541.28 274081.6
1984-85 5596.55 213857.03 13821.69 2130.65 2453.57 5950.7 1078.88 3703.37 8805.26 257397.7
1985-86 6819.8 205498.07 16335.65 999.23 1942.77 2757.93 1015.47 4304.72 8563.81 248237.4
1986-87 6515.2 232116.13 18134.06 1223.69 1957.91 2886.2 1195.64 3844.12 11226.81 279099.8
1987-88 7408.08 205475.63 20047.35 1490.25 1605.15 3299.44 1377.44 4626.04 14944.99 260274.4
1988-89 8585.9 212694.78 14797.36 1666.46 1683.45 2908.75 1425.42 6307.11 19681.56 269750.8
1989-90 7564.54 291561.57 20753.72 2164.78 2748.36 3333.14 2096.97 9759.07 24529.45 364511.6
1990-91 7829.47 306020 19852.11 1967.37 3564.21 4857.89 1515.26 9718.42 28820.53 384145.3
1991-92 8793.55 271402.82 21640.99 2749.75 2743.71 3710.47 2862.03 10375.63 39849.95 364128.9
Total 82000.78 2773155.66 193120.2 18905.49 28025.81 38377.89 17068.21 66369.43 180618.6 3397642
CGR (%) 6.08 3.26 6.76 7.32 1.90 6.32 7.13 13.54 20.52 8.09
75
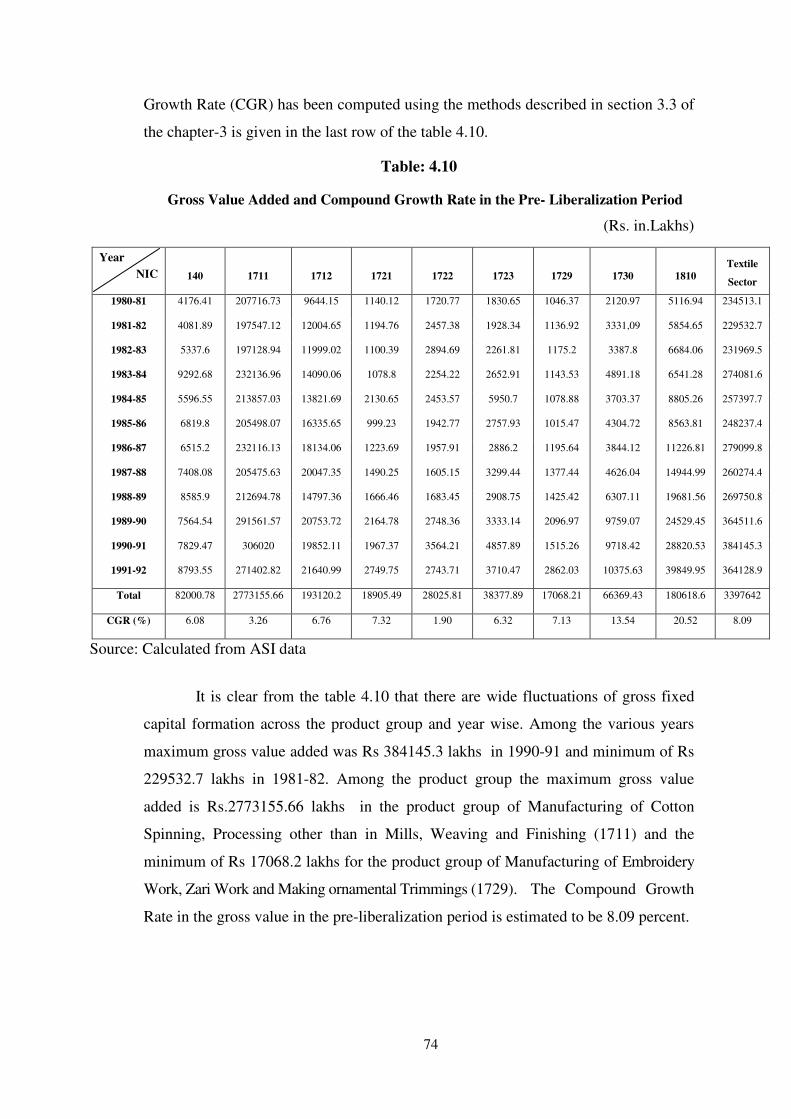
Gross Value Added in the Post- Liberalization Period
The gross value added (output) in the 9 textile product manufacturing industry in
India in the post-liberalization period is presented in table 4.11. The Compound
Growth Rate has been computed using the methods described in section 3.3 of the
chapter III is given in the last row of the table.
Table 4.11
Gross Value Added and Compound Growth Rate in the Post- Liberalization Period
(Rs.in Lakhs)
Source: Calculated from ASI data
The table 4.11 presents gross value added (output) during the post-
liberalization period and wide fluctuations gross value added across the product group
and in different years have been observed. Among the various years maximum gross
value added is Rs 797437.5 lakhs in 2004-05 and minimum of Rs 404066.3 lakhs in
1992-93 have also been observed. Among the product group the maximum gross
Year
NIC 0140 1711 1712 1721 1722 1723 1729 1730 1810
Textile
Sector
1992-93 9095.82 302981.8 22602.46 3665.85 3290.42 4380.84 1911.55 12170.52 43967.08 404066.3
1993-94 14431.99 342617.6 41470.92 3226.69 3337.9 4369.12 3026.09 16152.69 86908.04 515541.1
1994-95 5954.69 369969.2 36268.94 5380.94 3359.19 4128.67 3133.74 15637.91 87957.96 531791.2
1995-96 13685.75 307906.4 24164.59 3515.56 2618.86 4892.35 3039.2 20500.31 75375.23 455698.2
1996-97 15873.26 354937.8 24597.16 4334.34 3603.8 5420.64 4441.76 24876.89 67572.72 505658.4
1997-98 20199.89 360131.1 25371.58 3588.1 2240.77 5773.33 3152.52 17817.87 68511.7 506786.9
1998-99 15017.21 325058 38586.18 4296.42 5999.72 3714.4 7568.69 17742.71 88281.71 506265.1
1999-00 13721.13 416264.7 84689.63 11998.74 11149.25 9542.53 8673.71 40781.05 134942.5 731763.3
2000-01 12996.47 448101.2 64569.97 13218.71 9728.53 6996.04 19406.77 48998.32 129375.4 753391.4
2001-02 13463.36 400589.8 50142.69 14565.11 13812.56 6973.33 10823.53 36025.38 117251.2 663646.9
2002-03 10291.91 435620.2 56024.15 11888.34 12712.99 8088.9 12217.01 44966.75 137085.8 728896.0
2003-04 12911.47 393654.5 70878.51 17564.68 13113.62 9184.54 15260.34 52645.61 122362.2 707575.4
2004-05 23872.41 408977.8 81579.1 25487.44 13735.93 7870.9 15362.62 62402.69 158148.6 797437.5
Total 181515.4 4866810.0 620945.9 122730.9 98703.54 81335.59 108017.5 410718.7 1317740 7808518
CGR(%) 3.77 2.53 10.06 18.56 17.48 6.81 20.41 13.98 8.27 11.32

76
value added is Rs. 4866810.0 lakhs in the product group of Manufacturing of Cotton
Spinning and Processing other than in Mills (1711) and minimum of Rs 98703.54
lakhs for the product group of Making of Blankets, Shawls, Carpets, Rugs and Other
Similar Textiles Products (1722). The Compound Growth Rate in the gross value added
for the pre-liberalization period is estimated to be 11.32 percent.
Gross Value Added in the Post- MFA regime
Table 4.12 presents the gross value added (output) in the textile product
manufacturing industry in India during the post-MFA regime. The Compound
Growth Rate has been computed using the methods described in section 3.3 of the
chapter III and is given in the last row of the table. This is given in the last row of
table 4.12.
Table: 4.12
Gross Value Added and Compound Growth Rate in Post- MFA Regime
(Rs.in Lakhs)
Year
NIC 0140 1711 1712 1721 1722 1723 1729 1730 1810 Total
2005-06 36180.71 549385.5 95228.61 15665.35 21567.56 18424.51 17782.62 96840.11 300746.9 1322822
2006-07 32664.94 698934.5 118500.7 59078.74 30573.88 19651.33 20670.45 115114.4 429852.2 1547041
2007-08 42491.94 778787.4 138152 45490.62 30538.33 18528.13 31318.53 141662.1 565081 1759050
2008-09 44436.53 811375.6 150596.1 48501.45 42443.22 26515.14 35726.87 163003.7 663700.8 1938299
2009-10 79129.31 869492.2 118811.3 51044.72 57971.78 33198 35972.22 115804.6 441505.9 1802930
Total 234903.4 370797.5 621288.7 219780.9 183094.8 116317.1 141470.7 632424.9 240088.7 8370142
CGR (%) 7.45 9.74 12.26 22.91 18.32 10.82 21.44 14.9 22.35 15.58
Source: Calculated from ASI data
Among the five years period of the post-MFA regime, the year 2008-09
marked the maximum gross value added that is Rs 1938299 lakhs and 2005-06 with
the minimum gross fixed capital formation of Rs 379257.12 lakhs. Among the
product group the maximum gross value added of Rs 632424.9 lakhs is recorded by
the product group Manufacturing of Knitted or Crocheted Textile Products (1730) and
the minimum of Rs116317.1lakhs by the product group of Manufacturing of all types
77
of Threads, Cordage, Ropes, Twines and Nets etc (1723). The CGR attained during
the Post-MFA regime is 15.58 percent. The complete phasing out of MFA is a
significant policy shift as far as Indian textile industry is concerned.
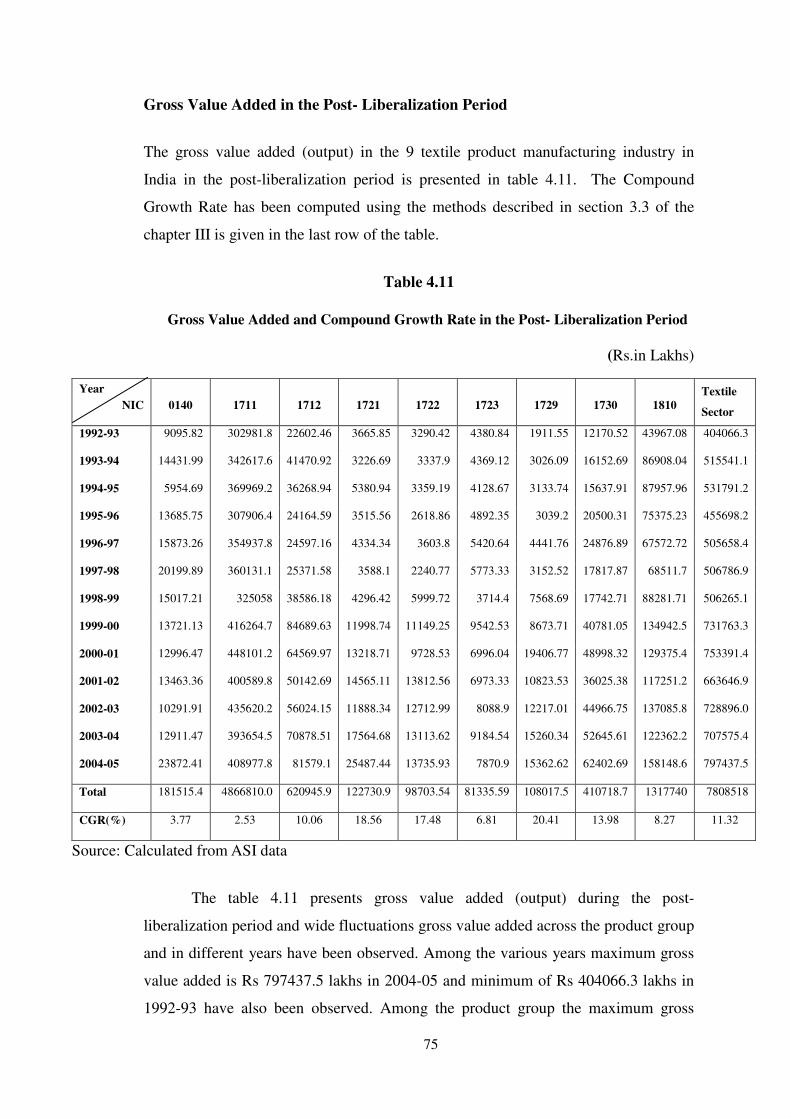
Gross Value Added (Output) in the Pre- Liberalization, Post-Liberalization and
Post-MFA Regime
The growth rate of the gross value added (output) for the 9 product group
during the pre-liberalization period (1980-81 to 1991-92), post-liberalization (1991-
92 to 2004-05) and post-MFA regime (2005-06 to 2009-10) periods has been
presented in the figure 4.4.
Figure: 4.4
Growth Rate of Output in Indian textile industry in the pre- liberalization, Post-
liberalization and post-MFA regime
Source: Growth rate (%) from table No 4.10, 4.11 and 4.12
0.00
5.00
10.00
15.00
20.00
25.00
140 1711 1712 1721 1722 1723 1729 1730 1810 Textile
Sector
CG
R (
%)
Product Code
Pre (1980-81 to 1991-92) Post(1992-93 to 2004-05 Post-MFA(2005-06 to 2009-10)
78
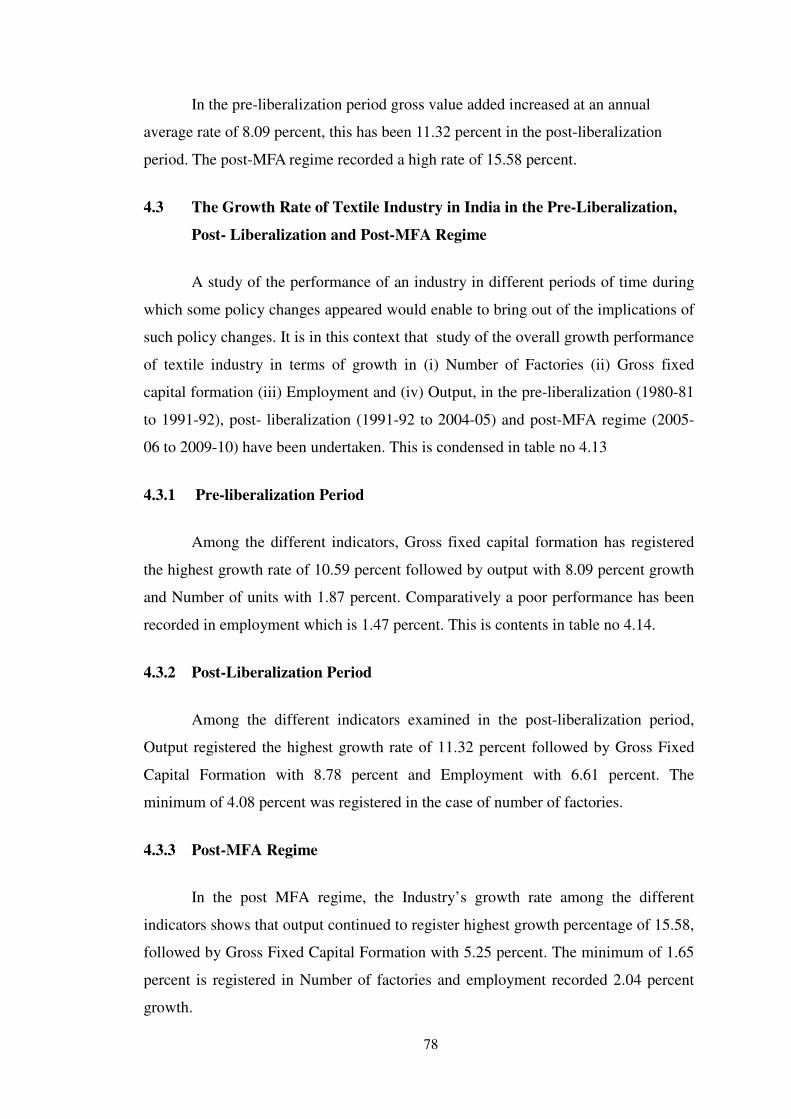
In the pre-liberalization period gross value added increased at an annual
average rate of 8.09 percent, this has been 11.32 percent in the post-liberalization
period. The post-MFA regime recorded a high rate of 15.58 percent.
4.3 The Growth Rate of Textile Industry in India in the Pre-Liberalization,
Post- Liberalization and Post-MFA Regime
A study of the performance of an industry in different periods of time during
which some policy changes appeared would enable to bring out of the implications of
such policy changes. It is in this context that study of the overall growth performance
of textile industry in terms of growth in (i) Number of Factories (ii) Gross fixed
capital formation (iii) Employment and (iv) Output, in the pre-liberalization (1980-81
to 1991-92), post- liberalization (1991-92 to 2004-05) and post-MFA regime (2005-
06 to 2009-10) have been undertaken. This is condensed in table no 4.13
4.3.1 Pre-liberalization Period
Among the different indicators, Gross fixed capital formation has registered
the highest growth rate of 10.59 percent followed by output with 8.09 percent growth
and Number of units with 1.87 percent. Comparatively a poor performance has been
recorded in employment which is 1.47 percent. This is contents in table no 4.14.
4.3.2 Post-Liberalization Period
Among the different indicators examined in the post-liberalization period,
Output registered the highest growth rate of 11.32 percent followed by Gross Fixed
Capital Formation with 8.78 percent and Employment with 6.61 percent. The
minimum of 4.08 percent was registered in the case of number of factories.
4.3.3 Post-MFA Regime
In the post MFA regime, the Industry’s growth rate among the different
indicators shows that output continued to register highest growth percentage of 15.58,
followed by Gross Fixed Capital Formation with 5.25 percent. The minimum of 1.65
percent is registered in Number of factories and employment recorded 2.04 percent
growth.
79
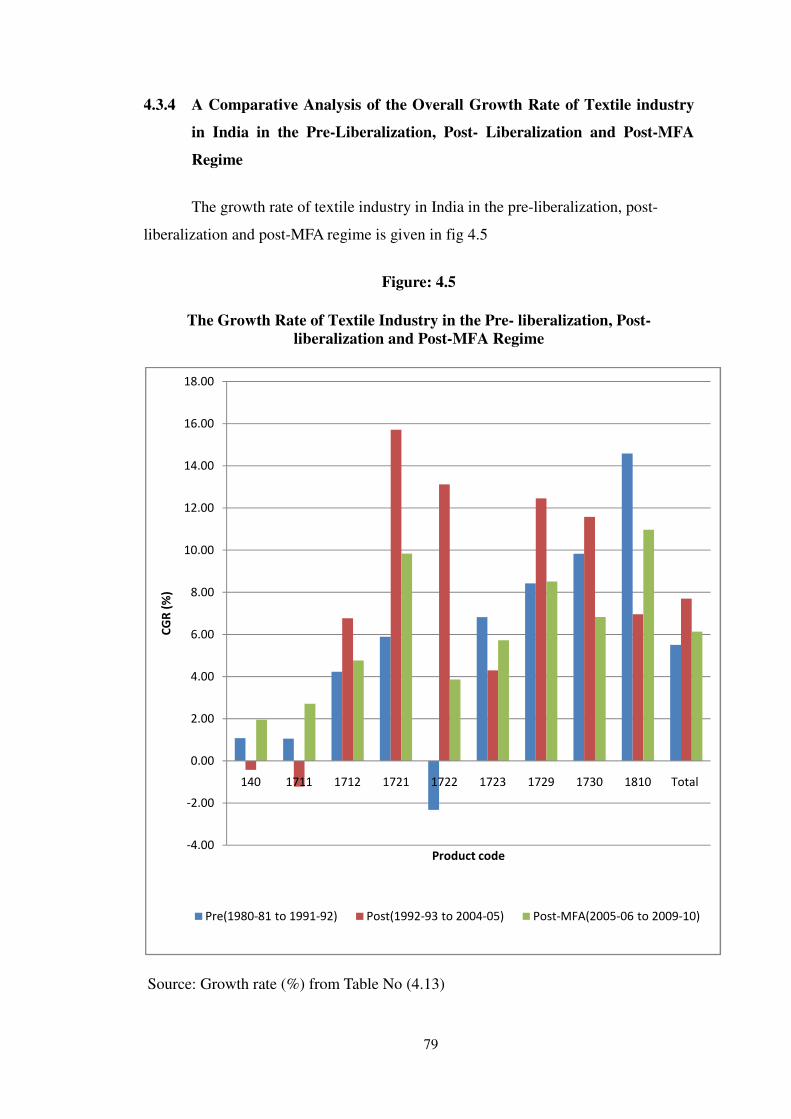
4.3.4 A Comparative Analysis of the Overall Growth Rate of Textile industry
in India in the Pre-Liberalization, Post- Liberalization and Post-MFA
Regime
The growth rate of textile industry in India in the pre-liberalization, post-
liberalization and post-MFA regime is given in fig 4.5
Figure: 4.5
The Growth Rate of Textile Industry in the Pre- liberalization, Post-
liberalization and Post-MFA Regime
Source: Growth rate (%) from Table No (4.13)
-4.00
-2.00
0.00
2.00
4.00
6.00
8.00
10.00
12.00
14.00
16.00
18.00
140 1711 1712 1721 1722 1723 1729 1730 1810 Total
CG
R (
%)
Product code
Pre(1980-81 to 1991-92) Post(1992-93 to 2004-05) Post-MFA(2005-06 to 2009-10)
80
4.4 Conclusions:
• The average annual trend growth rate in number of factories at the aggregate
and product group level witnessed wide variations.
• It is evident that the intra-industry growth rates have fluctuated with in a small
range in a protected environment indicating balanced growth in the
establishment of new units.
• During the period of study from 1980-81 to 2009-10, it has been observed in the
number of factories grew at an average rate of 2.53 percent per annum with a
negligible acceleration over time.
• The rate of growth of gross fixed capital formation was 7.87 per cent during the
entire period of analysis. The pre and post-liberalization periods have relatively
higher growth in capital formation than the post-MFA regime. The single most
reason could be the total phasing out of Multi-Fiber Agreement (MFA) and
ushering in an era of competition. To face the competition, the entrepreneurs
might have embarked upon cost cutting strategies through advanced technology
and automated machines warranting heavy investments in capital assets
especially in plant and machinery.
• In the case of employment growth, the post-liberization scenario of the industry
is surprisingly better with 6.61 annual average growth than the pre-reform
period. The annual average growth rate was 2.04 percent during post-MFA
regime; we noted here that the negative growth in employment is due to the
labour saving technological advancement in the Indian textiles industry.
• The average growth of output in textile industry during pre-liberalization period
was 8.09 percent.
• The industry’s output growth rate marginally improved to 11.32 percent during
post-reform period. In other words the growth momentum achieved in the pre-
liberalization period accelerated to the post-MFA regime also. It is to be noted
that the inter product group variations in growth rates were not significant and
uniform throughout the post reform period.
• The performance of textile industry during the post-MFA regime recorded a significant
annual growth rate of 15.58 percent.

81
Table: 4.13, A Comparative Growth Rate in the Pre-Liberalization, Post- Liberalization and Post-MFA Regime
(in percentage)
Pre-Liberalization period
Post-Liberalization period
Post- MFA regime
Cod
e N
0
Nu
mb
er o
f U
nit
s
Gro
ss B
lock
Em
plo
ym
ent
Ou
tpu
t
Nu
mb
er o
f U
nit
s
Gro
ss B
lock
Em
plo
ym
ent
Ou
tpu
t
Nu
mb
er o
f U
nit
s
Gro
ss B
lock
Em
plo
ym
ent
Ou
tpu
t
140 -1.16 2.34 -2.93 6.08 -1.09 -1.93 -2.46 3.77 -0.25 0.86 -0.25 7.45
1711 -0.13 3.15 -2.06 3.26 -1.73 -2.89 -2.8 2.53 -0.2 1.36 -0.06 9.74
1712 2.97 5.38 1.8 6.76 4.08 8.77 4.16 10.06 1.32 3.77 1.71 12.26
1730 2.38 16.05 7.35 13.54 4.01 17.35 10.98 13.98 2.17 7.7 2.55 14.9
1723 6.91 7.59 6.47 6.32 4.93 -0.62 6.06 6.81 2.14 1.32 8.61 10.82
1729 -2.55 29.52 -0.43 7.13 5.61 14.78 9.05 20.41 1.76 7.29 3.56 21.44
1722 -1.92 -2.88 -6.41 1.9 9.02 14.27 11.73 17.48 1.85 4.68 -9.41 18.32
1810 4.11 25.63 8.06 20.52 2.31 8.48 8.76 8.27 1.83 7.11 12.56 22.35
1721 6.27 8.57 1.41 7.32 9.58 20.76 13.95 18.56 4.23 13.12 -0.92 22.91
Average 1.87 10.59 1.47 8.09 4.08 8.78 6.61 11.32 1.65 5.25 2.04 15.58