chapter 02assets.press.princeton.edu/links/kricher/slides/chap2.pdf · inambari center of endemism....
TRANSCRIPT

Chapter 02Biogeography and Evolution in the Tropics
PLATE 2-1(a) Coquerel’s Sifaka (Propithecus coquereli), a lemur species common to low-elevation, dry deciduous forests in Madagascar. (b) Ring-tailed lemurs (Lemur catta) are highly social.
PowerPoint Tips (Refer to the Microsoft Help feature for specific questions about PowerPoint.
Copyright
The Princeton University Press. Permission required for reproduction or display.
(a) (b)
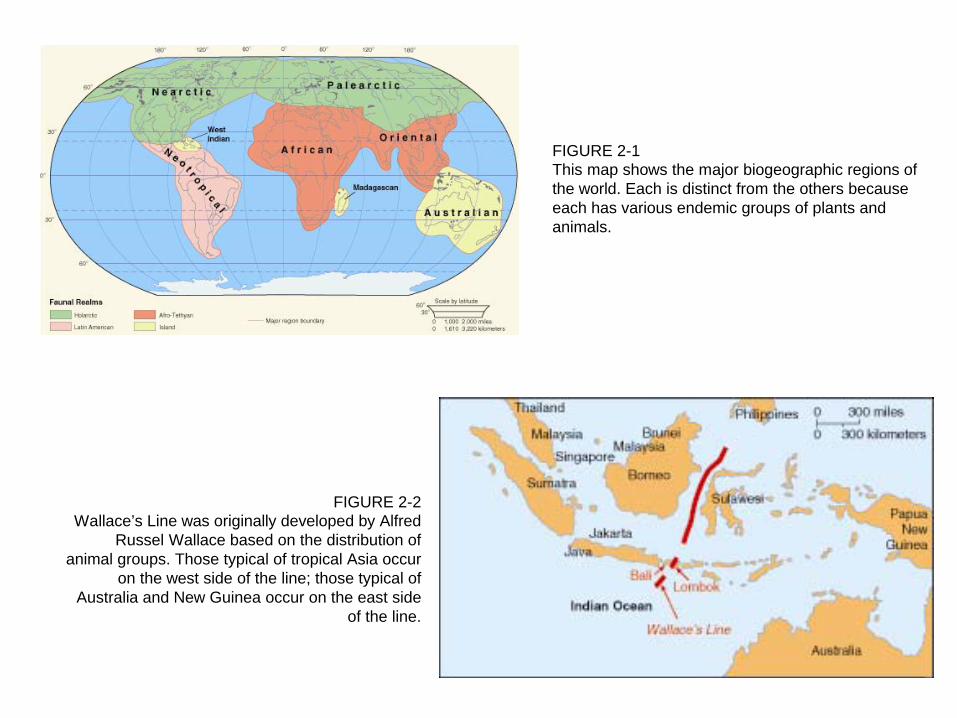
FIGURE 2-1 This map shows the major biogeographic regions of the world. Each is distinct from the others because each has various endemic groups of plants and animals.
FIGURE 2-2Wallace’s Line was originally developed by Alfred
Russel Wallace based on the distribution of animal groups. Those typical of tropical Asia occur
on the west side of the line; those typical of Australia and New Guinea occur on the east side
of the line.

FIGURE 2-3Examples of animals found on either side of Wallace’s Line. West of the line, nearer tropical Asia, one 3 nds species such as (a) proboscis monkey (Nasalis larvatus), (b) 3 ying lizard (Draco sp.), (c) Bornean bristlehead (Pityriasis gymnocephala). East of the line one 3 nds such species as (d) yellow-crested cockatoo (Cacatua sulphurea), (e) various tree kangaroos (Dendrolagus sp.), and (f) spotted cuscus (Spilocuscus maculates). Some of these species are either threatened or endangered.

PLATE 2-2These vertebrate animals are each endemic to the Galápagos Islands, but each traces its ancestry to animals living in South America. (a) and (b) Galápagos tortoise (Geochelone nigra). These two images show (a) a saddle-shelled tortoise and (b) a dome-shelled tortoise. Each is a distinct subspecies. Domed tortoises inhabit moist highland areas, and saddle-shelled tortoises frequent lowland, arid regions of the islands. (c) Galápagos marine iguana (Amblyrhynchus cristatus). The 3 attened face adapts the animals to grazing on marine algae attached to rocks. (d) Galápagos land iguana (Conolophus subcristatus). Land iguanas occupy low- elevation, arid areas of the islands, where they feed extensively on cactus. (e) Galápagos 3 ightless cormorant (Phalacrocorax harrisi). This species is found only in the colder waters of the western islands. (f) Hood mockingbird (Nesomimus macdonaldi). This species is found only on Espan3 ola (formerly Hood Island) in the Galápagos. It spends much of its time on the ground.
(a) (b)
(c) (d)
(e) (f)

FIGURE 2-4Figure 2-4(a) illustrates the suggested rafting route by which some mammalian groups may have colonized Madagascar. The numbers indicate estimates of when (in millions of years ago) the colonizations may have occurred. Other groups such as elephants, zebras, antelopes, and apes are considered unlikely colonists, and indeed, none are found on Madagascar.
(a)

Figure 2-4(b) illustrates how today’s ocean currents would minimize dispersal potential from mainland Africa to Madagascar, but such was not always the case.
(b)

PLATE 2-3 Earth’s moon, unlike Earth, lacks plate tectonics.
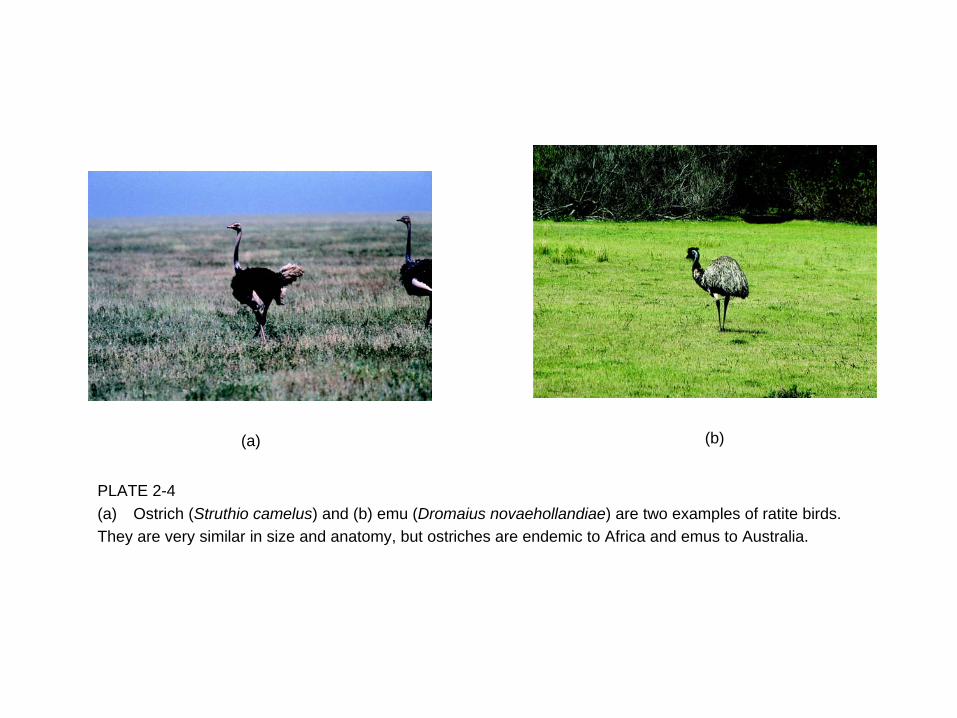
PLATE 2-4(a) Ostrich (Struthio camelus) and (b) emu (Dromaius novaehollandiae) are two examples of ratite birds.They are very similar in size and anatomy, but ostriches are endemic to Africa and emus to Australia.
(b)(a)

FIGURE 2-5The San Andreas fault is well known for its relatively frequent tectonic activity, resulting in earthquakes of varying magnitudes. Note where the boundary between the North American plate and Pacific plate occurs.
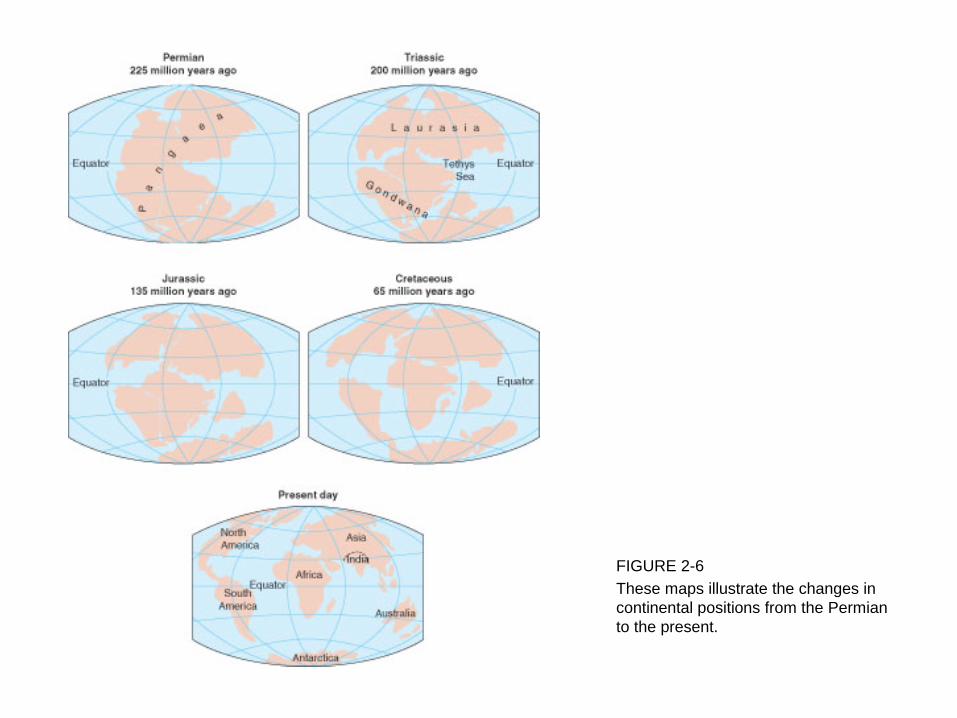
FIGURE 2-6These maps illustrate the changes in continental positions from the Permian to the present.
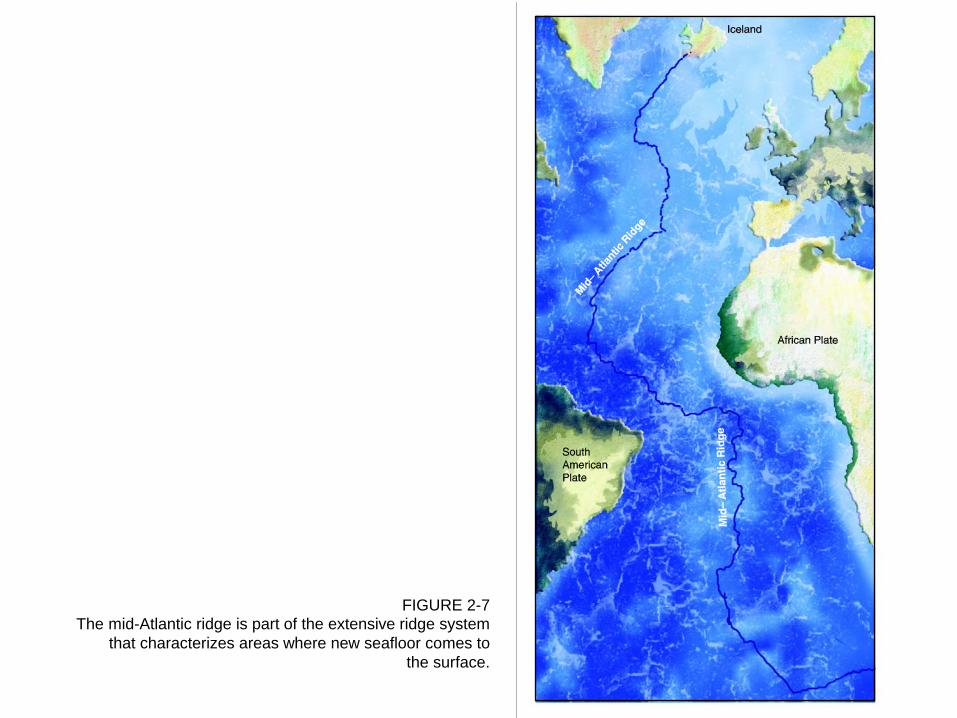
FIGURE 2-7 The mid-Atlantic ridge is part of the extensive ridge system
that characterizes areas where new seafloor comes to the surface.
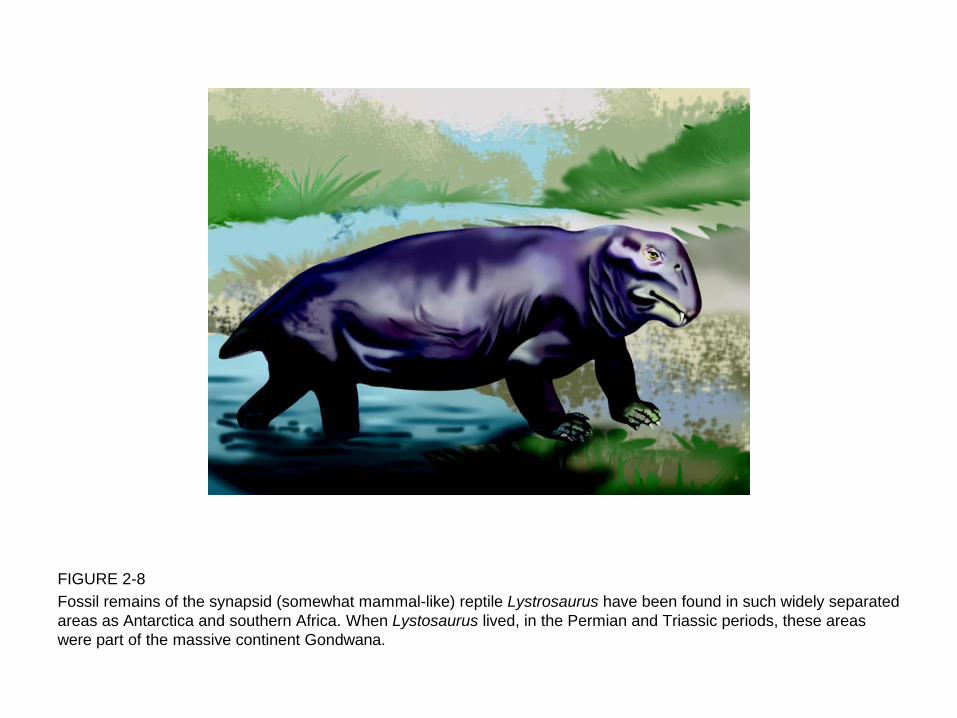
FIGURE 2-8Fossil remains of the synapsid (somewhat mammal-like) reptile Lystrosaurus have been found in such widely separated areas as Antarctica and southern Africa. When Lystosaurus lived, in the Permian and Triassic periods, these areas were part of the massive continent Gondwana.

PLATE 2-5IMAGES OF VENEZUELAN ANIMALS AND AUSTRALIAN ANIMALSFrom Venezuela: (a) male Guianan cock-of-the-rock (Rupicola rupicola); (b) royal flycatcher (Onychorhynchus mexicanus); and (c) Brazilian porcupine (Coendou prehensilis). From Australia: (d) male Victoria’s riflebird; (e) noisy pitta (Pitta versicolor); and (f) common ring-tailed possum.
(a) (c)
(b) (d)
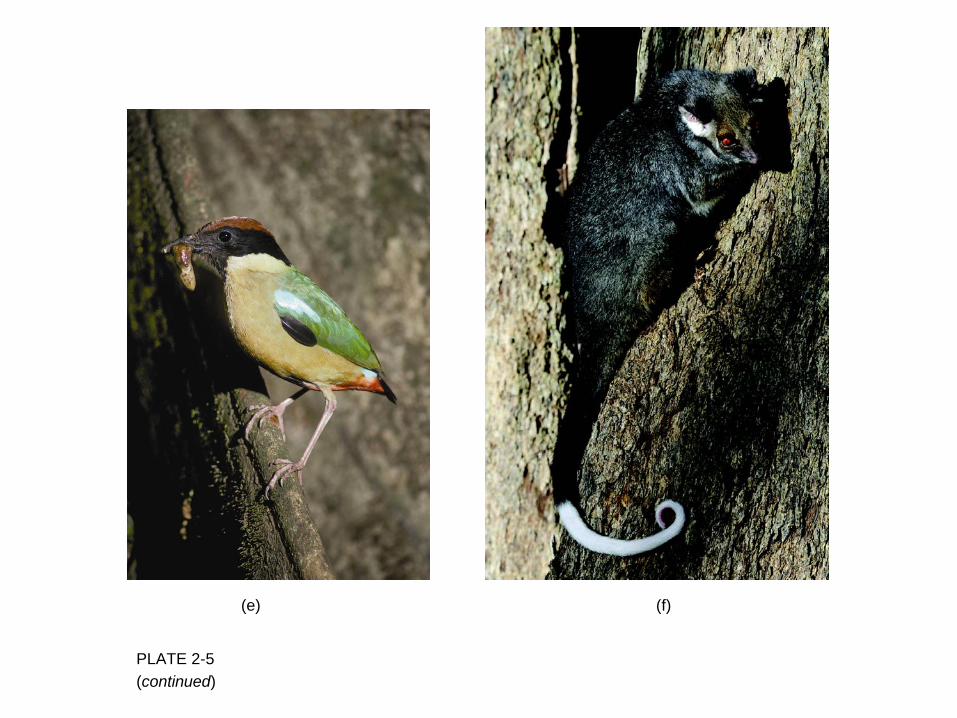
PLATE 2-5(continued)
(e) (f)

PLATE 2-6These three bird species—(a) Bahama swallow, (b) Bahama woodstar, and (c) Bahama yellowthroat—each endemic only to certain of the Bahama Islands, are each closely related to more widely ranging species. (d) The Galápagos penguin (Spheniscus mendiculus) is the most northern of the world’s 17 penguin species and the only one to reach the equator.
(a) (b)
(c) (d)
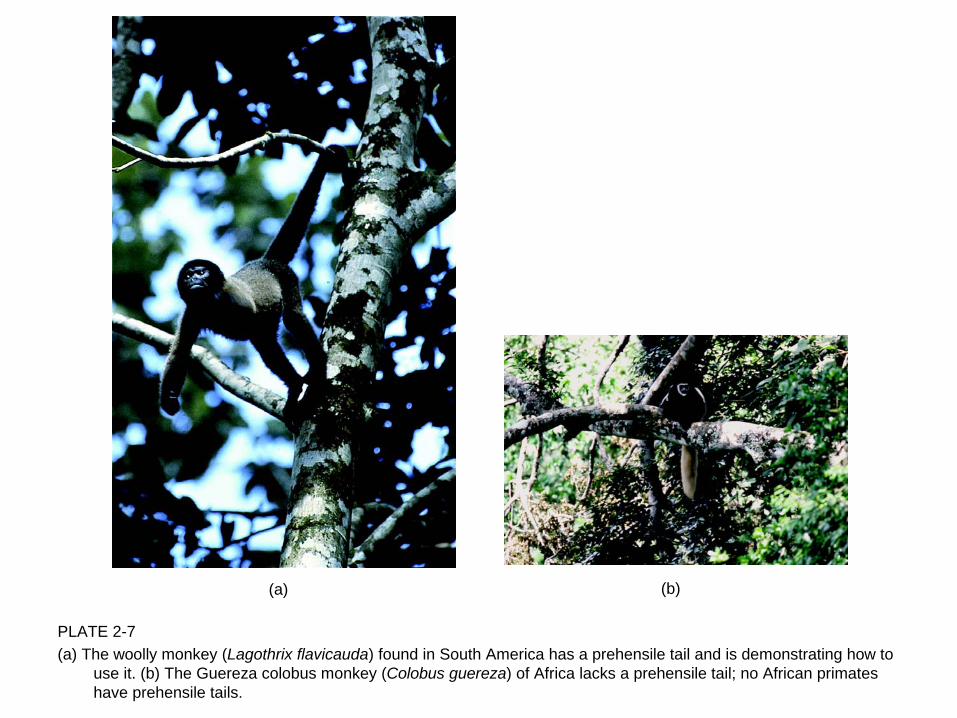
PLATE 2-7(a) The woolly monkey (Lagothrix flavicauda) found in South America has a prehensile tail and is demonstrating how to
use it. (b) The Guereza colobus monkey (Colobus guereza) of Africa lacks a prehensile tail; no African primates have prehensile tails.
(a) (b)

PLATE 2-8Orb-weaver spider female in a web with stabilamenta visible.

PLATE 2-9The three-toed sloth (Bradypus variegatus) is well adapted to an arboreal life but poorly adapted to being on the ground.
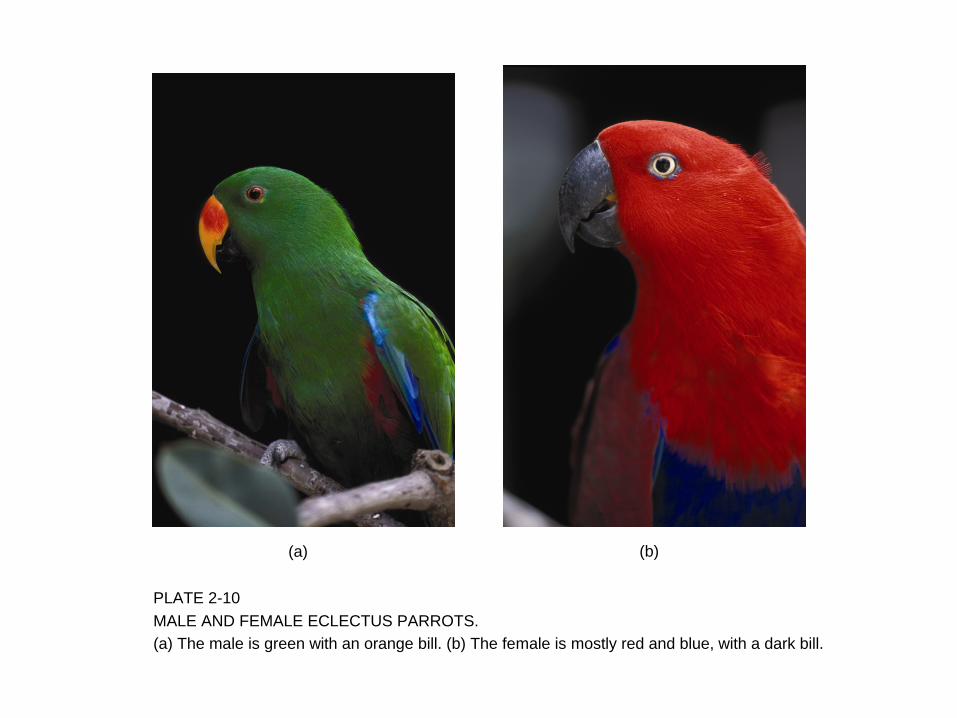
PLATE 2-10MALE AND FEMALE ECLECTUS PARROTS.(a) The male is green with an orange bill. (b) The female is mostly red and blue, with a dark bill.
(a) (b)

PLATE 2-11This image shows, in the bottom three rows, unpalatable butterfly model species in the family Danaidae (left) and palatable mimetic forms of female Papilio dardanus (right), an African swallowtail species. At top-left is the Papilio dardanus male; at top-right is a nonmimetic, male-like female of the same species. The polymorphic, female-limited Batesian mimicry was first described by Roland Trimen in 1869.

PLATE 2-12(a) Savanna elephant compared with (b) forest elephant.
(a) (b)
FIGURE 2-9This cladogram, based on genetic similarity, illustrates that the savanna and forest elephants are about as different from one another as either is from an Asian elephant.

FIGURE 2-10This is an example of a cladogram—in this case, for primates. The shorter the distance from branch to branch, the more closely related are the species. For example, note the top of the cladogram. Tamarins and marmosets are each other’s closest relatives.

FIGURE 2-11Beginning with T1, note how a vicariant event such as a mountain rising may separate populations geographically, thus allowing for genetic differences to develop over time between the now-isolated populations. At time T4, the populations again become partially sympatric and selection pressures act to enhance their separation. At time T5, there are reproductive-isolating mechanisms that select to prevent hybridization and to maintain the two populations as full species.

FIGURE 2-12This map shows the location of the three major lakes of the Great Rift Valley in Africa.

PLATE 2-13Cichlid fish of the Great Rift Valley lakes demonstrate an amazingly high species richness.

PLATE 2-14The complex topography of the
Andes Mountain chain has resulted in numerous vicariant
speciation events throughout the full range of the Andes.
(a)
FIGURE 2-13The altiplano region of the central Andes.

FIGURE 2-13(continued)
(b)

FIGURE 2-14(a) The range of Baird’s tapir. Note that it occurs throughout Central America and on the most western side of the Andes in Colombia and Ecuador. (b) The range of the lowland tapir.
(b)(a)
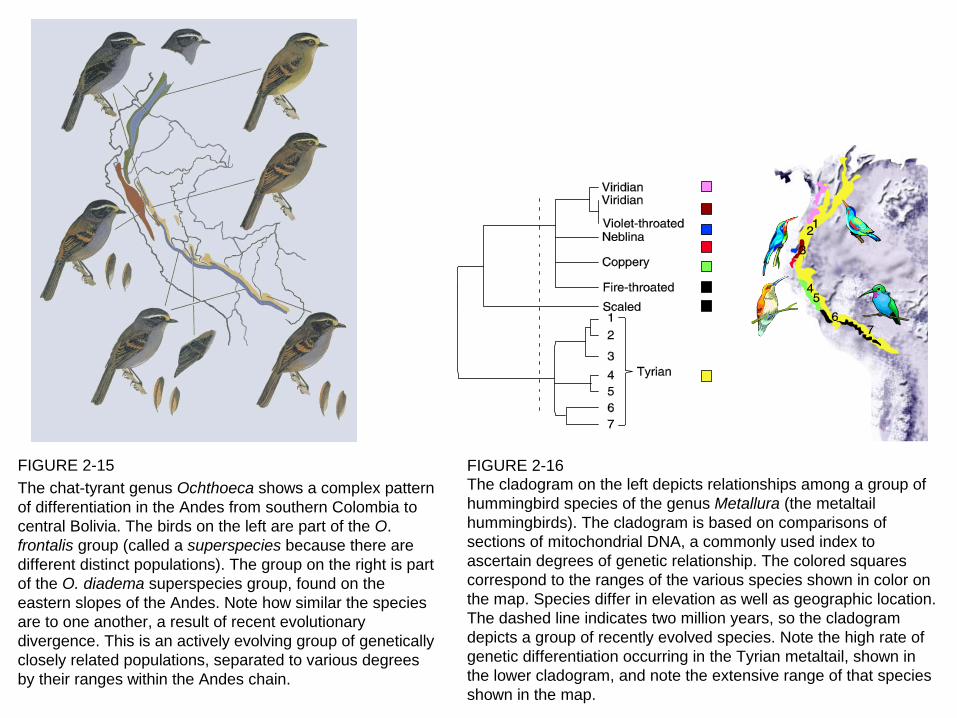
FIGURE 2-15The chat-tyrant genus Ochthoeca shows a complex pattern of differentiation in the Andes from southern Colombia to central Bolivia. The birds on the left are part of the O. frontalis group (called a superspecies because there are different distinct populations). The group on the right is part of the O. diadema superspecies group, found on the eastern slopes of the Andes. Note how similar the species are to one another, a result of recent evolutionary divergence. This is an actively evolving group of genetically closely related populations, separated to various degrees by their ranges within the Andes chain.
FIGURE 2-16The cladogram on the left depicts relationships among a group of hummingbird species of the genus Metallura (the metaltail hummingbirds). The cladogram is based on comparisons of sections of mitochondrial DNA, a commonly used index to ascertain degrees of genetic relationship. The colored squares correspond to the ranges of the various species shown in color on the map. Species differ in elevation as well as geographic location. The dashed line indicates two million years, so the cladogram depicts a group of recently evolved species. Note the high rate of genetic differentiation occurring in the Tyrian metaltail, shown in the lower cladogram, and note the extensive range of that species shown in the map.

FIGURE 2-17These two figures depict the ranges of 10 species
of birds that, taken together, define the Inambari center of endemism. The bird
species are from widely distinct groups. Areas of endemism become apparent when ranges
of many species converge, as shown in the figures.
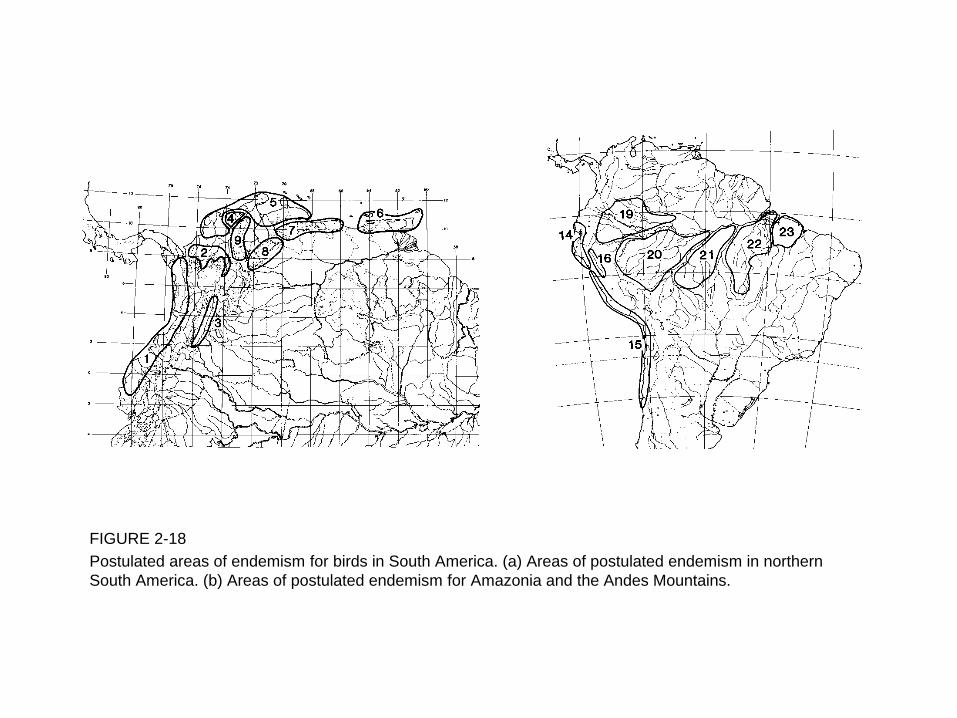
FIGURE 2-18Postulated areas of endemism for birds in South America. (a) Areas of postulated endemism in northern South America. (b) Areas of postulated endemism for Amazonia and the Andes Mountains.

FIGURE 2-19The distributions of two superspecies groups of Amazonian birds closely follow the geography of the river systems in Amazonia. (a) This map shows the distribution of two closely related antbird species in Amazonia. Note that they are separated based on occurrence either north or south of the Amazon River. (b) This figure depicts the distribution of the razor-billed curassow species group. The species are morphologically similar but are regionally separated. Note that the Amazon River separates the southern Mitu tuberosa from the more northern populations, and note the isolated Mitu mitu, found in the Brazilian Atlantic forest region.
(a)
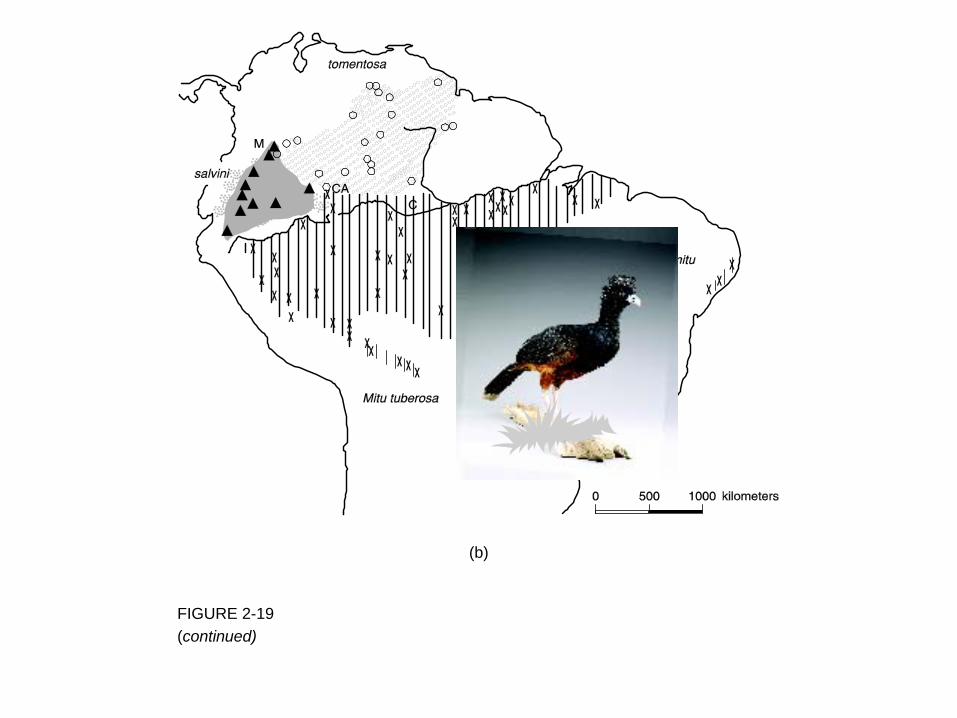
FIGURE 2-19(continued)
(b)
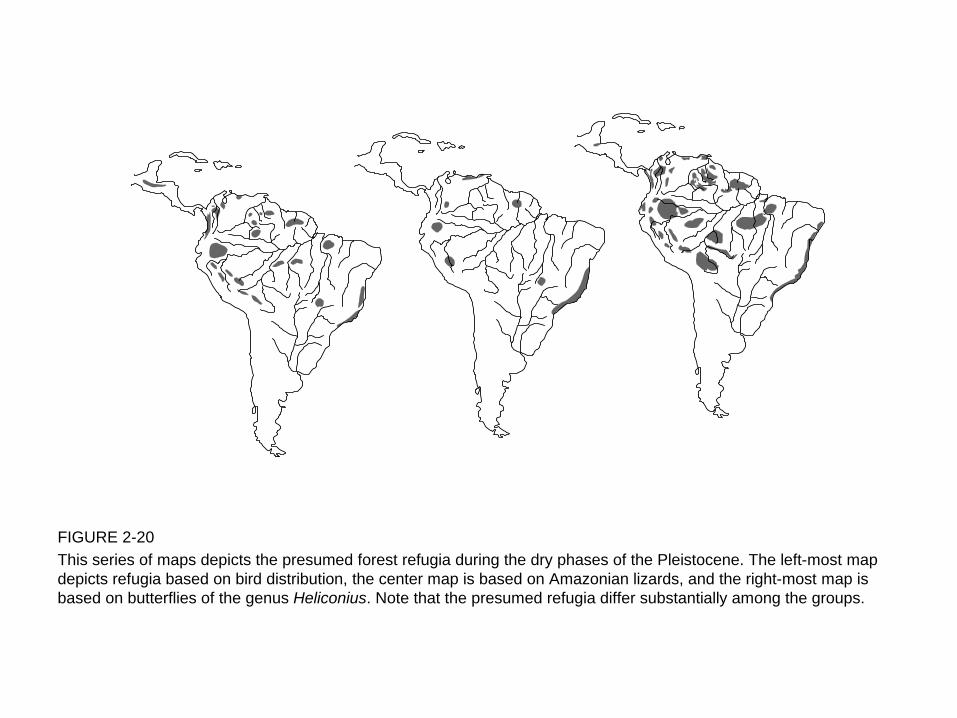
FIGURE 2-20This series of maps depicts the presumed forest refugia during the dry phases of the Pleistocene. The left-most map depicts refugia based on bird distribution, the center map is based on Amazonian lizards, and the right-most map is based on butterflies of the genus Heliconius. Note that the presumed refugia differ substantially among the groups.

PLATE 2-15These photos of fossil plants demonstrate morphological diversity in the Laguna del Hunco flora from about 52 million years ago.
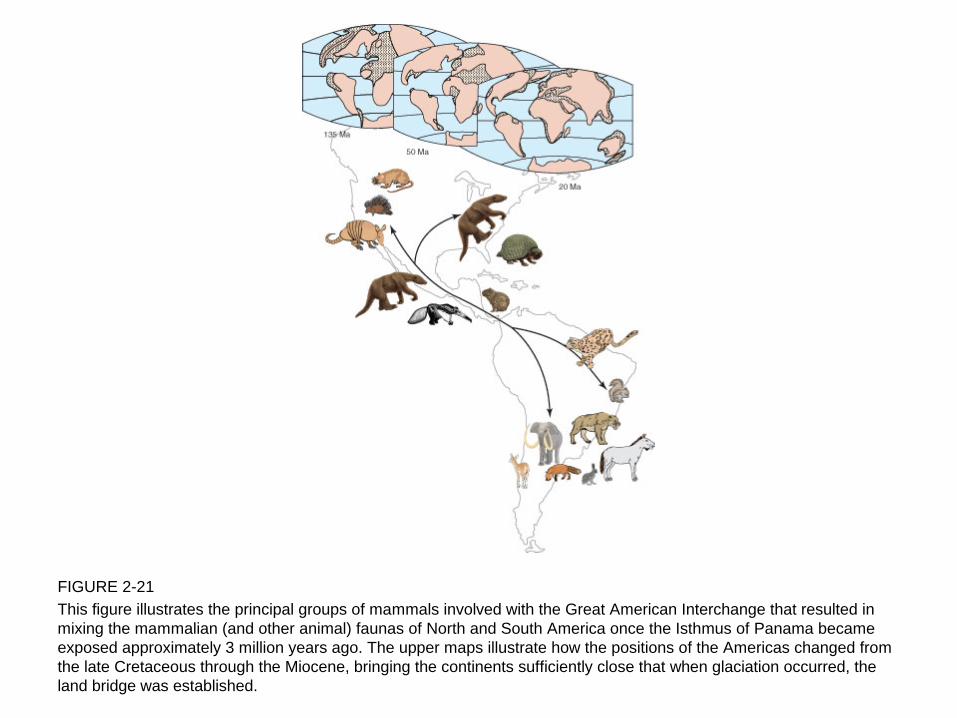
FIGURE 2-21This figure illustrates the principal groups of mammals involved with the Great American Interchange that resulted in mixing the mammalian (and other animal) faunas of North and South America once the Isthmus of Panama became exposed approximately 3 million years ago. The upper maps illustrate how the positions of the Americas changed from the late Cretaceous through the Miocene, bringing the continents sufficiently close that when glaciation occurred, the land bridge was established.

FIGURE 2-22Phorusrhacoid bird (left) and toxodon (right). These animals represent unique components of the faunas of South America before the Great American Interchange took place.

FIGURE 2-23Smilodon (left) and Thylacosmilus (right) were both morphologically similar, particularly regarding the enlarged saber- like canine teeth. But Smilodon was a placental mammal, whereas Thylacosmilus was a marsupial mammal. Their similarity is a clear case of convergent evolution.