chapter ii location, trends, pattern and...
TRANSCRIPT

CHAPTER II
LOCATION, TRENDS, PATTERN AND
GROWTH OF SLUMS IN DELHI
INTRODUCTION
Delhi is one of the fastest growing metropolises in India. Along with Delhi's urban
growth there is a simultaneous growth and expansion of the slum population and its slum
areas. Soon, Delhi has acquired the dubious distinction of being rated as the fastest
growing slum city in the world. This Chapter study's about the characteristics of the
slums and its socio economic condition based on the secondary data. To define slums
various government as well as the non governmental organization provides the definition
about the slums, here only governmental institutions are given below:
2.1 DEFINITION OF SLUMS
The concept of slums and its definition vary from country to country depending upon
the socio-economic condition of each society, irrespective of location, whether in the core of
the city in the form of sqatterring slums.
Operational Definition of Slums by Census of India
The definition of the slums is given statutory position under the slum
(improvement and clearance) act of 1956. According to the slum areas (improvement
and clearance) act 1956, slums are area where buildings area:- In any respect unfit for the
habitation; and are by reason of dilapidation , overcrowding , faulty arrangements of
streets , lack of ventilation , light or sanitation facilities or any combination of these
factors , are detrimental to safety, health and morals.
According to census 2001 population of slums in India is around 40.6 million,
which includes the following:-
}) All specified areas notified as 'Slum' by State/Local Government and UT
Administration under any Act;
2) All areas recognized as 'slum' by state/local government and UT administration,
which may have not been formally notified as slum under any act;
3) A compact area of at least 300 populations or about 60-70 households of poorly
built congested tenements in unhygienic environment usually with inadequate
infrastructure and lacking in proper sanitary and drinking water facilities. i (COl,
Delhi)
59

NSSO Definition
Similarly the NSSO defined 'slum' in its 58th round slums survey as "A slum is a
compact area with a collected of poorly built tenements, mostly of temporary nature,
crowded together usually with inadequate sanitary and drinking water facilities in
unhygienic condition"11
UNDP Definition of Slums
At its January 2002 meeting in New York, the UN-Inter-Agency Development
Group (UNDG) on MDGs expressed concerns that tenure and sanitation did not
adequately constitute a complete response to the target of 'improving the lives of 100
million slum dwellers'. UN-HABIT AT therefore also proposed to develop a definition
and an operational measurement of slum improvement in order to respond more directly
to Target 11.
An Expert Group Meeting was held in Nairobi in November 2002 on 'Defining
Slums and Secure Tenure'. Experts agreed on the following generic definition of slums:
A slum is a contiguous settlement where the inhabitants are characterized as having
inadequate housing and basic services. A slum is often not recognised and addressed by
the public authorities as an integral or equal part of the city.
The Expert Group Meeting recommended that the adequate monitoring of Target
11 be undertaken through five components, reflecting conditions that characterize slums:
1. Insecure residential status;
2. Inadequate access to safe water;
3. Inadequate access to sanitation and other infrastructure;
4. Poor structural quality of housing;
5. Overcrowding.
2.2 TYPOLOGY OF SLUMS AND SQUATTER SETTLEMENTS
Slums in Delhi are observed to be located on plain areas owned by the
government, and vacant private lands (Basu, 1988; Srirangan, 1997). They are "spread
over the length and breadth of the city staring the conscientious urban planners in the
face" (Ali, 1990:15). Large concentrations of squatters are seen in Trans Yamuna/East
Delhi and South Delhi.
60

In Delhi, Slums areas are usually found located on:
• Public lands (Sundaram and Gambhir, 1991; Benjamin, 1991 :3);
• Gardens, open spaces near railway tracks, beneath bridges and planned public
housing sites (Benjamin, 1991 :3);
• Amidst surrounding residential areas (Misra and Gupta, 1981 );
• Near old and new industrial and commercial complexes, fruit and vegetable
markets, within unauthorised colonies, and resettlement colonies (DDA, 1983);
and
• Open spaces left out in resettlement colonies where previous squatter households
had been rehabilitated and who even complain that the basic services made
available to them are inadequate (Ali, 1990).
These squatter settlements are mostly made of huts constructed out of mud, brick,
straw, bamboo, wood and such other sundry materials (Misra and Gupta, 1981 ).
However, some well-established squatter units are made out of improvised materials
without any infrastructure provisions (Sundaram and Gambhir, 1991 ). About 80% of
them are of 10-15 square meter area and 88% seem to be single room units (Basu,
1988:138).
Squatters are mostly engaged in manual labour in the industrial areas, in domestic
work and in construction, and factors such as distance of workplace and transportation
costs encourage them to stay in these settlements which are centrally located (Srirangan,
1997). It is believed that some of them are doing petty trading and also engaged in self
employed home hawker trades. Researchers observed that most squatters are rural
migrants of utterly poor and poverty-stricken labour class households who move to the
city in search of better wages (DDA, 1983; Basu, 1988: 138; Srirangan, 1997). Their
household income seems to be very low and it is observed that they do not manage to
save anything from their daily wages (SPA, 1994 ).
Delhi's Urbanisation: Past and Present
Delhi's population increases much faster than the national average rate. Delhi
grows by almost 5 per cent annually, adding 400,000 people per year to the current
61

estimated 13.5 million (United Nations 1995). In 1971, the population was barely 3.6
million, but in 1991 it was 8.4 million (Census of India 1971 and Census of India 1991 ).
In 2015, the urban area of Delhi is expected to contain 17.6 million people (Ansari and
Von Einsiedel 1998, p. 3).
The expansion of the city strongly influences the villages in terms of land use and
population, both physically and in a socio-economic sense. Its influence stretches far
beyond the immediately adjacent area. This study concentrates on the livelihood of the
migrants residing in Delhi. The notion of livelihood is narrowed down here to reflect
social and economic household variables; of these, especially the occupational
characteristics are studied thoroughly. The traditionally dominant agricultural activities
are under increasing pressure, although new chances are emerging for market-oriented
industrlization. There are great differences in access to resources and opportunities among
villagers, leading to interesting new patterns of livelihood. For non-agricultural
occupations, the villagers' options are enhanced by their proximity to the expanding city.
Land use and occupational trends are highly interrelated. For example, Brookfield et a!.
(1991) found that in Kuala Lumpur's fringe, as "educated children leave home to seek
wage employment, leaving an increasingly elderly population in the kampung; the land
acquires an aspect of neglect." Other sources emphasised the stimulating effects on
urbanization (e.g. Mulay and Ray 1973). A number of other consequences of urbanisation
- namely environmental problems, land use pattern, and planning for basic amenities the
city's expansion- are also treated in this study.
Although Delhi is a relatively fast grower in the club of Indian metropolitan cities
(Delhi Development Authority 1992), the issues examined here are certainly not limited to
Delhi. Some of its circumstances are obviously unique. Delhi nonetheless forms a suitable
case, since it shows numerous similarities with other (metropolitan) cities as well. Like
many other cities in Asia, Delhi is expanding fast. Moreover, it too is surrounded by a
populous rural area with productive agricultural land. These are common features of the
developing world in general and Asia in particular (e.g. McGee 1991 ). Such conditions
give rise to many conflicts between rural and urban economies, traditions, and people.
However, they can also generate mutually beneficial complementarities in the rural and
urban spheres. The net outcome is highly selective for different groups and different
62
locations. The empirical results of this study are on occasion compared with other cases
gleaned from the available literature.
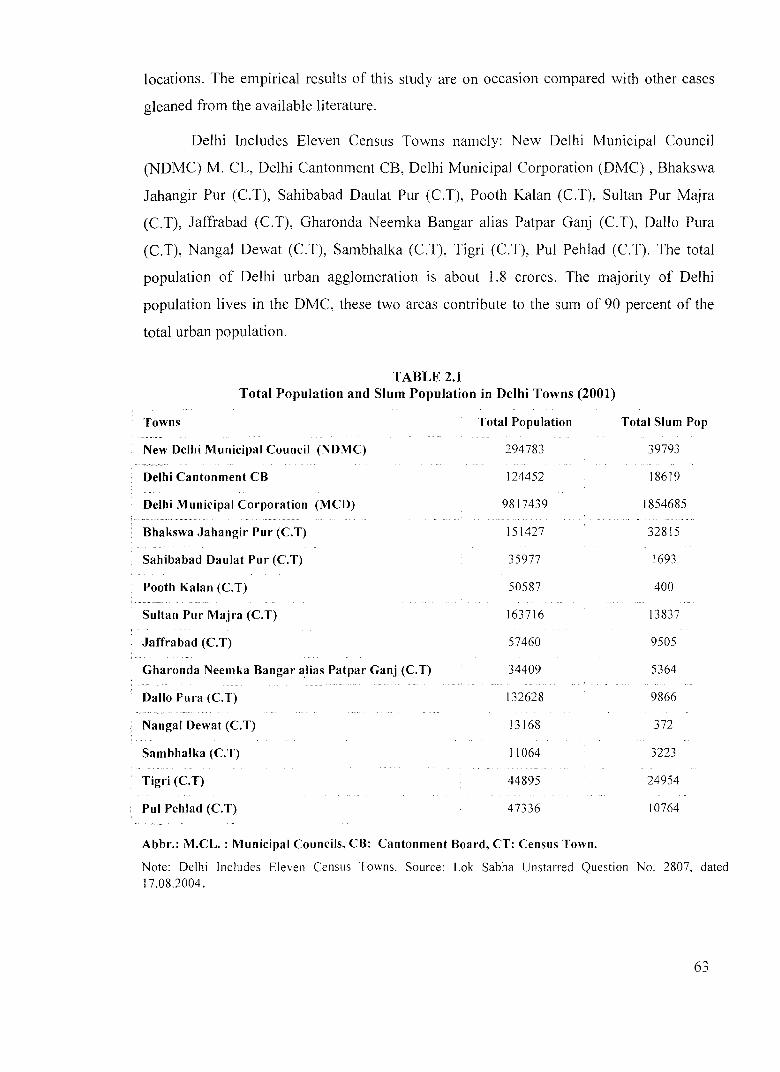
Delhi Includes Eleven Census Towns namely: New Delhi Municipal Council
(NDMC) M. CL, Delhi Cantonment CB, Delhi Municipal Corporation (DMC), Bhakswa
Jahangir Pur (C.T), Sahibabad Daulat Pur (C.T), Pooth Kalan (C.T), Sultan Pur Majra
(C.T), Jaffrabad (C.T), Gharonda Neemka Bangar alias Patpar Ganj (C.T), Dalla Pura
(C.T), Nanga! Dewat (C.T), Sambhalka (C.T), Tigri (C.T), Pul Pehlad (C.T). The total
population of Delhi urban agglomeration is about 1.8 crores. The majority of Delhi
population lives in the DMC, these two areas contribute to the sum of 90 percent of the
total urban population.
TABLE 2.1 Total Population and Slum Population in Delhi Towns (2001)
Towns
New Delhi Municipal Council (NDMC)
Delhi Cantonment CB
Delhi Municipal Corporation (MCD)
Bhakswa Jahangir Pur (C.T)
Sahibabad Daulat Pur (C.T)
Pooth Kalan (C.T)
Sultan Pur Majra (C.T)
Jaffrabad (C.T)
Gharonda Neemka Hangar alias Patpar Ganj (C.T)
Dallo Pura (C.T)
Nangal Dewat (C.T)
Sambhalka (C.T)
Tigri (C.T)
Put Pehlad (C.T)
Total Population
294783
124452
9817439
151427
35977
50587
163716
57460
34409
132628
13168
11064
44895
47336
Abbr.: M.CL. : Municipal Councils, CB: Cantonment Board, CT: Census Town.
Total Slum Pop
39793
18619
1854685
32815
1693
400
13837
9505
5364
9866
372
3223
24954
10764
Note: Delhi Includes Eleven Census Towns. Source: Lok Sabha Unstarred Question No. 2807, dated 17.08.2004.
63
Type of Settlements in Delhi
As per Economic Survey of Delhi (2001-2002), there are Eight types of settlements in
Delhi:
1. Jhuggi- Jhompri Clusters (JJ clusters)
2. Slum designated areas
3. Unauthorised colonies
4. Resettlement colonies
5. Rural villages
6. Regularised- Unauthorised colonies
7. Urban villages
8. Planned colonies
The first two categories account for the bulk of slum population in Delhi. Legally
notified slums are those which have been designated as slums under the Slum Areas
Improvement and Clearance Act (1956). The legally notified slums are mainly in the
walled city areas with a population of about 2 million. It has been noted that no slums
have been legally notified in the last 30 years.(Economic Survey Of Delhi, 200 1-2002).
JJ clusters on the other hand are illegal occupants or squatters on public or private
land. In a survey carried out in Delhi in 1990, 2.59 lakhs households were estimated in
such squatters.
As per Delhi Development Authority (2000), 38% of the growth of population in
Delhi during the last decade was due to in- migration. Although the relative contribution
of in- migration to this growth has declined over the years, however in absolute terms the
numbers of slums have increased to 1180(2001) from 929 slums in 1991. According to
Economic Survey of Delhi (2002), the Slum Wing of MCD estimates about 1100 JJ
clusters with 6 Lakh households and an approximate population of 21 Lakh. Unlike cities
such as Kolkata or Mumbai, Delhi does not have slum settlements in certain specified
areas instead they are scattered throughout the cities in small settlements near railway
tracks, roads, river banks, parks and other vacant lands.
The number of households in a settlement is I 00 or below in slightly more than
50% of the slum settlements while another quarter has a size of more than 100 but less
64
than 300 households (Slum Wing of DDA, 1990 as given in Ali, 1998). These settlements
are generally formed along lines of regional, linguistic and caste affiliations, though there
are many clusters that are also heterogeneous in composition.
Resettlement Colonies in Delhi
Resettlement colonies were the first initiative by the government to provide better
living conditions to people living in slums. The first such resettlement was in 1961. This
was as per the provisions of the 1961 Mater Plan of Delhi that recommended 'squatters
be relocated in various parts of the urban area' (Dewan, 2002). The Plan sought to
integrate the slum dwellers into the city and avoid 'ghettoisation' of the poor; For
instance, the document stresses that "It is of utmost importance that physical plans should
avoid stratification on income or occupation basis".
During 1975-77 another massive resettlement programme was initiated by DDA,
an estimated 1.97 Lakh JJ clusters were resettled in 26 new JJ colonies. In 1979- 80
another scheme was initiated that sought to provide and improve basic civic amenities in
44 resettlement colonies. In 1988-89, resettlement colonies were transferred from DDA
to MCD with the assurance that the Government of Delhi will provide the maintenance
expenditure to MCD under non-plan expenditure.
Since 1979 to 2002 an estimated Rs.4517.67 crore under plan expenditure and
Rs.470.18 crore under non-plan expenditure has released by the Delhi Government for
maintenance of the resettled colonies. (Economic Survey of Delhi, 200 1-2002) Because
of certain minimal provisions that the government has to provide in resettlement colonies,
evidence suggests that resettlement colonies are generally better placed than slums
(NCAER, 2002).
For instance, Location near a Nallah or an industry heightens the risk posed to
health on account of the pollution (either human or industrial) while location near a
highway/ road/ railway line exposes residents to vehicular pollution apart from increased
risks of accidents faced especially by children.
All such resettlement colonies (as shown in the table below) are located near
highways/ roads. Slums on the other hand have mixed locational profile. A quarter of the
slums are located near highways/ roads, another 20% near Nallah and railway track each.
65

The better location of resettlement colonies is because these colonies have been settled in
a 'plan' manner.
Resettlement colonies comprise of JJ clusters households that have been
'resettled'. The total population in resettlement colonies is estimated to be 18 lakhs
(2000) in 46 resettlement colonies. The magnitude of JJ clusters prior to 1970 was within
manageable limits; so most such households ( 43, 000) were resettled. After 1970,
migration speeded up and so did the growth of JJ clusters and resettlement was not able
to keep pace with it (Government of Delhi, 2002).
Table 2.2 Location of Slums and Resettlement Colonies
Location near
, Railway track I
· River/ Nallah
Highway/ Road
Construction site
Industry
Religious/Public place
Other
Source NCAER (2002) Page No 203. 2002
Slum Resettlement Colonies
18.8
21.9
25.0 100.0
6.3
!5.6 0.0
12.5
All
15.0
17.5
40.0
5.0
12.5
10.0
In addition to the above settlement types, many slums also fall under
'unauthorised' colonies and to be regularised-unauthorised' colonies, which are later
regularised; though the exact proportion is not known?
The Slum and JJ wing of DDA has a more elaborate classification of slums in
Delhi; slums have been put into 7 categories, including those mentioned above (Sabir Ali,
2003).
• Legally Notified Slum Areas
• Jhuggi- Jhompri Clusters (JJ Clusters)
• Unauthorised Colonies and Harijan Bastis
66

• Urban vi llages
• Pavement Dwellers
• Resettlement Colonies
• Regularised Unauthorised Colonies
2.3 LOCATION OF SLUMS
In 200 l census , the total population of Delhi was around 13 8 lakh means 27 lakh
household lived in slums, Out of these around one fourth of the families are living in the
authorized colonies rest three fourth of the population lives in the slums, unauthorized
colonies or resettlement colonies . Apart from that a small fraction of population lives in
the urban vi llages and rest are houseless people living in open.
MAPN02.1 W ARDWISE CONCENTRATION OF SLUMS IN DELHI
Map not to scale
67

The numbers of Slums and the unauthorised colonies are growing at a great pace
and in the last fifty years its growth was unprecedented. In 195 I around 64,000 people
living in the JJ clusters but today there population has reached around 32 lakhs. Fifty
years back, the places having only 200 households; today they have around 1160
household's lives(Status report of Delhi, 2001), but as we look in to the data the
population of slums in 197 I and I 98 I they reduced drastically but after the short span of
time it again starts growing with good pace. Around 1.75 lakh slum populations are
resettled in to the resettlement colonies. (Status report of Delhi, 2001)
As we look at total population of the slums, there is no such drastic change as we
compare the total population and house holds of slums of Delhi; in I 97 I only I 124
settlements only 3 Lakh populations were residing but in 2001 out of I 160 settlements 32
Lakh population was residing in the slums. As we see from th.e data the settlement's not
growing at the very fast pace but the population residing on the slums are growing at a
very fast speed. (Due to large scale migration) (Pernia 2001)
Table 2.3 Population living in different types of livelihoods
Types Population %
J.J clusters 23.84
Resettlement Colonies 14.90
Unauthorised Colonies 26.08
Urban Villages 4.47
Notified Slum Areas 7.08
House less 0.44 ~
Authorised Colonies 23.18
Source: Delhi Municipal Corporation, 1994; SocioEconomic Profile of Delhi, 2000-01, Delhi Government Status report for Delhi21, Government of India, 200 I
In 1941-51 to there is big jump in the population of Delhi, Much of this is caused
by the migration from Pakistan and the ministry of rehabilitation was set up to specially
to settle the refugees
Between 1961- 71, the actual growth was 13% higher then anticipated by the
master plan and 24% more the notified; but this growth takes place largely because of the
68
Asiad games, which was not the part of master plan. It was estimated that almost 10 Lakh
people were brought to the city for construction work for games.
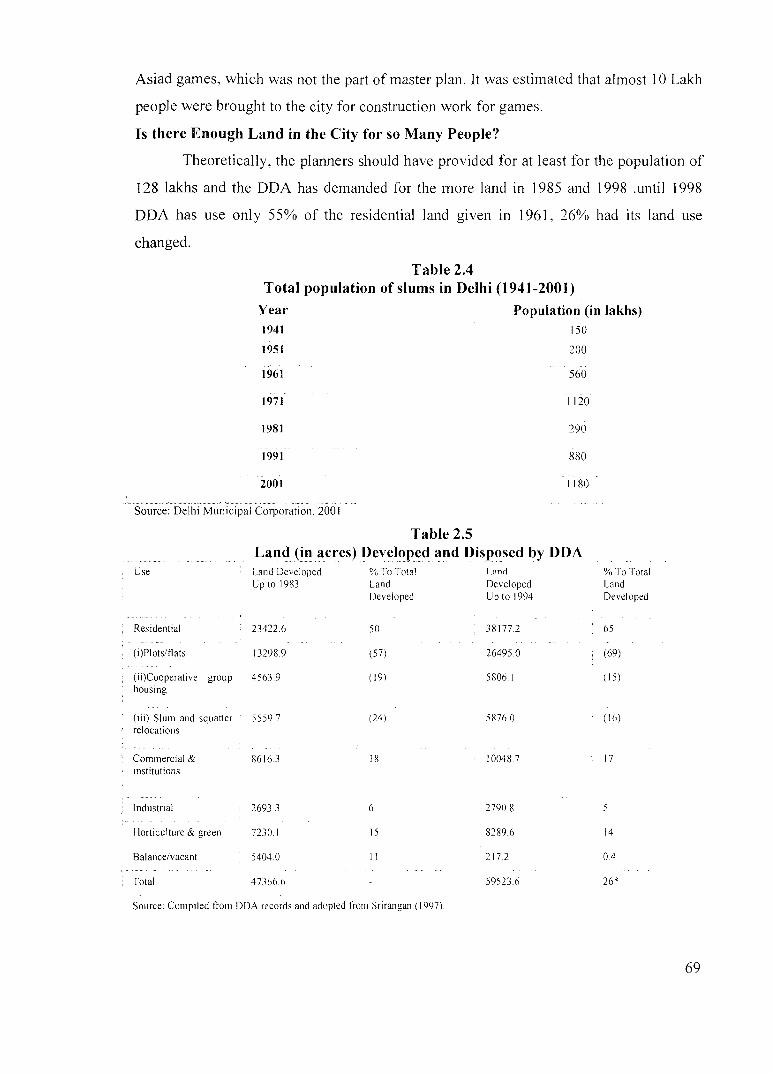
Is there Enough Land in the City for so Many People?
Theoretically, the planners should have provided for at least for the population of
128 lakhs and the DDA has demanded for the more land in 1985 and 1998 .until 1998
DDA has use only 55% of the residential land given in 1961, 26% had its land use
changed.
Table 2.4 Total population of slums in Delhi (1941-2001)
~-~" .~c~.~=< --~ ,_ .~~ ·= ~ ~~. v
Year 1941
1951
1961
1971
1981
1991
2001
Source: Delhi Municipal Corporation. 200 I
Table 2.5
Population (in lakhs) 150
200
560
1120
290
880
1180
Land (in acres) Developed and Disposed by DDA Use
Residential
(i)Plots/tlats
(ii)Cooperative group housing
(iii) Slum and squatter relocations
Commercial & institutions
Industrial
Horticulture & green
Balance/vacant
Total
Land Developed Up to 1983
23422.6
13298.9
4563.9
5559.7
8616.3
2693.3
7230.1
5404.0
4 7366.6
~1o To Total Land Developed
50
(57)
( 19)
(24)
18
6
IS
II
Source: Compiled trom DDA records and adopted from Srirangan ( 1997)
L3nd %To Total Developed Land Up to 1994 Developed
38177.2 65
26495.0 (69)
5806.1 ( 15)
5876.0 ( 16)
I 0048.7 17
2790.8 5
8289.6 14
217.2 0.4
59523.6 26*
69

Table 2.5 shows that about 38177 acres of land had been developed by august
1994. this took the form of specific housing ("residential") schemes executed by DDA
and housing developments executed as part of integrated development schemes ("sub-city
projects" or "integrated developments"), commercial and industrial complexes/estates,
and green areas. The DDA's land and property developments can be broadly categorised
into two groups such as residential and non-residential while only 12% was allotted for
the urban poor; mean while urban poor living in Delhi has increased from 4.4% in 1957
to 25% in 1981 to 40% in 1998, while the land allotted for the lags far behind; this
explains why the urban poor have been forced to live in substandard settlements .which is
treated as 'encroachments' 98.5% of the JJ clusters are within the urban area and provide
cheap and affordable labour to the city. Similarly 72% of the unauthorised colonies lie
outside the urban areas. Each JJ Cluster can be seen to occupy less than 0.36 hectares.
The majority (65%) is on DDA land but occupy only 47% of the land. This is less than
1% of the land given to the DDA in 1961 for residence purposes, while 23% of the total
population lives in JJ Clusters.
TABLE 2.6
TYPES OF SETTLEMENT NUMBERS AND TOTAL HOUSEHOLDS
Types Total number Lakh households
Slums I, 160 6.4
Unauthorised I ,500 7.0
Resettlement 52 4.0
Urban village 216 1.5
Footpath 0 0.5
Total 2928 19.4
Source NCPRB. 1999
Table 2.6 denotes the type of settlement number and total household in urban slums. The
largest share is contributed by slums and unauthorised colonies.
Origin of Slums and Their Development
Since Independence, the city of Delhi has been growing quite rapidly, especially
the informal sector. Industrialization has advanced, commercialization has increased and
a great deal of infrastructure building has taken place in the past 50 years; the number of
70

commercial activities and the industrial units rose from 26,000 in 1 971 to 1,3 7,000 in
1999 providing jobs to more than 14 Lakh workers. Only 25,000 units out of the total of
1.37 lakhs are functioning in the conforming industrial zones. Rests are in the non
conforming areas (NCPRB, 1999) means informal settlements act as catalyst for
urbanization.
The population of the city has also increased dramatically. From a small city of
4.1 lakh people in 191 1, Delhi has today become a giant metropolis of over 13 million
people .After 1951 the population of the city has grown by over 50% per decade,
migration counts for the much of the population. For example, in 1981 -91 almost 50% of
the population the migration has taken place from neighboring states of Uttar Pradesh
( 49.91 %) , Haryana (11.82%), Rajasthan(6.17%), Punjab(5.43%), and far off backward
states like Bihar( 1 0. 99% )(NCPRB, 1999).
Reasons for the Development of Slums
As we search for the reasons; the mam reason was Rapid urbanisation and
distorted development patterns has brought about migration of rural population to urban
settings in search of food and job Prevailing high disparity between rich and poor has
forced this migrant population to settle in the small groups in unauthorised colonies
called J.J .Clusters.
Year
1951 1956 1961 1966 1971 1973 1977 1981 1983 1985 1986
1987
1990 1994
1997
Source: Slum Wing. MCD 2003
Table: 2.7 GROWTH OF JHUGGIES IN DELHI
Jhuggies households in Delhi
12749 22415 42815 42668 62594 98483 20000 98709 113386 150000 200000
225000 259344
480929
600000
JJ Clusters
199
534
929
1080
II 00
71
Poverty, sub-human conditions, poor quality of life and lack of medical facilities
has resulted in higher incidence of disease of poverty and thus high mortality, morbidity
and birth rate pattern can be seen in the group of population. Today about 35% of Delhi
population is living in the J.J.Clusters and unauthorised colonies. Civic bodies are not
able to do provide required civic amenities as they are all settled in the area labeled as
unauthorised by civic authorities themselves
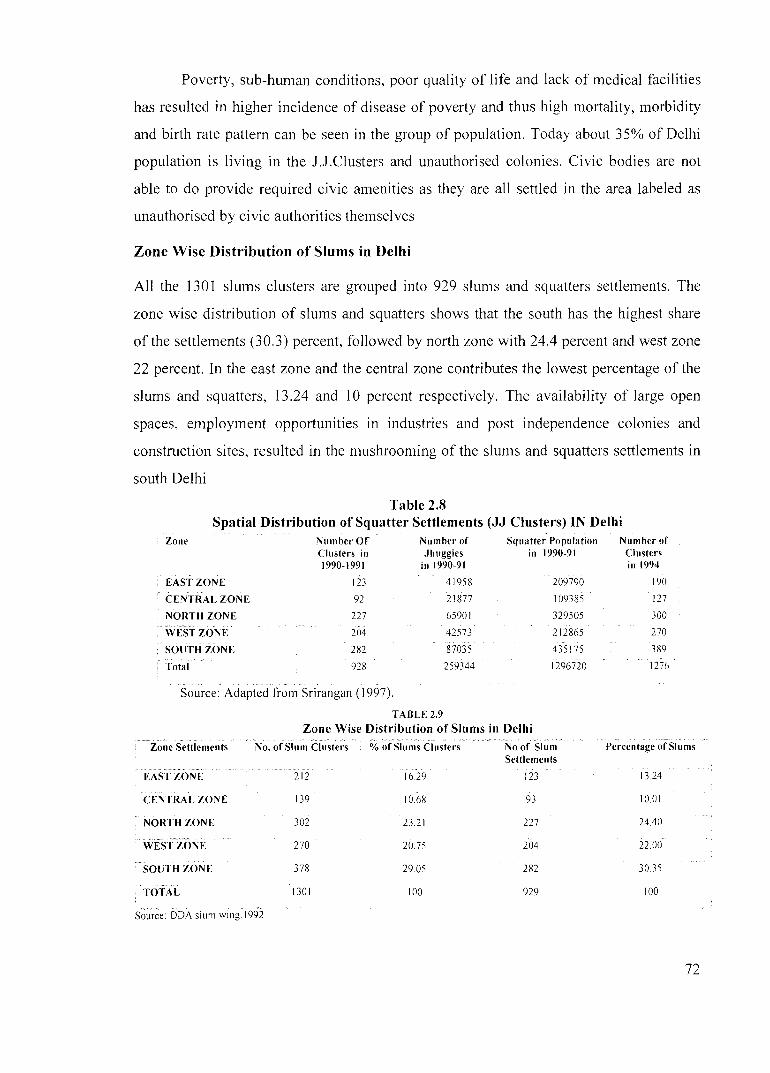
Zone Wise Distribution of Slums in Delhi
All the 1301 slums clusters are grouped into 929 slums and squatters settlements. The
zone wise distribution of slums and squatters shows that the south has the highest share
of the settlements (30.3) percent, followed by north zone with 24.4 percent and west zone
22 percent. In the east zone and the central zone contributes the lowest percentage of the
slums and squatters, 13.24 and 10 percent respectively. The availability of large open
spaces, employment opportunities in industries and post independence colonies and
construction sites, resulted in the mushrooming of the slums and squatters settlements in
south Delhi
Table 2.8 Spatial Distribution of Squatter Settlements (JJ Clusters) IN Delhi
Zone Number OF Number of Squatter Population Number of Clusters in .Jhuggies in 1990-91 Clusters 1990-1991 in 1990-91 in 1994
EAST ZONE 123 41958 209790 190
CENTRAL ZONE 92 21877 109385 127
NORTH ZONE 227 65901 329505 300
WEST ZONE 204 42573 212865 270
SOUTH ZONE 282 87035 435175 389
Total 928 259344 1296720 1276
Source: Adapted from Srirangan ( 1997).
TABLE 2.9
Zone Wise Distribution of Slums in Delhi
Zone Settlements No. of Slum Clusters %of Slums Clusters No of Slum Percentage of Slums Settlements
EAST ZONE 212 16.29 123 13.24
CENTRAL ZONE 139 I 0.68 93 I 0.01
NORTH ZONE 302 23.21 227 24.40
WEST ZONE 270 20.75 204 22.00 ...
SOliTH ZONE 378 29 05 282 3035
TOTAL 1301 roo 929 100
Source DDA slum wing.I99:Z
72

As Per table 2.1 0, the Slum Settlement Sizes Is Concerned, the smaller
settlements contributes larger share of the total slum settlements. Which includes less
then the 50 jhuggies contributes 31 percent of the total jhuggies. Less then 300 jhuggies
contributes to more then the 75 percent of the total slum settlements. More then 500 to
1000 jhuggies, I 000 -I500 jhuggies and more then I500 jhuggies contribute to the
meager share of 6 percent and 3 .I2 percent respectively.
Table 2,10 Distribution of Slum Settlements into Various Sizes
Settlement size
: Less then 50
51-100
: 101-300
301-500
501-1000
1001-1500
More than 1500
Source: DDA slum wing.1992
No of Settlements
359
15
226
78
58
29
29
2.4 Reasons for Emergence of Slums and Squatter Settlements
Percentage
30.64
16.14
24.30
8.39
6.24
3.12
3.12
Many reasons have been suggested as having encouraged squatter settlements in spite
of the operation of large-scale public land allocation and housing in Delhi to provide cross
subsidised low income housing opportunities (Basu, I988; Sundaram and Gambhir, I99I;
Parashar, I994; Payne, 1977; DDA, 1983; Ali, 1990; SPA, 1994; Srirangan, 1997):
1. On-affordable standards of government-built legal housing;
2. Acute housing shortage for low and lowest income groups who are mostly in
migrants who are not eligible for public land allocation (I 0 year residency
requirements) and/or find it difficult to afford the costs of public housing;
3. Inability of government to allocate adequate land and housing for poor and to check
the resale of resettlement plots that have encouraged re-squatting;
73
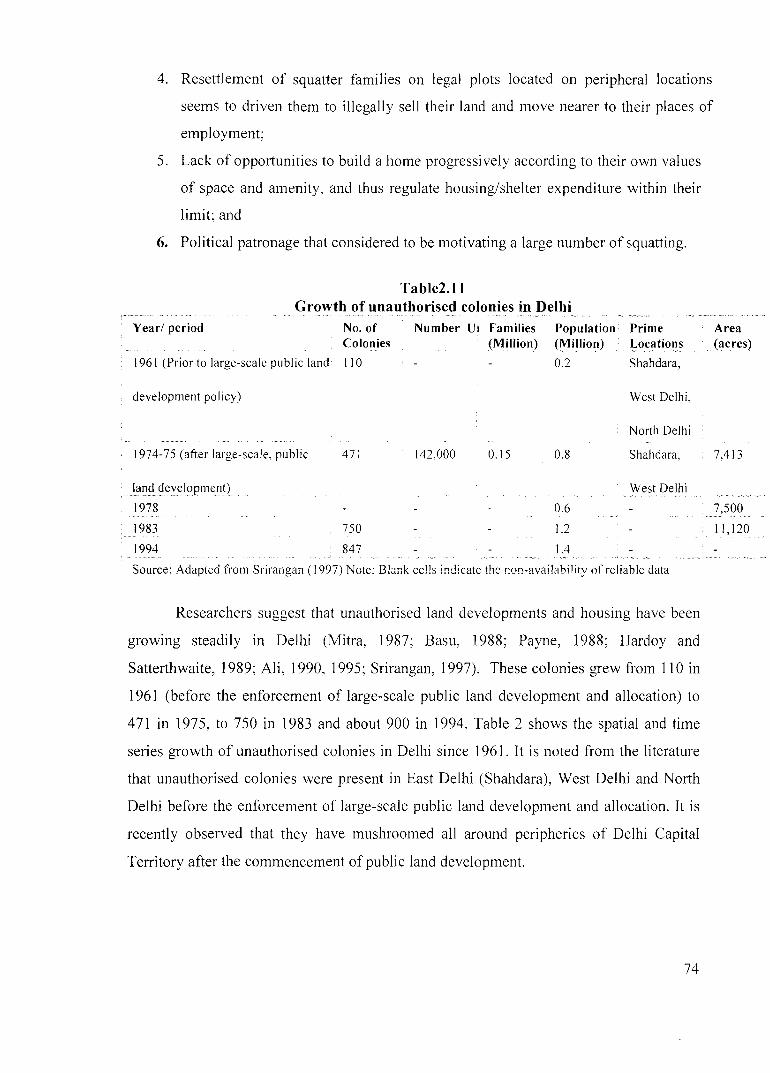
4. Resettlement of squatter families on legal plots located on peripheral locations
seems to driven them to illegally sell their land and move nearer to their places of
employment;
5. Lack of opportunities to build a home progressively according to their own values
of space and amenity, and thus regulate housing/shelter expenditure within their
limit; and
6. Political patronage that considered to be motivating a large number of squatting.
Table2.11 Growth of unauthorised colonies in Delhi
' ~'
Year/ period No. of Colonies
1961 (Prior to large-scale public land 110
development policy)
1974-75 (after large-scale, public
la':Jd de~el()pment)
1978
1983
1994
471
750
847
Number Ur Families (Million)
142,000 0.15
Population Prime (Million) Locations
0.2 Shahdara,
0.8
0.6
1.2
1.4
West Delhi,
North Delhi
Shahdara,
West Delhi
Source: Adapted from Srirangan ( 1997) Note: Blank cells indicate the non-availability of reliable data
Researchers suggest that unauthorised land developments and housing have been
growing steadily in Delhi (Mitra, 1987; Basu, 1988; Payne, 1988; Hardoy and
Satterthwaite, 1989; Ali, 1990, 1995; Srirangan, 1997). These colonies grew from 110 in
1961 (before the enforcement of large-scale public land development and allocation) to
471 in 1975, to 750 in 1983 and about 900 in 1994. Table 2 shows the spatial and time
series growth of unauthorised colonies in Delhi since 1961. It is noted from the literature
that unauthorised colonies were present in East Delhi (Shahdara), West Delhi and North
Delhi before the enforcement of large-scale public land development and allocation. It is
recently observed that they have mushroomed all around peripheries of Delhi Capital
Territory after the commencement of public land development.
74
Area (acres)
7,413
7,500
11,120
Interestingly, Srirangan (1997) observed from a systematic field study that the
majority of households (more than 55%) living in unauthorised colonies belong to low
income groups. This indicates that in spite of large-scale public land development and
cross-subsidisation for low-income groups still a large number still find shelter in
unauthorised land developments and housing areas. This situation is against the
conception of the large-scale public land development proposed by the Master Plan for
Delhi 1962. Sweden, the Netherlands and other countries that have operated similar land
development and allocation policies have not experienced this situation.
2.5 SOCIO - ECONOMIC PROFILE OF SLUMS IN DELHI
This Chapter deals with the Socio economic status of slums of Delhi. Since the
chapter includes all the slums of Delhi, an attempt has been made to compare the status
with respect to each characteristic, viz Scheduled Castes Population, Scheduled Tribes
Population, Literates. Total Workers, Main Workers (i) Cultivators (ii) Agricultural
Labourers, (iii) Household Industry Workers (iv) Other Workers, Marginal Workers (i)
Cultivators (ii) Agricultural Labourers, (iii) Household Industry Workers (iv) Other
Workers and Non-Workers;. Also their housing conditions and health status have been
studied.
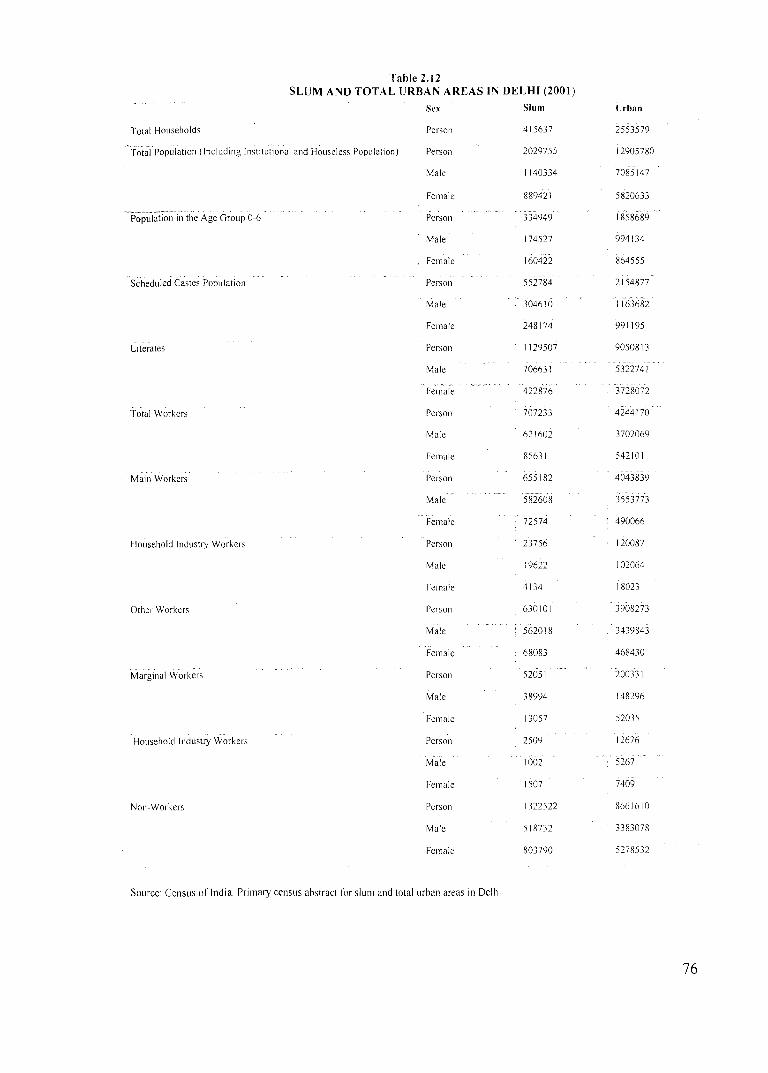
As per the primary census abstract table 2.1, the slum household population in Delhi
is four Lakh fifteen thousand six hundred thirty seven out of twenty five fifty three
thousand five hundred seventy nine households. In Delhi, Out of 1.29 crore of the total
urban population around 21 Lakh population lives in the urban slums. The total male
population is higher in the slums, which is eleven Lakh forty thousand in comparison to
the eight Lakh eighty nine thousand populations of the females.
The scheduled caste population constitutes the lower strata of the society (Bhende
1999) and remains are the marginal position. There population in the total slum
population is very less, out of the total 21 Lakh 54 thousand of the total scheduled caste
population, only 5.5 Lakh lives in the urban slums. The proportion of male and female is
also show small variation and male dominate the total population contributing more the
55 percent of the total household.
75
Tahle 2.12 SLUM AND TOTAL URBAN AREAS IN DELHI (2001)
Sex Slum Urban
Total Households Person 415637 2553579
~"Tota"l Populatron (Including Institutional and Houseless Population) Person 2029755 12905780
Male 1140334 7085147
Female 889421 5820633
Person 334949 1858689
Male 174527 994134
Female 160422 864555
Scheduled Castes Population Person 552784 2154877
Male 304610 1163682
Female 248174 991195
Literates Person 1129507 9050813
Male 706631 5322741
Female 422876 3728072
Total Workers Person 707233 4244170
Male 621602 3702069
Female 85631 542101
Main Workers Person 655182 4043839
Male 582608 3553773
Female 72574 490066
Household Industry Workers Person 23756 120087
Male 196~2 I 02064
Female 4134 18023
Other Workers Person 630101 3908273
Male 562018 3439843
Female 68083 468430
Marginal Workers Person 52051 200331
Male 38994 148296
Female 13057 52035
Household Industry Workers Person 2509 12676
Male 1002 5267
Female 1507 7409
Non" Workers Person 1322522 8661610
Male 5 18732 3383078
Female 803790 5278532
Source: Census of India. Primary census abstract for slum and total urban areas in Delhi
76
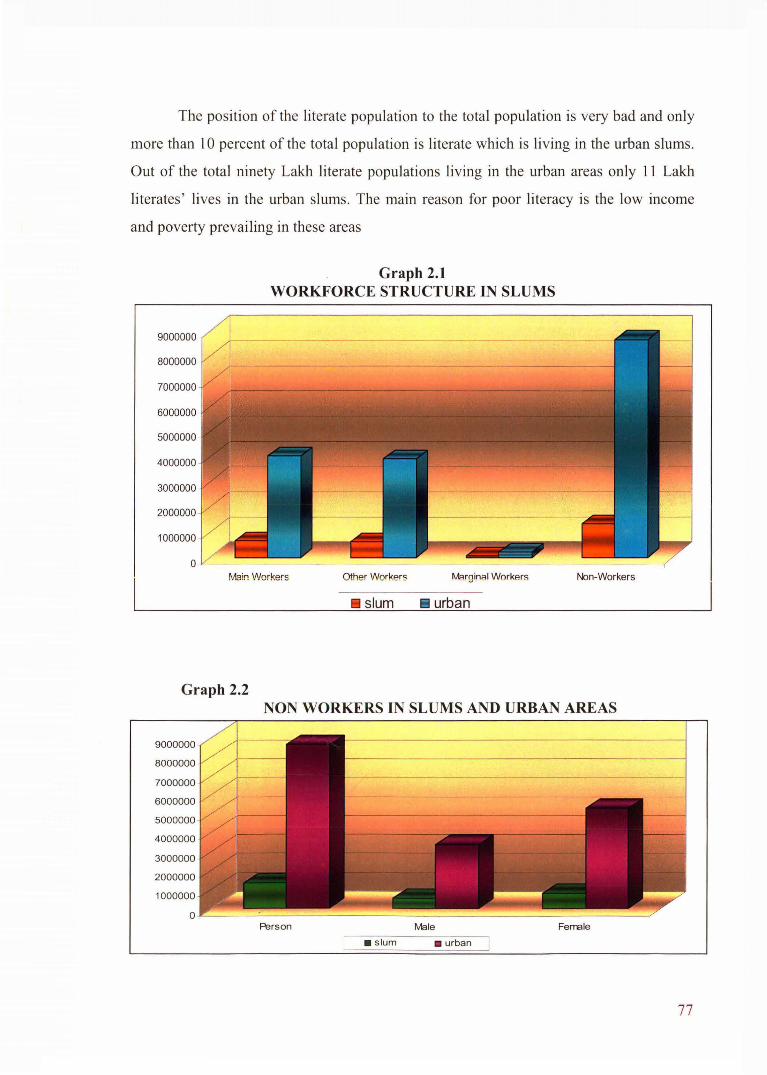
The position of the literate population to the total population is very bad and only
more than l 0 percent of the total population is literate which is living in the urban slums.
Out of the total ninety Lakh literate populations living in the urban areas only 11 Lakh
literates' lives in the urban slums. The main reason for poor literacy is the low income
and poverty prevailing in these areas
Graph 2.1 WORKFORCESTRUCTUREINSLUMS
Main Workers Other Worker flklrgin'!l Workers Non-Workers
• slum urban
Graph 2.2 NON WORKERS IN SLUMS AND URBAN AREAS
9000000
8000000
7000000
6000000
5000000
4000000
3000000
2000000
1000000
0 Person Male Ferrale
• slum • urban
77
l

As the workers in the slum areas are concerned out of four categories of main
workers namely cultivators, agricultural workers, household industry workers and other
workers. Cultivators and agricultural labourers contribute less then l percent of the total
workers so they are not taken for the study.
The figure 2.A shows highest share is contributes by non workers,. Only 2 percent
is contributed by other household workers . In terms of the total marginal workers of the
slum is concerned, the position remain same as the main worker population and here also
the total marginal workers are dominated by the other workers and the cultivators,
agricultural workers and other industry workers contribute very less percentage of the
total workers.
Graph 2.3 TOWN-WISE TOTAL POPULATION AND SLUM POPULATION IN DELHI
(2001}
10000000
9000000
8000000
7000000
6000000
5000000 4000000
3000000
2000000
1000000
0 New Delhi M.micipal
Council (NDrv'C)
Delhi Cantonrrent C8 Delhi M.micipal
Corporation (IVCD)
• Total Population • Total Slum Pop
others
The proportion of the slum non workers to the total non working urban population
is 1.3 lakhs Figure 2 B. The non workers include old people, females and the children ' s.
The percentage of females as non workers is very high in the urban slums as compare to
the urban settlements
Socio-Economic Profile of Slum (Households) in Delhi
Socio economic profile of Delhi JJ clusters is calculated on the basis of the several
parameters namely no of house holds, Size of House, Size of Household, Types of
78
Occupation, Self-employment, Wage Employment, Skilled, Unskilled, Household Income,
Literacy Rate, Percentage of Children, Migrated from, Major Diseases, Male/Female Sex
Ratio, Working Women and Average Saving per month.
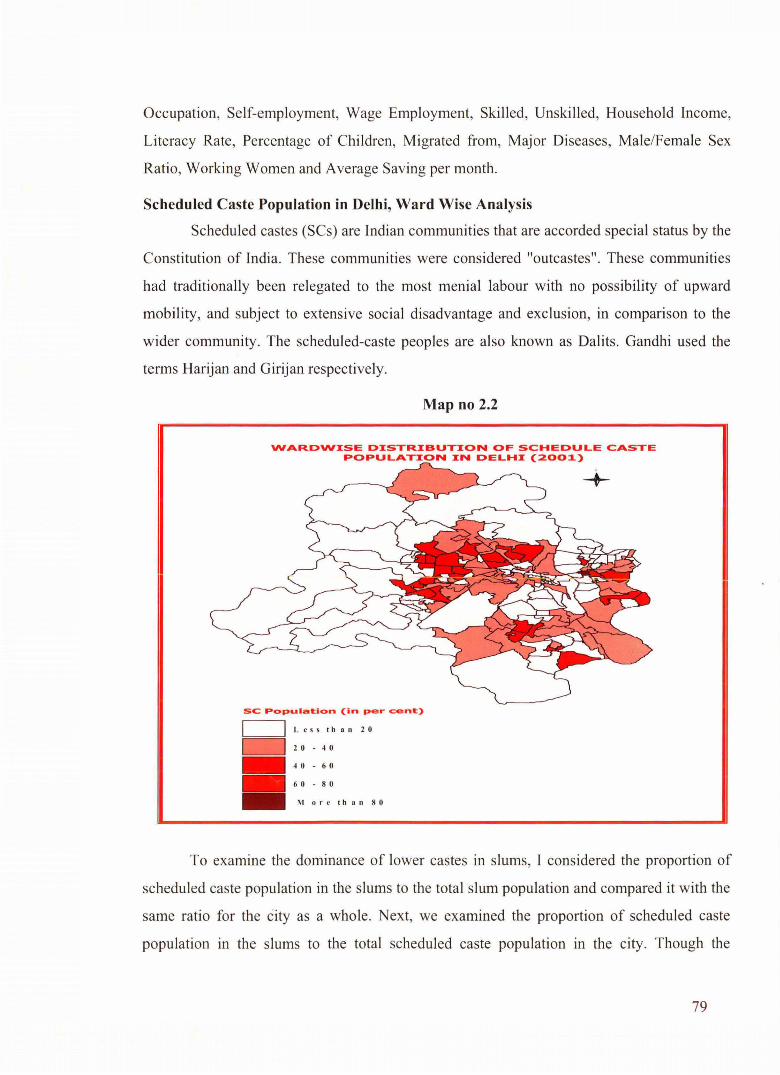
Scheduled Caste Population in Delhi, Ward Wise Analysis
Scheduled castes (SCs) are Indian communities that are accorded special status by the
Constitution of India. These communities were considered "outcastes". These communities
had traditionally been relegated to the most menial labour with no possibility of upward
mobility, and subject to extensive social disadvantage and exclusion, in comparison to the
wider community. The scheduled-caste peoples are also known as Dalits. Gandhi used the
terms Harijan and Girijan respectively.
Map no 2.2
WARDWISE DISTRIBUTION OF SCHEDULE CASTE POPULATION IN DELHI (2001)
+
SC Populat:lon (In per cent:)
Lc ss than20
2 0 - 4 0
4 0 - 6 0
6 0 - 8 0
Mor c than80
To examine the dominance of lower castes in slums, I considered the proportion of
scheduled caste population in the slums to the total slum population and compared it with the
same ratio for the city as a whole. Next, we examined the proportion of scheduled caste
population in the slums to the total scheduled caste population in the city. Though the
79
percentage of scheduled caste population in the slums turned out to be higher than that in the
city as a whole for all the four metropolitan cities of Bombay, Calcutta, Delhi and Madras,
the incidence of scheduled caste population in the slums did not turn out to be exceedingly
high, particularly in the slums of Bombay and Calcutta (1 0.75 and 15.02 per cent
respectively). Even in the slums of Delhi and Madras nearly 65 and 60 per cent of the slum
population were non-scheduled caste. As regards the proportion of scheduled caste
population in the slums to the total scheduled caste population in the city it was noted that
except in Delhi and Madras it was these figures were not very high. Around 67 per cent of
the scheduled caste population in the city of Delhi resided in the slums, and in Madras the
corresponding figure was more than 90 per cent. However, in Bombay and Delhi slums their
prominent presence was not visible (23 and 34 per cent respectively). One may still hold that
it was actually difficult for them to find an entry to secure accommodation in slums and,
hence, they might have been residing in other unhygienic localities - not even suited to be
called as slums and pavements. But even in such a situation.
The converse of the statement, i.e. most of the slum dwellers are from lower castes is
certainly not correct. The disadvantaged classes have migrated to the cities from the rural
areas either recently or decades back through caste, kinship and village networks, but the
existence of other castes in slums due to the shortage of housing, i.e., the phenomenon of
downward social mobility, certainly can not be overlooked.(Mitra 2001)
As we look into the ward wise distribution of slums of Delhi, map no 2.3 clearly
provides the real picture of the proliferation of the slums. Figure states that only one slum
has scheduled caste population more then the 7 percent which is ward number 1, termed as
very concentration of slums, which lies in the central Delhi. Mitra stated in his study on
slums that the central parts of the city have large because of the services they have to
provide.
The second group belongs to the areas which are peripheral to the largest number of
the scheduled caste population. These are the areas west of the largest concentration of
scheduled caste in Delhi. The Map no 2.2 denotes the high concentration of scheduled caste
in the range of 4.75 percent to 7.75 percent in west Delhi. This is area near to the western
side of the Yamuna River includes the New Delhi municipal corporation area. Another
concentration which is left to the largest concentration is in ward number two.
80
Medium concentration of scheduled caste population is largely concentrated in the
western Delhi comprise ofward no 33 , 34 41 , 42, 39and wards no 17 to 26.
The low concentration of the scheduled caste population termed as low concentration
is agglomerated in the areas outside the territory of New Delhi municipal corporation and
army cantonment. Majority of the low scheduled caste concentration is located in the areas of
the south east Delhi .
Rests of Delhi do not have good scheduled caste concentration and all shows below
0. 75 concentration of scheduled caste in Delhi.
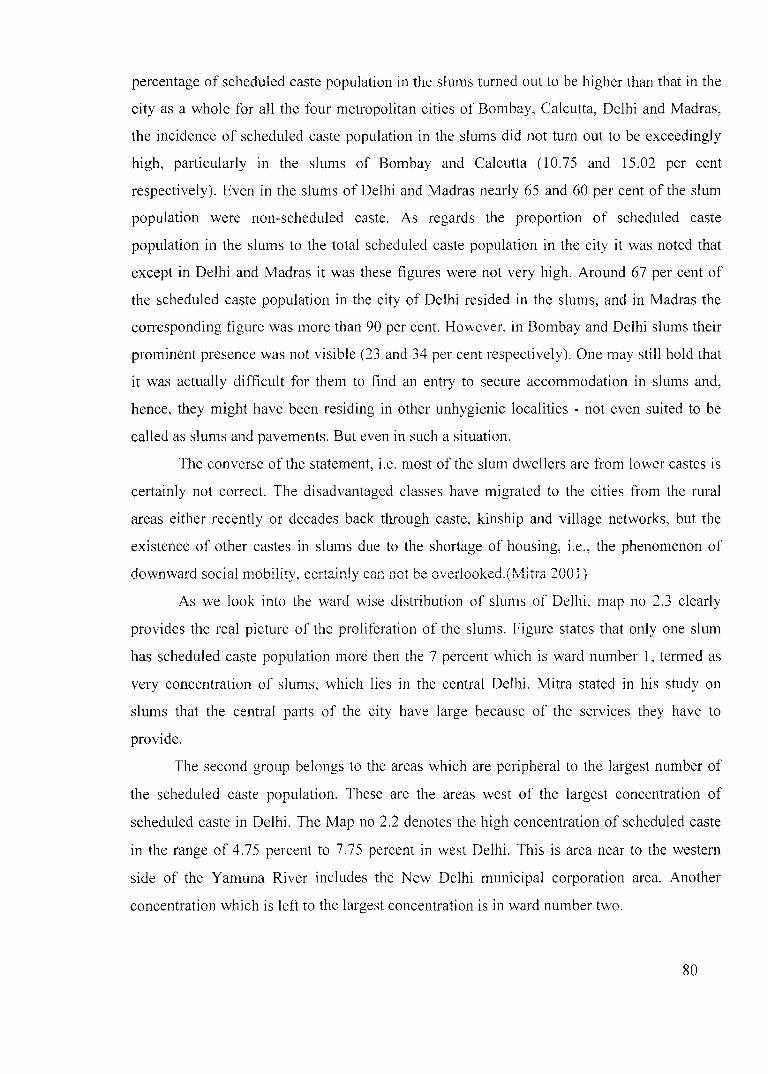
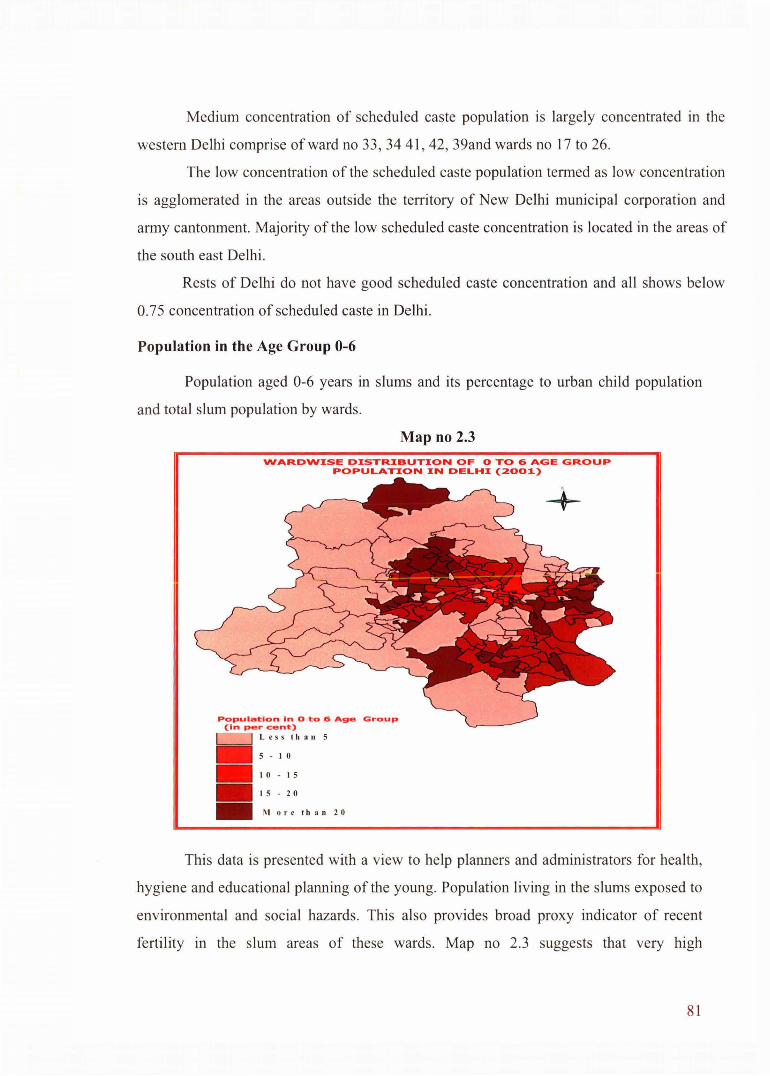
Population in the Age Group 0-6
Population aged 0-6 years in slums and its percentage to urban child population
and total slum population by wards.
Map no 2.3
VVARDVVISE DISTRIBUTION OF 0 TO 6 AGE GROUP POPULATION IN DELHI (2001)
+
Populat:lon In 0 t:o 6 Age Group (In per cent:)
L ess than 5
5 - I 0
I 0 - I 5
I 5 - 20
Morethan20
This data is presented with a view to help planners and administrators for health,
hygiene and educational planning of the young. Population living in the slums exposed to
environmental and social hazards. This also provides broad proxy indicator of recent
fertility in the slum areas of these wards. Map no 2.3 suggests that very high
81

concentration of slums is located in the ward areas of all directions. The maJor
concentration of the slums is located in the north, central, eastern and the southern part.
The very high concentration is located in the wards namely 101 in north, 31, 32,
33, 34, 35 and 29 in north western wards. In the south western part only 45, 46 and 29
wards have concentration more then the twenty percent of the population. Another major
concentration is located in the eastern side of Delhi mainly the yamuna pushta areas of
Delhi. Here the larger concentration is located in the small slums
The high concentration of the population in the age group of 0-6 is largely concentrated
in the central Delhi and in the eastern and south eastern part of Delhi. Here the
concentration is in the range of 15 to 20 percent. The wards included are 20-35 and I 00-
125. Here the population is very but due to large labour force employed here the
population in the age group of 0-6 is not very high; but its proportion is high in terms of
other wards are concerned.
Rest of the wards shows very less percentage of medium concentration of
population. It is located in the peripheral areas of the central Delhi in its eastern part.
Low and very concentration is concentrated in west, north south but this is a very
significant fact that eastern and central areas have low proportion of the 0- 6 population
in theses areas.
Main \Vorkers in Delhi, Wardwise Analysis
Main workers were those who had worked for the major part of the year
preceding the date of enumeration i.e., those who were engaged in any economically
productive activity for 183 days (or six months) or more during the year. As per the main
workers of the different wards is concerned, the largest concentration is included in the
area of central, eastern and south eastern parts of Delhi shown in Map no 2.4.
Map no 2.4 denotes, the proportion is very high in the central, eastern and south eastern
areas of Delhi. Here the proportion is around 80-1 00 percent of the total workers the very
concentration is very much correlated with the major highways moving to other states.
The high concentration found in nearby areas of the very high concentration,
the ward are 14, 69. The medium concentration is located in the areas in between central
and south Delhi. The ward names are 52, 17 and 91.
82
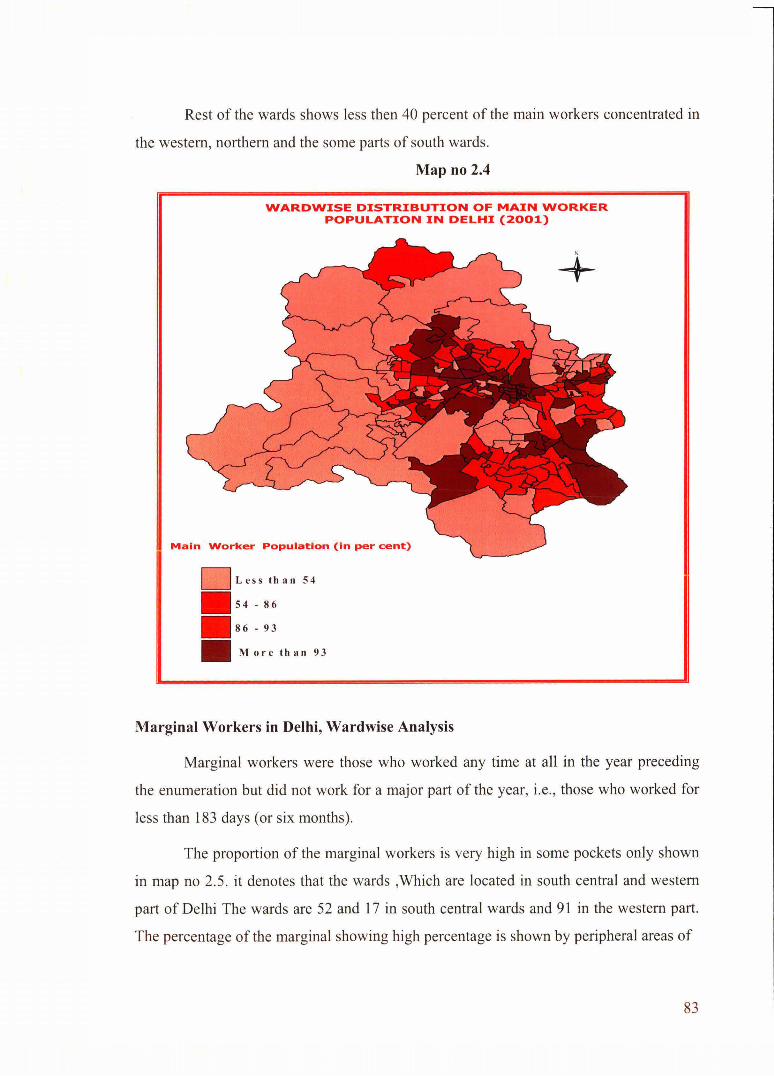
Rest of the wards shows less then 40 percent of the main workers concentrated in
the western, northern and the some parts of south wards.
Map no 2.4
WARDWISE DISTRIBUTION OF MAIN WORKER POPULATION IN DELHI (2001)
Main Worker Population (in per cent)
D Less than 54
lll s4 -86
lll s6- 93
Ill More than 93
Marginal Workers in Delhi, Wardwise Analysis
+
Marginal workers were those who worked any time at all in the year preceding
the enumeration but did not work for a major part of the year, i.e., those who worked for
less than 183 days (or six months).
The proportion of the marginal workers is very high in some pockets only shown
in map no 2.5. it denotes that the wards ,Which are located in south central and western
part of Delhi The wards are 52 and 17 in south central wards and 91 in the western part.
The percentage of the marginal showing high percentage is shown by peripheral areas of
83

Map no 2. 5
WARDWISE DISTRIBUTION OF MARGINAL WORKER POPULATION IN DELHI (2001)
Marginal Worker Population (in per cent)
l_] Less than 12
D 12 _ 24
24 - 36
. 36-48
• '\1orethan48
' +
the central, south eastern and western parts of the Delhi wards. Its percentage is more
then 13 percent but less then 29 percent. The percentage of the medium size
concentration belongs to the southern and western parts respectively. It includes Trans
yamuna and south Delhi areas. Its range varies from 7 - 13 percent respectively
The low concentration is concentrated in the areas of central and north
western part of Delhi. The lowest concentration carry very large proportions of the
population have very low marginal workers
Non-Workers in Delhi Slums, Wardwise Analysis
Non-workers were those who had not worked any time at all in the year preceding
the date of enumeration. Main activity of a person who was engaged in more than one
activity was reckoned in terms of time disposition. For example, if a person had worked
84

as a daily wage labourer for four months, as an agricultural labourer for one month and as
a cultivator for two months he was reckoned as daily wage labourer. Since, he had spent
more time in this activity than as a cultivator or agricultural labourer.
A person who normally worked but had been absent from work during the
reference period on account of illness, holiday, temporary closure, strike etc., was treated
as engaged in the work he would have otherwise have been doing, but for his temporary
absence. Persons under training such as apprentices, with or without stipend or wages
were treated as workers. A person, who had merely been offered work but had not
actually joined, was not treated as engaged in that work.
The proportion of the non workers is very large in some areas of central, south
eastern and western parts of Delhi. These areas include mayor Vihar and vasundhara in
west, kalkaji, Malviya nagar and Greater kailash in south and in central part it is located
in the Anand parbat Karol bagh and its adjoining areas. North also have greater
concentration of the non workers. Here the proportion of the non workers is more than 20
percent and less then 25 percent.
The higher concentration is reported from the fringe areas of the very high.
concentration areas namely south eastern part, central and western part of Delhi. Here the
range varies from 15 to 20 percent respectively shown by map no 2.6.
The medium level concentration is found in the areas of west, south and central
pats respectively but the proportion of the wards is very high in this range as compare to
the other classes of the slum wards. Here, the range varies from 10 to 15 percent.
The concentration of low and the very low non workers in slums is scattered all
over the Delhi. The major concentrations of non workers are located in south eastern,
western south central and norihern parts. Here the range varies from 5 to 1 0 percent. The
concentration of very low non worker population is located all parts of Delhi and no area
of the Delhi shows that non worker does not live there. There in small concentration
largely under in the south western, southern, northern and south central have very low
concentration of non worker.
85

Map no 2.6
WARDWISE DISTRIBUTION OF NON WORKERS POPULATION IN DELHI (2001)
Les s than 12
I 2 - 2 4
2 4 - 3 6
- 36-48
- Morethan48
N
+
86
ENDNOTES
i) census of India, office of registrar general of India, new Delhi,200 1 ii) slums of India, NSSO report no- 486, 2002, New Delhi
87