chapter 3vtechworks.lib.vt.edu/bitstream/handle/10919/26489/chapter_3.pdfstrain gauge . 41 figure...
TRANSCRIPT

35
CHAPTER 3
3 CHAPTER 3
Geocomposite Membrane Effectiveness as a Strain Energy
Absorber
3.1 ABSTRACT
The objective of this chapter is to evaluate the potential of a specially designed
geocomposite membrane to delay the reflection of cracks in flexible pavement systems.
A two-dimensional (2D) finite element model, which simulates different rehabilitated
pavement structures, was developed to evaluate the geocomposite membrane effects on
the crack initiation and propagation phases. Four contour lines were simulated around
the crack to allow the calculation of the path independent J-Integral. Analysis of results
indicates that the geocomposite membrane is effective in dissipating a large amount of
energy around the cracked region. The placement of a soft interlayer creates a protective
shield around the crack tip, separating the criticality of the stress field in the cracked
region from the bottom of the overlay. Moreover, a compressive horizontal stress field
around the crack tip helps closing the crack rather than opening it. As for the crack
propagation phase, the geocomposite membrane would be effective only if the crack does
not pass through the interlayer, and propagates horizontally at the interlayer-existing
pavement interface. This has been verified by field cores and falling weight
deflectometer (FWD) measurements. When a soft interlayer is used, more vertical and
horizontal deformations are expected, and therefore fatigue of the overlay should be
adequately addressed through the proper design and selection of the overlay thickness.

36
3.2 INTRODUCTION
Reflection of cracks in Hot-Mix Asphalt (HMA) overlays represents a serious challenge
associated with pavement rehabilitations. Since the early 1930s, considerable resources
and efforts have been spent to find new and relatively inexpensive techniques to delay
reflection cracking (Barksdale 1989). Unfortunately, to date, the longest delay that
pavement agencies are hoping for is usually one to five years (Roberts et al. 1996).
Among new techniques proposed for delaying or reducing reflection cracking is the use
of geosynthetics. There are currently two types of geosynthetic materials, which have
been designed to perform the strain energy absorption function: nonwoven geotextiles,
and geocomposites, which combine the main function of different geosynthetics to obtain
a multi-purpose system.
It is well documented that incorporation of a woven geotextile into a flexible
pavement can improve the pavement’s performance and its service life when used as a
separator over weak subgrade (Al-Qadi et al. 1994; Loulizi et al. 1999; Suits and Koerner
2001). Field evidence and laboratory testing also suggest that both geogrids and
geotextiles can improve the performance of flexible pavement systems constructed on
weak soil (Al-Qadi et al. 1994; Barksdale 1989). Moreover, some design practices
suggest that the use of reinforcing interlayer systems provides substantial savings in
HMA thickness, increases the number of load repetitions to failure, or reduces permanent
deformation in flexible pavement systems (Kennepohl et al. 1985). Unfortunately,
several of the proposed design practices have been introduced by the industry and are not
supported by theoretical explanation, and hence, rely mostly on empirical and arbitrary
rules. The idea that geosynthetics will result in better long-term performance of the
pavement is too simple a view of a very complex situation. To accurately quantify the
benefits of geosynthetics to flexible pavement systems for reducing reflection cracking, a
better understanding of the contributing mechanisms is necessary. This can only be
achieved by linking field observations and measurements to well-established engineering
theories. This chapter illustrates how the link between theoretical and experimental
observations can be established to evaluate the effectiveness of a specially designed
geocomposite membrane system to act as a strain energy absorber. The geocomposite

37
membrane consists of a 2-mm-thick low modulus polyvinyl chloride (PVC) backed on
both sides with polyester nonwoven geotextile. The experimental results presented in
this study were obtained based from various falling weight deflectometer (FWD) testing
conducted at the Virginia Smart Road. More details about the Virginia Smart Road were
presented in Chapter 2 and in Appendix A. The following section discusses the
installation procedure of the geocomposite membrane in section K. The pavement design
in section K is shown in Figure 3-1.
Figure 3-1. Pavement Design in Section K at the Virginia Smart Road
Surface Mix SM-9.5D Base Mix
Cement-treated drainage layer
21B aggregate layer
Open-graded friction layer
Geocomposite membrane
225mm
75mm
150mm
Section K
19mm

38
3.3 GEOCOMPOSITE INSTALLATION
3.3.1 Optimum Tack Coat
The amount of tack application has a significant effect on the performance of the
interlayer in retarding the propagation of the crack. In fact, it was reported that an excess
of tack coat above the optimum amount may have a positive effect on the interlayer
performance (Lytton 1989). Prior to the installation of the geocomposite membrane, an
experimental program was undertaken to determine the optimum asphalt binder tack coat
rate needed in the field (Donovan 1999). This testing simulated the slippage that may
occur at the geocomposite membrane interface by applying a cyclic constant shear
loading to a geocomposite membrane sandwiched between two pavement layer materials
(see Figure 3-2). To evaluate the optimum amount of tack coat rate, the number of cycles
to cause shear failure at the interface was measured. Results of the experimental program
indicated that the optimum tack coat rate is 1.40kg/m2 between the geocomposite
membrane and the base HMA layer, and 1.50kg/m2 between the geocomposite membrane
and the surface HMA.
Figure 3-2. A Photograph of the Loading Fixture (after Al-Qadi and Elseifi 2002)

39
It is worth noting that the interlayer performance is mainly controlled by its bonding to
the surrounding layers. Three scenarios are possible for each interface (interface between
the interlayer and the HMA overlay, and interface between the interlayer and the existing
HMA layer): full bonding conditions (which is rarely achieved in the field), friction-type
contact (which is usually accounted for in the field), and unbonded conditions (which is
rarely encountered in the field unless delamination occurs due to insufficient tack coat).
3.3.2 Geocomposite Membrane Installation
Figure 3-3 illustrates the general layout of the installation in section K. The installation
of the geocomposite membrane in section K was slightly different than the previous
procedure explained in Chapter 2; it was installed after placing two lifts of BM-25.0
HMA base. The presence of the embedded sensors required extra-care during the
geocomposite membrane installation to avoid any damage to the instruments. The
installation of the instruments was very successful with a total loss of less than 5% during
construction and less than 14% after one year of service. This number is very low when a
loss of 50% is not unusual (Ullidtz 1987).
A tack coat was applied underneath the geotextile of the geocomposite membrane
to prevent it from moving during installation of the upper layer, and to the top of the
geotextile of the geocomposite membrane to prevent the absorption of liquid asphalt
during construction of the upper HMA layer. A rate of 1.40kg/m2 was used underneath
the lower geotextile.
After the installation of the geocomposite membrane and prior to applying the
tack coat on top of it, a pneumatic-tired roller (PTR) was used to compact the
geocomposite membrane to ensure good adhesion between the geocomposite membrane
and the underneath layer (see Figure 3-4). Tack coat was then applied to the upper
geotextile of the geocomposite membrane at a rate of 1.30kg/m2 in the driving lane and
1.50kg/m2 in the passing lane. Another lift of BM-25.0 was then applied on top of the
geocomposite membrane.

40
Figure 3-3. Layout of the Installation in Section K
Pressure Cell
Thermocouple
Strain Gauge
41
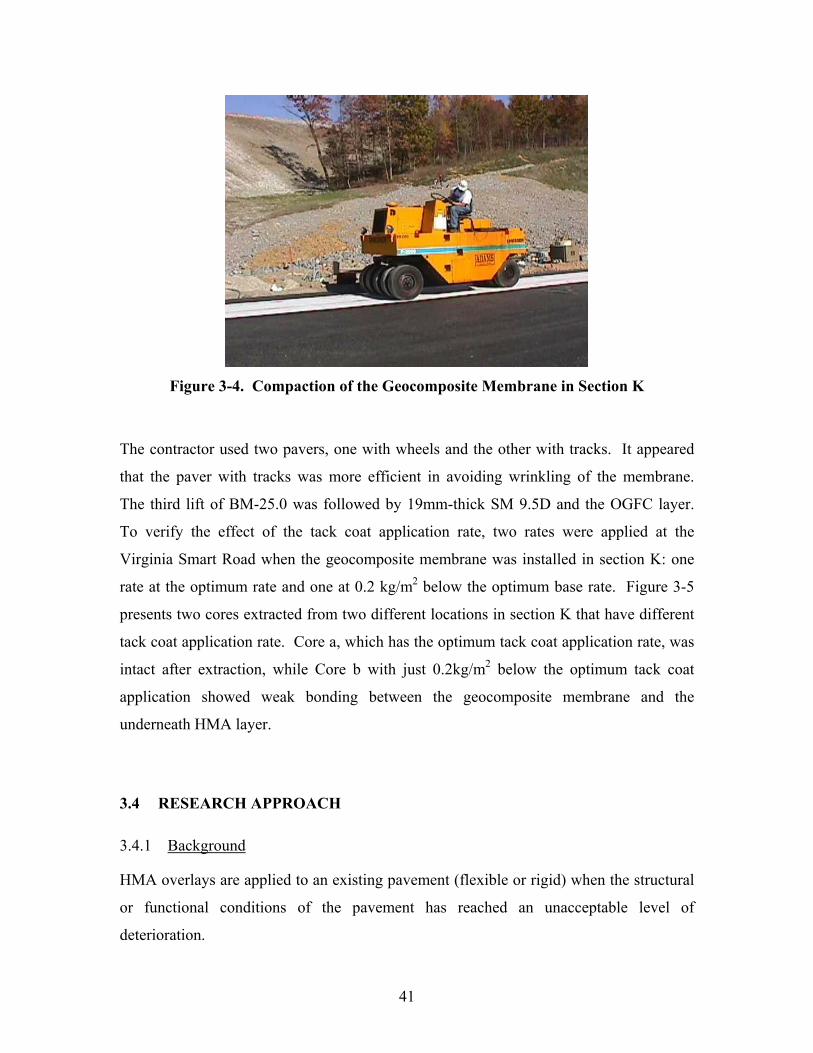
Figure 3-4. Compaction of the Geocomposite Membrane in Section K
The contractor used two pavers, one with wheels and the other with tracks. It appeared
that the paver with tracks was more efficient in avoiding wrinkling of the membrane.
The third lift of BM-25.0 was followed by 19mm-thick SM 9.5D and the OGFC layer.
To verify the effect of the tack coat application rate, two rates were applied at the
Virginia Smart Road when the geocomposite membrane was installed in section K: one
rate at the optimum rate and one at 0.2 kg/m2 below the optimum base rate. Figure 3-5
presents two cores extracted from two different locations in section K that have different
tack coat application rate. Core a, which has the optimum tack coat application rate, was
intact after extraction, while Core b with just 0.2kg/m2 below the optimum tack coat
application showed weak bonding between the geocomposite membrane and the
underneath HMA layer.
3.4 RESEARCH APPROACH
3.4.1 Background
HMA overlays are applied to an existing pavement (flexible or rigid) when the structural
or functional conditions of the pavement has reached an unacceptable level of
deterioration.

42
Core a
Core b
Figure 3-5. Extracted Cores from the Virginia Smart Road
Most of the overlays are designed to reflect the increase in pavement resistance to fatigue
and rutting distresses (Bayomy et al. 1996; Pierce et al. 1993). Pavements that are
structurally sound after the placement of the overlay, and that are adequately designed
against rutting and fatigue distresses, may show cracking patterns similar to the existing
ones in the old pavement after a short period of time (Jacobs et al. 1992). This pattern is

43
known as ‘reflective cracking’. Although certainly the most common failure mechanisms
in rehabilitated pavements, the reflection of existing cracks in the pavement through the
overlay, is rarely considered in the original design.
Reflection cracks are caused by discontinuities (cracks or joints) in underlying
layers, which propagate through a HMA overlay due to continuous movement at the
crack prompted by thermal expansion and traffic loadings. If the new overlay is bonded
to the distressed layer, cracks in the existing pavement almost always propagate to the
surface within one to five years; as early as few months have sometimes been reported
(Chen et al. 1992).
According to Lytton (1989), the passing of a wheel load over a crack in the
existing pavement causes three critical pulses (one maximum bending and two maximum
shear stresses). As the movement of the crack increases, the propagation of the crack to
the overlay occurs faster. The difference in temperature can also contribute to the crack
propagation. Contraction and curling of the old rigid pavement caused by temperature
variations results in the opening of the cracks that induce horizontal stresses in the HMA
overlay. Although seasonal temperature variations affect the reflection cracking process,
especially when dealing with rehabilitations of rigid pavements, only the damage due to
traffic loadings has been considered in this study. The main focus in this study is given
to the rehabilitation of deteriorated flexible pavement structures.
More recently, Read (2000) acknowledged the merits of fracture mechanics
approach to simulate crack propagation in HMA. However, Read emphasized that HMA
is a 3 phase bituminous material (binder matrix, coarse aggregate, and air voids), which
differs from continuous (homogeneous) material for which the fracture mechanics theory
was developed. Based on extensive laboratory testing and image analysis technique,
Read (2000) found that cracks in HMA attempt to follow the shortest route around the
interface between the coarse aggregate and the matrix, which appears to be the path of
least resistance. If an aggregate is encountered in this path, the crack propagation would
be delayed. In contrast, a void may accelerate this process.
44
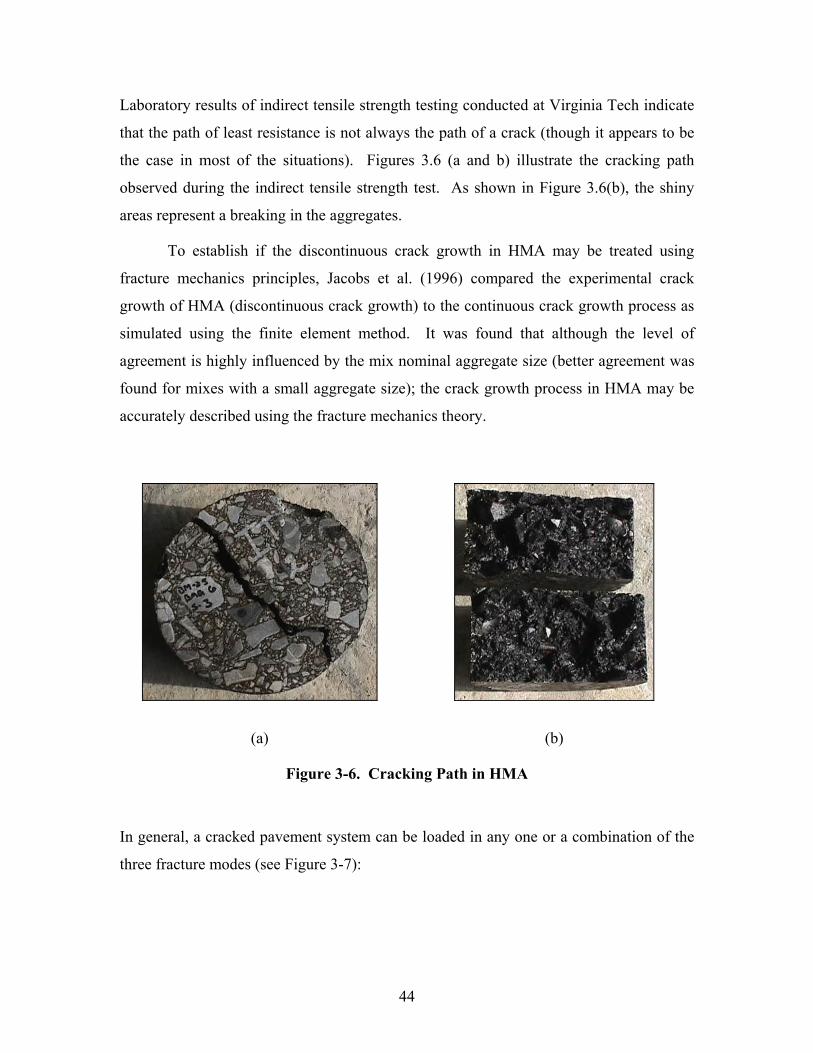
Laboratory results of indirect tensile strength testing conducted at Virginia Tech indicate
that the path of least resistance is not always the path of a crack (though it appears to be
the case in most of the situations). Figures 3.6 (a and b) illustrate the cracking path
observed during the indirect tensile strength test. As shown in Figure 3.6(b), the shiny
areas represent a breaking in the aggregates.
To establish if the discontinuous crack growth in HMA may be treated using
fracture mechanics principles, Jacobs et al. (1996) compared the experimental crack
growth of HMA (discontinuous crack growth) to the continuous crack growth process as
simulated using the finite element method. It was found that although the level of
agreement is highly influenced by the mix nominal aggregate size (better agreement was
found for mixes with a small aggregate size); the crack growth process in HMA may be
accurately described using the fracture mechanics theory.
(a) (b)
Figure 3-6. Cracking Path in HMA
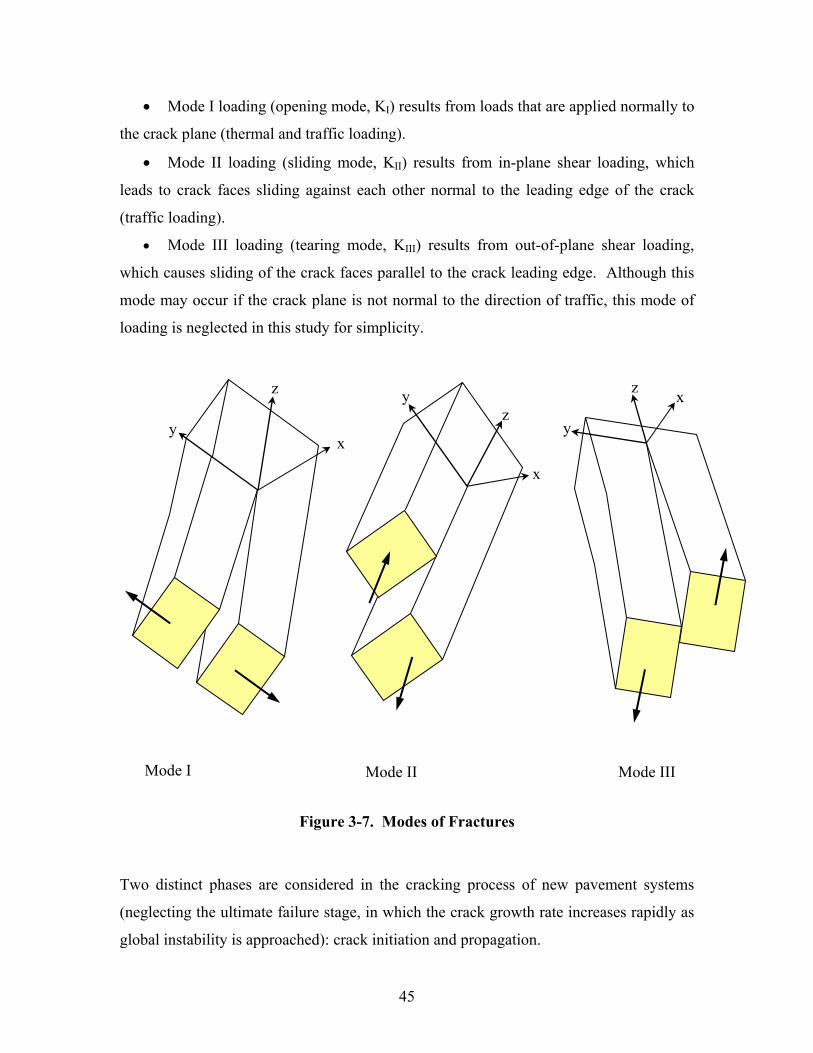
In general, a cracked pavement system can be loaded in any one or a combination of the
three fracture modes (see Figure 3-7):
45
• Mode I loading (opening mode, KI) results from loads that are applied normally to
the crack plane (thermal and traffic loading).
• Mode II loading (sliding mode, KII) results from in-plane shear loading, which
leads to crack faces sliding against each other normal to the leading edge of the crack
(traffic loading).
• Mode III loading (tearing mode, KIII) results from out-of-plane shear loading,
which causes sliding of the crack faces parallel to the crack leading edge. Although this
mode may occur if the crack plane is not normal to the direction of traffic, this mode of
loading is neglected in this study for simplicity.
Figure 3-7. Modes of Fractures
Two distinct phases are considered in the cracking process of new pavement systems
(neglecting the ultimate failure stage, in which the crack growth rate increases rapidly as
global instability is approached): crack initiation and propagation.
Mode I Mode II
x
y z
y
z
xy
z x
Mode III

46
• The crack initiation phase, which is composed of two stages of microcracking and
formation of macrocracks, is defined by the number of load repetitions required to form a
visible damaged zone at the bottom of the overlay (Uzan 1997). The original damage
may occur at the bottom of the HMA layer and grow upwards or it may also directly
show at the surface due to the stress concentration around the tire treads. The number of
cycles of a specific load a pavement can withstand before it cracks may be related to the
critical strain using a fatigue law (Vanelstraete et al. 2000):
aCN ε= (3.1)
where
N = number of cycles before crack initiation;
ε = critical strain;
C = constant of the fatigue line; and
a = slope of the fatigue curve.
The direction of the strain to be used on Equation (3.1) depends on the failure mechanism
under consideration. For example in the case of fatigue cracking, the horizontal tensile
strain at the bottom of the HMA layer is used. In case of reflective cracking induced by
Mode II loading, the number of cycles for crack initiation may be determined as follows
(BRCC 1998):
76.4zx
1410x856.4N −− ε= (3.2)
where
N = number of cycles before crack initiation; and
εzx = shear strains 10mm above the existing crack.

47
When the reflection of cracks is considered, the pavement service life against crack
initiation may be much shorter than with regular distresses (such as fatigue cracking)
since the crack is already well established in the existing pavement.
• The crack propagation phase, which represents the stage where the crack
propagates to the surface through the entire thickness of the HMA overlay. A description
of the crack propagation phase in flexible pavements can be based on the empirical power
law developed by Paris and Erdogan (1969):
n)K(AdNdc
∆= (3.3)
where
c = crack length;
N = number of loading cycles;
A and n = fracture parameters of the material; and
∆K = stress intensity factor amplitude.
Although the general trend within the pavement society is to believe that Paris’ law
adequately describes the rate of crack growth in HMA overlay (Majidzadeh et al. 1969;
Lytton 1989), the application of this approach in this study is valid when acknowledging
the following assumptions:
• Since no exact definition of the stress intensity factor for a multi-layer pavement
system is available, a regression analysis was performed to define the stress intensity
factor as a function of the crack length (c) for each of the considered designs. The
developed regression models are dependent on the assumed stiffness for the pavement
layers and the crack propagation resistance of the mix.

48
• The computed number of cycles is highly sensitive to the assumed values of the
fracture parameters (A and n). The correct way to determine the fracture parameters of a
material (A and n) is to examine the stable crack growth of HMA beam samples under
repeated loading conditions, which is a tedious and expensive operation (Francken 1993).
Since no direct measurements of the fracture parameters (A and n) were feasible in this
study, and since such testing are not expected to be conducted in a routine overlay design,
theoretical relations between the fracture parameters of the material and its creep
properties are suggested (Schapery 1982):
m2n = (3.4)
where
m = slope of the log creep compliance versus log time curve.
Several relations were proposed to calculate the second fracture parameters (A). For
example, the A parameter may be determined by means of the calculated n parameter as
follows (Jacobs et al. 1996):
nbaAlog += (3.5)
where
a and b = regression coefficients (e.g., a = -1.42 and b = -1.55).
Another model relates the A parameter to the mix properties follows (Lytton et al. 1993):
E00000066.0AClog704209.4AV184408.0605104.2Alog −−+−= (3.6)

49
where
AV = air voids (%);
AC = asphalt content (%); and
E = resilient modulus of the mixture (in psi).
The previous equation was derived based on the results of controlled strain beam fatigue
data with a coefficient of determination (R2) of 0.89 and a root mean square error
(RMSE) of 0.26. From the previous equation, it can be noticed that the more air voids or
the less asphalt content in the mix, the greater the A parameter, and therefore the shorter
the fatigue life. This may explain why stone-mastic asphalt (SMA) provides superior
performance than regular mixtures. Stone-mastic asphalt is usually characterized by its
high asphalt content, and the lower percentage of air voids. This common logic is not
very clear in Equation (3.5). As seen from this equation and from Paris Law (Equation
3.3), the greater the n parameter, the shorter the fatigue life. However, the greater the n
parameter, the smaller the A parameter, and therefore, the longer the fatigue life is. This
contradiction is not well explained in the literature, and requires further investigation.
Therefore, Equation (3.6) was adopted in this study.
Based on this concept, Figure 3-8 illustrates the variation of the creep compliance
with time for a typical section at the Virginia Smart Road (section B) at three different
temperatures on a logarithmic scale. Using the linear regression equations shown in this
figure, one can determine the first fracture parameter (n) from the slope of the line based
on Equation (3.4). It may be noticed that the first fracture parameter gradually increases
with the increase in temperature indicating a faster crack propagation rate at higher
temperatures. However, it should be emphasized that the second fracture parameter (A)
also varies with the change in temperature. Based on the results of creep and resilient
modulus testing, three levels were defined for the fracture characteristics of the HMA.
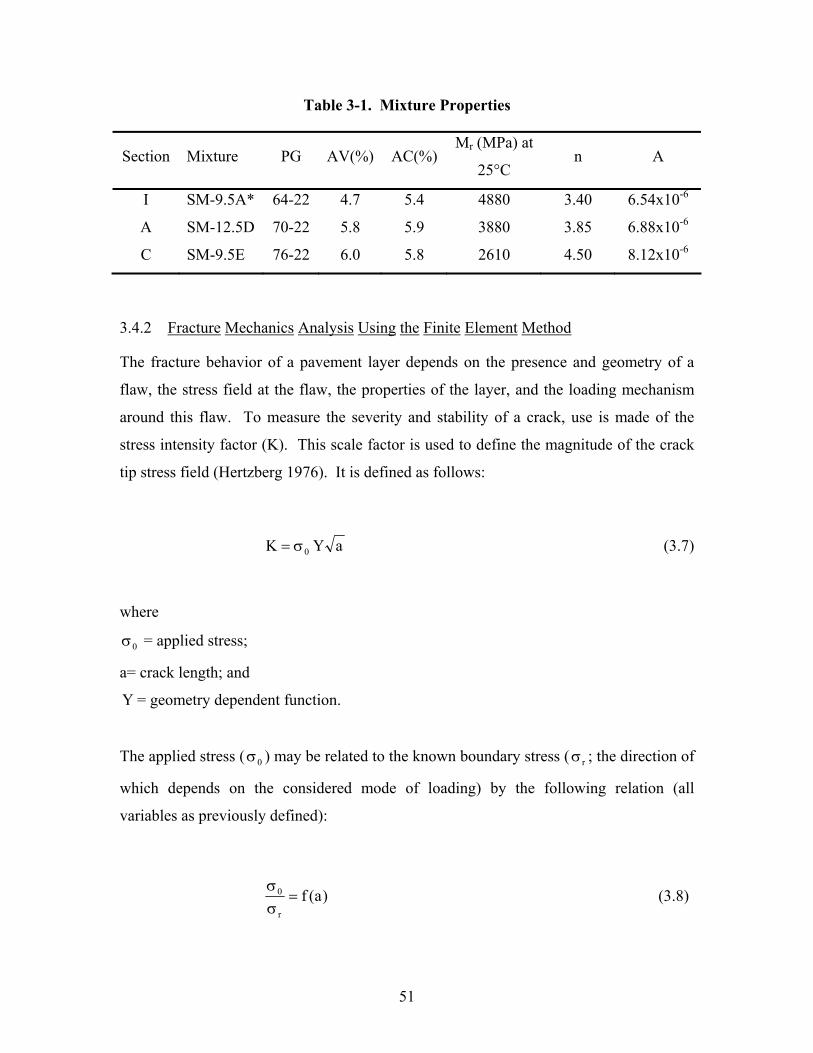
Table 3-1 presents the mixture properties used to establish these three levels:
• Type I: n = 3.40 and A = 6.54x10⁻⁶ m/cycle.MPa.m0.5
• Type II: n = 3.85 and A = 6.88x10⁻⁶ m/cycle.MPa.m0.5

50
• Type III: n = 4.50 and A = 8.12x10⁻⁶ m/cycle.MPa.m0.5
As previously indicated in previous studies (Jacobs et al. 1996; Mobasher et al. 1997), a
weak or a high air void mixture would typically lie on a Type III category, while a strong
mixture would be better represented through Type I. To accurately evaluate the number
of cycles for the crack to propagate from a location c1 to a location c2, the stress intensity
factor was determined using the finite element method (FEM) for different locations of
the crack.
1.0E-12
1.0E-11
1.0E-10
1.0E-09
1.0E-08
1.0E-07
1 10 100Time (sec)
Cre
ep C
ompl
ianc
e (1
/Pa)
5°C 25C 40C
log (D)=0.5373log(t)-9.821R2=0.98
log (D)=0.5031log(t)+0.7837R2=0.94
log (D)=0.6915log(t)-11.407R2=0.94
Figure 3-8. Variation of the Creep Compliance with Time for Section B (SM 9.5-D)
51
Table 3-1. Mixture Properties
Section Mixture PG AV(%) AC(%) Mr (MPa) at
25°C n A
I SM-9.5A* 64-22 4.7 5.4 4880 3.40 6.54x10⁻⁶
A SM-12.5D 70-22 5.8 5.9 3880 3.85 6.88x10⁻⁶
C SM-9.5E 76-22 6.0 5.8 2610 4.50 8.12x10⁻⁶
3.4.2 Fracture Mechanics Analysis Using the Finite Element Method
The fracture behavior of a pavement layer depends on the presence and geometry of a
flaw, the stress field at the flaw, the properties of the layer, and the loading mechanism
around this flaw. To measure the severity and stability of a crack, use is made of the
stress intensity factor (K). This scale factor is used to define the magnitude of the crack
tip stress field (Hertzberg 1976). It is defined as follows:
aYK 0σ= (3.7)
where
0σ = applied stress;
a= crack length; and
Y = geometry dependent function.
The applied stress ( 0σ ) may be related to the known boundary stress ( rσ ; the direction of
which depends on the considered mode of loading) by the following relation (all
variables as previously defined):
)a(fr
0 =σσ (3.8)
52
where
f(a) = geometry dependent function.
A given material can resist the unstable propagation of the crack as long the stress
intensity factor is below the fracture toughness (Kc) of the material (Dowling 1993). In
contrast to the stress intensity factor, the fracture toughness is a quantity that is
independent of the crack geometry and of the loading imposed on the structure (Kanninen
and Popelar 1985). To date, fracture toughness for HMA has not been well defined. The
plane strain fracture toughness (KIc) was reported to be around 0.77 MPa.m0.5 at a
temperature of –1°C for regular HMA (Mobasher et al. 1997).
The commercial software ABAQUS 5.8-1 was used in this study to compute the
stress intensity factor (ABAQUS 1998). This program indirectly calculates the stress
intensity factor using the path independent integral, called J-integral. The J-integral is
defined as the change in mechanical energy per unit area of new crack surface (see Figure
3-9 for illustration; Rice 1968):
∫Γ
∂∂
−= dsxuTUdnJ (3.9)
where
Γ = a curve that surrounds the crack tip;
U = strain energy density;
n = direction normal to the crack line;
T = traction vector;
u = displacement vector; and
ds = differential element of arc Γ.

53
Figure 3-9. Rice’s J-Integral
The major advantage of this technique is by simulating the singularity at the location of
the crack, and hence, the stresses are calculated at the vicinity of the crack based on this
fact. This may not be achieved with ordinary finite element models with fine meshes.
After the calculation of the J-integral, the stress intensity factor may be determined as
follows (assuming plane strain condition and omitting the effect of Mode III loading for
the considered pavement structure):
)KK(E
1J 2II
2I
2
+ν−
= (3.10)
where
υ = Poisson’s ratio;
E = Elastic modulus; and
KI and KII = Stress intensity factor associated with Mode I and Mode II loading,
respectively.
Y
Xcrack
Γ
n
T
ds

54
The main drawback of this technique is that the calculated stress intensity may be a
combination of different modes of loading; and therefore caution is recommended in the
analysis and interpretation of the results.
3.4.2.1 Applicability of Linear Elastic Fracture Mechanics
Paris Law in its form presented in Equation (3.3) is only applicable to linear elastic
materials. It is well documented that asphalt binder is not a linear elastic material, and
consequently, HMA is better represented by a viscoelastic-plastic behavior. Although
attempts were made to extend Paris Law for elastic-plastic fatigue crack propagation
cases using the J-Integral instead of the stress intensity factor in Equation (3.3); however
it is not yet validated (Gdoutos 1993). Given this inconsistency, pavement materials are
usually assumed to behave elastically in fracture because of their large size as compared
to the developed plastic zone (Al-Balbissi and Little 1990). In this study, linear elastic
fracture mechanics (LEFM) is assumed valid based on the findings of previous researches
(Erkens 1997; Uzan 1997). This assumption allowed using Paris Law in its original
format to predict the overlay service life against crack propagation.
3.5 FINITE ELEMENT FORMULATION
The strain energy absorption capabilities of the geocomposite membrane were first
evaluated utilizing a theoretical FE approach. The criticality of the stress field associated
with each mode of loading as well as the crack propagation stage was investigated using
a focused two-dimensional (2D) mesh to calculate the stress intensity factor for different
crack locations. This section discusses the major assumptions made during the modeling
process.
The developed model simulates a typical flexible pavement overlay (see Figure 3-
10): an existing pavement structure consists of a 127mm cracked HMA layer and a
203mm base layer. A HMA overlay with variable thicknesses (H) is applied to the
cracked HMA.
55
Figure 3-10. Schematic of the Considered Pavement Structure
To investigate the geocomposite membrane effectiveness, two models were developed,
one incorporating the geocomposite membrane between the cracked HMA layer and the
overlay, and the second with the overlay applied directly on top of the HMA as a control.
All materials were considered linear elastic with the respective moduli shown in Table 3-
2 for the different investigated cases.
Table 3-2. Overview of the Investigated Cases
Layer Case 1 Case 2 Case 3
Case ID A B C
Overlay Thickness (mm) 50.8 76.2 101.6
Overlay Modulus (MPa) 4135 4135 4135
HMA Modulus (MPa) 2415 2415 2415
Base Modulus (MPa) 240 240 240
Subgrade Modulus (MPa) 70 70 70
Base
HMA Overlay
Cracked HMA
Subgrade
H1
127
203
56
3.5.1 Model Dimensions and Geometry
The dimension of the modeled portion is 2260mm x 420mm. These dimensions were
selected to reduce any edge effect errors, while keeping the elements’ sizes within
acceptable limits (modeling constraints). The generated mesh distribution was designed
to give an optimal accuracy (small elements around the crack and large elements far from
the crack). While 6mm elements were used in the region close to the crack, 12.5mm
elements were used in the regions far from the crack. All elements were 8-nodes
biquadratic (CPE8R) to improve the level of accuracy. Due to the large number of
degrees of freedom (22000), reduced integration elements were selected to increase the
rate of convergence. All layers were simulated with the same shape to preserve the
continuity of nodes between consecutive layers. In total, 3800 elements were needed to
simulate this problem. ABAQUS generated an additional 263 contact elements to
simulate contact between the layers. Infinite elements (CINPE5R) were used to simulate
the far-field region in the model. This type of element is useful in eliminating edge effect
errors when the region of interest is small in size compared to the surrounding medium.
Figures 3-11 and 3-12 illustrate the general layout of the developed model.
Figure 3-11. General Layout of the 2D Finite Element Model
57
Cracked Area Along the Existing Pavement
Simulation of the Singularity at the Crack Tip
Figure 3-12. Illustration of the Cracked Region in the Developed Model
3.5.2 Model Constraints and Contact Modeling
Elastic element foundations were used to simulate the support, provided by the subgrade,
to the pavement structure. These elements, which act as nonlinear springs to the ground,
provide a simple way of including the stiffness effects of the subgrade without fixation of
nodes at the bottom of the model. Due to the possible axisymmetric position of the crack
with respect to the load, a full model was developed. A static single tire load (26kN) was
assumed with a uniform pressure of 724kPa applied over a circular area.
Two cases were investigated for the surface interaction between the overlay and
the existing pavement: fully-bonded (compatibility of stresses and strains), and friction-
type contact. On the other hand, the surface interaction between the base and subgrade
layers was assumed to be a friction-type contact (Mohr-Coulomb theory). This
assumption is based on the fact that when granular surfaces are in contact, they usually
transmit shear as well as normal forces across their boundary. Small sliding was also
allowed between the aggregate layers. This formulation assumes that the surfaces may
experience arbitrarily large rotations; but a slave node will interact with the same local
area of the master surface throughout the analysis.

58
3.5.3 Crack Simulation and Creation of the Singularity
A crack was induced in the existing HMA layer (see Figure 3-11). Two crack locations
were investigated: at the center of the load (significant tensile stress, which is usually
assumed to represent the maximum value), and at the edge of the load (maximum shear
stress). To create the singularity at the crack tip, a focused mesh was developed (see
Figure 3-12). As previously mentioned, the major advantage of this technique is that the
FE program ‘understands’ that a crack is present at the location of the singularity, and
calculates the stresses around the crack tip based on this fact.
To create a singularity of order r1/2, the mid-side nodes along the sides of the
cracks were moved to the quarter positions next to the crack tip. To validate the
singularity, all elements around the crack tip were quadratic elements, and then
‘collapsed’ to form triangular elements. This focused mesh also allows evaluating the J-
integral through different contour lines (four contour lines are shown in Figure 3-12).
Numerical tests suggest that the results of the first contour line do not provide a high
level of accuracy. Therefore, only the results of three contour lines were considered. The
path independent J-integral was calculated at different locations of the crack to study the
geocomposite effects on both the crack initiation and propagation phase.
3.6 MODEL RESULTS AND ANALYSIS
3.6.1 Accuracy of the Calculated Stress Intensity Factor
The path independent J-integral was calculated over three different contour lines (see
Figure 3-12). Each contour is a ring of elements completely surrounding the crack tip
from one crack face to the opposite crack face. The calculated J-integral should be
independent of the domain used (small variations may exist due to the approximate
nature of the finite element). The statistical robustness of the obtained results is
presented in Figure 3-13.
59
0.0
1.0
2.0
3.0
4.0
5.0
6.0
7.0
8.0
9.0
10.0
50.8 76.2 101.6Overlay Thickness (mm)
Coe
ffici
ent o
f Var
iatio
n (%
)without geocomposite
with geocomposite
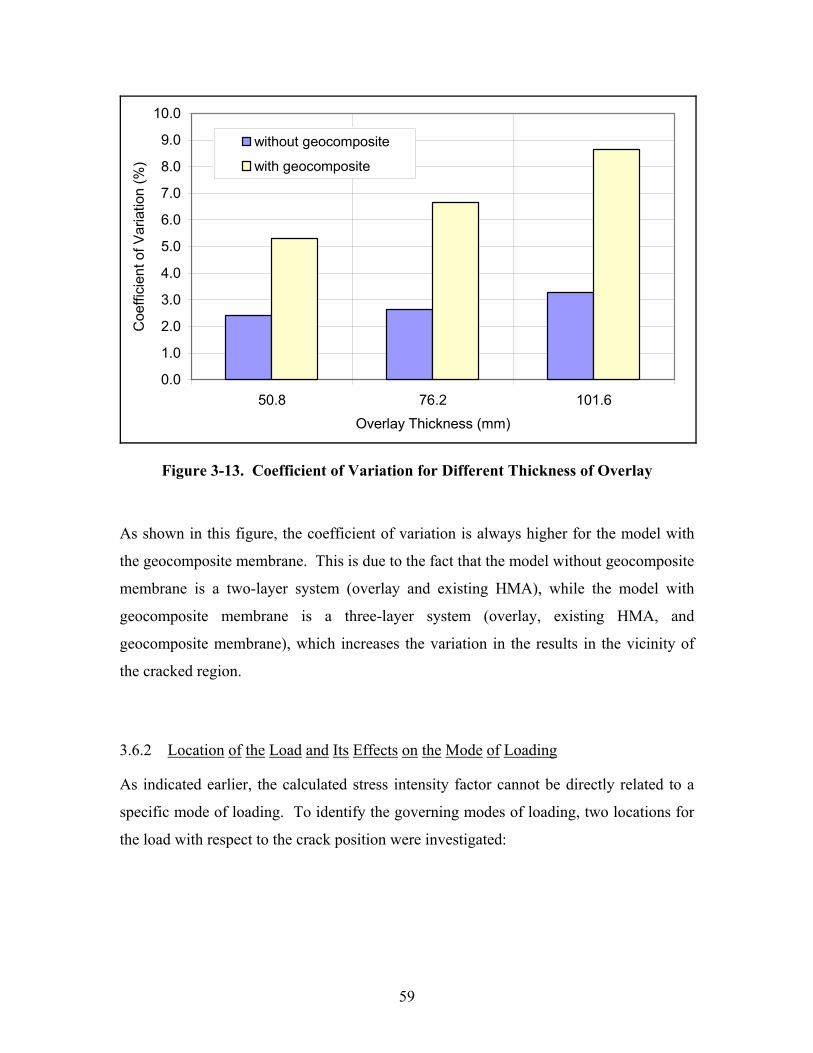
Figure 3-13. Coefficient of Variation for Different Thickness of Overlay
As shown in this figure, the coefficient of variation is always higher for the model with
the geocomposite membrane. This is due to the fact that the model without geocomposite
membrane is a two-layer system (overlay and existing HMA), while the model with
geocomposite membrane is a three-layer system (overlay, existing HMA, and
geocomposite membrane), which increases the variation in the results in the vicinity of
the cracked region.
3.6.2 Location of the Load and Its Effects on the Mode of Loading
As indicated earlier, the calculated stress intensity factor cannot be directly related to a
specific mode of loading. To identify the governing modes of loading, two locations for
the load with respect to the crack position were investigated:

60
• Crack underneath the center of the load, which may result in a Mode I loading
configuration since the shear stress at the crack tip may be neglected in this case
(symmetric loading).
• Crack at the edge of the load, which may result in a combination of Mode I and
Mode II loading configuration since the shear stress at the crack tip is maximum, and the
tensile stress is significant. Figure 3-14 illustrates the variation of the shear stress with
the distance from the center of the load based on a multi-layer elastic program
(KENLAYER; Huang 1993). The critical location for the calculated shear was found at
the edge of the loading area (300mm in diameter in this case). More details about this
program are presented in Chapter 4. Table 3-3 illustrates the calculated stress intensity
factor along with the governing straining actions in the vicinity of the crack tip for Case
B (see Table 3-2). To quantify the significance of each mode of loading, use is made of
Equations (3.7) and (3.10) as follows:
• For the centered loading case, the crack tip is only subjected to an opening mode
loading configuration. Therefore, the calculated J-integral is only associated with the
opening mode (KI). Using Equation (3.7), the geometric functionality [ )wa(f , or f1] for
the considered crack configuration may be calculated.

61
0.0
50.0
100.0
150.0
200.0
250.0
0 100 200 300 400 500Radial Distance (mm)
Shea
r Stre
ss (k
Pa)
Edge of the load
Figure 3-14. Variation of the Shear Stress with the Distance from the Load
• For the edge loading case, the crack tip is subjected to a mixed mode of loading.
In this case, the J-integral is related to the stress intensity factor as follows:
])f()f[(E
)1(J 22
21
2
τ+σν−
= (3.11)
where
f1 and f2 = geometric functionality for Mode I and II, respectively; and
σ and τ = tensile and shear stress at the vicinity of the crack tip (shown in Table 3-3).
It should be noticed that f1 is already known from the centered loading case (the
geometric functionality is only dependent on the crack configuration for each mode of
loading). Therefore, Equation (3.11) may be used to calculate (f2). The corresponding
stress intensity factors (KI and KII) for the edge loading case may then be calculated.
Table 3.3 illustrates the results of this analysis.

62
Table 3-3. Calculated Stress Intensity Factors
Load
Location
J
(kN/m) K (kPa.m0.5)
Tensile
Stress
(kPa)
Shear
Stress
(kPa)
KI
(kPa.m0.5)
KII
(kPa.m0.5)
Edge Load 0.0164 278.0 1384.1 445.9 217.1 173.5
Centered Load 0.0134 251.8 1605.1 ≅ 0 251.8 ----*
* Assuming 013 ≈τ
As shown in Table 3.3, both modes of loading significantly depend on the position of the
load. For the original position of the crack (crack initiation in the overlay), both the
opening and shearing mode control the propagation of the crack in the overlay. It is also
clear that the edge load position causes the critical shear stress as well as the majority of
the tensile stress. These results agree with previous findings by Uzan (1997) and De
Bondt (1998), who studied the crack propagation phenomenon in HMA. According to
Uzan, both Modes I and II contribute to the crack propagation in HMA. Although KI at
the original position of the crack is significantly higher than KII, Uzan found that KI
becomes negative when the crack reaches about 31 to
21 of the overlay thickness, and KII
increases as the crack propagates. This suggests that Mode I loading may not propagate
the crack to the surface, and only Mode II loading would propagate the crack to the
surface. Within the contest of this study and based on these results, it is important to
consider both the shear stress (Mode II) and the tensile stress (Mode I) at the vicinity of
the crack tip as both contribute to the propagation of the crack into the overlay.
3.6.3 Crack Initiation
As presented in the previous section, both modes of loading (Mode I and II) are
significant in the reflective cracking process, and therefore, evaluation of the
geocomposite membrane effectiveness should be based on the criticality of the stress
field associated with both modes of loading. In addition, the effects of the bonding
between the overlay and the existing pavement were investigated.

63
3.6.3.1 Mode I Loading (Centered Load)
The presented analysis in this section as well as the following section assumed fully-
bonded conditions between the overlay and the existing HMA layer. The effect of
friction between the two layers is discussed in a separate section. The presence of a crack
in the pavement system was found to substantially affect the stress field in the vicinity of
the crack tip. Severe straining actions developed around the crack tip as compared to the
rest of the pavement structure. This indicates that the resistance of the overlay to crack
reflection through Mode I loading is different than its resistance to regular distresses such
as fatigue cracking (fatigue cracking are usually related to the tensile strain at the bottom
of the HMA layer).
Results of this analysis also showed that the use of a soft interlayer significantly
affects the stress field in the vicinity of the crack tip (see Figure 3-15). Several
interesting observations may be drawn from this figure:
• The geocomposite membrane completely isolates the severe straining actions
developing around the crack tip from the overlay. In contrast, the regular pavement
structure does not benefit from this advantage by spreading the severity of the straining
actions around the crack tip through the bottom of the overlay.
(a) with geocomposite membrane (b) without geocomposite membrane
Figure 3-15. Horizontal Stress Distribution in the Vicinity of the Crack Tip (a) with
Geocomposite Membrane and (b) without Geocomposite Membrane

64
• The cracked area is under compression (closure of the crack) when the
geocomposite membrane is used. In contrast, high tensile stress develops around the
crack tip in the regular pavement structure. This will accelerate the propagation of the
crack into the overlay through Mode I loading. Figure 3-16(a) shows the horizontal
stress in the vicinity of the crack tip. This figure validates the effectiveness of a strain
energy absorber layer in creating a compressive horizontal field around the crack tip.
Figure 3-16(b) illustrates the calculated tensile strain at the bottom of the overlay with
and without geocomposite membrane. As discussed in the upcoming section, the use of a
soft interlayer causes an increase in pavement deflections, which is accompanied by
larger tensile strain at the bottom of the overlay. This requires a sufficient overlay
thickness to avoid premature failure of the pavement through a fatigue-related
mechanism.
-1000
-500
0
500
1000
1500
50.8 76.2 101.6
Overlay Thickness (mm)
Hor
izon
tal S
tress
(kPa
)
w/o geocompositew geocomposite
(a)

65
500
520
540
560
580
600
620
640
660
680
50.8 76.2 101.6Overlay Thickness (mm)
Hor
izon
tal S
train
( µst
rain
)w/o geocompositew geocomposite
(b)
Figure 3-16. Horizontal Stress in the Vicinity of the Crack Tip and Horizontal
Tensile Strain at the Bottom of the Overlay
3.6.3.2 Mode II Loading (Edge Load)
Similar to the Mode I loading, the presence of a crack was found to dramatically increase
the shear stress at the vicinity of the crack tip as compared to the uncracked pavement.
This emphasizes the importance of Mode II loading in dictating the resistance of the
overlay to reflection crack. Figure 3-17 illustrates the shear stress distributions with and
without geocomposite for an overlay thickness of 101.6mm. As shown in this figure, the
geocomposite membrane still clearly isolates the severity of the stress field observed in
the vicinity of the cracked area from the bottom of the overlay. This was not observed in
the pavement without the geocomposite membrane, which spreads through the bottom of
the overlay. It is also interesting to notice that the maximum shear stress in both cases is
apparently equal (see the legends in Figure 3-17); however, the location of the maxima is
slightly different.
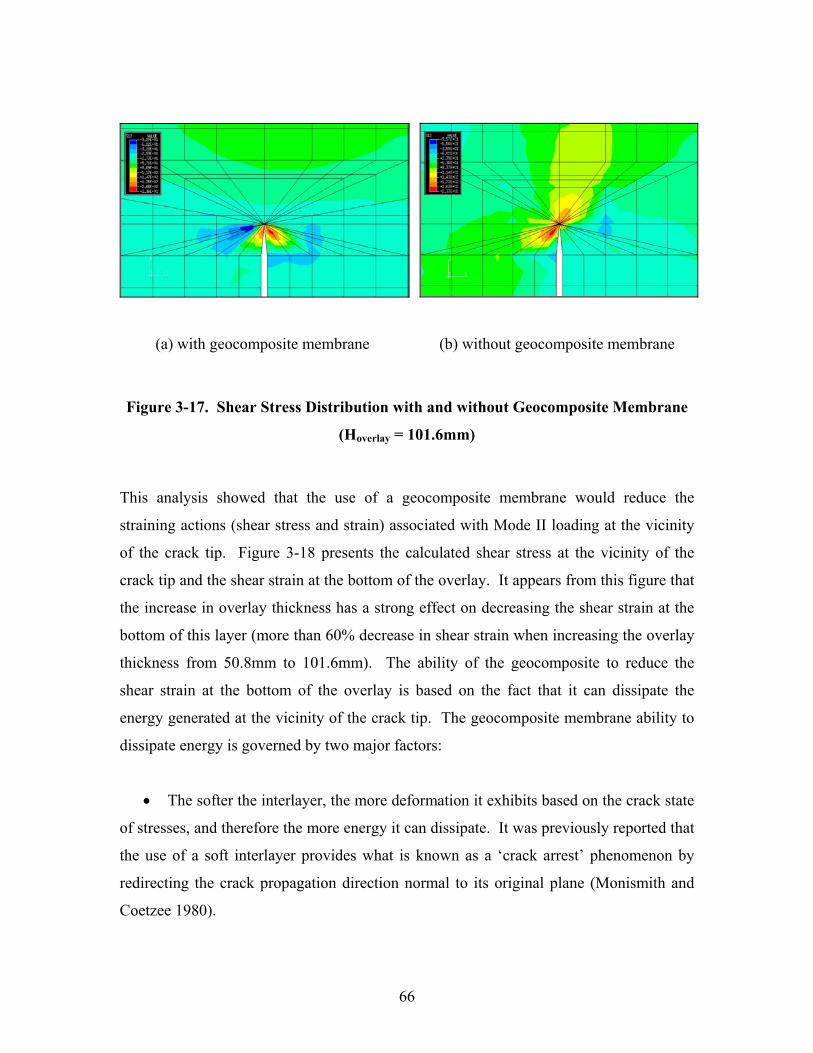
66
(a) with geocomposite membrane (b) without geocomposite membrane
Figure 3-17. Shear Stress Distribution with and without Geocomposite Membrane
(Hoverlay = 101.6mm)
This analysis showed that the use of a geocomposite membrane would reduce the
straining actions (shear stress and strain) associated with Mode II loading at the vicinity
of the crack tip. Figure 3-18 presents the calculated shear stress at the vicinity of the
crack tip and the shear strain at the bottom of the overlay. It appears from this figure that
the increase in overlay thickness has a strong effect on decreasing the shear strain at the
bottom of this layer (more than 60% decrease in shear strain when increasing the overlay
thickness from 50.8mm to 101.6mm). The ability of the geocomposite to reduce the
shear strain at the bottom of the overlay is based on the fact that it can dissipate the
energy generated at the vicinity of the crack tip. The geocomposite membrane ability to
dissipate energy is governed by two major factors:
• The softer the interlayer, the more deformation it exhibits based on the crack state
of stresses, and therefore the more energy it can dissipate. It was previously reported that
the use of a soft interlayer provides what is known as a ‘crack arrest’ phenomenon by
redirecting the crack propagation direction normal to its original plane (Monismith and
Coetzee 1980).
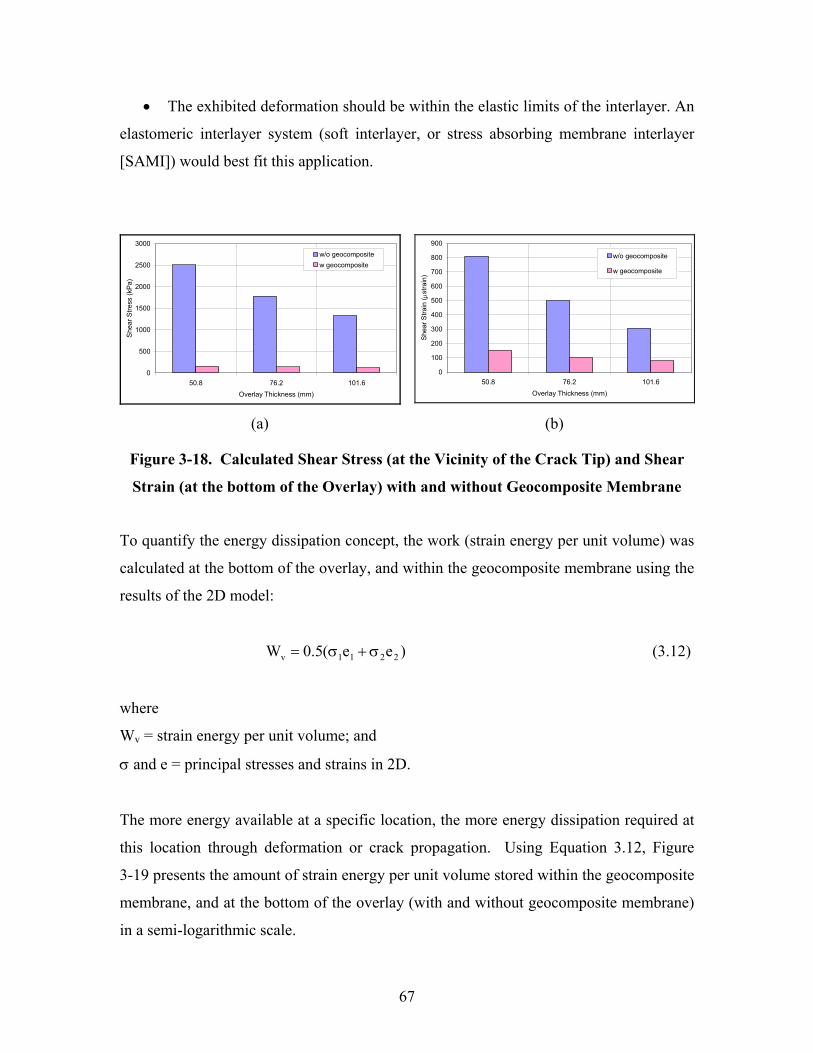
67
• The exhibited deformation should be within the elastic limits of the interlayer. An
elastomeric interlayer system (soft interlayer, or stress absorbing membrane interlayer
[SAMI]) would best fit this application.
0
500
1000
1500
2000
2500
3000
50.8 76.2 101.6Overlay Thickness (mm)
Shea
r Stre
ss (k
Pa)
w/o geocompositew geocomposite
0
100
200
300
400
500
600
700
800
900
50.8 76.2 101.6Overlay Thickness (mm)
Shea
r Stra
in ( µ
stra
in)
w/o geocomposite
w geocomposite
(a) (b)
Figure 3-18. Calculated Shear Stress (at the Vicinity of the Crack Tip) and Shear
Strain (at the bottom of the Overlay) with and without Geocomposite Membrane
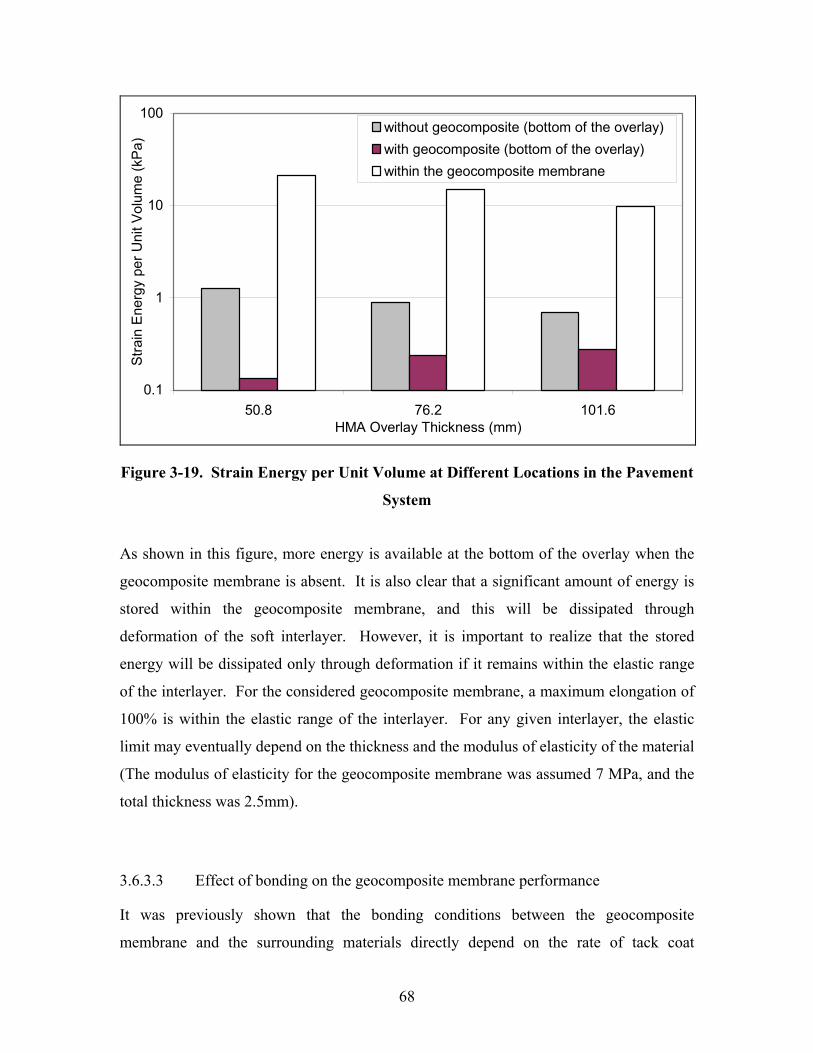
To quantify the energy dissipation concept, the work (strain energy per unit volume) was
calculated at the bottom of the overlay, and within the geocomposite membrane using the
results of the 2D model:
)ee(5.0W 2211v σ+σ= (3.12)
where
Wv = strain energy per unit volume; and
σ and e = principal stresses and strains in 2D.
The more energy available at a specific location, the more energy dissipation required at
this location through deformation or crack propagation. Using Equation 3.12, Figure
3-19 presents the amount of strain energy per unit volume stored within the geocomposite
membrane, and at the bottom of the overlay (with and without geocomposite membrane)
in a semi-logarithmic scale.
68
0.1
1
10
100
50.8 76.2 101.6HMA Overlay Thickness (mm)
Stra
in E
nerg
y pe
r Uni
t Vol
ume
(kPa
)without geocomposite (bottom of the overlay)with geocomposite (bottom of the overlay)within the geocomposite membrane
Figure 3-19. Strain Energy per Unit Volume at Different Locations in the Pavement
System
As shown in this figure, more energy is available at the bottom of the overlay when the
geocomposite membrane is absent. It is also clear that a significant amount of energy is
stored within the geocomposite membrane, and this will be dissipated through
deformation of the soft interlayer. However, it is important to realize that the stored
energy will be dissipated only through deformation if it remains within the elastic range
of the interlayer. For the considered geocomposite membrane, a maximum elongation of
100% is within the elastic range of the interlayer. For any given interlayer, the elastic
limit may eventually depend on the thickness and the modulus of elasticity of the material
(The modulus of elasticity for the geocomposite membrane was assumed 7 MPa, and the
total thickness was 2.5mm).
3.6.3.3 Effect of bonding on the geocomposite membrane performance
It was previously shown that the bonding conditions between the geocomposite
membrane and the surrounding materials directly depend on the rate of tack coat
69
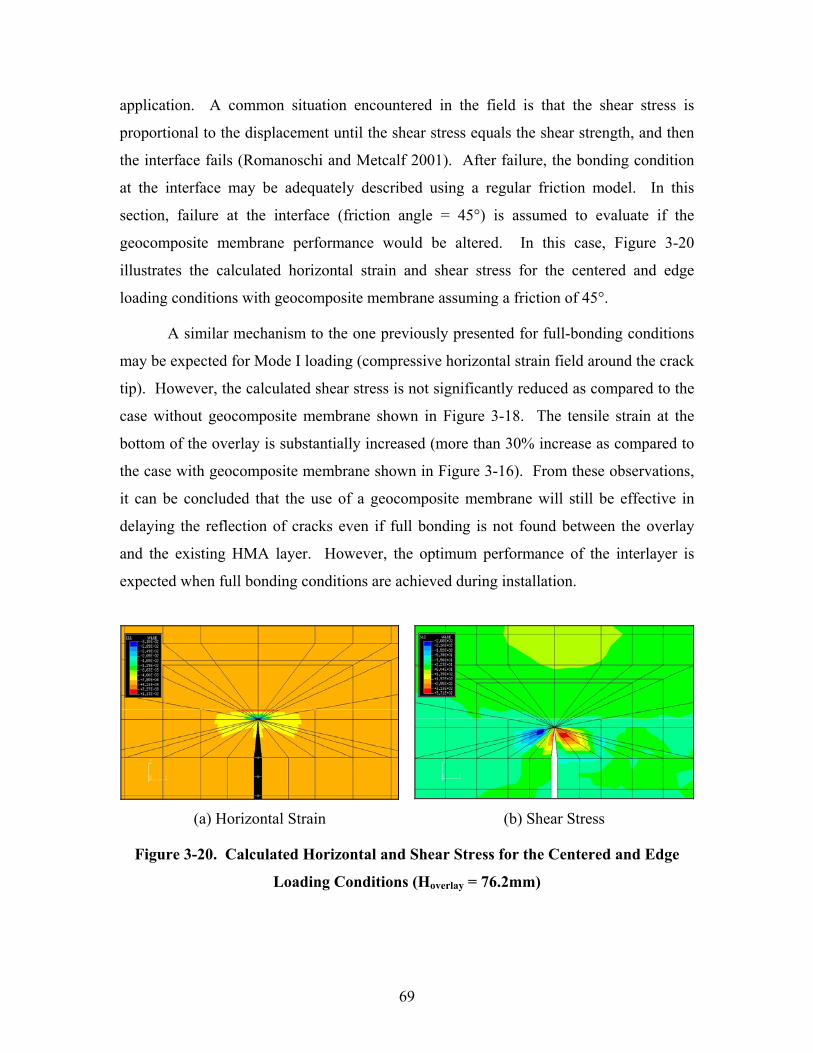
application. A common situation encountered in the field is that the shear stress is
proportional to the displacement until the shear stress equals the shear strength, and then
the interface fails (Romanoschi and Metcalf 2001). After failure, the bonding condition
at the interface may be adequately described using a regular friction model. In this
section, failure at the interface (friction angle = 45°) is assumed to evaluate if the
geocomposite membrane performance would be altered. In this case, Figure 3-20
illustrates the calculated horizontal strain and shear stress for the centered and edge
loading conditions with geocomposite membrane assuming a friction of 45°.
A similar mechanism to the one previously presented for full-bonding conditions
may be expected for Mode I loading (compressive horizontal strain field around the crack
tip). However, the calculated shear stress is not significantly reduced as compared to the
case without geocomposite membrane shown in Figure 3-18. The tensile strain at the
bottom of the overlay is substantially increased (more than 30% increase as compared to
the case with geocomposite membrane shown in Figure 3-16). From these observations,
it can be concluded that the use of a geocomposite membrane will still be effective in
delaying the reflection of cracks even if full bonding is not found between the overlay
and the existing HMA layer. However, the optimum performance of the interlayer is
expected when full bonding conditions are achieved during installation.
(a) Horizontal Strain (b) Shear Stress
Figure 3-20. Calculated Horizontal and Shear Stress for the Centered and Edge
Loading Conditions (Hoverlay = 76.2mm)

70
3.6.4 Crack Propagation Phase
Crack propagation was investigated through the evaluation of the path independent J-
integral for different locations of the crack within the HMA overlay for Case B (see
Table 3-1). All the considered locations assumed that the crack passed through the
geocomposite membrane “vertically” and is propagating to the top. Figure 3-21 shows
the variation of the J-integral as the crack propagates vertically to the top. The pavement
with geocomposite membrane is more favorable to the propagation of the crack than the
pavement without geocomposite membrane after the crack passes through the interlayer
system. This is due to the fact that stiffness of the pavement with geocomposite
membrane is less than that of the pavement without geocomposite membrane. It should
be noted, however, that the plasticity zone around the crack tip, which was not considered
in this analysis, would slow the propagation of the crack computed using linear elastic
fracture mechanics (LEFM). The values shown in Figure 3-21 are, therefore, considered
higher than those expected in real pavements.
0
10
20
30
40
50
60
12.7 25.4 38.1Crack Tip Location from the Bottom of the Overlay (mm)
J-In
tegr
al (N
/m)
without geocompositewith geocomposite
Figure 3-21. Variation of the J-Integral with the Crack Location with Respect to
the Bottom of the Overlay

71
Figure 3-22 illustrates the performance of the geocomposite membrane in delaying the
reflection of cracks when installed in a bridge deck in Italy (1997; Al-Qadi and Elseifi
2002). This core was extracted two years after placement of the overlay. As shown in
this figure, the crack did not propagate through the geocomposite membrane, but
completely stopped at the interlayer level. In addition, the calculated straining actions in
the vicinity of the crack tip are very small when the geocomposite membrane is used.
Hence, the crack propagation mechanism may not mobilize enough energy to be effective
to propagate a crack through the interlayer system. However, if the soft interlayer is not
installed properly or if it is heat sensitive, the effectiveness of the interlayer would be
altered directly after its installation.
Figure 3-22. Performance of the Geocomposite Membrane in Delaying the
Reflection of Cracks in a Bridge Deck in Italy
Due to traffic and thermal loading, an existing crack moves horizontally (due to the
Poisson’s effect and horizontal loading) and vertically (due to shear loading). The
resultant strain energy is dissipated as deformation within the interlayer (see Figure 3-
19). Hence, the crack will probably stop at this level, and the only damage that may
occur is debonding between the geocomposite membrane and the existing pavement. As
72
suggested in previous work by Lytton (1989), the crack may re-initiate at the bottom of
the overlay. For the presented cases, it is clear that the geocomposite membrane
minimizes the potential of an existing crack to reflect in an HMA overlay given that it has
the appropriate thickness and properties. However, other modes of failure (such as
fatigue of the overlay) should not be ignored or overlooked.
3.7 EXPERIMENTAL OBSERVATIONS AND INTERPRETATIONS
From the previous analysis, it is clear that the geocomposite membrane does not provide
any type of reinforcement to the pavement; on the contrary, the geocomposite membrane
makes the pavement more flexible, and therefore softer. It is expected that a pavement
with a soft interlayer would exhibit more vertical and horizontal deformations than a
similar pavement without the geocomposite membrane. This may indicate that the
pavement with a strain energy absorber layer will be less resistant to fatigue failure than
the pavement without strain energy absorber. This requires a sufficient well-designed
overlay thickness (function of the predicted traffic and the pavement conditions) on top
of the interlayer to avoid premature failure of the pavement through a fatigue-related
mechanism.
Falling weight deflectometer (see Chapter 4 for more details on the FWD theory
of operation) measurements at the Virginia Smart Road confirmed this hypothesis.
Figure 3-23 illustrates the measured deflection that was conducted during construction,
directly above and below the geocomposite membrane in section J. As shown in this
figure, the center deflection exhibits a very high jump due to the polymeric nature of the
geocomposite membrane. The same trend was observed after the end of the construction.
From the period between March 2000 and December 2001, FWD measurements were
regularly performed on a selected set of points in section K. Two points were located in
the area with the geocomposite membrane and three other points were located in the area
without the interlayer. Within the contest of this study, where the major interest is to
detect the variation in the upper HMA layers, use was made of the center deflection.

73
0
100
200
300
400
500
600
700
0 200 400 600 800 1000 1200 1400 1600Distance (mm)
Def
lect
ion
(mic
rons
)
Top of 21B
Top of Geocomposite
Figure 3-23. Measured and Vertical Deflections before and after the Installation of
the Geocomposite Membrane
Figure 3-24 illustrates the measured normalized deflections with and without
geocomposite membrane from the period between March 2000 and December 2001. As
noticed from this figure, the area with the geocomposite membrane always showed
greater deflection than the area without the geocomposite membrane. This indicates that
larger deflection should be anticipated and considered when the geocomposite membrane
is used.

74
0
50
100
150
200
250
3/8/2000 6/16/2000 9/24/2000 1/2/2001 4/12/2001 7/21/2001 10/29/2001 2/6/2002Date
Cen
tral D
efle
ctio
n (m
icro
ns)
with geocomposite
without geocomposite
Figure 3-24. Measured Center Deflection with and without Geocomposite
Membrane
3.8 FINDINGS AND CONCLUSIONS
This study shows that reflection of cracks in rehabilitated pavements is a complex
process involving a mixed mode of loading; identified in this study as a combination of
Mode I and Mode II loading. The overlay life against reflective cracking can be
described by the process of crack intrusion in the overlay (crack initiation), and crack
propagation (neglecting the ultimate failure stage). Based on the evaluation of the
effectiveness of a newly designed geocomposite membrane to delay the reflection of
cracks in pavement rehabilitation, the following conclusions are drawn based on field and
theoretical evaluations:
• When used in rehabilitation applications, a soft interlayer is able to dissipate most
of the available energy at the crack tip, and therefore minimizes the potential of an
75
existing crack to reflect into the overlay given that it has the appropriate thickness and
properties.
• A geocomposite membrane creates a protective shield around the crack tip,
separating the criticality of the stress field in the cracked area from the bottom of the
overlay. Moreover, a resultant compressive horizontal stress field helps closing the crack
rather than opening it.
• A strain energy absorber would only be effective in the crack propagation phase if
the crack does not pass through the interlayer, and propagates horizontally at the
interlayer-existing pavement interface. Therefore, the installation of this interlayer is
crucial in dictating its performance, since it mainly depends on preventing the crack from
passing through the interlayer. If damage or tearing of the interlayer occurs, the
contribution of the strain energy absorber membrane would be altered.
• When a strain-energy absorber layer is used, fatigue of the overlay should not be
neglected, and should be adequately controlled through the proper design and selection of
the overlay thickness.

76
3.9 REFERENCES
“ABAQUS, Finite Element Computer Program.” (1998). Version 5.8, Hibbitt, Karlsson
and Sorensen, Inc, MI.
Al-Balbissi, A., and Little, D. N. (1990). “Effect of fracture healing on laboratory-to-field
shift factor.” Transportation Research Record 1286, Transportation Research Board,
Washington, D.C., 173-183.
Al-Qadi, I. L., Brandon, T.L., Valentine, R. J., Lacina, B. A., and Smith, T. E. (1994).
“Laboratory evaluation of geosynthetic-reinforced pavement sections.”
Transportation Research Record 1439, Transportation Research Board, Washington,
D.C., 25-31.
Al-Qadi, I. L., Nassar, M. N., Loulizi, A., Flintsch, G. W., and Freeman T. E. (1999).
“Flexible pavement instrumentation at the Virginia Smart Road.” Paper No. 00-1275
presented at the Transportation Research Board 79th Annual Meeting, Washington,
D.C.
Al-Qadi, I. L., and Elseifi, M. A. (2002). “Analytical modeling and field performance
testing of geocomposite membrane in flexible pavement systems.” Proc., 7th
International Conference on Geosynthetics, Nice, France, 907-912.
Andruet, R. H. (1998). “Special 2-D and 3-D geometrically nonlinear finite elements for
analysis of adhesively bonded joints.” PhD Thesis, Dept. of Engineering Science and
Mechanics, Virginia Tech, Blacksburg, Va.
Barksdale, R. D., Brown, S. F., and Chan, F. (1989). “Potential benefits of geosynthetics
in flexible pavements.” NCHRP Report 315, Transportation Research Board,
Washington, D.C.

77
Bayomy, F. M., Al-Kandari, F. A., and Smith, R. (1996). “Mechanically based flexible
overlay design system for Idaho.” Transportation Research Record 1543,
Transportation Research Board, Washington, D.C., 10-19.
Belgian Road Research Center (BRCC). (1998). “The design of flexible road pavements
with Bitufor under traffic loading.” Report EP 5035/3744, Brussels, Belgium.
De Bondt, A. H. (1998). “Anti-reflective cracking design of (reinforced) asphalt
overlays.” PhD Thesis, Dept. of Civil Engineering, Delft Univ. of Technology, Delft,
The Netherlands.
Donovan, E. P. (1999). “Optimization of tack coat application rate for a geocomposite
membrane used on bridge decks.” MS Thesis, Dept. of Environmental and Civil
Engineering, Virginia Tech, Blacksburg, Va.
Dowling, N. E. (1993). Mechanical behavior of materials, Prentice-Hall, NJ.
Erkens, S. M. J. G., Groenendijk, J., Moraal, J., Molenaar, A. A. A., and Jacobs, M. M. J.
(1997). “Using Paris’ Law to determine fatigue characteristics – A discussion.” Proc.,
Eight International Conference on Asphalt Pavements, Seattle, Washington, 1123-
1140.
Francken, L. (1993). “Laboratory simulation and modeling of overlay systems.” Proc.,
2nd International RILEM Conference – Reflective Cracking in Pavements, E & FN
Spon, Liege, Belgium, 75-99.
Gdoutos, E. E. (1993). Fracture mechanics – an introduction, Kluwer Academic
Publishers, The Netherlands.

78
Graf, B., and G. Werner. (1993). “Design of asphalt overlay – fabric system against
reflective cracking.” Proc., 2nd International RILEM Conference – Reflective
Cracking in Pavements, E & FN Spon, Liege, Belgium, 159-168.
Hertzberg, R. W. (1973). Deformation and fracture mechanics of engineering materials,
John Wiley & Sons, Inc., New York, NY.
Huang, Y. H. (1993). Pavement analysis and design, 1st ed., Prentice Hall, NJ.
Jacobs, M. M. J., De Bondt, A. H., Molenaar, A. A. A., Hopman, P. C. (1992). “Cracking
in asphalt concrete pavements.” Proc., 7th International Conference on Asphalt
Pavements, International Society for Asphalt Pavements, Nottingham University,
U.K., 89-105.
Jacobs, M. M. J., Hopman, P. C., and Molenaar, A. A. A. (1996). “Application of fracture
mechanics principles to analyze cracking in asphalt concrete.” Proc., Annual Meeting
of the Association of Asphalt Paving Technologists, Vol. 65, Baltimore, MD, 1-39.
Kanninen, M. F., and Popelar, C. H. (1985). Advanced fracture mechanics, Oxford
University Press, Inc., New York, NY.
Kennepohl, G., Kamel, N., Walls, J., and Hass, R. C. (1985). “Geogrid reinforcement of
flexible pavements design basis and field trials.” Proc., Annual Meeting of the
Association of Asphalt Paving Technologists, Vol. 54, San Antonio, TX, 45-75.
Kim, Y. R., and Lee, Y. C. (1995). “Interrelationships among stiffness of asphalt
aggregate mixtures.” Proc., Annual Meeting of the Association of Asphalt Paving
Technologists, Vol. 64, Portland, OR, 575-610.

79
Loulizi, A., Al-Qadi, I. L., Bhutta, S. A., and Flintsch, G. W. (1999). “Evaluation of
geosynthetics used as separators.” Transportation Research Record 1687,
Transportation Research Board, Washington, D.C., 104-111.
Lytton, R. L. (1989). “Use of geotextiles for reinforcement and strain relief in asphalt
concrete.” Geotextiles and Geomembranes, Vol. 8, 217-237.
Lytton, R. L., Uzan, J., Fernando, E. G., Roque, R., Hiltumen, D., and Stoffels, S. M.
(1993). “Development and validation of performance prediction models and
specifications for asphalt binders and paving mixes.” SHRP A-357, Transportation
Research Board, Washington, D.C.
Majidzadeh, K., Ramsamooj, D. V., and Fletcher, T. A. (1969). “Analysis of fatigue of
sand-asphalt mixtures.” Proc., Annual Meeting of the Association of Asphalt Paving
Technologists, Vol. 30, Baltimore, MD, 1-39.
Mobasher, B., Mamlouk, M. S., and Lin, H-M. (1997). “Evaluation of crack propagation
properties of asphalt mixtures.” Journal of Transportation Engineering, Vol. 123, No.
5, 405-413.
Monismith, C. L., and Coetzee, N. F. (1980). “Reflection cracking: analysis, laboratory
studies and design considerations.” Proc., Annual Meeting of the Association of
Asphalt Paving Technologists, Vol. 49, Louisville, KY, 268-313.
Owusu-Antwi, E. B., Khazanovich, L, and Titus-Glover, L. (1998). “A mechanistic-
based model for predicting reflective cracking in AC overlaid pavements.”
Transportation Research Record 1629, Transportation Research Board, D.C., 234-
241.
Paris, P. C. and Erdogan, F. A. (1963). “Critical analysis of crack propagation laws.”
Transactions of the ASME, Journal of Basic Engineering, Series D, No. 3,528-533.

80
Pierce, L. M., Jackson, N. C., and Mahoney, J. P. (1993). “Development and
implementation of a mechanistic, empirically-based overlay design procedure for
flexible pavements.” Transportation Research Record 1388, Transportation Research
Board, Washington, D.C., 120-129
Read, J. M. (2000). “New method for measuring crack propagation in asphalts.”
International Journal of Pavement Engineering, Vol. I, No. 1, 15-34.
Rice, J. R. (1968). “Mathematical analysis in the mechanics of fracture.” Fracture-An
Advanced Treatise, Vol. II, Academic, New York, 191-308.
Roberts, F.L., Kandhal, P.S., Brown, E.R., Lee, D. and Kennedy, T.W. (1991). “Hot mix
asphalt materials, mixture design, and construction.” 1st ed., Napa Education
Foundation, Lanham, MD.
Romanoschi, S. A., and Metcalf, J. B. (2001). “Characterization of asphalt concrete layer
interfaces.” Transportation Research Record 1778, Transportation Research Board,
D.C., 132-139.
Schapery, R. A. (1982). “Models for damage growth and fracture in nonlinear
viscoelastic particulate composites.” Proc., 9th US Congress of Applied Mechanics,
American Society of Mechanical Engineers, Book No. H00228.
Suits, L. D., and Koerner, G. (2001). “Site evaluation/performance of separation
geotextiles.” Proc., Geosynthetics Conference 2001, Portland, Oregon, 451-468.
Ullidtz, P. (1987). Pavement analysis, Elsevier Science, New York, NY.
Uzan, J. (1997). “Evaluation of fatigue cracking.” Transportation Research Record 1570,
Transportation Research Board, Washington, D.C., 89-95.

81
Vanelstraete, A., D. Leonard, and Veys, J. (2000). “Structural design of roads with steel
reinforcing nettings.” Proc., 4th International RILEM Conference – Reflective
Cracking in Pavements, E & FN Spon, Ontario, Canada, 56-67.